CHAPTER III RESEARCH METHOD A. Research Designeprints.walisongo.ac.id/6676/4/CHAPTER III.pdf ·...
17
35 CHAPTER III RESEARCH METHOD A. Research Design This research was conducted to identify the effectiveness of using TPS with realia to teach descriptive text writing. This research is a quantitative one. In this research, the researcher used experimental research. According to Sugiyono, an experimental research is a research method are used to search for a specific treatment effect against the other in uncontrolled conditions. Therefore, in experimental research there is a treatment and control group. 1 The essential feature of experimental research is that investigators deliberately control and manipulate the conditions which determine the events, in which they are interested, introduce an intervention and measure the difference that it makes. An experiment involves making a change in the value of one variable – called the independent variable – and observing the effect of that change on another variable –called the dependent variable. 2 1 Sugiyono, Metode Penelitian Kuantitatif, Kualitatif dan R&D, (Bandung: Alfa Beta 2006), p. 72 2 Louis Cohen, Lawrence Manion and Keith Morrison, Research Methods in Education, 6 th Edition, (New York: Routledge, 1994), p. 272.
Transcript of CHAPTER III RESEARCH METHOD A. Research Designeprints.walisongo.ac.id/6676/4/CHAPTER III.pdf ·...
35
CHAPTER III
RESEARCH METHOD
A. Research Design
This research was conducted to identify the effectiveness of
using TPS with realia to teach descriptive text writing. This
research is a quantitative one. In this research, the researcher used
experimental research. According to Sugiyono, an experimental
research is a research method are used to search for a specific
treatment effect against the other in uncontrolled conditions.
Therefore, in experimental research there is a treatment and
control group.1
The essential feature of experimental research is that
investigators deliberately control and manipulate the conditions
which determine the events, in which they are interested,
introduce an intervention and measure the difference that it
makes. An experiment involves making a change in the value of
one variable – called the independent variable – and observing
the effect of that change on another variable –called the
dependent variable.2
1 Sugiyono, Metode Penelitian Kuantitatif, Kualitatif dan R&D, (Bandung: Alfa
Beta 2006), p. 72 2Louis Cohen, Lawrence Manion and Keith Morrison, Research Methods in
Education, 6th Edition, (New York: Routledge, 1994), p. 272.
36
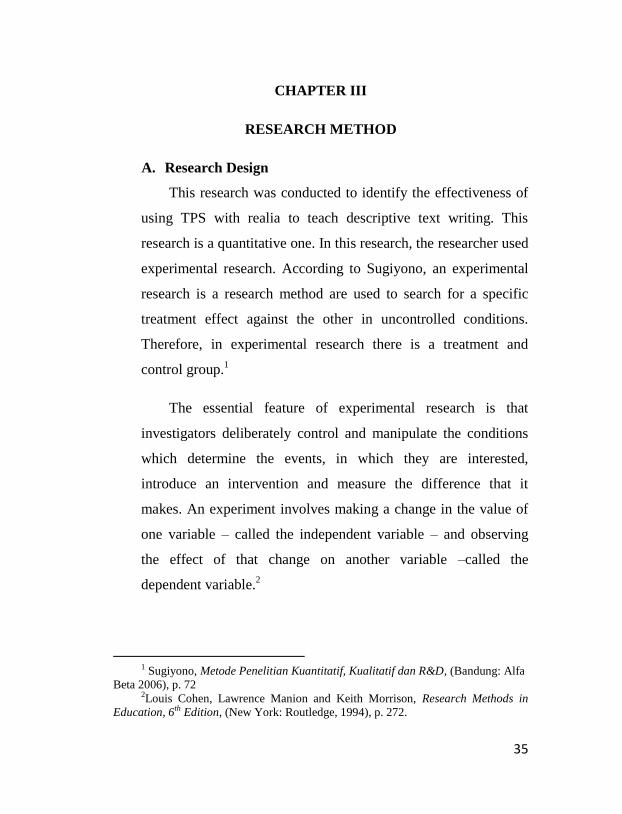
An experimental research involved two groups: experimental
group and control group. An experimental group will receive a
new treatment while control group receives a usual treatment.
This study used pre-test and post-test. The design of the
experiment could be described as follows:
Adopted from Arikunto3
Explanation:
E : Experiment group.
C : Control group.
Q1 &Q3 : Pre-test of experiment and control groups.
Q2 &Q4 : Post-test of experiment and control groups.
X : Treatment (Teaching descriptive writing by using TPS
with realia)
3 Suharsimi Arikunto, Prosedur penelitian Suatu Pendekatan Praktik, (Jakarta:
PT Rineka Cipta, 2006), p. 86
E O1 X Q2
C Q3 Y Q4
37
Y : Treatment (Teaching descriptive writing without using
TPS with realia)
B. Setting of the Research
1. Time of the research
This research was implemented on 25 October – 12
November 2016, counted since the proposal was
submitted until the end of research.
2. Place of the research
The writer did the research at SMP NU 03 Islam
Kaliwungu which is located in Jl. Ngaglik, Kutoharjo,
Kaliwungu Selatan, 51372.
C. Subject of the Research
1. Population and Sample
Population is a part of generalization which
consisting of subjects that have certain qualities and
characteristics defined by the researchers to be studied
and then drawn conclusions.4 The population in this
study was the eighth grade of SMP NU 03Islam
Kaliwungu in the academic year of 2015/2016. The
eighth grade of SMP NU 03 Kaliwungu was divided
into two classes. There were classes VIII A with the
number of students are 30, and VIII B with the number
4Sugiyono, Metode Penelitian Pendidikan: Pendekatan Kuantitatif, Kualitatif,
dan R&D,… , p. 117.
38
of students were 30. The total number of population was
60 students.
Due to the number of population in this study only
60 students, the researcher did not require samples.
Researchers used all of the population as an subject in
this study. So the participants of the study were class
VIII A as an experimental class and class VIII B as a
control class.
D. Variable and Indicator
There are two variable in this research, variable X and
variable Y.
1. Independent variable (variable X)
Independent variable is variable that influences or
becomes the cause of change or emergence the dependent
variable.5 The independent variable in this research was the
use of TPS with realia in the teaching writing descriptive
text.
2. Dependent variable (variable Y)
Dependent variable is variable that was affected or
that became the result because of the existence of the
5Sugiyono, Metode Penelitian Pendidikan: Pendekatan Kuantitatif, Kualitatif,
dan R&D, … ,p. 61
39
independent variable.6 Dependent variable in this study
was the student's achievement on descriptive writing which
was indicated by students' score. The indicators for
dependent variable are identifying the social function of
descriptive text, identifying the generic structure of
descriptive tex, identitying the language feature of
descriptive text, using simple present tense, and creating
simple functional descriptive text.
E. Data Collection Technique
1. Documentation
Documentation is used to look for the data
concerning matters or the variable that are taken in the
form of the note, transcript, book, newspaper, magazine,
inscription, notulen, legger, agenda, etc.7
The researcher used documentation to get the data
that related with object research such as the list of name
that included in the population, the documentation of
students' activities when followed in learning process in
the experimental research.
6Sugiyono, Metode Penelitian Pendidikan: Pendekatan Kuantitatif, Kualitatif,
dan R&D,… , p. 61. 7Suharsimi Arikunto, Dasar – Dasar Pendidikan, ... ,p. 158.
40
2. Test
Test is set of question or exercises and other tools
which are used to measured skill, intelligence,
knowledge, and ability those are had by individual or
group.8 The test in this study was an essay test or
subjective test. In essay test of writing, the students
were given a free chance to think as much as possible.
They can freely express and organize their ideas in
written form.
This method is used to get data about score of the
pre-test and post-test that was given for both groups.
a. Pre-test
Pre-test was given before the teacher
introduced TPS method with realia in writing
descriptive text. Pre-test was given to the
experimental and control class in same way. This
test was given before the experiment was run.
b. Post-test
Post-test was given to the experimental and
control class. The test was given to know student's
achievement after they studied descriptive text
writing through TPS method with realia
8Suharsimi Arikunto, Prosedur Penelitian Suatu Pendekatan Praktik, ... p. 10
41
(experimental class) and without TPS method with
realia (control class).
F. Data Analysis Technique
1. Technique of scoring test
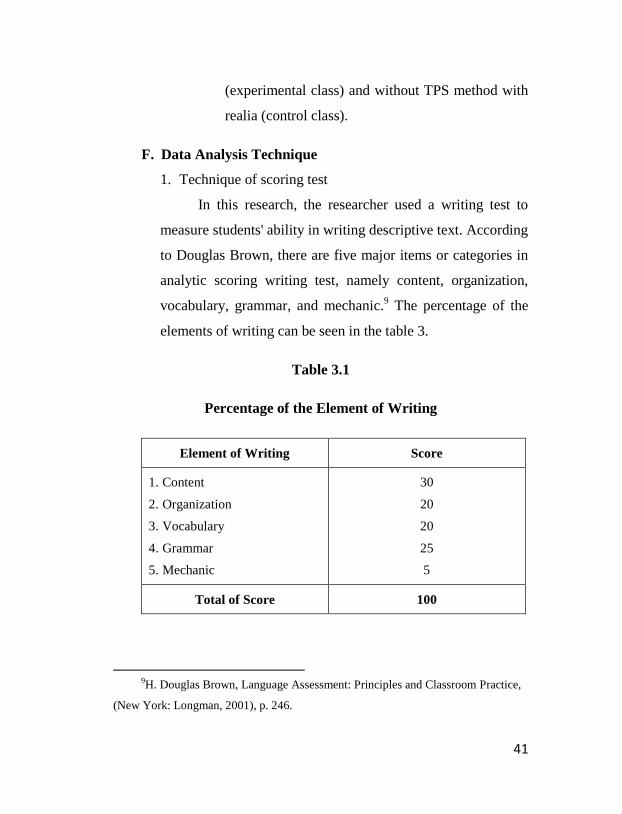
In this research, the researcher used a writing test to
measure students' ability in writing descriptive text. According
to Douglas Brown, there are five major items or categories in
analytic scoring writing test, namely content, organization,
vocabulary, grammar, and mechanic.9 The percentage of the
elements of writing can be seen in the table 3.
Table 3.1
Percentage of the Element of Writing
Element of Writing Score
1. Content
2. Organization
3. Vocabulary
4. Grammar
5. Mechanic
30
20
20
25
5
Total of Score 100
9H. Douglas Brown, Language Assessment: Principles and Classroom Practice,
(New York: Longman, 2001), p. 246.
42
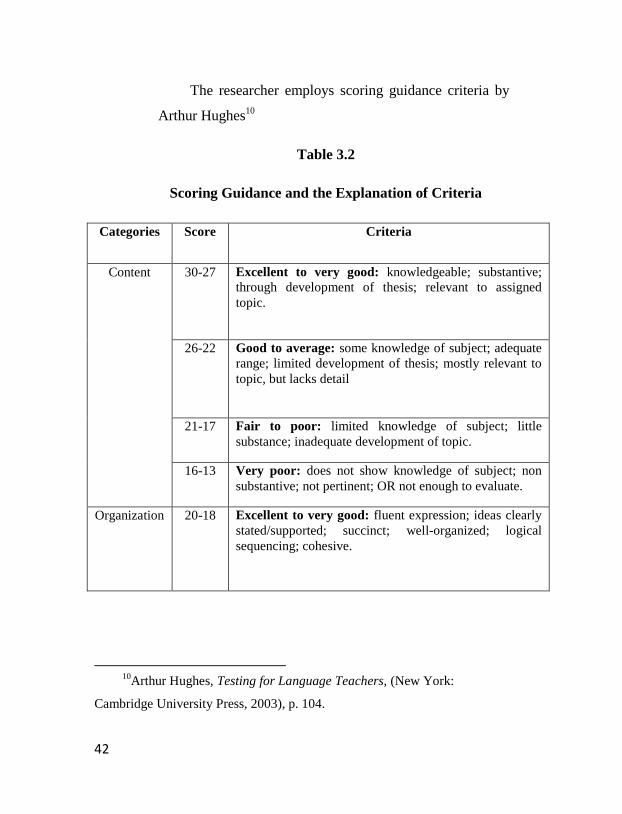
The researcher employs scoring guidance criteria by
Arthur Hughes10
Table 3.2
Scoring Guidance and the Explanation of Criteria
Categories Score Criteria
Content 30-27 Excellent to very good: knowledgeable; substantive;
through development of thesis; relevant to assigned
topic.
26-22 Good to average: some knowledge of subject; adequate
range; limited development of thesis; mostly relevant to
topic, but lacks detail
21-17 Fair to poor: limited knowledge of subject; little
substance; inadequate development of topic.
16-13 Very poor: does not show knowledge of subject; non
substantive; not pertinent; OR not enough to evaluate.
Organization 20-18 Excellent to very good: fluent expression; ideas clearly
stated/supported; succinct; well-organized; logical
sequencing; cohesive.
10
Arthur Hughes, Testing for Language Teachers, (New York:
Cambridge University Press, 2003), p. 104.
43
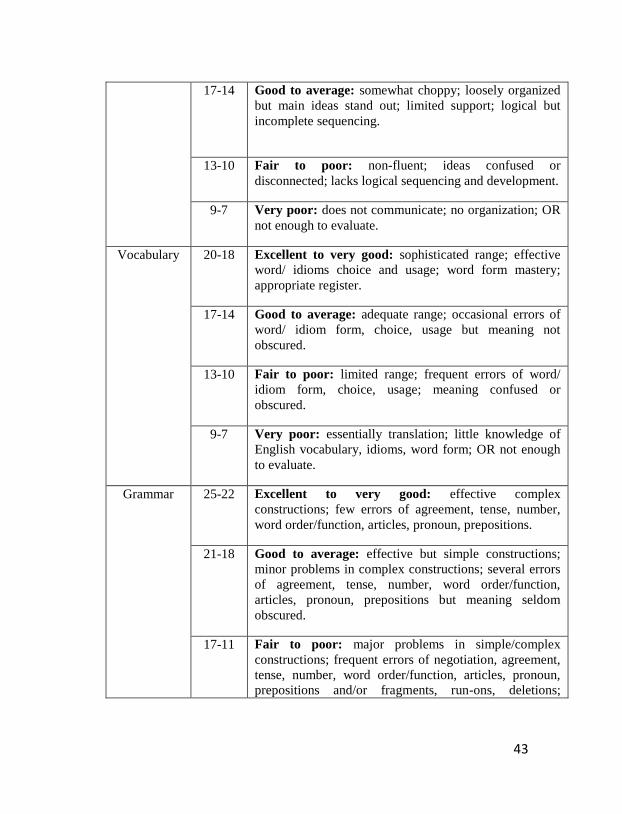
17-14 Good to average: somewhat choppy; loosely organized
but main ideas stand out; limited support; logical but
incomplete sequencing.
13-10 Fair to poor: non-fluent; ideas confused or
disconnected; lacks logical sequencing and development.
9-7 Very poor: does not communicate; no organization; OR
not enough to evaluate.
Vocabulary 20-18 Excellent to very good: sophisticated range; effective
word/ idioms choice and usage; word form mastery;
appropriate register.
17-14 Good to average: adequate range; occasional errors of
word/ idiom form, choice, usage but meaning not
obscured.
13-10 Fair to poor: limited range; frequent errors of word/
idiom form, choice, usage; meaning confused or
obscured.
9-7 Very poor: essentially translation; little knowledge of
English vocabulary, idioms, word form; OR not enough
to evaluate.
Grammar 25-22 Excellent to very good: effective complex
constructions; few errors of agreement, tense, number,
word order/function, articles, pronoun, prepositions.
21-18 Good to average: effective but simple constructions;
minor problems in complex constructions; several errors
of agreement, tense, number, word order/function,
articles, pronoun, prepositions but meaning seldom
obscured.
17-11 Fair to poor: major problems in simple/complex
constructions; frequent errors of negotiation, agreement,
tense, number, word order/function, articles, pronoun,
prepositions and/or fragments, run-ons, deletions;
44
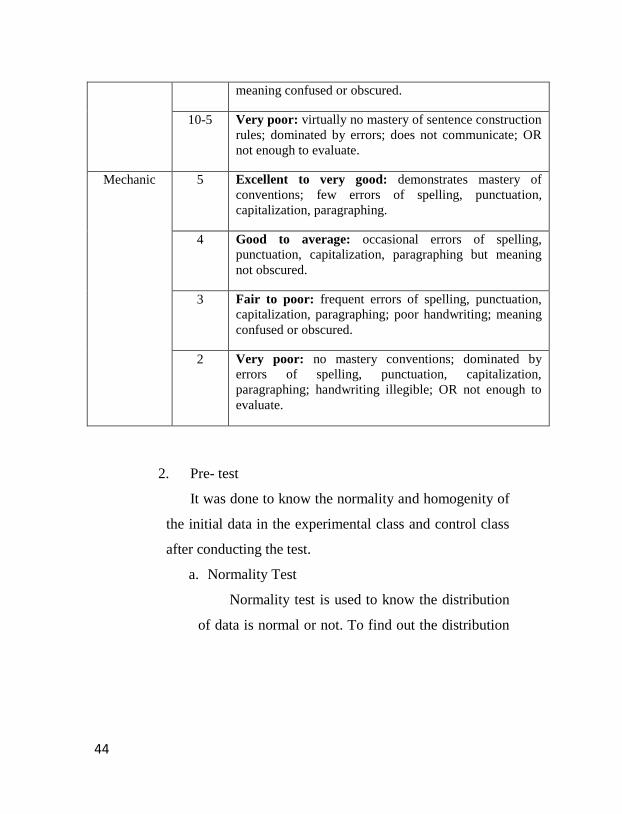
meaning confused or obscured.
10-5 Very poor: virtually no mastery of sentence construction
rules; dominated by errors; does not communicate; OR
not enough to evaluate.
Mechanic 5 Excellent to very good: demonstrates mastery of
conventions; few errors of spelling, punctuation,
capitalization, paragraphing.
4 Good to average: occasional errors of spelling,
punctuation, capitalization, paragraphing but meaning
not obscured.
3 Fair to poor: frequent errors of spelling, punctuation,
capitalization, paragraphing; poor handwriting; meaning
confused or obscured.
2 Very poor: no mastery conventions; dominated by
errors of spelling, punctuation, capitalization,
paragraphing; handwriting illegible; OR not enough to
evaluate.
2. Pre- test
It was done to know the normality and homogenity of
the initial data in the experimental class and control class
after conducting the test.
a. Normality Test
Normality test is used to know the distribution
of data is normal or not. To find out the distribution
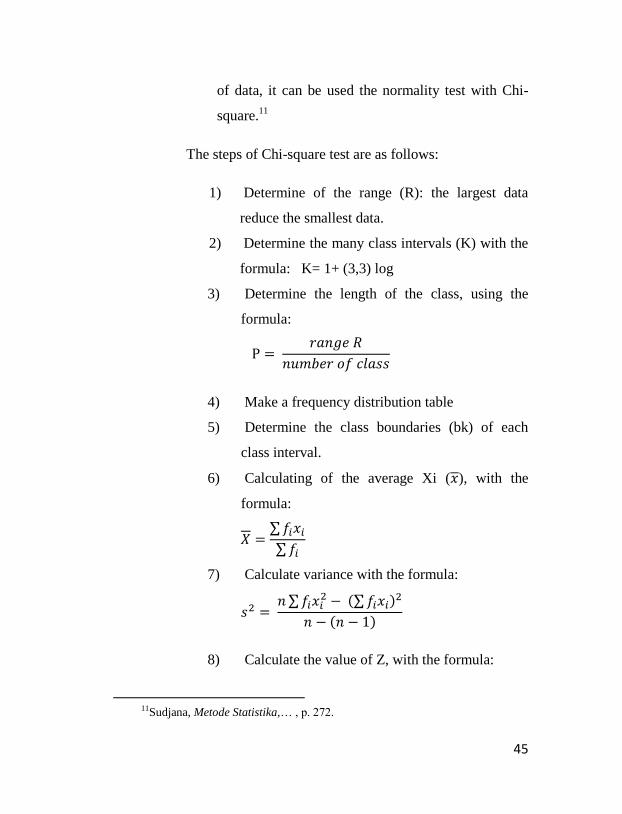
45
of data, it can be used the normality test with Chi-
square.11
The steps of Chi-square test are as follows:
1) Determine of the range (R): the largest data
reduce the smallest data.
2) Determine the many class intervals (K) with the
formula: K= 1+ (3,3) log
3) Determine the length of the class, using the
formula:
4) Make a frequency distribution table
5) Determine the class boundaries (bk) of each
class interval.
6) Calculating of the average Xi ( ), with the
formula:
∑ ∑
7) Calculate variance with the formula:
∑
(∑ )
( )
8) Calculate the value of Z, with the formula:
11Sudjana, Metode Statistika,… , p. 272.
46
= Limit class
= Average
S = standard deviation
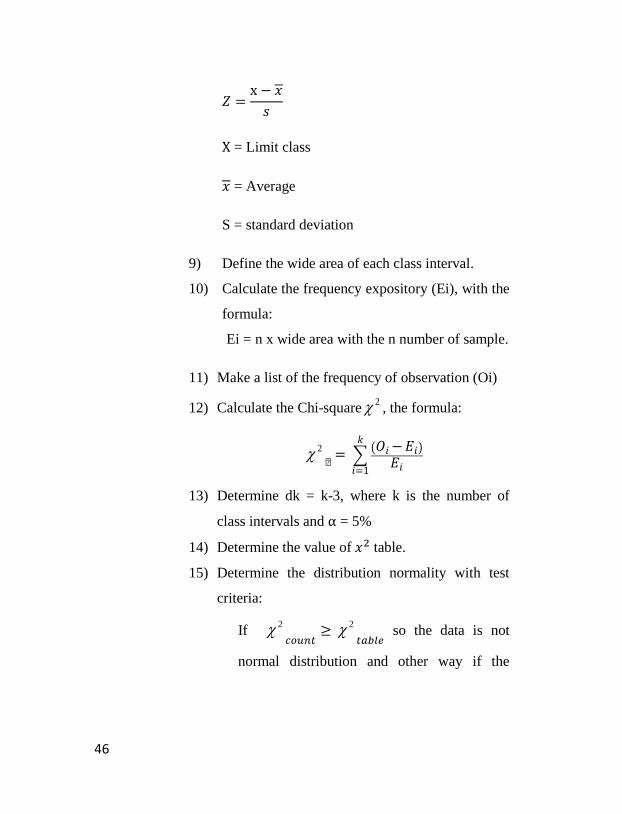
9) Define the wide area of each class interval.
10) Calculate the frequency expository (Ei), with the
formula:
Ei = n x wide area with the n number of sample.
11) Make a list of the frequency of observation (Oi)
12) Calculate the Chi-square2 , the formula:
2 ∑
( )
13) Determine dk = k-3, where k is the number of
class intervals and = 5%
14) Determine the value of table.
15) Determine the distribution normality with test
criteria:
If 2
2
so the data is not
normal distribution and other way if the
47
2
2
so the data is normal
distribution.
a. Homogeneity Test
Is used to know whether the experimental group
and control group are taken from population have
same variant or not.
The formula is:12
Where:
Vb : Bigger variant
Vk : Smaller variant
The hypotheses in homogeneity test are:
Ho : homogeny variance =
Ha : non homogeny variance =
If the calculation result of is lower than
12Sudjana, Metode Statistika,…, p. 250.
48
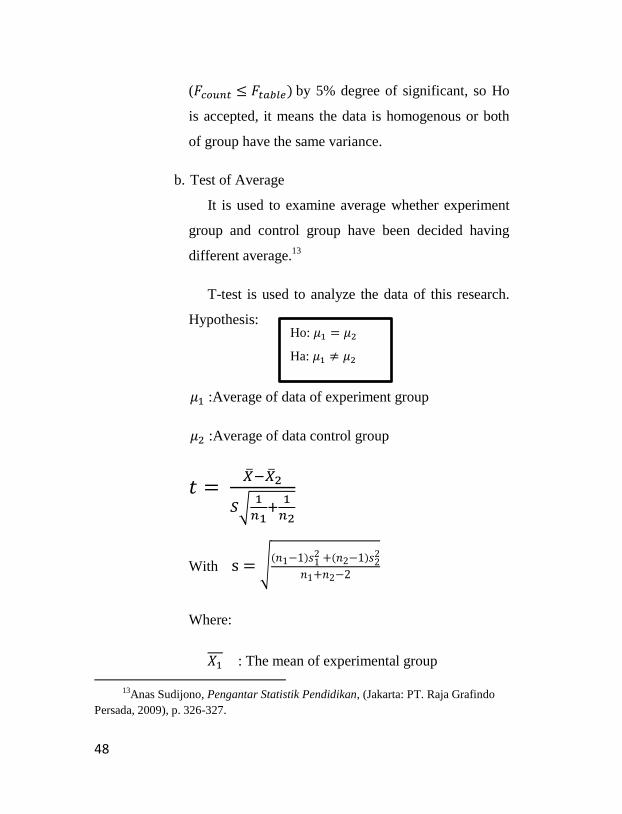
( ) by 5% degree of significant, so Ho
is accepted, it means the data is homogenous or both
of group have the same variance.
b. Test of Average
It is used to examine average whether experiment
group and control group have been decided having
different average.13
T-test is used to analyze the data of this research.
Hypothesis:
:Average of data of experiment group
:Average of data control group
√
With √( )
( )
Where:
: The mean of experimental group
13Anas Sudijono, Pengantar Statistik Pendidikan, (Jakarta: PT. Raja Grafindo
Persada, 2009), p. 326-327.
Ho: 𝜇 𝜇
Ha: 𝜇 𝜇
49
: The mean of control group
: Number of experiment group
: Number of control group
: variance of experiment group
: variance of control group
Ho is accepted if the
and there is significant difference of average
value from both groups.14
3. Post-test
Post-test was held after all treatments were
conducted. This test was used to measure student’s
achievements after they were given treatments. The
result of test was analyzed statistically by looking for
the mean and the percentage of the result. The aim is
to compare between the pre-test and post-test. Then,
the overall result is counted by using t-test formula in
order to know the significance of the research. To
examine the hypothesis that have been stated, these
following steps are used:
1) Normality Test
14Anas Sudijono, Pengantar Statistik Pendidikan, …, p. 272-273.
50
Steps normality second step is the same as the
normality test on the initial data.
2) Homogeneity Test
Steps homogeneity second step is the same as the
homogeneity test on the initial data.
3) Hypothesis Test
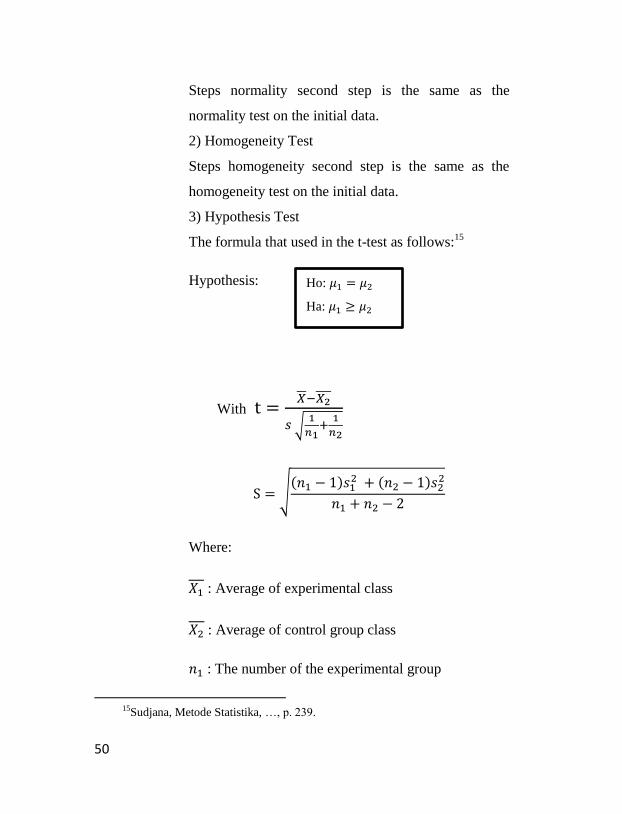
The formula that used in the t-test as follows:15
Hypothesis:
With
√
√( )
( )
Where:
: Average of experimental class
: Average of control group class
: The number of the experimental group
15Sudjana, Metode Statistika, …, p. 239.
Ho: 𝜇 𝜇
Ha: 𝜇 𝜇
51
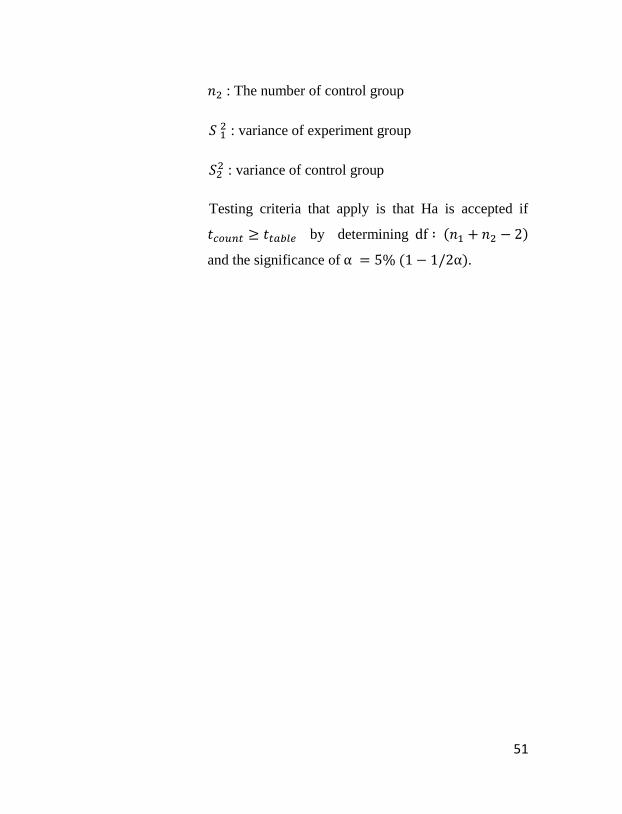
: The number of control group
: variance of experiment group
: variance of control group
Testing criteria that apply is that Ha is accepted if
by determining ( )
and the significance of ( ).


![JKE 316E – Quantitative Economics [Ekonomi Kuantitatif]](https://static.fdocuments.us/doc/165x107/627325941b5cc94fcb3feaff/jke-316e-quantitative-economics-ekonomi-kuantitatif.jpg)