Chapter 8 Economic Growth Copyright © 2015 McGraw-Hill Education. All rights reserved. No...
23
Chapter 8 Economic Growth Copyright © 2015 McGraw-Hill Education. All rights reserved. No reproduction or distribution without the prior written consent of McGraw-Hill Education.
-
Upload
oswald-black -
Category
Documents
-
view
215 -
download
0
Transcript of Chapter 8 Economic Growth Copyright © 2015 McGraw-Hill Education. All rights reserved. No...

Chapter 8
Economic Growth
Copyright © 2015 McGraw-Hill Education. All rights reserved. No reproduction or distribution without the prior written consent of McGraw-Hill Education.
8-2
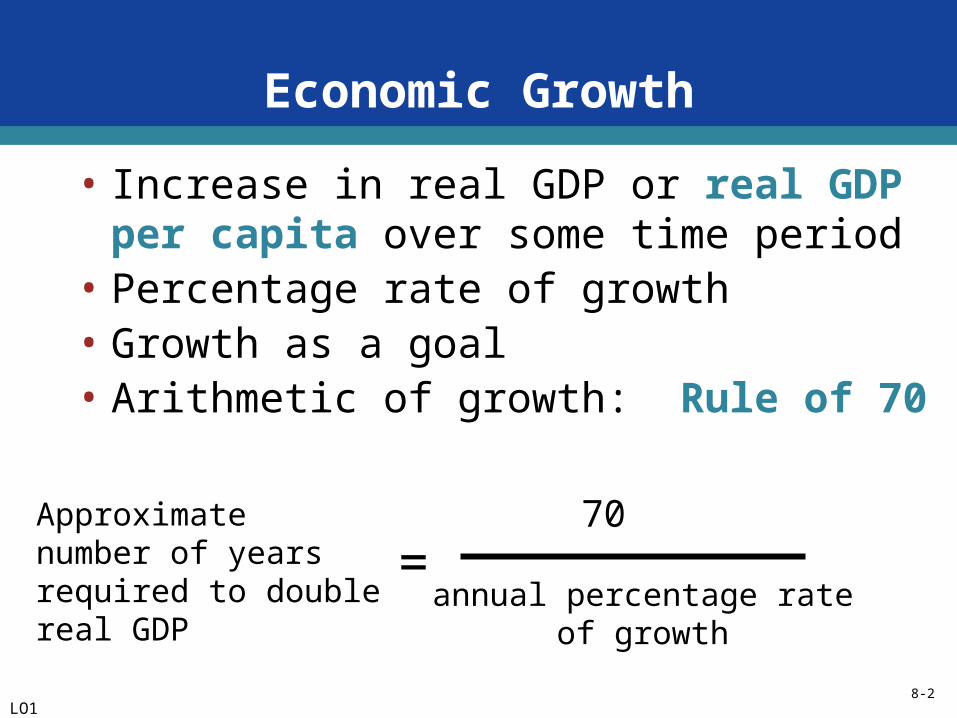
Economic Growth
• Increase in real GDP or real GDP per capita over some time period
• Percentage rate of growth• Growth as a goal• Arithmetic of growth: Rule of 70
Approximatenumber of yearsrequired to doublereal GDP
=70
annual percentage rateof growth
LO1

8-3
Economic Growth
• Growth in U.S. real GDP 1950-2012• Increased more than sixfold • 3.1% per year
• Growth in U.S. real GDP per capita• Increased more than 3 fold• At roughly 2% per year
• Qualifications • Improved products and services• Added leisure• Other impacts
LO1
8-4
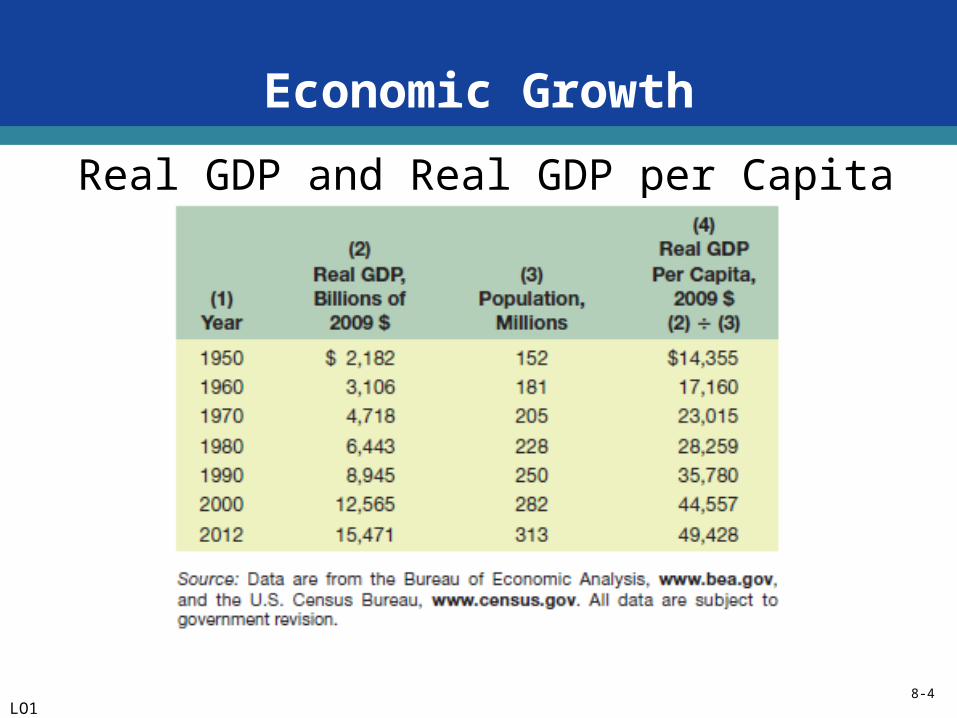
Economic Growth
Real GDP and Real GDP per Capita
LO1

8-5
Modern Economic Growth
• Began with the Industrial Revolution in late 1700s
• Ongoing increases in living standards• Time for leisure• Social change• Democracy• Human lifespan doubled
LO2
8-6
Modern Economic Growth
• Began in Britain• Has spread slowly• Starting date main cause of worldwide
differences in living standards• Catching up is possible• Leader countries invent technology• Follower countries adopt technology• Can grow faster
LO2
8-7
Modern Economic Growth
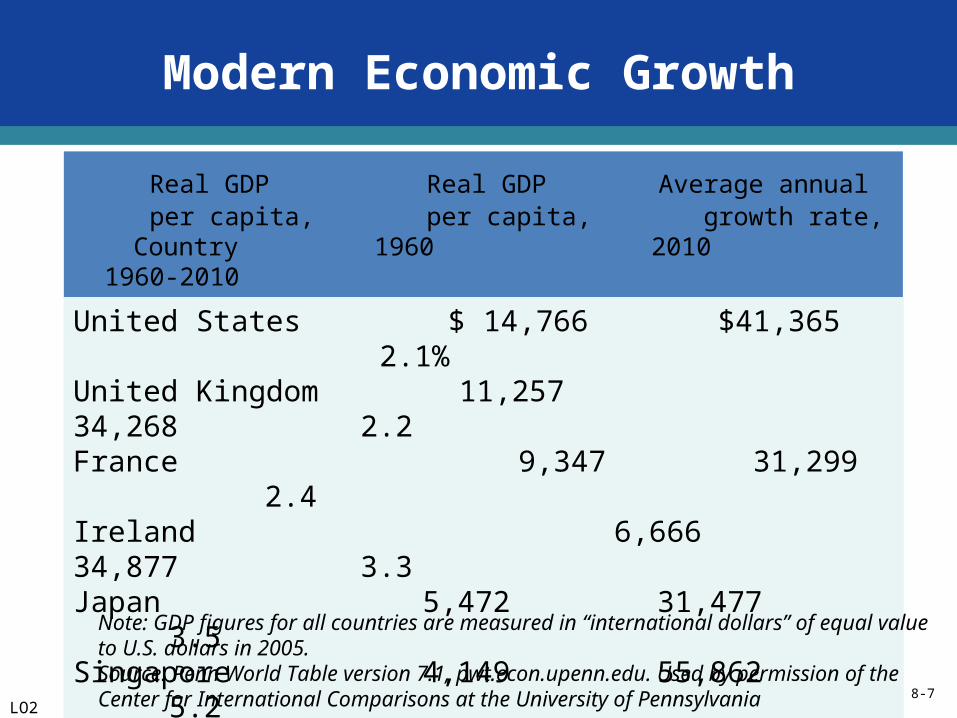
Real GDP Real GDP Average annual per capita, per capita, growth rate,
Country 1960 2010 1960-2010
United States $ 14,766 $41,365 2.1%United Kingdom 11,257 34,268 2.2France 9,347 31,299 2.4Ireland 6,666 34,877 3.3Japan 5,472 31,477 3.5Singapore 4,149 55,862 5.2Hong Kong 3,849 38,865 4.6South Korea 1,765 26,609 5.4
LO2
Note: GDP figures for all countries are measured in “international dollars” of equal value to U.S. dollars in 2005.Source: Penn World Table version 7.1, pwt.econ.upenn.edu. Used by permission of the Center for International Comparisons at the University of Pennsylvania

8-8
Modern Economic Growth
LO2
8-9
Institutional Structures of Growth
• Strong property rights• Patents and copyrights• Efficient financial institutions• Literacy and widespread education• Free trade• Competitive market system
LO2

8-10
Determinants of Growth
• Supply factors• Increases in quantity and quality of
natural resources • Increases in quality and quantity of
human resources• Increases in the supply (or stock) of
capital goods• Improvements in technology
LO3

8-11
Determinants of Growth
• Demand factor• Households, businesses, and government
must purchase the economy’s expanding output
• Efficiency factor• Must achieve economic efficiency and full
employment
LO3
8-12
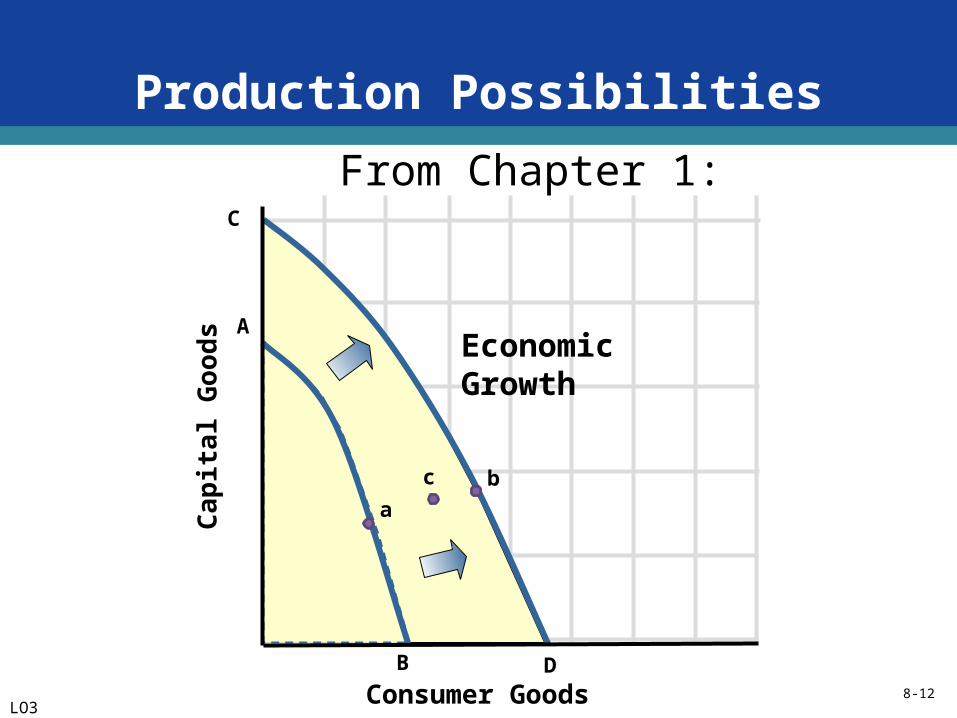
a
EconomicGrowth
b
D
LO3
B
A
C
Consumer Goods
Capi
tal G
oods
c
From Chapter 1:
Production Possibilities

8-13
Labor and Productivity
•Size of employed labor force
•Average hours of work
LaborInputs(hours ofwork)
•Technological advance
•Quantity of capital
•Education and training
•Allocative efficiency
•Other
LaborProductivity(average output per hour)
RealGDP
Real GDP = hours of work x labor productivity
x =
LO3
8-14
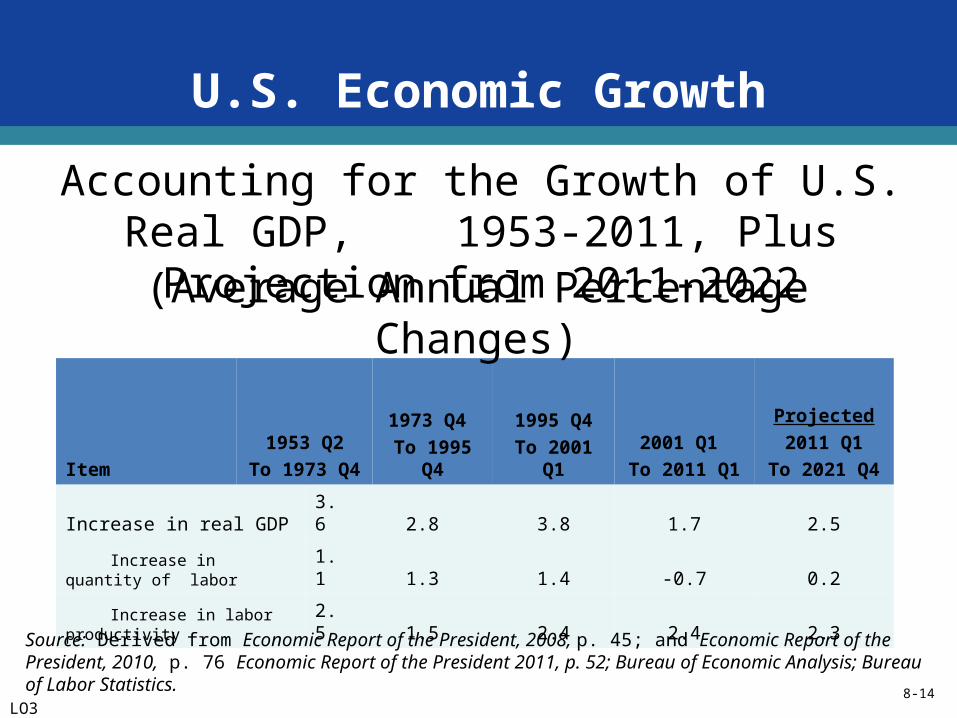
U.S. Economic Growth
Item1953 Q2
To 1973 Q41973 Q4
To 1995 Q41995 Q4
To 2001 Q12001 Q1
To 2011 Q1
Projected2011 Q1
To 2021 Q4
Increase in real GDP 3.6 2.8 3.8 1.7 2.5
Increase in quantity of labor 1.1 1.3 1.4 -0.7 0.2
Increase in labor productivity 2.5 1.5 2.4 2.4 2.3
Accounting for the Growth of U.S. Real GDP, 1953-2011, Plus Projection from 2011-2022
(Average Annual Percentage Changes)
Source: Derived from Economic Report of the President, 2008, p. 45; and Economic Report of the President, 2010, p. 76 Economic Report of the President 2011, p. 52; Bureau of Economic Analysis; Bureau of Labor Statistics.
LO3
8-15
Accounting for Growth
• Factors affecting productivity growth• Technological advance (40%)• Quantity of capital (30%)• Education and training (15%)• Economies of scale and resource allocation
(15%)
LO4

8-16
Accounting for Growth
Average Test Scores of Eighth GradeStudents in Math and Science, 2011
Mathematics Science
LO4

8-17
Productivity Growth
• Average rate of growth• 1.5% per year 1973-1995• 2.4% per year 1995-2012
• Affects real output, real income, and real wages
• Pay higher wages without lowering profit
LO5

8-18
Productivity Growth
• Microchip/information technology• Start-up firms and increasing returns• Sources of increasing returns• More specialized inputs• Spreading of development costs• Simultaneous consumption• Network effects• Learning by doing
• Global competition
LO5

8-19
Productivity Growth
LO5

8-20
Economic Growth
• Is economic growth desirable and sustainable?• The antigrowth view• Environmental and resource issues
• In defense of economic growth• Higher standard of living• Human imagination can solve
environmental and resource issues
LO6
8-21
Economic Growth
• Growth is the path to greater material abundance
• Results in higher standards of living• Increases leisure time• Allows for the expansion and application of
human knowledge
LO6

8-22
Global Perspective
LO6
8-23
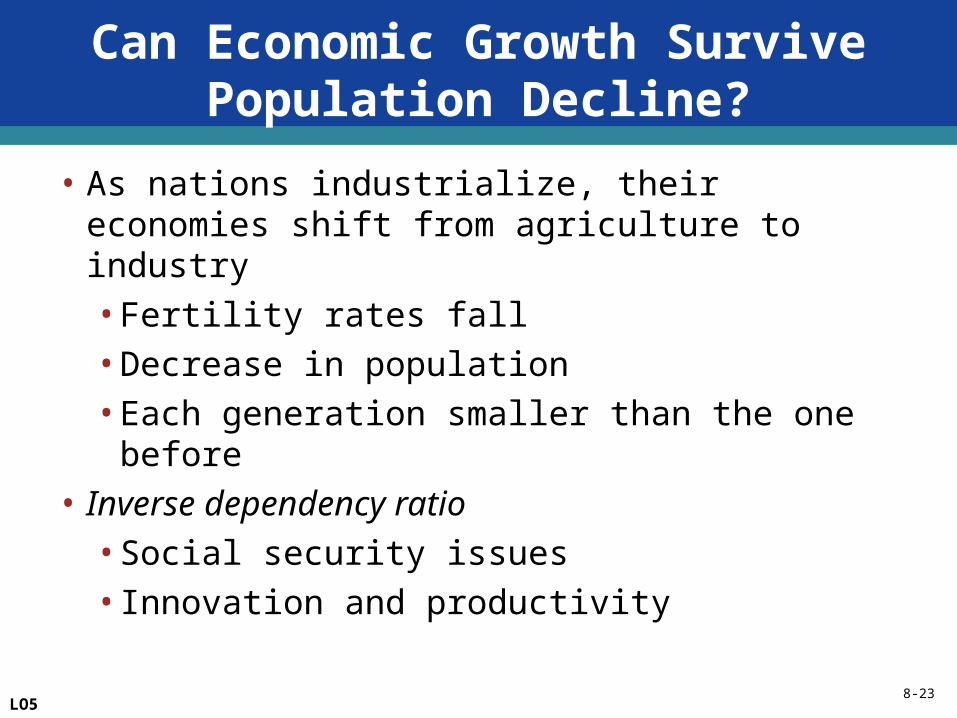
Can Economic Growth Survive Population Decline?
• As nations industrialize, their economies shift from agriculture to industry• Fertility rates fall• Decrease in population• Each generation smaller than the one before
• Inverse dependency ratio• Social security issues• Innovation and productivity
LO5