Forecasting Copyright © 2015 McGraw-Hill Education. All rights reserved. No reproduction or...
15
Forecasting Chapter 3 Copyright © 2015 McGraw-Hill Education. All rights reserved. No reproduction or distribution without the prior written consent of McGraw-Hill Education.
-
Upload
walter-robertson -
Category
Documents
-
view
215 -
download
0
Transcript of Forecasting Copyright © 2015 McGraw-Hill Education. All rights reserved. No reproduction or...

Forecasting
Chapter 3
Copyright © 2015 McGraw-Hill Education. All rights reserved. No reproduction or distribution without the prior written consent of McGraw-Hill Education.
3-2
You should be able to:LO 3.1 List features common to all forecastsLO 3.2 Explain why forecasts are generally wrongLO 3.3 List elements of a good forecastLO 3.4 Outline the steps in the forecasting processLO 3.5 Summarize forecast errors and use summaries to make decisionsLO 3.6 Describe four qualitative forecasting techniquesLO 3.7 Use a naïve method to make a forecastLO 3.8 Prepare a moving average forecastLO 3.9 Prepare a weighted-average forecastLO 3.10 Prepare an exponential smoothing forecastLO 3.11 Prepare a linear trend forecastLO 3.12 Prepare a trend-adjusted exponential smoothing forecastLO 3.13 Compute and use seasonal relativesLO 3.14 Compute and use regression and correlation coefficientsLO 3.15 Construct control charts and use them to monitor forecast errorsLO 3.16 Describe the key factors and trade-offs to consider when choosing a
forecasting technique
Chapter 3: Learning Objectives
3-3
1. Techniques assume some underlying causal system that existed in the past will persist into the future
2. Forecasts are not perfect3. Forecasts for groups of items are more accurate
than those for individual items4. Forecast accuracy decreases as the forecasting
horizon increases
Features Common to All Forecasts
LO 3.1
3-4
Forecasts are not Perfect
Forecasts are not perfect:Because random variation is always present,
there will always be some residual error, even if all other factors have been accounted for.
LO 3.2

3-5
The forecast should be timely should be accurate should be reliable should be expressed in meaningful units should be in writing technique should be simple to understand and
use should be cost-effective
Elements of a Good Forecast
LO 3.3
3-6
1. Determine the purpose of the forecast2. Establish a time horizon3. Obtain, clean, and analyze appropriate data4. Select a forecasting technique5. Make the forecast6. Monitor the forecast errors
Steps in the Forecasting Process
LO 3.4
3-7
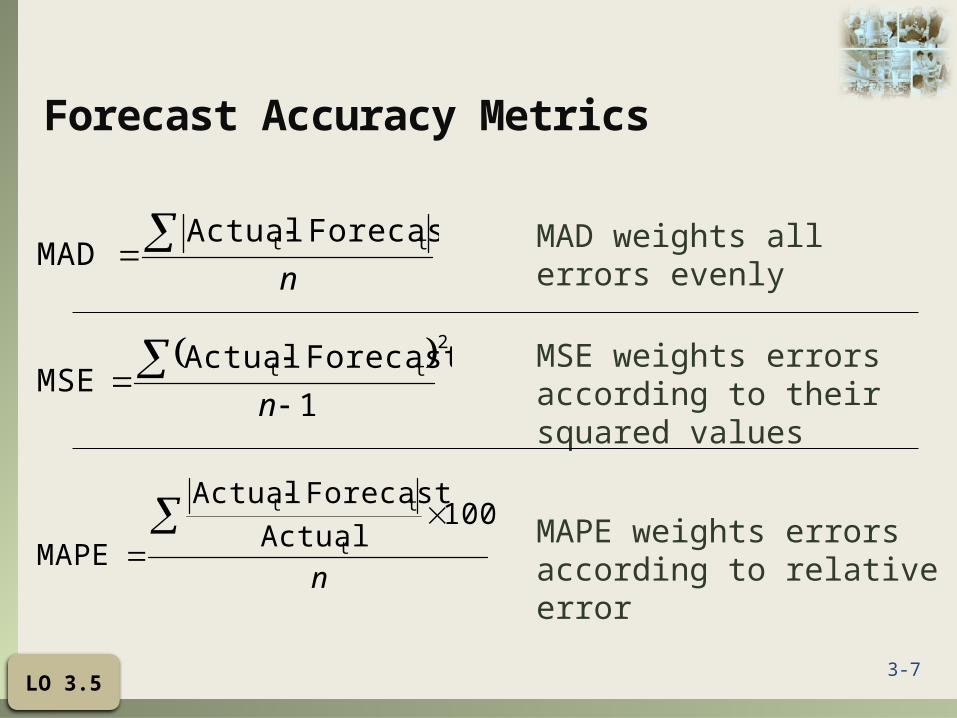
Forecast Accuracy Metrics
n
tt ForecastActualMAD
2
tt
1
ForecastActualMSE
n
n
100
Actual
ForecastActual
MAPE t
tt
MAD weights all errors evenly
MSE weights errors according to their squared values
MAPE weights errors according to relative error
LO 3.5
3-8
Qualitative Forecasts Forecasts that use subjective inputs such as opinions from
consumer surveys, sales staff, managers, executives, and experts Executive opinions
a small group of upper-level managers may meet and collectively develop a forecast
Sales force opinions members of the sales or customer service staff can be good sources of
information due to their direct contact with customers and may be aware of plans customers may be considering for the future
Consumer surveys since consumers ultimately determine demand, it makes sense to solicit
input from them consumer surveys typically represent a sample of consumer opinions
Other approaches managers may solicit 0pinions from other managers or staff people or
outside experts to help with developing a forecast. the Delphi method is an iterative process intended to achieve a consensus
LO 3.6

3-9
Naïve ForecastUses a single previous value of a time series as
the basis for a forecastThe forecast for a time period is equal to the
previous time period’s valueCan be used with
a stable time seriesseasonal variationstrend
Time-Series Forecasting - Naïve Forecast
LO 3.7

3-10
Technique that averages a number of the most recent actual values in generating a forecast
Moving Average
average moving in the periods ofNumber
periodin valueActual
average moving period MA
period for timeForecast
where
...MA 121
n
itA
n
tF
n
AAA
n
AF
it
n
t
ttnt
n
iit
nt
LO 3.8

3-11
The most recent values in a time series are given more weight in computing a forecastThe choice of weights, w, is somewhat
arbitrary and involves some trial and error
Weighted Moving Average
etc. ,1 periodfor valueactual the , periodfor valueactual the
etc. ,1 periodfor weight , periodfor weight
where
)(...)()(
1
1
11
tAtA
twtw
AwAwAwF
tt
tt
ntntttttt
LO 3.9
3-12
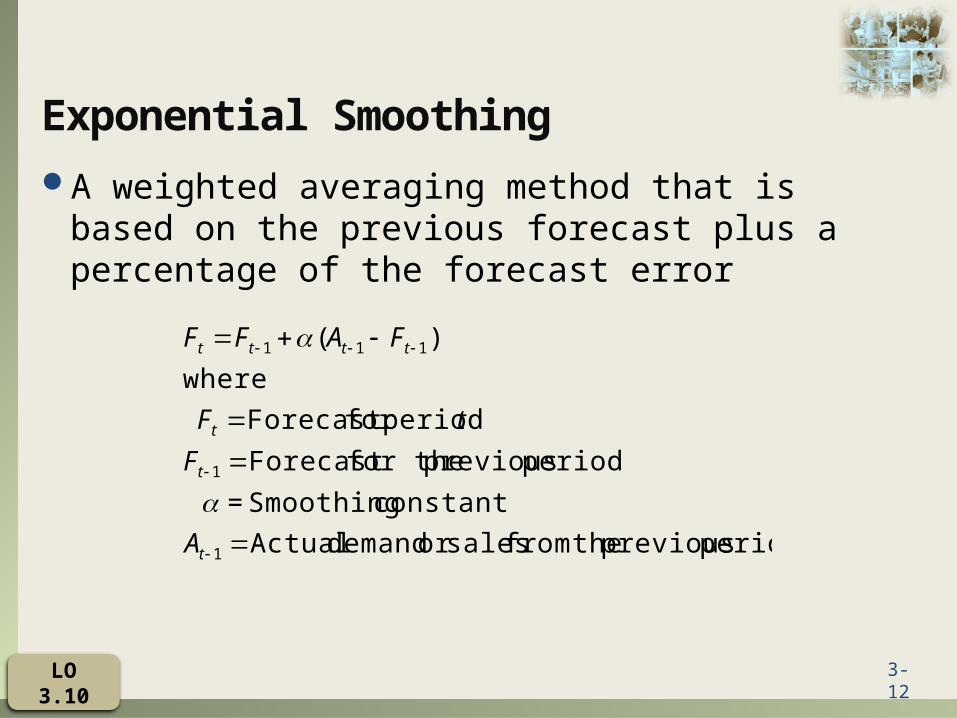
A weighted averaging method that is based on the previous forecast plus a percentage of the forecast error
Exponential Smoothing
period previous thefrom salesor demand Actual
constant Smoothing=
period previous for theForecast
periodfor Forecast
where
)(
1
1
111
t
t
t
tttt
A
F
tF
FAFF
LO 3.10
3-13
Regression - a technique for fitting a line to a set of data pointsSimple linear regression - the simplest form of
regression that involves a linear relationship between two variablesThe object of simple linear regression is to obtain
an equation of a straight line that minimizes the sum of squared vertical deviations from the line (i.e., the least squares criterion)
Simple Linear Regression
LO 3.14

3-14
Control Chart Construction
mean thefrom deviations standard ofNumber where
MSE0 :LCL .4
MSE0 : UCL.3
MSE
errors ofon distributi theofdeviation standard of Estimate 2.
MSE. theCompute .1
z
z
z
s
LO 3.15

3-15
Choosing a Forecasting TechniqueFactors to consider
CostAccuracyAvailability of historical dataAvailability of forecasting softwareTime needed to gather and analyze data and
prepare a forecastForecast horizon
LO 3.16