
CHAPTER 5 Markets and Projected Demand for Federal Coal
34
CHAPTER 5 Markets and Projected Demand for Federal Coal
Transcript of CHAPTER 5 Markets and Projected Demand for Federal Coal

CHAPTER 5
Markets and Projected Demandfor Federal Coal

—— —
Contents
PageFactors Affecting the Demand for Coal. . . . . 79User Needs . . . . . . . . . . . . . . . . . . . . . . . . . . . . . 80Cost Factors. . . . . . . . . . . . . . . . . . . . . . . . . . . . . 80Institutional Constraints. . . . . . . . . . . . . . . . . . 82
Trends in Factors Affecting the Demand forWestern Coal: 1980-90 . . . . . . . . . . . . . . . . . 82
Electrical Growth Rate. . . . . . . . . . . . . . . . . . . . 83Sulfur Reduction Standards. . . . . . . . . . . . . . . . 85Mine Costs.... . . . . . . . . . . . . . . . . . . . . . . . . . . 86Transportation Costs . . . . . . . . . . . . . . . . . . . . . 87Reclamation Costs . . . . . . . . . . . . . . . . . . . . . . . 88Royalty Rates and Severance Taxes . . . . . . . . . 88Industrial Demand . . . . . . . . . . . . . . . . . . . . . . . 89Synthetic Fuels . . . . . . . . . . . . . . . . . . . . . . . . . . 90Foreign Export . . . . . . . . . . . . . . . . . . . . . . . . . . 92Institutional Constraints . . . . . . . . . . . . . . . . . . 93Factors Affecting Competition Between
Western Coal States. . . . . . . . . . . . . . . . . . . 93North Dakota... . . . . . . . . . . . . . . . . . . . . . . . . . 93Montana . . . . . . . . . . . . . . . . . . . . . . . . . . . . . . . 95Wyoming . . . . . . . . . . . . . . . . . . . . . . . . . . . . . . . 95Colorado . . . . . . . . . . . . . . . . . . . . . . . . . . . . . . . 96Utah . . . . . . . . . . . . . . . . . . . . . . . . . . . . . . . . . . . 96New Mexico . . . . . . . . . . . . . . . . . . . . . . . . . . . . 97
The Market Area of Western Coal States. . . . 97
Projections of Demand for Western Coal:1980-90 and 1990-2000. . . . . . . . . . . . . . . . . 99
Production and Demand Forecasts andProduction Goals. . . . . . . . . . . . . . . . . . . . . . . 99
Fort Union Region . . . . . . . . . . .............105Powder River Basin . . . . . . . . . . . ... ... ... ..105Southern Wyoming.. . . . . . . . . . . . . . . . . ... ..105Colorado . . . . . . . . . . . . . . . . . . . . . . . . . . . . . . . 105Utah. . . . . . . . . . . . .......................106New Mexico . . . . . . . . . . ..................107Comparisons of Forecasts . . . . . . . . .........107Demand for Western Coal: 1990-2000........108
Summary ● .. ✎ ✎ ✎ ✎ ✎ ✎ ✎ ✎ ✎ ✎ ✎ ✎ ✎ ✎ ✎ ✎ ✎ ✎ ✎ ✎ ✎ ✎ 110
List of Tables
Table No, Page26. Factors Affecting Market Demand for
Western Coal... . . . . . . . . . . . . . . . . . . . . . . 8127. Comparison of Historical Forecasts of
Annual Growth Rate of Total ElectricGeneration. . . . . . . . . . . . . . . . . . . . . . . . . . . 83
28. Representative Mine-Mouth Prices andTransportation Costs for Western Coal. . . 87
29. Major Market Advantages andDisadvantages of the Major FederalCoal-Producing States. . . . . . . . . . . . . . . . . 94
SO. Market Relationships Between the SixMajor Federal Coal-Producing States . . . . . 99
31. Comparison of Demand Projections for
32
33
Major Western Federal Coal Regionsand States With OTA Task ForceDemand Estimates . . . . . . . .. ... ... .., ..103Demand and Production Forecasts forCoal for the United States: 1985-2000...,.104Forecasted Changes in Contribution ofWestern Coal to Total U.S. Production, ,..ll0
List of Figures
Figure No. Page20, Market Areas of the Six Major Federal
Coal-Producing States. ,, ...,... . . . . . . . 9821. Demand Projections for the Fort Union
and Powder River Coal Regions andSouthern Wyoming, Compared toOTA Task Force Estimates . . . . . . . .. ....106
22. Demand Projections for Colorado, Utah,and New Mexico, Compared to OTATask Force Estimates. . . . . . . . . . . . . . . . ..107
23. Demand and Production Forecasts forthe United States: 1985-2000 and theSix Major Federal Coal States: 1985-90....108

CHAPTER 5
Markets and Projected Demandfor Federal Coal
The concentration of Federal coal re-sources in the West means that the demandfor Federal coal is closely tied to the demandfor Western coal. The demand for Westerncoal is determined by the dynamic interactionof various economic and institutional factorsthat affect: I) coal use in the far West, 2) thecompetitive position of Western coal in en-ergy demand centers in the Midwest, North-Central and South-Central United States withrespect to other coal provinces (the GulfCoast and Interior provinces primarily), and3) the competitive position of Western coalwith respect to competing fuels such as oil,gas, and uranium.
This chapter first examines in a generalway the factors that affect the overall de-mand for coal, and then looks a little moreclosely at the effect these factors have on themarket situation for Western coal as of 1980.The impact that likely or possible trendscould have on Western markets through to1990 are then examined in some detail. Next,
the major market advantages and disadvan-tages of coal produced from the six majorFederal coal-producing States (North Dakota,Montana, Wyoming, Colorado, Utah, andNew Mexico)* are summarized with an anal-ysis of the relative competitive position ofcoal production from these States in differentregions of the country. Finally, the results ofrecent market studies and forecasts of the de-mand for Western coal in the period 1980 to1990 are analyzed in relation to demand esti-mates that were developed by OTA to eval-uate potential production from existing Fed-eral coal leases. The chapter concludes witha general look at the range of possibilities fordemand for Western coal in the context oftotal U. S. coal demand between 1980 and2000.
*Arizona produced almost as much coal in 1979 as NewMexico, and thus ranks as a major Western coal-producingState. However, all production in Arizona is from Indian landand is thus not considered in this chapter.
Factors Affecting the Demand for Coal
The demand for coal is primarily the resultof individual consumers - or users makingchoices based on suitable quality and theprice of coal from different regions and,when other fuels can be substituted for coal,the price of alternative noncoal energy re-sources. Although these relative prices maybe significantly affected by “nonmarket” fac-tors, such as Government policy, in thischapter the term “market demand” refers toleast-cost energy purchasing decisions madeby users, ** “Nonmarket” factors in the form
* * It should be noted that coal quality factors affect purchas-ing decisions and may result in the purchase of higher costcoal. For example, higher delivered cost of Western low-sulfurcoal East of the Mississippi compared to local high-sulfur coalhas been accepted by some utilities because retrofitting old
of Government policy can have a significantimpact on the demand for coal, but a distinc-tion can be made between Government pol-icies that: 1) change the institutional contextof the market system and 2) directly stimulatethe demand for coal. Policies in the firstcategory include most environmental regula-tions that change the relative cost of usingcoal from different regions. The market sys-tem itself makes the necessary adjustments tothe new institutional context. Thus, the mar-
plants with stack gas scrubbers was considered too costly andrisky due to uncertainties surrounding the reliability of avail-able scrubbers. However, even in this case the decision to pur-chase more expensive coal is based on the belief that in thelong run the cost of generating electricity would be cheaperthan the use of less expensive high-sulfur coal.
79
80 . An Assessment 0f Development and Production Potential of Federal Coal Leases
ket demand for coal changes, but shifts in thelevel of demand and regional shifts in coalproduction are based on least-cost energypurchasing decisions. Government policiesthat directly stimulate demand for coal in-clude Government subsidies for a commercialcoal-based synthetic fuels industry and theoff-gas requirements of the Powerplant andIndustrial Fuel Use Act. * At the present timeGovernment intervention in the market sys-tem to directly increase demand for coalforms a small percentage of coal use in theUnited States. However, if Government sub-sidies are seen as necessary to develop alarge-scale coal-based synthetic fuels in-dustry, this situation could change.
Table 26 lists some of the major factorsthat affect demand for coal. These factorsfall into three broad categories: 1) userneeds, 2) costs (mine mouth, delivered, andcosts of converting into useful energy), and3) institutional constraints on production.
User NeedsUser needs are the primary determinant in
the demand for coal. High levels in the elec-trical growth rate, high steel production, andextensive conversion of industrial and elec-tric utility boilers to coal from oil and gas willall mean an increase in coal demand. Highlevels of coal-based synthetic fuels develop-ment and high overseas demand for coal willalso increase coal markets. The importantrole that coal is expected to play in the U.S.energy picture is largely the result of the highcost and less certain availability of oil. Coal’smain competitors as substitutes for oil andgas are nuclear power and energy conserva-tion. ** Low levels of energy conservation and
*The off-gas requirements in this act actually have elementsof both kinds of policies: the law requires conversion from gasto coal even if it is cheaper for the utility to continue with gas(i.e., least cost energy purchasing decisions are not allowed),but on the other hand, once the shift is made to coal, the openmarket will determine where the utility buys its coal based on anarrower set of least cost considerations. These requirementshave now been repealed by Congress (see third footnote, nextcolumn),
**If conservation reduces the total level of energy consumption which is served by oil and gas, there is less need to substi-tute other energy sources. Without conservation the demandfor coal as a substitute to oil and gas would be higher, and it isin this specific sense that conservation is a competitor to coal.
nuclear power growth would contribute to in-creased demand for coal.
Coal markets are also affected by the ex-tent of substitutability of alternative sourcesto meet user needs. Electric utility needs canbe met by oil, gas, uranium, conservation*and a wide range of coal qualities. For a newpowerplant the primary determinant in utilitychoice of fuels is the relative cost of produc-ing electricity. Once a choice has been madeand a powerplant built to meet the specifica-tions of the chosen fuel some substitutionsbecome impossible (i.e., nuclear to coal) andmost become costly (i.e., oil or gas to coal andshifts from one coal type to another). On theother hand, there is little substitutability inthe demand for metallurgical-grade coal.**
Cost Factors
For a coal producer to sell his coal, he mustusually produce it at a price such that de-livered cost per Btu to the consumers (mineplus transportation cost) is lower than thedelivered cost per Btu of coal offered by com-peting coal producers. If the offered price ishigher, then the coal must be more attractiveto the prospective buyer, either because thecoal quality characteristics are more suitablefor his need, or for some other reason such aslower costs to produce electricity or greaterassurance of reliable delivery.*** Basic mine
*Conservation in this context refers to utility investments inactivities that reduce total demand or reduce peak demand(such as time-of-day pricing, load management, insulation loanprograms) because they are cheaper than investments that in-crease generating capacity. This kind of conservation is differ-ent from conservation by electricity users that is purely inresponse to increased cost of electricity. The latter form of con-servation reduces the amount of electricy a utility needs to pro-duce, but does not fulfill the needs of the utility as a business.
**To a limited extent low-sulfur, low-ash coals that do nothave normal coking properties can be blended with metallur-gical-grade coal to produce coke, Newly developing technologyfor production of “form coke” can take a wide range in rank ofcoal, although sulfur and ash content are still important.
***The Powerplant and Industrial Fuel Use Act which man-dated conversions to coal from gas in utility and large in-dustrial boilers may result in the choice of coal as a fuel wherecost comparisons would indicate staying with gas. However,the impact of this law has been reduced by the Omnibus BudgetReconciliation Act passed by Congress in August 1981 whichrepealed the ban on use of natural gas in 1990 in section 301 ofPIFUA, Instead, utilities that use natural gas as a primary fuelare required to develop conservation plans to reduce currentannual power production attributable to natural gas by 10 per-cent within 5 years.
Ch. 5—Markets and Projected Demand for Federal Coal ● 81
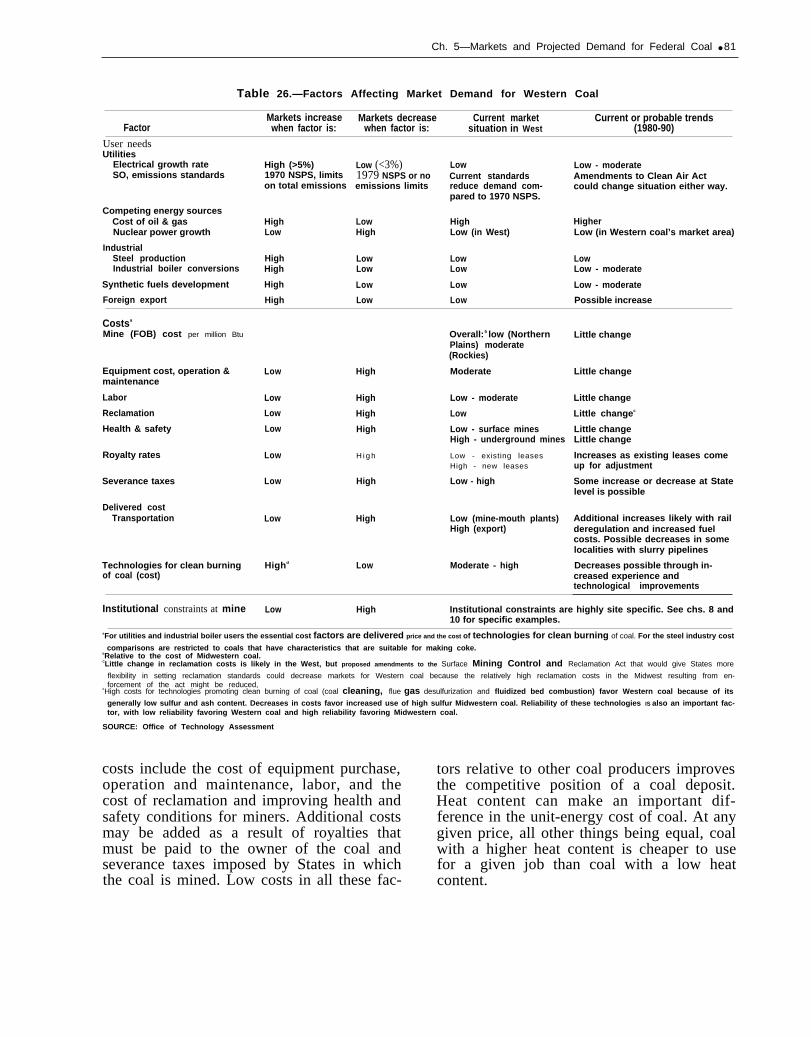
Table 26.—Factors Affecting Market Demand for Western Coal
Markets increase Markets decrease Current market Current or probable trendsFactor when factor is: when factor is: situation in West (1980-90)
User needsUtilities
Electrical growth rateSO, emissions standards
Competing energy sourcesCost of oil & gasNuclear power growth
IndustrialSteel productionIndustrial boiler conversions
Synthetic fuels development
Foreign export
High (>5%)1970 NSPS, limitson total emissions
HighLow
HighHigh
High
High
Low (<3%)1979 NSPS or noemissions limits
LowHigh
LowLow
Low
Low
LowCurrent standardsreduce demand com-pared to 1970 NSPS.
HighLow (in West)
LowLow
Low
Low
Low - moderateAmendments to Clean Air Actcould change situation either way.
HigherLow (in Western coal’s market area)
LowLow - moderate
Low - moderate
Possible increase
Costsa
Mine (FOB) cost per million Btu
Equipment cost, operation &maintenance
Labor
Reclamation
Health & safety
Royalty rates
Severance taxes
Overall:b low (NorthernPlains) moderate(Rockies)
Low High Moderate
Low High Low - moderate
Low High Low
Low High Low - surface minesHigh - underground mines
Low H i g h Low - existing leasesHigh - new leases
Low High Low - high
Delivered costTransportation Low High Low (mine-mouth plants)
High (export)
Technologies for clean burning Highd Low Moderate - highof coal (cost)
Little change
Little change
Little change
Little changec
Little changeLittle change
Increases as existing leases comeup for adjustment
Some increase or decrease at Statelevel is possible
Additional increases likely with railderegulation and increased fuelcosts. Possible decreases in somelocalities with slurry pipelines
Decreases possible through in-creased experience andtechnological improvements
Institutional constraints at mine Low High Institutional constraints are highly site specific. See chs. 8 and10 for specific examples.
aFor utilities and industrial boiler users the essential cost factors are delivered price and the cost of technologies for clean burning of coal. For the steel industry cost
comparisons are restricted to coals that have characteristics that are suitable for making coke.bRelative to the cost of Midwestern coal.CLittle change in reclamation costs is likely in the West, but proposed amendments to the Surface Mining Control and Reclamation Act that would give States more
flexibility in setting reclamation standards could decrease markets for Western coal because the relatively high reclamation costs in the Midwest resulting from en-forcement of the act might be reduced,
dHigh costs for technologies promoting clean burning of coal (coal cleaning, flue gas desulfurization and fluidized bed combustion) favor Western coal because of its
generally low sulfur and ash content. Decreases in costs favor increased use of high sulfur Midwestern coal. Reliability of these technologies IS also an important fac-tor, with low reliability favoring Western coal and high reliability favoring Midwestern coal.
SOURCE: Office of Technology Assessment
costs include the cost of equipment purchase,operation and maintenance, labor, and thecost of reclamation and improving health andsafety conditions for miners. Additional costsmay be added as a result of royalties thatmust be paid to the owner of the coal andseverance taxes imposed by States in whichthe coal is mined. Low costs in all these fac-
tors relative to other coal producers improvesthe competitive position of a coal deposit.Heat content can make an important dif-ference in the unit-energy cost of coal. At anygiven price, all other things being equal, coalwith a higher heat content is cheaper to usefor a given job than coal with a low heatcontent.
82 ● An Assessment of Development and Production Potential of Federal Coal Leases
Coal is a commodity with a low specificvalue compared to other commodities, oftencosting less than a cent per pound at the mineand sometimes considerably less. Conse-quently transportation costs represent a sub-stantial portion of the delivered cost of coal ifthe user is a significant distance from themine. Low transportation costs relative toother coal producers increase marketing po-tential. Transportation costs can bean impor-tant limiting factor where coalfields are dis-tant from existing networks that transportcoal. For example, the high cost of building acoal transportation infrastructure to connectthe coalfields in southwest Utah with existingnetworks is an impediment to developing thisarea.
Institutional Constraints
In some situations a coal reserve may beavailable for development at a cost that iscompetitive with coal from other sources, butthe coal cannot be mined because of environ-mental reasons, labor or equipment short-ages, or possibly limited or nonexistent trans-portation capacity. An example of an envi-ronmental threshold that might eventuallydelay or possibly limit expansion of coal de-velopment appears to exist in North Dakota.All currently proposed mines in North Dakotaare associated with proposed nearby powerand synthetic fuel plants. Operation of allcurrently permitted plants may exceed the“prevention of significant deterioration” airquality increments for sulfur dioxide (S02). Ifthis is the case, the level of mine developmentmay be limited as well. (Additional discussionof this situation can be found in ch. 10. ) Laborshortages and limits to transportation capac-
ity are usually relatively short-term condi-tions that can be corrected in the presence ofstrong demand for coal from a region. Spe-cific transportation and environmental issuesaffecting Western coal development are dis-cussed in more detail in chapters 8 and 10,respectively.
Institutional constraints are more signifi-cant in their impact on production at a spe-cific locality than on the demand for coal ingeneral, Unless institutional constraints limitproduction in a large number of coal-produc-ing regions, demand is met by increased pro-duction from regions that do not experienceconstraints. Such shifts in production mayresult in some cost increases, but unless pro-duction is constrained in a number of regions,causing rapid increases in production of mar-ginal coal reserves that cost more to minethan existing mines, such cost increases arenot likely to be large. ’ If reasonable environ-mental and socioeconomic thresholds setlimits on coal production in an area, cost in-creases resulting in shifts in coal productionto other areas can be considered part of in-ternalizing the environmental and socialcosts of mining coal. *
1The cost impact of such regional shifts in productiondepends on both changes in mine mouth cost and transporta-tion cost. ICF has noted that moderate shortfalls in some re-gions can be compensated for by increased production fromnearby regions which are less constrained and which have ade-quate reserves of comparable coals available, but that if con-straints are widespread, the net costs to society can be high(ICF, Inc., Analysis and Critique of the Department of Energy’sAugust 7, 1980 Report Entitled “Preliminary Nationcd and Re-gional Coal Production Goals for 1985, 1990 and 1995,Washington, D. C.: ICF, Inc., October 1980).
*However, it must be recognized that there may be consider-able disagreement as to what constitutes a “reasonable” envi-ronmental or socioeconomic threshold at a specific location.
Trends in Factors Affecting the Demand forWestern Coal: 1980-90
The last two columns in table 26 give a gen- sible trends in these factors in the perioderal view of the current market situation in from 1980 to 1990. The following text dis-the West with respect to the factors affecting cusses only the most salient factors listed onthe demand for coal and identify likely or pos- this table with respect to Western coal.

Ch. 5—Markets and Projected Demand for Federal Coal - 83
Electrical Growth Rate
Electric utilities are by far the most signifi-cant user that will be affecting the demandfor Western coal. In 1979 utilities purchased70 to 96 percent of the coal produced in themajor Western Federal coal-producing States(see table 22, ch. 4). The electrical growthrate will probably be the single most impor-tant factor affecting demand for coal fromWestern States during the next 10 years. Theelectrical growth rate in the last few yearshas declined significantly compared to ratesfollowing World War II. The average growthrate of total net generation of electricity from1945 to 1973 was 7 percent. Average annualgrowth since 1973 has slowed substantiallyand has averaged less than 2 percent duringthe last few years (total U.S. consumption ofelectricity in 1979 was 1.9 percent higherthan in 1978 and in 1980 the increase was 1.4percent).
The decrease in the electrical growth ratehas been largely the result of conservation inresponse to increasing costs of electricity,although the economic situation of the pastfew years has been an important factor in re-cent very low growth rates. This decline inthe electrical growth rate is a major reasonfor the decreases in projections for demandfor Western coal over the last few years. Forexample, the Department of Energy’s (DOE)1990 production goals for the western North-ern Great Plains (which also includes south-ern Wyoming) dropped from 529 million tonsin the 1978 forecast to 336 million tons in the1980 preliminary forecast. Most of this dropcan be attributed to a reduction in the elec-trical growth rate used in the forecast.
Efforts to project longer-term electricitygrowth rates have historically not been veryaccurate, but table 27, which compares pro-jected growth rates over the last decade,show there has been a consistent downwardtrend in projected growth for similar timeperiods in the future. Table 27 shows that re-cent electrical growth projections for theperiod from 1979 to 1985 range from 2,5 to4.1 percent. The low projections are higherthan growth rates in the past few years, re-flecting a belief that an economic upturn will
Table 27.—Comparison of Historical Forecasts ofAnnual Growth Rate of Total Electric Generation
Projectedg r o w t h
Scurce and year of study rate Time per iod
U.S. Energy Outlook–1971 . . . . . . . . .Department of the interior—1972 . . . . .Oak Ridge National Laboratory–1973Lawrence Livermore Laboratory— 1974Technical Advisory Committee—1974.Oak Ridge National Laboratory—1975Westinghouse—1975. . . . . . . . . . . .Electrical World—1975 . . . . . . . . . . . .Exxon Co.—1977 . . . . . . . . . . . . . . . . . .ElA’s Annual Report to Congress—
1978 ......, . . . . . . . . . . . . . . . . . . . .C O N A E S – 1 9 7 8 . . . . . . . ,National Electric Reliability Council —
July 1980, . .National Electric Reliability Council —
July 1981 . . . . . . . . . . . . . . . . ...Department of Energy—August 1980. .ICF , Inc .—November 1980 , . ,ICF, Inc.—November 1980, . . . . . . .Economic Regulatory Administration
and Energy InformationAdministration—December 1980 . . .
1980 actuala . . . . . . . . . . ., . . . . . . .aRate of increase experienced for the first 47 weeks of 1980 over corresponding
period of 1979.
SOURCES:
(percent)7.26.14.45.66.05.15.05.84.8
4.70.7-3.2
4.1
3.73.03.53.0
2,51,4
1971-851971-2000
1974-851974-851974-851974-851974-851975-851977-90
1977-851975-2010
1979-89
1981-901978-851979-851985-90
1979-851980
Forecasts from 1971 to 1978 from table 39, U S Department of En-ergy, Short Term Energy Outlook, DOE/EIA-0202/2 (Washington,DC U.S. Government Printing Office, February 1980) Projectionsof the Demand and Conservation Panel of the Committee on Nucle-ar and Alternative Energy Systems as scenario B cited in Science,Apr. 14, 1978, p. 151
National Electric Reliablilty Council, 1980 Summary of ProtectedPeak Demand, Generating Capability and Fossil Fuel Require.ments for the Regional Reliability Councils of NERC (Princeton,N. J.: NERC, July 1980), Calculated from table 9 It should be notedthat this is a drop from the 4 4-percent rate projected by the Re-gional Councils in their April 1980 reports to the U S. EconomicRegulatory Administration,
National Electric Reliability Council, Electric Power Supply andDemand 1981-1990 (Princeton, N.J.: NERC, July 1981)
Department of Energy, Preliminary National and Regional CoalProduction Goals for 1985, 1990 and 1995 (Washington, D C DOE}
Aug 7, 1980), From table 19ICF, Inc., Forecasts and Sensitivity Analyses of Western Coal
Product/on, prepared for Rocky Mountain Energy Co (Washington,D.C.: ICF, Inc., November 1980). From table 3-2, app A
ERA and EIA growth rate taken from table 1, Department of Ener-gy, Proposed Changes to Generating Capacity 1980.89 for the Con-tiguous United States, DOE/RG-0047 (Washington, D C DOE, De-cember 1980,) The 25 percent was derived by combining the esti.mates by the Economic Regulatory Administratlon of 21 percentfrom 1979 to 1983, and latest estimates by the Energy InformationAdministration of 32 percent from 1978 to 1995
increase demand for electricity. The upperrange of 4. I percent projected by the Na-tional Electric Reliability Council (NERC) inJuly 1980 is considered by a number of ob-servers to be somewhat high. The NationalCoal Association (NCA), for example, uses theNERC electrical growth rate for their highprojection and an electrical growth rate of3.5 percent for their most likely projection ofU.S. coal production.’ Also the electrical
‘National Coal Association, NCA Long-Term Forecast (Wash-ington, D. C.: NCA, March 198 1).
84 . An Assessment of Development and Production Potential of Federal Coal Leases
growth rate projected by NERC in July 1981was reduced by 10 percent from their earlierprojection, to 3.7 percent.
There are analysts who expect the elec-trical growth rate to continue to decline in thefuture. For example, the Solar Energy Re-search Institute (SERI) projects an electricalgrowth rate of 0.4 percent annually between1978 and 2000 if cost-effective efficiency in-vestments are made (excluding investmentsin solar).3 According to this study, construc-tion programs already underway could sup-port such an increase in demand over thenext 20 years even if: 1) no plants are broughton line after 1985, 2) all fossil plants builtbefore 1961 are retired, and 3) 80 percent ofall oil- and gas-burning generating plants areretired. The SERI study also concluded thatvigorous onsite solar investments (active andpassive solar space and water heating) com-bined with extensive development of cogener-ation and onsite wind and photovoltaic sys-tems could result in a negative growth rate inthe demand for electricity between now andthe turn of the century.
More important than the overall electricalgrowth rate in the United States are theregional growth rates in the potential marketareas for Western coal. Recent projections byNERC, NCA, and ICF all assume electricalgrowth rates (EGR) in the far West that arelower than, or near average compared to theUnited States as a whole. For the period 1980to 1990 NERC projects an EGR of 3.8 percentin the West compared to a national averageof 3.7 percent. ICF projects a slightly lowerrate for the West (2.8 v. 3.0 percent from1979 to 1990) and NCA projects a signif-icantly lower rate in the West than the na-tional average (2.9 v. 3.5 percent) for thesame time period.4 On the other hand, all
3House Committee on Energy and Commerce, Report on Build-ing a Sustainable Future, prepared by the Solar Energy Re-search Institute (Washington, D. C.: U.S. Government PrintingOffice, April 1981), p, 152,
4The geographic areas for these projections do not entirelycoincide. The NERC projection is for the Western Systems Co-ordination Council (calculated from table 19, Electric PowerSupply and Demand 1981-1990 (Princeton, N.].: National Elec-tric Reliability Council, July 1981). The ICF projections coverapproximately the same area as the WSCC but include parts ofMontana and New Mexico that are in other regional reliabilitycouncils (calculated from table 3-2, app. A, Forecasts and Sen-
three of these sources project higher thanaverage electrical growth rates in the Mid-west and South-Central United States, bothimportant market areas for Western coal. Inmuch of this area coal from the Gulf Coastlignite province and the Midwest competewith coal from the major Federal coal States.
Another important factor affecting the util-ity demand for Western coal is the regionalgrowth rate in coal-fired generation. In someareas in the United States, such as in theMidwest, where coal is already meeting mostgeneration requirements, increases in coaldemand are fairly directly tied to the growthin demand for electricity. However, in areaslike the South-Central United States wherecoal-fired capacity is being added in a systemprimarily dependent on more expensive fuel(i.e., oil or natural gas), demand for coal mayincrease through replacement of oil and/orgas base load generation even if there is nototal generation growth. Regional growthrates in coal-fired generation between 1980and 1990 are projected by NERC to be 3.1percent in the West (WSCC and MARCA re-gional reliability councils) and 10.0 percentfor the South-Central United States (ERCOTand SPP reliability councils).* NCA projectshigher growth rates for essentially the sametime period (1979-90) of 5.0 percent in theWest and 13.1 percent in the South-CentralUnited States.
It is apparent that the electrical growthrate and conversions from gas to coal in theSouth-Central United States will be a majordeterminant in the rate of increase in the de-mand for Western coal. In 1979 the South-Central United States consumed 26 percent oftotal Western coal production used by util-ities. ** NCA projects that 40 percent of the
sitivity Analysis of Western Coal Production, Washington, D, C.:ICF, Inc., November 1980). The NCA projections include boththe WSCC and the Mid-Continent Area Reliability y CoordinationAgreement (MARCA) which covers the upper Midwest (seefootnote 2 for source).
*ERCOT covers most of Texas and SPP includes north Texas,eastern New Mexico, Oklahoma, Kansas, Arkansas, Louisiana,and the western parts of Missouri and Mississippi, See footnote4 for sources of projections cited in this paragraph.
**Total Western coal production includes production fromthe Northern Plains, Rocky Mountain, and Gulf Coast coalprovinces, the western part of the Interior coal province,Washington State, and Alaska.
Ch. 5—Markets and Projected Demand for Federal Coal ● 85
coal produced in the West in 1990 will beused in the South-Central region, and NERCprojects that 47 percent of Western coal pro-duction for utilities will be used in this area.The reasons for this projected large increaseare: 1) replacement of gas with coal-fired gen-eration, as originally required by the Power-plant and Industrial Fuel Use Act (PIFUA];and 2) higher gas prices. Increases in theavailability of natural gas since passage ofPIFUA has decreased some of the pressuresto switch from gas to coal, and there remainssome uncertainty as to how much of a shiftfrom gas to coal will actually occur in thisregion by 1990,
Sulfur Reduction Standards
Before passage of the 1970 Clean Air Act,sulfur content of coal was not a significantfactor affecting utility coal purchase deci-sions. The 1970 new source performancestandards (NSPS) for S02 that set a maximumemission rate of 1.2-lb/million Btu, created alarge market for “compliance” coal (i.e., coalthat could be burned without stack gas scrub-bing and meet the 1.2-lb standard). * A signifi-cant amount of the increased demand forWestern coal between 1970 and 1979 can beattributed to the fact that Western coalfieldscould produce compliance coal that had a de-livered price in the Midwest that was lowerthan the delivered price of high-sulfur Mid-western coal when the added cost of scrub-bing the high-sulfur coal was factored in.
The 1977 Clean Air Act Amendments,which required sulfur reduction for all coalsburned by utilities, significantly reduced themarket advantage enjoyed by low-sulfurWestern coal under the 1970 NSPS for SO2.The 1979 NSPS for SO2 which apply to newpowerplants, establish a dual standard forsulfur reduction based on both sulfur contentand maximum allowable emissions of SO2. **If 70-percent sulfur reduction will result in an
*This translates into a coal sulfur content of 0.6 lb/millionBtu since that amount of sulfur would convert to 1.2 lb of SO2.
**The final 1979 NSPS were published on June 11, 1979 (44Federal Register 33613-33624) but apply to all electric utilitysteam generating units for which construction commencedafter Sept. 18, 1978.
emission rate of less than 0.6 lb SO2/millionBtu, a higher sulfur reduction is not neces-sary. All higher sulfur coals must have 90-percent reduction in sulfur, but emission ofS O2 cannot exceed the 1970 NSPS of 1.2lb/million Btu.5 For “high” sulfur coal, thistranslates into a maximum of 6.0 lb sul-fur/million Btu (90-percent reduction of thisamount equals 1.2 lb SO2/million Btu). For lowsulfur coal this translates into a maximum of1.0 lb sulfur/million Btu (70-percent reductionof this amount equals 0.6 lb SO2/million Btu).Most current production in the West wouldqualify for a 70-percent sulfur reduction rate.
The cost of stack gas scrubbing for West-ern low-sulfur coal is generally lower than forhigh-sulfur coal because scrubbing processesfor low-sulfur coal (mostly dry) are cheaperthan wet processes needed for high sulfurcoal. However, this advantage is largely off-set by allowances in the present regulationsthat give credit for sulfur reduction by pre-combustion cleaning (i.e., sulfur reduction bycleaning can reduce the percentage of sulfurreduction required by stack gas scrubbing).According to studies by the Bureau of Mines,mechanical cleaning of coal from northernAppalachia and the Midwest can result inaverage reductions in sulfur of 33 and 23 per-cent respectively.’ This means that sulfurreduction by stack gas scrubbing would typi-cally need to range from 57 to 67 percent
5The 1979 NSPS have been challenged in court on thegrounds that there was irregular ex parte communication dur-ing their formulation. The regulations have been upheld in dis-trict court and the decision has been appealed by industry, It ispossible that the regulations will be revised as a result of thislitigation. Legislative modifications to sulfur reduction stand-ards are also in early stages of consideration by Congress.Revisions that would allow a more flexible sliding scale forsulfur reduction would lessen the adverse impact of the 1979NSPS on the competitive position of Western coal in Midwest-ern markets, but not eliminate it. For example, the Mining TaskForce of the National Coal Policy Project concluded before the1979 NSPS were promulgated that the Clean Air Act Amend-ments of 1977 (which require utilities to install the bestavailable control technology on all new plants) would meanthat coal production in the Northern Great Plains was not likelyto increase as much as would happen under the 1970 NSPS.F. X. Murray (cd.), Where We Agree: Report of the NationalCoal Policy Project V.2 (Boulder, Colo,: Westview Press, 1978).
6A. W. Deurbrouck, Sulfur Reduction Potential of Coals in theUnited States, Bureau of Mines RI 7633 (Washington, D. C.: U.S.Government Printing Office, 1972).
86 . An Assessment of Developmenf and Production Potential of Federal Coal Leases
(rather than 90 percent) for Eastern coal com-pared to 70 percent for low-sulfur Westerncoal. Coal cleaning is not generally practicedon Western coal primarily because of the gen-erally low heat content of these coals that areused by utilities, and because Western coalstend to be high in organic sulfur, which is notamenable to reduction by conventional me-chanical cleaning processes.
The 1979 NSPS for S02 have not been in ef-fect long enough to allow full evaluation oftheir effect on coal markets, but it appearsthat stack gas scrubbing costs for high-sulfurcoal (with credits for sulfur reduction bycleaning before combustion) and for low-sul-fur Western coal will not differ greatly. If thisproves to be the case, it would largely elimi-nate sulfur content in coal as a key factor incoal purchasing decisions for new power-plants by electric utilities, although there aresome situations where Western coal may re-tain a competitive advantage based on sulfurcontent. For example, in nonattainment areaswhere further development hinges on reduc-ing total emission of S02, low-sulfur coal mayhave an advantage because full (i.e., 90 per-cent) stack gas scrubbing of low-sulfur coalemits less total S02 than the same amount ofscrubbing of high-sulfur coal.
In summary, the competitive position ofWestern coal varies according to the kind oflimitations that are set on the emission of SO2.At one extreme, the absence of restrictionson S02 emissions would make the deliveredprice, rather than the sulfur content of thecoal, the key factor in purchasing decisions.The 1979 NSPS will probably achieve a sim-ilar result. In contrast, the 1970 NSPS gavelow-sulfur Western coal a significant com-petitive edge, and strict limitations on thetotal level of emissions also favor Westerncoal.
The full effect of the 1979 NSPS (if they arenot modified) will not be felt until the late1980’s because a large percentage of newcoal-fired capacity that will come online be-tween 1980 and 1985 was ordered before the
NSPS went into effect.7 The major impacts ofthe 1979 NSPS in the next decade will be inthe effect it has on determining which coalregions will supply those new coal-firedplants that will be built in the late 1980’s andthat have not signed long-term contracts forcoal.8
Mine Costs
Now that sulfur content will probably be aless significant factor in the marketing ofWestern coal, the single most important com-petitive advantage retained by Western coalis its low cost at the mine mouth. Table 28summarizes recent representative steam coalcontract prices in January and June 1981 forthe major Federal coal-producing States andranges of prices within the Midwestern andAppalachian coal regions. In January 1981,typical price per ton from the Powder Riverbasin in Wyoming and Montana ranged from$6.75 to $12.00/ton, and in the other Westerncoal States, for higher Btu coal, from $16.00to $20.75/ton. In contrast, prices for Mid-western coal range from a low of $17.00 to$27.501 ton and for Appalachian coal from$23.00 to $34.50/ton. The actual cost spreadis a little less when these prices are trans-lated into cost per million Btu. For examplethe low price for coal in the Midwest of
‘Eighty-three percent (49,200 of the projected 59,400 giga-watts total net capacity) of new coal plants that are planned tocome on line between 1979 and 1985 will be constructed tomeet the 1970 NSPS rather than the 1979 NSPS, and an addi-tional 5,800 gigawatts planned to come on line between 1985and 1990 will be under the old standards because orders forboilers were made before the new standards took effect (num-bers calculated from tables 3-7 and 3-9, app. A, Forecusts andSensitivity Analysis of Western Coal Production, Washington,D. C.: ICF, Inc., November 1980).
8It should be noted that the present administration has pro-posed that the mandatory scrubbing requirements in the 1977Clean Air Act Amendments be eliminated. However, if the1979 NSPS are repealed, it is not certain that low-sulfur West-ern coal would be as attractive to Midwestern utilities as it wasin the 1970’s. For example, a study by Data Resources Inc.(DRI) has concluded that eastern and Midwestern electricutilities would continue to favor local high-sulfur coal, even ifthe mandatory scrubbing requirements were dropped (Coal
Week, May 18, 1981). The reason for this is that DRI’s projec-tions of rail rate increases for Western coal offset the cost sav-ings from not having to control the SO2 emissions.

Ch. 5—Markets and Projected Demand for federal Coal - 87
Table 28.—Representative Mine-Mouth Prices and Transportation Costs for Western Coal(January and June 1981)
Contract steam coal price (FOB) Representative rail rates ($/ton)Kansas
State Btu/lb $/ton $/mm Btu From To: Minneapolis Omaha City Chicago Hammond, IN
Montana . . . . 8,600
9,300
8,100’
1 0,500*
10,700
11,600
11,500
10,0009,500
to12,000
11,200to
13,000
9.75 0.57 Colstrip MT 11 .46a
21.44 b
(22.31)Decker MT —
—
18.69 a
(18.26)—
18.94a
(18.00)—
12.00 0.65 —
Wyoming. . . . 6.75(7.00)16.50
— —
14.24 a
(16.29)Hanna WY — 8.0118.97a
(9.1 1/10.13)12.43a
(14.30).Colorado . . . . 17.50
(19.00)0.82
(0.89)Routt CO — —
20.75(22.00)20.50
— — —— —
Utah 30.25b
(31.76)Utah. . . . . . . .
New Mexico .Midwest . . . .
—
Appalachia. .
aUnit train ratebSingle car ratecPowder River Basin‘Southern Wyoming
NOTE Number in parentheses Indicates price change from January to June 1981 No parentheses Indicates no change
SOURCE Coal Week. Jan 5, 1981, and June 8, 1981
$17.00/ton is 2.5 times higher than the lowprice for Western coal, but on a Btu basis thespread is reduced to a factor of 1.7. The lowcost of mining Western coal can be attributedprimarily to low production, labor and recla-mation costs for both surface and under-ground mines with coal seams that are thick-er than those in the Midwest and Appalachia.
shown here, except from Hanna, Wyo., therail transport costs exceed the mine-mouthcost. The cost advantage of unit train rates isalso clearly shown in this table. From Col-strip, Mont., to Minneapolis, Minn., single carrates are almost twice unit train rates. Thedifference works to the disadvantage of Col-orado and Utah where single mines often can-not produce enough to justify commitment ofunit trains. Table 28 also shows that railrates are changing at a faster rate than minecosts in the West. During the first 6 months of1981 all except one rail rate changed, andmost of the changes involved increases of$1.00/ton or more. In contrast, most coalprices in the West remained unchanged dur-ing this same period.
There is a general consensus that railtransportation costs over the next 10 yearsare likely to increase at a faster rate than in-
Transportation Costs
Western coalfields are located far fromthe main centers of coal demand in the Mid-west and South-Central United States. Conse-quently, transportation costs are one of themajor market disadvantages experienced byWestern coal and are probably the singlelargest overall factor in market decisions con-cerning Western coal. Table 28 shows somerepresentative rail rates from points in theWest to the Midwest, In all the examples

88 . An Assessment o/ Development and Production Potentia/ of Federal Coal Leases
flation. 9 Coal slurry pipelines may reducetransportation costs between certain points,but there is no consensus as to how signifi-cant these cost savings may be, nor is theremuch certainty as to the magnitude of real in-creases that can be expected in rail transportcosts (see ch. 8).10 However, the net effect ofreal increases in transportation costs will ad-versely affect the competitive position ofWestern coal with respect to Midwesterncoal because longer distances are involved.
The alternative to shipping coal to centersof demand is to generate electricity at themine mouth and ship the energy by wire.North Dakota, which is relatively close tocenters of electricity demand in ‘the upperMidwest, and New Mexico, which is rela-tively close to centers of demand for electri-city in southern California both export signifi-cant amounts of electricity by wire. However,several factors tend to limit the level of mine-mouth generation to primarily what is neededwithin the Western Federal coal-producingStates and adjacent States: 1) long-distancetransmission of electricity is generally expen-sive because of high capital costs, 2) theavailability of water is less (although use ofdry-cooling towers can reduce some of the
9 Participants in a conference held in Cctober 1980, shortlyafter the Staggers Rail Act of 1980 was signed into lawreached the general conclusion that there would be an almostimmediate impact in terms of increased rates for shipping coal(Coal Week, Oct. 20, 1980). The Department of Energy assumeda 15-percent real increase in rail transportation costs between1978 and 1985 in setting its preliminary regional coal produc-tion goals. However, ICF has found that between 1978 and1980 alone real increases (i. e., adjusted to account for infla-tion) were 10.5 percent, almost as much as DOE’s projected in-crease over the 7-year period. This underestimation of likelyrail increases resulted in a considerable overestimation of de-mand for coal from the Powder River basin (ICF, Inc., Analysisand Critique of the Department of Energy’s August 7, 1980Report Entitled “Preliminary Notional and Regional Coal Pro-duction coals for 1985, 1990 and 1995” (Washington, D. C.: ICF,Inc., October 1980). ] In the final production goals, DOE in-creased assumed escalation of transportation costs to 25 per-cent. Rocky Mountain Energy Co. projects a 40-percent real in-crease in rail transportation costs in southern Wyoming be-tween 1980 and 1990 (personal communication, Stephen Berg-Hansen, Wyoming Task Force, Oct. 16, 1980).
‘Wee also Office of Technology Assessment, U.S. Congress,Coal Slurry Pipelines, Summ(]ry (Washington, D. C,: U.S.Government Printing Office, September 1980), p. 8, This sum-mary updates an earlier report, A Technolo~y Assessment ofCool Siurry Pipelines (Washington, D. C.: U.S. GovernmentPrinting Office, March 1978),
problems related to water availability), and3) the relative environmental and social im-pacts of large-scale powerplants are greaterin the arid and semiarid West compared tothe Midwest and South-Central UnitedStates. 11 Transportation by wire is discussedin more detail in chapter 8.
Reclamation Costs
Reclamation requirements under the Sur-face Mining Control and Reclamation Act of1977 give Western coal a decided competitiveadvantage compared to Eastern coal becausethe relative cost increases attributable to theAct are small in the West compared to theMidwest and Appalachia. Typical incremen-tal costs with Public Law 95-87 have recentlybeen estimated to be $5.24/ton in Appalachia,$1.80/ton in the Midwest and $0.57 ton in theWest. [z The incremental cost differential be-cause of reclamation requirements betweenWestern and Midwestern coal (a factor of 3)is more significant than the cost differentialbetween Appalachian and Western coal (afactor of 10) because Western and Appa-lachian coal serve different market areas,whereas the market areas for Midwesternand Western coal overlap. Less stringentreclamation requirements for mining wouldprobably have the effect of improving thecompetitive position of Midwestern coal withrespect to Western coal because cost reduc-tions from less stringent reclamation stand-ards would generally be greater in theMidwest.
Royalty Rates and Severance Taxes
Royalty rates on coal produced in WesternStates were generally very low before the1970’s reflecting the relatively low value at-tributed to Western coal reserves. The in-creased demand for coal in the West in the1970’s resulted in increases in royalty rates
11See for example discussion on pp. 199-201 in F. X. hlurray(cd.), Where We Agree: Report of the Natianai Coal Policy Proj-ect V,2 (Boulder, Co]o.: Westview Press, 1978).
“National Research Council, Surface Mining Soij, CO(I1 and
Society (Washington, D. C,: Academy Press. 1981). This study’sanalysis of reclamation costs is discussed in more detail in ch.10.
Ch. 5—Markets and Projected Demand for Federal Coal ● 89
as coal was perceived by both the owners andpotential lessees as having a higher value. In-dian tribes and private leaseholders led theway in exacting higher royalty rates in theearly 1970’s. The 1976 Federal Coal LeasingAmendments Act (FCLAA) set minimum pro-duction royalty rates on surface coal at 12½percent; a lower royalty rate (currently 8 per-cent) is permitted for underground coal. Sev-eral States followed suit in raising royaltyrates, and new leasing transactions of non-Federal coal generally follow minimum levelsset by the Federal Government.
The overall effect of changing royalty rateshas been to create considerable differentialsin royalties between “old” ‘and “new” leasedcoal. Federal leases before 1976 containednominal royalties by today’s standards. Theaverage royalty rate on Federal coal mined in1977 was 18.8 centslton. Royalty rates at cur-rent contract prices at rates set in FCLAAmay be more than 10 times that. The Depart-ment of the Interior (DOI) is required to raiseroyalty rates when leases come up for adjust-ment, consequently over the next 10 to 15years as leases are adjusted, there will exista dual royalty standard that could affect thecompetitive position of individual Federalleases with respect to other Federal leasesand non-Federal coal. Without a systematicanalysis of the intraregional and interre-gional effects of differential royalty rates, itis difficult to draw conclusions concerningthe impact of these differentials on coalmarkets.
Severance taxes* imposed by States alsoadd to the mine-mouth cost of coal. In theWestern States severance taxes range fromzero in Utah to 30 percent in Montana. A com-parison of severance taxes on surface minedcoal in the West shows that cost per millionBtu is roughly the same in Colorado, NewMexico, North Dakota, and Wyoming (gener-ally 3 to 5 cents/million Btu).13 Severance taxcosts in Montana run three to four times
*See ch. 12 of this report for a description of State coalseverance taxes.
‘ ‘Colorado Energy Research Institute, Mineral SeveranceTuxes in the Western Stutes: A Comparison (Golden, CO1O.:”CERI, 1979].
higher. Severance taxes and royalty ratesadd to the cost of coal, but increases at-tributable to these sources are relativelysmall compared to the cost of mining andtransporting the coal. Consequently, such dif-ference may cause shifts in the location of thecoal production between Western States (ascould be the case in Montana,)* or fromWestern coalfields to other coalfields, but donot have a significant impact on the avail-ability or overall demand for coal.
Industrial Demand
Utah, Colorado, and New Mexico are theonly Western States with significant reservesof metallurgical coal. In 1979 these threeStates supplied only 3 percent of the metal-lurgical coal that was used by the steel in-dustry although they supplied nearly all ofthe metallurgical coal used in the West. Therest was produced and mostly consumed inthe Midwest and Appalachia. Federal leasesin Oklahoma also contain metallurgical coal,and demand for Federal coal from this Statehinges strongly on the needs of the steel in-dustry. Even a dramatic increase in the de-mand for metallurgical coal would not havemuch effect on the total demand for Westerncoal, given its small share of that market.
Industrial coal burning in California pre-sents a significant source of potential in-creased demand for coal from Utah, southernWyoming, New Mexico, and Colorado, but lit-tle realization of this potential is expectedwithin the next 10 years because of the eco-nomic costs of converting boilers from nat-ural gas or oil to coal, combined with thecosts of emission controls. The same is prob-ably generally true of industrial boiler con-version in the Midwest and South-CentralUnited States where Western coal also ex-periences competition from Gulf Coastlignites and Midwestern coal production. Sig-nificant increases in demand for coal be-
*The impact of the Montana severance lax is discussed inmore detail in the section on market advantages and disadvan-tages of Montana coal later in this chapter.
——
90 . An Assessment of Development and production Potential of Federal Coal Leases
cause of industrial boiler conversions are notlikely to be experienced until after 1990.1’
In 1979, 6 percent of total coal productionin the far Western States (including Arizonaand Washington) was for nonmetallurgicalindustrial uses, most of which was used forlime and cement kilns, metals processing, andsugar processing (table 22, ch. 4). Some in-crease in demand for coal for such industrialuses may occur, but dramatic increases arenot likely, thus the major potential source ofincreased industrial demand for coal will beindustrial boiler conversions.
Synthetic Fuels
A major disadvantage of coal is that it isnot as convenient to use and transport as oiland gas, and is not directly substitutable foruse in the transportation sector, which ac-counted for 25 percent of the total energy usein the United States in 1979. Synthetic gasand liquids can be produced from coal, but ata high cost. Relative costs of oil and gas andcoal-based synthetic fuels are still such thatsynthetic fuels cannot currently compete inthe market place, although some large energycompanies may be willing to commit funds tocommercialization of coal-based syntheticfuels in anticipation of future oil and gasprice rises. Nevertheless, demand for coal toproduce synthetic fuels during the nextdecade is likely to depend to a large extent onGovernment incentives. Coal-derived liquidsmust also compete with oil shale, which pro-duces a synthetic crude oil that can be proc-essed in conventional refineries. At presentthe uncertainties in the cost estimates for thevarious synthetic liquid fuels are larger thanthe estimated difference in the cost of coaland oil shale derived synthetic liquids.
NCA’s long-term forecast for coal produc-tion concludes that coal synfuels productionwill fall short of production goals set by theFederal Government when it created the Syn-thetic Fuels Corp. NCA estimates that coalsynfuels production is not likely to exceed
14 F. Hachman, Market Factors Associated With the Assess-ment of the Development Potential of Federal Coal Leases inUtah, prepared for OTA, 1980.
200,000 barrels per day (bbl/d) of oil equiv-alent by 1990 in contrast to the goals of500,000 bbl/d in 1987 and 2 million bbl/d in1992 established by the Government (ofwhich two-thirds was to have come fromcoal). 15 NCA stated that the goals were unre-alistic considering the economic, technical,environmental, and other regulatory condi-tions in which synfuels plants must be built.
The current status of coal-based synfuelsprojects indicates that most of the demandfor coal for this purpose during the nextdecade is likely to be in the Midwest and Eastrather than the West. A survey by NCA of ex-isting and proposed coal-based synfuel facili-ties found that the largest coal synfuel facili-ties operating in the United States are pilotplants in Kentucky and Texas, and that theonly large commercial synfuel plant underconstruction in 1980 was located in Ten-nessee. l6 According to this survey, of the fourlarge-scale synfuels demonstration plantsthat were expected to start construction in1981, only one, the Great Plains Gasifica-tion Associates’ project in North Dakota, waslocated in the West. The other three arelocated in Kentucky, West Virginia, andIllinois.
On the other hand, DOE assumed in itsfinal 1980 coal production goals that 60 per-cent of the 1990 demand for coal feedstockfor synfuels will be west of the Mississippi,most of which (45 percent of total demand)would be from the six major Western Federalcoal States.17 This assumption was based ontwo major considerations: 1) the technical su-periority of low caking Western coal whenused with first-generation conversion tech-nology and 2) the relative abundance of low-cost strippable Western coal resources. How-ever, the assumed l-million-bbl/d total U.S.production of coal-based synfuels (20 plantswith a capacity of 50,000 bbl/d oil equivalent
15NCA, NCA Long-Term Forecast, op. cit.16National Coal Association. Survey of Existing and Proposed
Synthetic Fuel Facilities (Washington, D. C.: NCA, September1980).
17 U.S. Department of Energy, The Biennial Updute of Nationalund Regiona~ Coal Production Cmds for 1985, 1990 and 1995(Washington, DC.: DOE, January 1981).
Ch. 5—Markets and Projected Demand for Federal Coal ● 91
nationwide) exceed other estimates of likelylevels of synfuel production by 1990.
Evaluation of this potential for coal-basedsynfuel development in the West by OTA inthe different State assessments generallyagrees with the data in the NCA survey, in-dicating limited development of Western coalto support synfuels plants before 1990, TheOTA Wyoming task force judged only one ofthe three Federal lease blocks in Wyomingthat are associated with synthetic fuels proj-ects to have favorable production prospectsby 1991 and recent developments have in-creased the uncertainty that this project willbe online by then.18 The market analyses pre-pared for the Utah and Colorado task forcesconcluded that the use of coal for synfuels inthose States would be minimal by 1991.19 TheNew Mexico task force projections assumedthat no commercial-scale synthetic fuelplants using New Mexico coal would be inoperation by 1990.20
All of the barriers to beginning full-scaleconstruction of the most advanced commer-
18J. R. Boulding and D. L. Pederson, Development and Produc-tion Potential of Undevelopcd Federal Coal Leases and Prefer-ence Right Lease Applications in the Powder River Basin andother Wyoming Coal Basins, final report (Washington, D. C.:OTA, 1981). The one block with favorable prospects is theRochhelle lease held by Peabody Coat Co., which is committed taPanhandle Eastern’s proposed gasification plant near Douglas.Wyo. This gasification project received a major setback inAugust 1981 when Pacific Gas & Electric and Ruhrgas Akti-engesellschaft of West German~’ announced they were with-drawing from their preliminary partnership agreement for theproject. Consequently, it is uncertain whether any synfuelplants will be producing in the Powder River basin by 1991.The other two blocks associated with synfuel proposals areTexaco’s Lake DeSmet block in the western Powder Riverbasin and Nerco’s Cherakee block in southern Wyoming. Thesewere judged by the Wyoming task force to have uncertain pro-duction praspects by 1991, Subsequent analysis by OTAchanged 1991 production prospects for the DeSmet block fromuncertain to unfavorable. Two other proposed synfuel projectsin Wyoming are still in the early stages of development. TheHampshire project proposed for the eastern Powder Riverbasin is not associated with a specific source of coal, and a coalto gasoline plant proposed by Mobil would involve entirely non-Federal coal in the western Powder River basin.
‘<’See Hachman, op. cit.: and J. E. Martin, Market Factors andProduction Contingencies Determining the Present nnd FutureDemand far Colorado COul (Lakewood, Colo.: Colorado EnergyResearch Institute, December 1980).
-“The Development Praspects for Federal CoaJ Leases in NewMexico 1980-1990 (Washington, D. C.: OTA, November 1980].
cial-scale Western synfuel project in the NCAsurvey have been overcome. Preconstructionactivities began on the Great Plains Gasifica-tion Associates’ coal gasification facility inMercer County, N. Dak,, in August 1980. Thefirst unit of the plant, which would use 4.7million tons per year of lignite, is scheduled tobe in operation in late 1984. The project hadconsiderable difficulty in developing a financ-ing plan that was acceptable to the FederalEnergy Regulatory Commission and consum-ers who would purchase the gas. The originalfinancing plan was revised in January 1981,and received approval in May. Citing possiblecost overruns and the need for a separatepipeline, the project sponsors increased theirloan guarantee request to DOE from $1.8 bil-lion to $2.0 billion. This request was ap-proved by President Reagan in early August1981.
A study prepared for OTA by the ColoradoSchool of Mines Research Institute on thesynfuels potential of Western coal concludedthat significant commercial production ofhigh-Btu gas from coal is unlikely for at least10 years even with Federal incentives.21
Development activities related to medium-and low-Btu gasification facilities are strong-ly dependent on the availability of naturalgas. The Institute’s study concluded that therelative abundance of natural gas, and theprospects for acquiring additional suppliesfrom new foreign and domestic sources havedampened the development of small-scale in-dustrial gasifiers.
This study also concluded that significantcommercial production of coal liquids is un-likely over the next 10 years. Even if substan-tial Government incentives are offered, com-mercial production levels are expected to beless than 100,000 to 200,000 bbl/d of syn-thetic liquid, primarily because of the lead-times for construction and the risks asso-ciated with first generation plants. Becauseof these risks, industry is likely to wait untilprocesses have been demonstrated on a com-
21 Colorado School of Mines Research Institute. Synfuels Po-
tential of Western Coal, Draft Report, prepared for OTA, Oct.31.1980.
92 ● An Assessment of Development and Production Potential of Federal Coal Leases
mercial scale before committing to build alarge synfuels industry. Because commercialdemonstration is not possible until the late1980’s, 1990 production levels are likely to belimited to the capacity of the first generationpioneer plants.
Foreign Export
Japan, Korea, and Taiwan are expecting tosignificantly increase their imports of coalduring the next 10 years, and have purchasedcoal from several Western States for testburns. Initial shipments of coal have beenmade to Japan from Utah and to Korea fromColorado. Current capacity of port facilitiesto handle coal for foreign export on the westcoast is about 3 million tons, and significantexport of Western coal will require consider-able expansion of existing facilities and con-struction of new facilities to handle coal.NCA estimates that countries in the Far Eastwill import from 153 million to 180 milliontons in 1990.22
Potential competitors to the United Statesfor the coal demand in the Far East are Aus-tralia, Canada, China, the Soviet Union, andSouth Africa. The NCA range of projectedcoal exports for these countries in 1990 is 195million to 240 million tons, which is wellabove the range of import demand in the FarEast (although all export from these countriesis unlikely to go to the Far East). Consequent-ly, the Western coal States will be entering acompetitive market; it is thus difficult topredict what share of this market the UnitedStates is likely to obtain. Australia has a con-siderable competitive advantage over coalproduced in the Western United States, butthe Japanese in particular appear to be plac-ing limited coal commitments elsewhere as ahedge to limit the strength of the Australianposition.23
The Japanese have expressed the greatestinterest in high-Btu bituminous coal with lowash, moisture, and sulfur content, whichgives the Rocky Mountain coal region a prob-
‘lNCA, NCA Long-Term Forecast, op. cit.“Hachman, op. cit., pp. 24-25.
able advantage over the Northern GreatPlains. The recent expressions of interest bythe Japanese in Powder River basin coal haveresulted in plans to construct a coal exportfacility at Kalama, Wash., that could have anexport capacity of 15 million tons by 1983.Export of subbituminous coals from thePowder River basin will probably depend onthe development of slurry pipelines and tech-nology for drying the coal to upgrade its heatcontent. A recent analysis of the economics ofexport from the west coast did not considerPowder River coal to have significant exportpotential in the near future, primarily be-cause of its lower heat content. 24 The poten-tial for export of Alaskan coal to the PacificRim countries was not examined in this study.
If the Japanese would make firm commit-ments to purchase significant amounts ofWestern coal, port facilities could probablybe constructed to meet the demand for ex-port. However, such firm commitments havenot yet been made, and existing ports thathandle coal on the west coast are reluctant toexpand or construct new facilities untilhigher volumes of coal are assured. In theabsence of firm commitment by Asian coun-tries to purchase Western coal, it is very dif-ficult to predict the level of foreign exports ofWestern coal by 1990, ICF projects exportsfrom the west coast to be 2 million tons in1985 and 14 million tons in 1990.25 The Inter-agency Coal Export Task Force projects anupper limit of 15 million tons in 1990 for westcoast export. 26 DOE final production goalsassume that 12 million to 35 million tons ofcoal in 1990 will be exported from west coastports. 27
NOTE: See also, Office of Technology Assessment, U.S.Congress, Coal Export and Port Development (Washington,D. C,: U.S. Government Printing Office, April 1981),
“G. B. McMeans, Jr., The Economic Viability of ProposedWest Coast Coo] Port Sites (Oakland, Calif.: Kaiser Engineers,Inc., 1981 ). This paper presented at Coal Outlook”s Conference,Charting the Cuurse of Western Cou], June 8-9, 1981 says “’weare not optimistic about the export potential of Powder RiverBasin subbituminous coals. ”
~~Tab]e 4-2, app. A, ]CF report cited in footnote 4.“’Interagency Coal Export Task Force, Interim Report,
DOEIFE-0012 (Washington, DC.: U.S. Department of Energy,January 1981).
‘“Tables 35, 36, and 37 in DOE report cited in footnote 17.
Institutional Constraints
Later chapters on transportation, environ-mental, and socioeconomic issues examine inmore detail the impacts of various institu-tional constraints on coal production in theWest. There are some specific instanceswhere Federal coal reserves under existinglease cannot be mined because of environ-mental restrictions, but the total reserves in-volved in such restrictions are relativelysmall. * It does not appear that implementa-tion of environmental policies are likely to
*See ch. 10, espercially table 93 on p. 317.
Ch. 5—Markets and Projected Demand for Federal Coal . 93
pose a significant constraint on the ability ofWestern States to produce coal. Infrastruc-ture constraints, such as the ability of com-munities to expand services to accommodatepopulation increase because of coal develop-ment and the ability of transportation sys-tems to deliver coal to the areas of demandmay cause constraints on a site-specificbasis. However, such constraints do not ap-pear likely to prevent Western coal Statesfrom meeting the possible ranges of demandsthat are likely during the next 10 years. (Seech. 6 for estimates of production from theWestern Federal coal States.)
Factors Affecting Competition BetweenWestern Coal States
The net result of the various factors andtrends discussed in the previous section isthat conditions favoring rapid increases indemand for coal from the major Federal coalStates are not as favorable for the 1980’s asthey were in the 1970’s, This does not meanthat there will not be substantial increases inWestern coal production—the low cost ofmining Western coal will ensure that—but itdoes mean that the West’s share of coal mar-kets will probably not be as great as has beencommonly anticipated. The major reasons forthis are: 1) reduction in the low sulfur ad-vantage, 2) lower electrical growth rates. and3) higher transportation costs. Offsettingthese trends somewhat is the likelihood thatthe South-Central United States, which is amajor consumer of Western coal, will have ahigh growth rate in coal-fired powerplants toreplace gas-fired plants. Nearly 60 percent(174 million of 301 million tons) of NERC’Sprojected new annual demand for utility coaland lignite from the West between 1979 and1989 will be consumed in the South-Centralregion (ERCOT and SPP regions). Consequent-ly, the overall demand for Western coal willbe highly sensitive to both electrical growthrates and gas to coal conversions in this re-gion. It is more difficult to evaluate the fac-
tors affecting demand for coal in the 1990-2000 time period, but some discussion of thiscan be found later in the Demand for WesternCoal; 1990-2000 section.
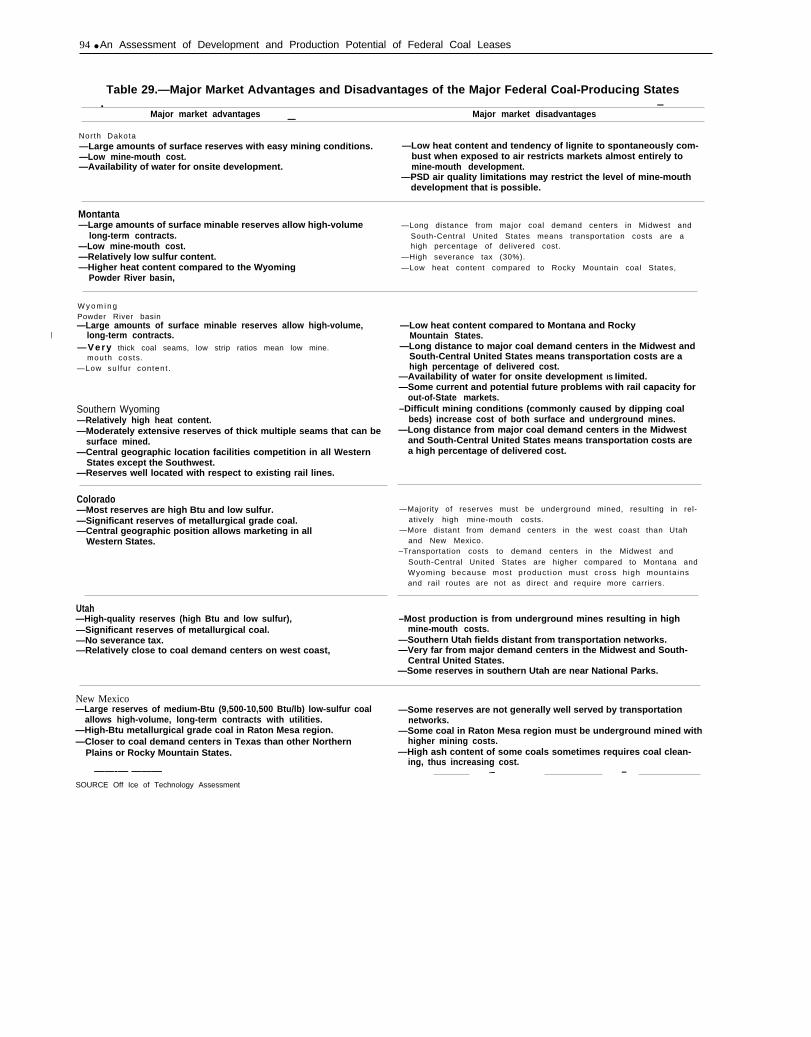
This section looks in more detail at therelative market advantages and disadvan-tages that coal producers in each of the majorFederal coal-producing States experiencewith respect to demand for coal in the Westand in other parts of the United States. Theserelative advantages and disadvantages aresummarized in table 29. The next section ex-amines the net effect of these advantages anddisadvantages in the share of total produc-tion and geographic market areas of the dif-ferent States.
North Dakota
In 1979 North Dakota produced 15.0 mil-lion tons of lignite, ranking fifth out of the sixmajor Federal coal States. The key marketdisadvantage of North Dakota lignite is itslow heat content and poor handling charac-teristics for long-distance transport. Lignitetends to combust spontaneously when ex-posed to air, and is difficult to unload fromrail cars in winter because moisture in the
— -.
94 ● An Assessment of Development and Production Potential of Federal Coal Leases
Table 29.—Major Market Advantages and Disadvantages of the Major Federal Coal-Producing States.
Major market advantages—
Major market disadvantages—
North Dakota—Large amounts of surface reserves with easy mining conditions.—Low mine-mouth cost.—Availability of water for onsite development.
—Low heat content and tendency of lignite to spontaneously com-bust when exposed to air restricts markets almost entirely tomine-mouth development.
—PSD air quality limitations may restrict the level of mine-mouthdevelopment that is possible.
Montanta—Large amounts of surface minable reserves allow high-volume
long-term contracts.—Low mine-mouth cost.—Relatively low sulfur content.—Higher heat content compared to the Wyoming
Powder River basin,
—Long distance from major coal demand centers in Midwest andSouth-Central United States means transportation costs are ahigh percentage of delivered cost.
—High severance tax (30%).—Low heat content compared to Rocky Mountain coal States,
W y o m i n gPowder River basin—Large amounts of surface minable reserves allow high-volume,
I long-term contracts.—Very thick coal seams, low strip ratios mean low mine.
mouth costs .—Low su l fur content .
Southern Wyoming—Relatively high heat content.—Moderately extensive reserves of thick multiple seams that can be
surface mined.—Central geographic location facilities competition in all Western
States except the Southwest.—Reserves well located with respect to existing rail lines.
Colorado—Most reserves are high Btu and low sulfur.—Significant reserves of metallurgical grade coal.—Central geographic position allows marketing in all
Western States.
—Low heat content compared to Montana and RockyMountain States.
—Long distance to major coal demand centers in the Midwest andSouth-Central United States means transportation costs are ahigh percentage of delivered cost.
—Availability of water for onsite development IS Iimited.—Some current and potential future problems with rail capacity for
out-of-State markets.–Difficult mining conditions (commonly caused by dipping coal
beds) increase cost of both surface and underground mines.—Long distance from major coal demand centers in the Midwest
and South-Central United States means transportation costs area high percentage of delivered cost.
—Majority of reserves must be underground mined, resulting in rel-atively high mine-mouth costs.
—More distant from demand centers in the west coast than Utahand New Mexico.
–Transportation costs to demand centers in the Midwest andSouth-Central United States are higher compared to Montana andWyoming because most product ion must c ross h igh mounta insand rail routes are not as direct and require more carriers.
Utah—High-quality reserves (high Btu and low sulfur),—Significant reserves of metallurgical coal.—No severance tax.—Relatively close to coal demand centers on west coast,
–Most production is from underground mines resulting in highmine-mouth costs.
—Southern Utah fields distant from transportation networks.—Very far from major demand centers in the Midwest and South-
Central United States.—Some reserves in southern Utah are near National Parks.
New Mexico—Large reserves of medium-Btu (9,500-10,500 Btu/lb) low-sulfur coal
allows high-volume, long-term contracts with utilities.—High-Btu metallurgical grade coal in Raton Mesa region.—Closer to coal demand centers in Texas than other Northern
Plains or Rocky Mountain States.
——-— ———SOURCE Off Ice of Technology Assessment
—Some reserves are not generally well served by transportationnetworks.
—Some coal in Raton Mesa region must be underground mined withhigher mining costs.
—High ash content of some coals sometimes requires coal clean-ing, thus increasing cost.
-— —
Ch. 5—Markets and Projected Demand for Federal Coal ● 95
lignite freezes. The low heat content limitscoal sales almost entirely to nearby power-plants (or synfuel facilities) in the State withsome export to the adjacent States of SouthDakota and Minnesota. Air quality thresh-olds, as mentioned previously, are becoming afactor to consider in the use of North Dakotalignite reserves in mine-mouth power andsynfuel plants.
The key market advantages of North Da-kota lignite are that water is readily availablefor onsite development and there are largereserves of surface minable lignite that canbe mined at a relatively low cost, NorthDakota is also located closer to the electricitydemand centers in the upper Midwest thanother Western States, and reserves are well--suited for commercially available gasificationtechnologies.
Montana
In 1979 Montana produced 32.5 milliontons of coal, ranking second among the sixmajor Federal coal States. The major marketadvantages in Montana are large reserves ofsurface minable coal, with generally higherheat content compared to other NorthernPlains States (but relatively low compared tothe Rocky Mountain States). Four counties inthe Montana portion of the Powder Riverbasin contain an estimated 32 billion tons ofstrippable reserves,28 Mine-mouth costs aregenerally half that in the Midwest (see table28) but transportation costs are high, com-prising about one-half to two-thirds the de-livered cost in the Midwest. The Crow andNorthern Cheyenne Tribes have large re-serves of coal that do not depend on Federal,State, or private coal to form minable blocks,
Montana has the highest severance tax inthe United States, Between 1970 and 1975(the year Montana’s severance tax was insti-tuted) growth rates in coal production inMontana and Wyoming were approximatelythe same. Between 1976 and 1979 the growth
2 8 1 3 R , E. ~~iltsorl an[j J. m’. B]umer, Quofit} ond Heserkrf:s f)~
Stripp{lhlc C(NJI Selmtefi Depos i ts , Southmlstern Monttln(l, bul-lelin 91 (Butte, Nlont.: hl(~ntana Bureau of \lines and Cet)l(jgv.December 1973).
rate in coal production in Wyoming wasalmost three times that of Montana (19.3 per-cent compared to 6.5 ). Several published re-ports have concluded that Montana’s sever-ance tax has depressed the growth rate ofcoal production in the State and point to thedifference in growth rate between Montanaand Wyoming as evidence. 29 However the dif-ference in growth rates between the twoStates can also be attributed to other factorsthan the severance tax, such as limits on theavailability of rail lines to areas for proposednew development, and slightly higher produc-tion costs before severance taxes are appliedin either State. It is possible that Montana’shigher severance tax may increase Wyo-ming’s share of production from the PowderRiver basin compared to what it would havebeen without differentials in severancetaxes, but no analysis of Montana’s sever-ance tax to date has established a clear rela-tionship between the tax and changes in Mon-tana coal production,30 Whatever its relativeimpact in Montana and Wyoming, the sever-ance tax remains a small percentage of thedelivered price of electricity generated fromPowder River basin coal, and despite the highseverance tax planned production capacity inMontana during the next 10 years is high (seechs. 6 and 7).
Wyoming
In 1979 Wyoming produced 71,8 milliontons of coal, which was 44 percent of totalcoal production from the six major Federalcoal States and more than twice the produc-tion from Montana, which was the secondranked State of the six. This high level of pro-duction is the result of favorable conditions inthe State’s coalfields in both the PowderRiver basin and southern Wyoming. Wyominghas very large (23 billion tons) reserves ofsurface minable coal in thick coal seams withlow stripping ratios in the Powder River
-“See for example Coal Age, April 1979, p. 39, and HouseCommittee on Interstate and Foreign Commerce, Coal Sev-er[lnce Tf].xes, hearing report 96-173 (Washington. D. C.: U.S.Government Printing Office, 198o).
1“Personal communication, Arnold Silverman, professor (IfEconomic Geology a t the Universi tv of Montana, Nlissoula(phone conversation, Feb. 10, 1981].
96 . An Assessment of Development and Production Potential of Federal Coal Leases
basin, and also moderate reserves (3.2 billiontons) of medium-Btu coal (9,500 to 10,500Btu/lb) in southern Wyoming that can be sur-face mined.31
Coal in the Powder River basin of Wyomingis cheaper to mine than anywhere else in theUnited States. The best coal deposits in thePowder River basin are also well located withrespect to rail lines, and are likely to beserved by at least one coal slurry pipeline bythe mid or late 1980's. The major disadvan-tage of coal from the Powder River basin isthat it has a low heat content, and there aresome potential bottlenecks outside of Wyo-ming in transporting coal by rail to markets tothe East and South. Reserves are sufficient tosupport many mine-mouth conversion facili-ties, but the availability of water for onsitedevelopment, plus other siting problems limitsthe likelihood of extensive onsite developmentduring the next 10 years.
The central geographic position of coal-fields in southern Wyoming, combined withtheir close location to the Union PacificRailroad’s main line, facilitates competitionin States to the East and West. Mining condi-tions are generally more difficult in southernWyoming compared to the northern GreatPlains both because dipping coal seams aremore difficult to mine and also because themore arid climate creates more difficult con-ditions for reclaiming mined land. As a conse-quence, mine-mouth prices are higher, evenwhen the higher heat content is taken intoaccount.
Colorado
In 1979 Colorado produced 18.1 milliontons of coal, ranking third among the sixmajor Federal coal States. The main ad-vantage of Colorado coal is high heat contentand low-sulfur content, reserves of surfaceand underground coal that are served by ex-isting transporatation networks, significantreserves of metallurgical coal, and a centralgeographic position that allows marketing in
“Reserve data from table 9, G. B. Glass, Wyoming COu]Fields, 1978, inf. cir. No. 9 (Laramie, Wyo.: Geological Survev ofWVoming, 1978).
the Southwest as well as the Midwest andwest coast.
One of the major market disadvantages isthat the majority of reserves in the State mustbe underground mined, resulting in relativelyhigh mine-mouth costs. However, surfacemine production will continue to provide atleast half of Colorado’s coal output throughthe 1980’s. Transportation costs place Col-orado somewhat at a disadvantage in bothWestern and Midwestern market areas com-pared to the other States. Utah is closer towest coast demand centers, and New Mexicois closer to both major demand centers insouthern California and in the South-CentralUnited States. Even though Colorado is closerto the demand centers in the South-CentralUnited States than Montana and Wyoming,transportation costs are relatively higherbecause most production must cross highmountain passes and rail routes are not asdirect. The mountain passes increase trans-portation costs because steep grades necessi-tate more engines and fewer cars than typ-ical unit trains. Also, lines owned by two orthree railroads must be traversed to reachmost destinations in the Midwest and South-Central United States. Because of thesetransportation costs, a significant fraction ofthe coal used by utilities in eastern Coloradocomes from Wyoming.
Utah
In 1979 Utah’s coal production was 11.8million tons. The main advantage of Utah coalis high heat content of steam coal, reserves ofmetallurgical coal, and close location to de-mand centers on the west coast, The majordisadvantages are that virtually all presentproduction is from underground mines, andconsequently mine-mouth costs on the aver-age are the highest of any Western State.Fields in southern Utah have significant sur-face minable reserves, but are distant fromexisting transportation networks. Twenty-four million tons of the Alton field reserves insouthern Utah nearest to Bryce Canyon Na-tional Park have been designated by DOI asunsuitable for mining, Utah is also very farfrom coal demand centers in the Midwest and
Ch. 5—Markets and Projected Demand for Federal Coal ● 97
South-Central United States with c o n s e q u e n thigh transportation costs, Nevertheless, Utahcoal, because of its high heat content and lowsulfur content has penetrated these markets(see fig. 20).
New Mexico
In 1979 New Mexico produced 15.1 milliontons of coal, slightly more than fifth-rankedNorth Dakota. The major market advantagesof coal in New Mexico are the presence ofmoderate reserves of medium-Btu (9,500 to10,500 Btu/lb) surface minable coal in the SanJuan River region, sufficient to supply high-volume, long-term contracts with utilities.The Raton Mesa coal region has high-Btucoal, but a substantial fraction must be un-
derground mined and thus has a relativelyhigh mine-mouth cost per ton. New Mexico iscloser to coal demand centers in Texas thanother Western coal-producing States and thisrepresents a significant potential market thathas as yet been unrealized because some ofthe existing coal leases are not well served bytransportation networks. Extensive develop-ment of coalfields in the San Juan basindepends on construction of the Star Lake-Bisti Railroad. A significant disadvantage ofsome New Mexico coal is that some of themajor coal deposits in the San Juan Riverregion are quite uniformly high in ash content(generally greater than 14 percent) andcleaning to reduce ash adds to the cost ofusing the coal.
The Market Area of Western Coal StatesThe share that each Western coal State
has in fulfilling the demand for coal dependson the extent to which the advantages in theState outweigh the disadvantages relative tothe other Western States and other coal re-gions. Figure 20 shows all the States to whichthe six major Federal coal-producing Statesshipped coal in 1979, The percentage shownin each Sta te on the map indicates how muche a c h F e d e r a l c o a l S t a t e c o n t r i b u t e d t o t o t a lState use of coal. Coal went to every Statewest of the Mississippi River and to sevenStates east of the Mississippi River. In none ofthe States east of the Mississippi River did thecombined contribution of Western coal ex-ceed 37 percent of total coal use, which in-dicates that Western coal has made substan-tial inroads into the central market areas ofthe Midwest coalfields, but has not achievedmarket dominance* over local coal in theseareas. On the other hand, west of the Missis-sippi River, Western coal contributed morethan half of coal use within all but two States,showing a clear market dominance over Mid-
*Note that the term “’market dominance”” is used here torefer to mm] that has a strong cornpeti t ive edge in a certainmarket area. The specific meaning of market dominance ;isused in railroad ra Iemaking is not rneanl.
western coal in these markets. The excep-tions are in Texas, where local lignite has thedominant share of the coal market and inMissouri.
The relative competitive position of the sixWestern coal States can be measured by sev-eral indicators: total coal production, the geo-graphic area where coal is sold, and the per-centage contribution to total State coal use.This information is summarized in table 30.
Wyoming’s market dominance compared tothe other five Western States is evident fromthe data shown on this table. Wyoming hasthe largest level of coal production of anyWestern State producing Federal coal. In ad-dition coal from Wyoming was shipped to thelargest market area (22 States) and in 11 ofthose States Wyoming contributed the largestpercentage of in-State coal use compared tothe other five States. Furthermore, Wyomingcontributed more than half of total in-Statecoal use in eight States, whereas no otherWestern State contributed more than thispercentage in more than one State. Wyomingalso shipped coal to all the Western coal-producing States except Arizona and NewMexico. Wyoming coal’s cost competitiveness

98 . An Assessment of Development and Production Potential of Federal Coal Leases
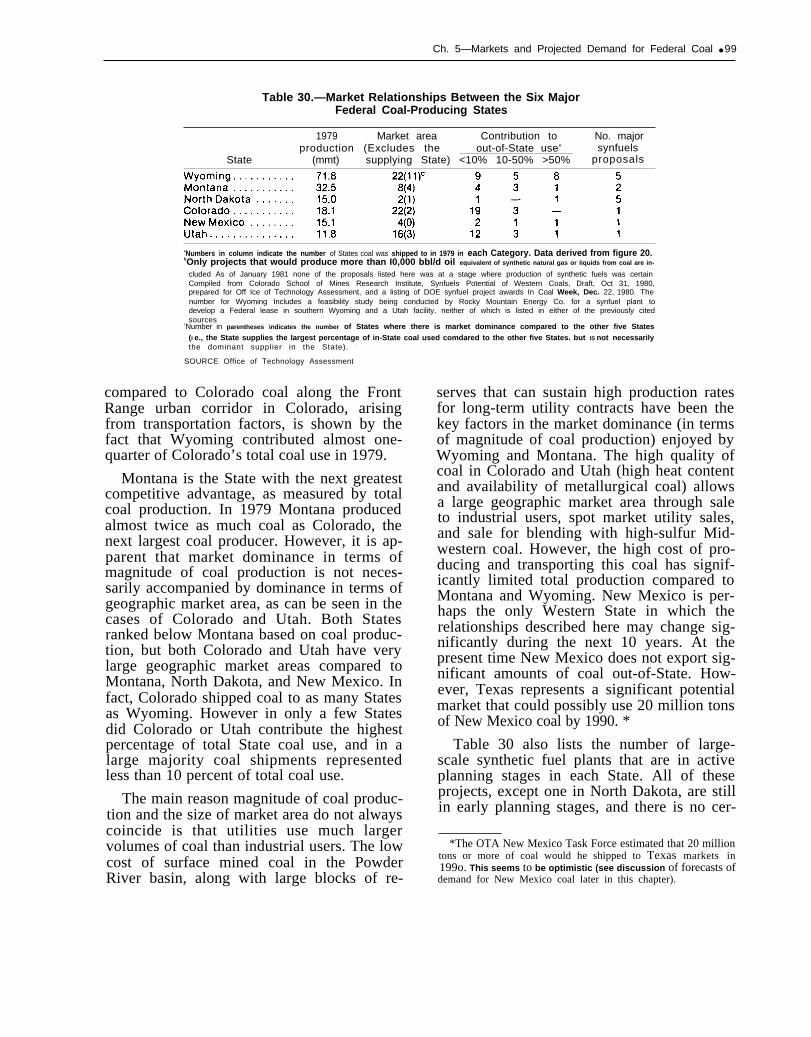
Ch. 5—Markets and Projected Demand for Federal Coal ● 99
Table 30.—Market Relationships Between the Six MajorFederal Coal-Producing States
1979 Market area Contribution to No. majorproduction (Excludes the out-of-State usea synfuels
State (mmt) supplying State) <10% 10-50% >50% proposals
aNumbers in column indicate the number of States coal was shipped to in 1979 in each Category. Data derived from figure 20.bOnly projects that would produce more than I0,000 bbl/d oil equivalent of synthetic natural gas or Iiquids from coal are in-
cluded As of January 1981 none of the proposals listed here was at a stage where production of synthetic fuels was certainCompiled from Colorado School of Mines Research Institute, Synfuels Potential of Western Coals, Draft, Oct 31, 1980,prepared for Off Ice of Technology Assessment, and a listing of DOE synfuel project awards In Coal Week, Dec. 22, 1980. Thenumber for Wyoming Includes a feasibility study being conducted by Rocky Mountain Energy Co. for a synfuel plant todevelop a Federal lease in southern Wyoming and a Utah facility, neither of which is listed in either of the previously citedsources
cNumber in parentheses indicates the number of States where there is market dominance compared to the other five States(I e., the State supplies the Iargest percentage of in-State coal used comdared to the other five States. but IS not necessarilythe dominant supplier in the State). -
SOURCE Office of Technology Assessment
compared to Colorado coal along the FrontRange urban corridor in Colorado, arisingfrom transportation factors, is shown by thefact that Wyoming contributed almost one-quarter of Colorado’s total coal use in 1979.
Montana is the State with the next greatestcompetitive advantage, as measured by totalcoal production. In 1979 Montana producedalmost twice as much coal as Colorado, thenext largest coal producer. However, it is ap-parent that market dominance in terms ofmagnitude of coal production is not neces-sarily accompanied by dominance in terms ofgeographic market area, as can be seen in thecases of Colorado and Utah. Both Statesranked below Montana based on coal produc-tion, but both Colorado and Utah have verylarge geographic market areas compared toMontana, North Dakota, and New Mexico. Infact, Colorado shipped coal to as many Statesas Wyoming. However in only a few Statesdid Colorado or Utah contribute the highestpercentage of total State coal use, and in alarge majority coal shipments representedless than 10 percent of total coal use.
The main reason magnitude of coal produc-tion and the size of market area do not alwayscoincide is that utilities use much largervolumes of coal than industrial users. The lowcost of surface mined coal in the PowderRiver basin, along with large blocks of re-
serves that can sustain high production ratesfor long-term utility contracts have been thekey factors in the market dominance (in termsof magnitude of coal production) enjoyed byWyoming and Montana. The high quality ofcoal in Colorado and Utah (high heat contentand availability of metallurgical coal) allowsa large geographic market area through saleto industrial users, spot market utility sales,and sale for blending with high-sulfur Mid-western coal. However, the high cost of pro-ducing and transporting this coal has signif-icantly limited total production compared toMontana and Wyoming. New Mexico is per-haps the only Western State in which therelationships described here may change sig-nificantly during the next 10 years. At thepresent time New Mexico does not export sig-nificant amounts of coal out-of-State. How-ever, Texas represents a significant potentialmarket that could possibly use 20 million tonsof New Mexico coal by 1990. *
Table 30 also lists the number of large-scale synthetic fuel plants that are in activeplanning stages in each State. All of theseprojects, except one in North Dakota, are stillin early planning stages, and there is no cer-
*The OTA New Mexico Task Force estimated that 20 milliontons or more of coal would he shipped to Texas markets in199o. This seems to be optimistic (see discussion of forecasts ofdemand for New Mexico coal later in this chapter).
100 . An Assessment of Developrnent and Production Potential of Federal Coal Leases
tainty whether, or when, they will be con-structed. North Dakota has a large number ofpossible plants because the reserves are well--suited for conversion to synthetic gas, andwater needed for cooling and conversionprocesses is more readily available than inother Western coal States. Wyoming has alarge number of proposed projects due pri-marily to the availability of reserves in boththe Powder River basin and southern Wyo-ming to support such facilities, but availabil-ity of water is more of a problem than inNorth Dakota. Projects in the active planningstage in the remaining four States range fromone each in Colorado, New Mexico, and Utahto two in Montana.
The discussion of synthetic fuels earlier inthis chapter indicated that significant levelsof coal production for synthetic fuels wereunlikely before 1990. The capacity in 1990 of
the only two projects that were judged byOTA to have a good chance of being in opera-tion before 1990 (the Great Plains Gasifica-tion Project in North Dakota and PanhandleEastern’s proposed gasification project innortheastern Wyoming) is 12 million tons, butit is uncertain whether either would be pro-ducing at full capacity by 1990.32 Levels ofcoal production for synthetic fuels couldbecome significant after 1990. Coal consump-tion of currently proposed commercial-scalesynthetic fuel plants that would use coal fromthe major Federal coal States would be 95million tons per year at full capacity. Attain-ment of full capacity might be reached in themid to late 1990’s.
‘- Boulding and Pederson, op. cil.“Calculated from tables VI-2 and VI-3, NCA. NCA L(mg-Term
F(jrecust, op. cit.
Projections of Demand for Western Coal:1980-90 and 1990=2000
There is no way to predict with certaintythe demand for coal from the major Federalcoal States over the next 10 years, but it ispossible to estimate demand. Numerous esti-mates (usually called forecasts or projec-tions) concerning demand for coal from theWest have been made for the 1985-90 periodthat was the focus of OTA’s analysis of ex-isting Federal leases.
Production and Demand Forecasts andProduction Goals
Coal forecasts fall into two major catego-ries: 1) production projections that are basedon production commitments under existingcontracts and potential production based onindustry plans to open new mines and expandproduction at existing mines, and 2) demandprojections based on computer models thatassume certain conditions in coal marketsand allocate coal production to different coalregions based on varying assumptions aboutfactors such as mining and transportationcosts and electrical growth rates. Production
forecasts are most useful for evaluatingchanges in coal production over the shortterm (up to 5 years or so in the future)whereas demand forecasts are most usefulfor evaluating intermediate and long timeperiods (greater than 5 years). Each ap-proach has its own advantages and limita-tions.
Production Forecasts
These forecasts are more directly relatedto the “real” world because they are basedon contractual commitments and specific in-dustry plans. Production forecasts based onindustry plans for new mine openings andmine expansions are frequently high becausesuch plans are based on individual companyexpectations of the share of market demandthey will be able to capture. Some of the ex-pected market share may be captured byother competitors and consequently actualproduction may be less than productionbased on industry plans. Also, coal contractsusually specify a range of possible delivery
Ch. 5—Markets and Projected Demand for Federal Coal - 101
rates. If electric utilities need less than themaximum amount contracted for, then fore-casts based on contracts will overstate pro-duction. For example, in the Powder Riverbasin of Wyoming, deliveries to utilities in1979 and 1980 averaged about 5 percentlower than would be expected based on con-tractual commitments. ” Production forecastscan change quite rapidly in response tochanged perceptions by the coal industry oflikely demand. For example the projectedcapacity for coal mines in Carbon, Sevier,Wayne, and Emery counties in Utah for theyear 1985 dropped from 45.2 million tons in a1977 survey to 26.5 million tons in a 1979survey .3’ One value of production forecasts isthat they can serve as an indicator of thecapacity of the coal industry to respond tochanges in demand.
Demand Forecasts
Based on computer models, these forecastsare not very reliable for making point fore-casts for a single year because small errorsin assumptions used in making the forecastcan result in large differences in projectedamounts. On the other hand, computer mod-els are very useful in evaluating the sensitiv-ity of demand for coal to changes in condi-tions such as the electrical growth rate and inidentifying possible ranges in demand inresponse to different conditions. The range ofpossible demands generated by computermodels using different assumptions can be sogreat that ultimately identification of a “mostlikely” range of demands must be based onhuman judgments by individuals knowledge-able about current coal market conditionsand an understanding of the impact that ex-isting trends and possible changes in thesetrends will have on future demand. Evalua-tion of forecasts from a number of differentsources allows the development of a range of“most likely” demands in which a higherdegree of confidence can be placed than the
“Personal communication with Gary Glass, Geological Sur-vey of Wyoming, September 1981.
“The 1977 and 1979 Keystone Coal Surveys reported in CoalAge, February 1978; and Coal Age, February 1980, respective-ly.
range of possible demands that may be gen-erated by a single computer model.
An important element in OTA’s evaluationof the production potential from existingFederal coal leases was to identify a mostlikely range of demands for coal from themajor Western coal regions and States withFederal leases. This identification of prob-able ranges in demand generally involved afour step process: 1) review of existing pro-jections from different sources, 2) develop-ment of independent projections by OTAbased on evaluation of market conditions inthe specific regions or States of interest, 3)development of estimates by OTA State taskforces based on review of projections iden-tified in steps 1 and 2 and/or the developmentof new estimates representing the collectivejudgment of task force members, and 4) fur-ther evaluation and modification of task forceestimates by OTA to identify a range of de-mands which could be compared to other esti-mates of production potential from existingFederal leases. *
Production Goals
OTA also paid particular attention to twosets of forecasts that became available aftermost of OTA’s task force meetings had beencompleted: 1) the August 1980 preliminarycoal production goals and the January 1981final production goals developed from DOE’sNational Coal Model36 and 2) refinements tothe National Coal Model forecasts developedby ICF, Inc., using its Coal Electric UtilityModel. 37 DOE’s final production goals were
...——*Special market analyses were prepared for OTAA on the
Powder River basin and southern \\’yoming, Utah, and Col-orado. The Utah, Wyoming. Colorado, and New Mexico taskforces each discussed various ranges of likely demand in theyears 1985 and 1990 ([he bases for these pr[)j(:(t]ons ,] re surl-ma rized in footnotes in table 31 ]. In most instances () I’A mt Nil.fied Ihe ranges discussed by the task forces to in(lude ;I widerrange for purposes of a na] yzing pro(iuc! ion pllten I i,]] from ex-ist in~ Federal leases,
‘ll+-eJirnin(~ry Nfjtionrd and ~e~ion[li CCJ(I/ F’r(j{iu((i{)n (;~MIlsfor 198s, I!)!)(), (ln(i IWS (Washington, 1).(; .: 1)OE, Aug. 7, 19w)]:and The 1980 Bienniuf Updo te t)f N(1 tion(ll Region(]l C(MII Pr(Niuclion Go(lIs for 198,5. 1990, (]nd 1995 IWashington, 1). (~.: I) OF,January 1981.)
‘“The ICF forecasts are reported in An[l~\’sJ+ (in(~ (;rit)(~ue of
the I)epnrtment {)f Enprgv’s Augu\t 7, I !]80 Heport en li(lf~[i ‘‘Pre-

102 - An Assessment of Development and Production Potential of Federal Coal Leases
increased substantially over the preliminarygoals (see tables 31 and 32). The final na-tional goals average 16.6, 15.7, and 26.0 per-cent higher than the preliminary goals for theyears 1985, 1990, and 1995 respectively. Thefinalvery(seefinaltonsthan
DOE goal for 1985 (1.118 million tons) isclose to both the ICF and NCA forecaststable 32), but the 1990 and 1995 DOEgoals (1,620 million and 2,214 millionrespectively) are considerably higherrecent Projections from other sources
for the same time periods. The 1990 DOEfinal goal is almost 300 million tons higherthan the highest recent forecast shown intable 32 and the 1995 DOE final goal is almostas high as the high “likely” projection for2000 shown on table 32.
The reason for the increases from the pre-liminary to the final DOE production goals ap-pear to be primarily a clearer conceptualdefinition of the relationship between coalproduction goals and other coal productionforecasts. As the report on the DOE finalgoals says:
The goals developed here are based on na-tional energy needs, existing and emergingnational and international policies and laws
Continued from p. 101liminury AIotionul ond Ilegion(d f.lxJl Production Gools for 1985.1990 ond 1995 (Washington D. C.: ICF, Inc., October 1980). ICForiginally developed the National Coal Model that is used byDOE 10 develop production goals., and has since refined thismodel into the Coal Electric Utility Llodel (CEUM). ICF’S cri-tique of the DOE preliminary goals identified a number ofstructural deficiencies in the model, and deficiencies in dataand assumptions used in the mode]. Examples of structuraldeficiencies include such things as coal production and de-mand regions not coinciding with DOI coal production regionsnecessitating often arbilrary allocation of model outputs be-tween regions, and distortion of transportation cost due tousing average distances between large regions (e. g., transpor-tation costs for southern Wyoming are calculated using anaverage distance from the Powder River basin. ) Examples ofdeficiencies in data and assumptions include out-of-date coalreserve data in several regions, and unrealistically lowassumptions about increases in transportation costs (see foot-note 9). The ICF forecasts correct many of these problems,although ICF emphasizes in its analysis that no modelingforecast can be considered definitive, and that the results offorecasts must be interpreted and used with judgment. Some ofthe deficiencies pointed out by ICF were corrected in preparingthe final goals (i.e., analysis was based on DOI supply regionand higher transportation costs were used) but other changesin assumptions were made that makes comparisons betweenthe ICF base case and DOE final production goals more dif-ficult.
that affect coal demand and supply, andmarket conditions, By comparison, energyforecasts are generally based on expectedmarket conditions and energy laws and regu-lations. Since many of the assumptions un-derlying the production goals are based onpolicy initiatives to expand domestic coalproduction, the goals are likely to exceedcoal production forecasts ., , Such a rela-tionship is entirely appropriate.
The assumptions that were used in setting thepreliminary production goals appeared con-sistent with a forecasting approach ratherthan a production goal approach to modeling.Thus, the difference between the final andpreliminary goals can be attributed mostly toassumptions concerning implementation ofGovernment policies that will increase de-mand for coal. * For example, the final pro-duction goals assume 1 million bbl/d oil equiv-alent of coal-based synfuels production in1990 (in accordance with goals set when theSynthetic Fuels Corp. was established) andstrict enforcement of the 1990 deadline inPIFUA for utility and industrial boiler conver-sions from gas to coal. It does not appear like-ly that these goals will be met by 1990. Thesynfuels assumptions in the final productiongoals substantially exceed those in recentcoal production forecasts (see Synthetic Fuelssection), and section 301(a) (the off gas re-quirement) of PIFUA has been repealed byCongress, although rising prices for naturalgas will serve as as incentive for conversionfrom gas to coal.
The final production goals are listed inmost tables and figures in this chapter toshow their relationship to other productionforecasts, but are not considered in detail inthe evaluation of the likely range of coal de-mand in the major Federal coal States be-cause the assumptions on which the finalgoals were developed probably overstate theimpact of Government policies on increasingoverall demand for coal in the UnitedStates.** However, the preliminary produc-
——. —‘See p. 79 for additional discussion of the conceptual distinc-
tion between Government policies that change the frameworkof the market system and policies that influence the marketsystem directly to increase demand for coal.
**it should be noted that in some instances (Colorado in par-ticular) the final production goals are lower than the pre-
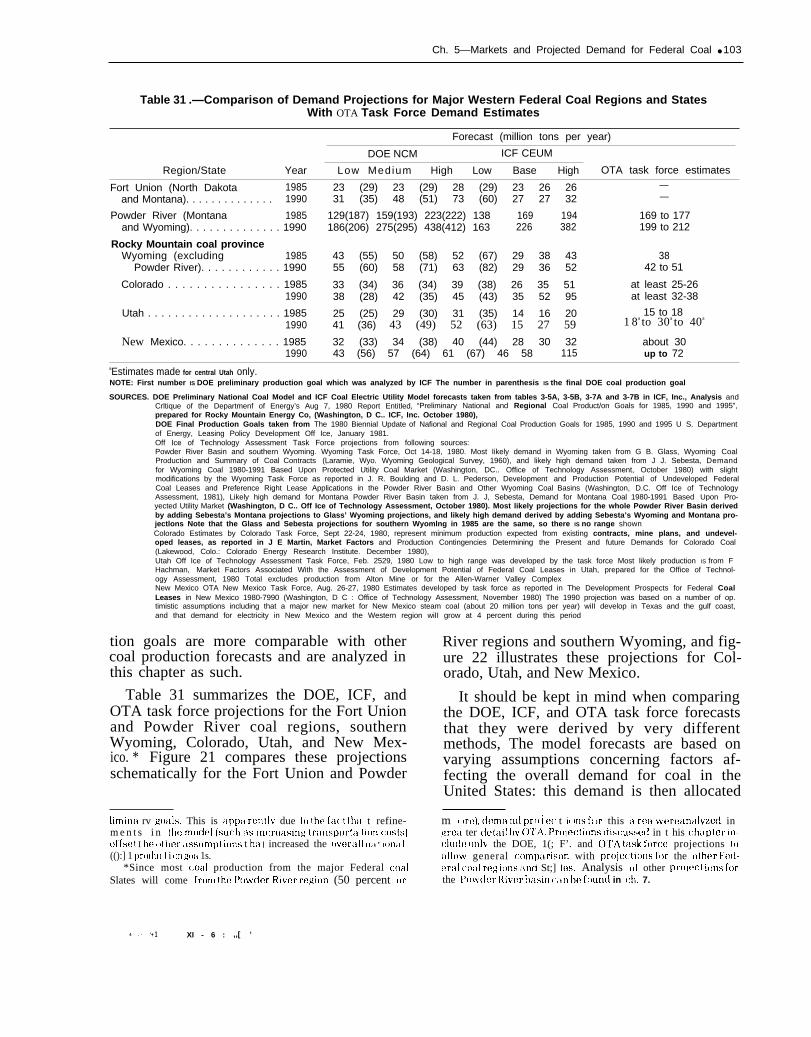
Ch. 5—Markets and Projected Demand for Federal Coal ● 103
Table 31 .—Comparison of Demand Projections for Major Western Federal Coal Regions and StatesWith OTA Task Force Demand Estimates
Forecast (million tons per year)
DOE NCM ICF CEUM
Region/State Year Low Medium High Low Base High OTA task force estimates
Fort Union (North Dakota 1985 23 (29) 23 (29) 28 (29) 23 26 26 —and Montana). . . . . . . . . . . . . . 1990 31 (35) 48 (51) 73 (60) 27 27 32 —
Powder River (Montana 1985 129(187) 159(193) 223(222) 138 169 194 169 to 177and Wyoming). . . . . . . . . . . . . . 1990 186(206) 275(295) 438(412) 163 226 382 199 to 212
Rocky Mountain coal provinceWyoming (excluding 1985 43 (55) 50 (58) 52 (67) 29 38 43 38
Powder River). . . . . . . . . . . . 1990 55 (60) 58 (71) 63 (82) 29 36 52 42 to 51
Colorado . . . . . . . . . . . . . . . . 1985 33 (34) 36 (34) 39 (38) 26 35 51 at least 25-261990 38 (28) 42 (35) 45 (43) 35 52 95 at least 32-38
Utah . . . . . . . . . . . . . . . . . . . . 1985 25 (25) 29 (30) 31 (35) 14 16 20 15 to 181990 41 (36) 43 (49) 52 (63) 15 27 59 1 8a to 30a to 40a
New Mexico. . . . . . . . . . . . . . 1985 32 (33) 34 (38) 40 (44) 28 30 32 about 301990 43 (56) 57 (64) 61 (67) 46 58 115 up to 72
aEstimates made for central Utah only.NOTE: First number IS DOE preliminary production goal which was analyzed by ICF The number in parenthesis IS the final DOE coal production goal
SOURCES. DOE Preliminary National Coal Model and ICF Coal Electric Utility Model forecasts taken from tables 3-5A, 3-5B, 3-7A and 3-7B in ICF, Inc., Analysis andCrltique of the Departmenf of Energy’s Aug 7, 1980 Report Entitled, “Preliminary National and Regional Coal Product/on Goals for 1985, 1990 and 1995”,prepared for Rocky Mountain Energy Co, (Washington, D C.. ICF, Inc. October 1980),DOE Final Production Goals taken from The 1980 Biennial Update of Nafional and Regional Coal Production Goals for 1985, 1990 and 1995 U S. Departmentof Energy, Leasing Policy Development Off Ice, January 1981.Off Ice of Technology Assessment Task Force projections from following sources:Powder River Basin and southern Wyoming. Wyoming Task Force, Oct 14-18, 1980. Most Iikely demand in Wyoming taken from G B. Glass, Wyoming CoalProduction and Summary of Coal Contracts (Laramie, Wyo. Wyoming Geological Survey, 1960), and likely high demand taken from J J. Sebesta, Demandfor Wyoming Coal 1980-1991 Based Upon Protected Utility Coal Market (Washington, DC.. Office of Technology Assessment, October 1980) with slightmodifications by the Wyoming Task Force as reported in J. R. Boulding and D. L. Pederson, Development and Production Potential of Undeveloped FederalCoal Leases and Preference Right Lease Applications in the Powder River Basin and Other Wyoming Coal Basins (Washington, D.C. Off Ice of TechnologyAssessment, 1981), Likely high demand for Montana Powder River Basin taken from J. J, Sebesta, Demand for Montana Coal 1980-1991 Based Upon Pro-yected Utility Market (Washington, D C.. Off Ice of Technology Assessment, October 1980). Most likely projections for the whole Powder River Basin derivedby adding Sebesta’s Montana projections to Glass’ Wyoming projections, and likely high demand derived by adding Sebesta’s Wyoming and Montana pro-jectlons Note that the Glass and Sebesta projections for southern Wyomlng in 1985 are the same, so there IS no range shownColorado Estimates by Colorado Task Force, Sept 22-24, 1980, represent minimum production expected from existing contracts, mine plans, and undevel-oped leases, as reported in J E Martin, Market Factors and Production Contingencies Determining the Present and future Demands for Colorado Coal(Lakewood, Colo.: Colorado Energy Research Institute. December 1980),Utah Off Ice of Technology Assessment Task Force, Feb. 2529, 1980 Low to high range was developed by the task force Most likely production IS from FHachman, Market Factors Associated With the Assessment of Development Potential of Federal Coal Leases in Utah, prepared for the Office of Technol-ogy Assessment, 1980 Total excludes production from Alton Mine or for the Allen-Warner Valley ComplexNew Mexico OTA New Mexico Task Force, Aug. 26-27, 1980 Estimates developed by task force as reported in The Development Prospects for Federal CoalLeases in New Mexico 1980-7990 (Washington, D C : Office of Technology Assessment, November 1980) The 1990 projection was based on a number of op.timistic assumptions including that a major new market for New Mexico steam coal (about 20 million tons per year) wiII develop in Texas and the gulf coast,and that demand for electricity in New Mexico and the Western region wiII grow at 4 percent during this period
tion goals are more comparable with othercoal production forecasts and are analyzed inthis chapter as such.
Table 31 summarizes the DOE, ICF, andOTA task force projections for the Fort Unionand Powder River coal regions, southernWyoming, Colorado, Utah, and New Mex-ico. * Figure 21 compares these projectionsschematically for the Fort Union and Powder
Iim)n:l rv R(xIIs. This is i]pp;i renllv due I() the f<)ft th:] t refine-m e n t s i n the rn(dei (such i)s in(’reiising [ransport:l (ion costs)offset I h[; other [~ssumpt ions t h[] I increased the twer:~ll n:) t ion:] I(():] 1 pr{du(’t i t )n g(HI 1s.
*Since most coal production from the major Federal coalSlates will come from the Powder River region (50 percent or
River regions and southern Wyoming, and fig-ure 22 illustrates these projections for Col-orado, Utah, and New Mexico.
It should be kept in mind when comparingthe DOE, ICF, and OTA task force forecaststhat they were derived by very differentmethods, The model forecasts are based onvarying assumptions concerning factors af-fecting the overall demand for coal in theUnited States: this demand is then allocated
m ( )rc), dcma nd pro j e(’ t i( )ns f[ )r this ii rea k~erc tlllil Ipzcd in~re;l ter det:~il hv ()’I’A, Pr[~je(:tions discusse(i in t his t:haplcr in-(lu(ie (Jnlv the DOE, 1(; F’. and ()’I’A t[~sk ft)rce projections tc){]IIOW general (:t)mparis{)n with projections” for the other F’e(l-[?r[]l c[){~l re~ ions :~nd St;] tes. Analysis of other pr[~jecl ions forthe P{)w(ier Ri\(:r Ix]sin ([in ho foun(i in (’h. 7.
4 . - ‘+ 1 XI - 6 : ,,[ ‘

104 ● An Assessment of Development and Production Potential of Federal Coal Leases
Table 32.–Demand and Production Forecasts for Coai for the United States: 1985-2000(millions of tons)
1985 1990 1995Low Medium High Low Medium High Low Medium High 2000
EIA production forecasts (1979). . . . 1,129 1,130 1,129 1,305Council on Environmental Quality
(1979) . . . . . . . . . . . . . . . . . . . . . . . – – – –Exxon (1979). . . . . . . . . . . . . . . . . . . . – – – –DOE preliminary production goals
(1980) . . . . . . . . . . . . . . . . . . . . . . 880 963 1,080 1,089ICF CEUM forecasts (1980) . . . . . . . 915 1,016 1,082 1,122Data Resources, Inc. (1980) . . . . . . . – 987 – –National Coal Association (1981) . . 878 1,015 1,131 1,092DOE final production goals (1981)b . 1,040 1,118 1,245 1,270
1,343 1,353 1,592 1,715 1,718
— — — — —1,285 – — – —
1,375 1,762 1,238 1,718 2,3221,300 1,791 1,380 1,756 2,9761,290 – — 1,617 —1,345 1,540 — — —1,620 1,986 1,519 2,214 2,766
—
899-1850a2,219
——
1,931—
aRange is for low and high energy growth scenarios analyzed by CEQ. Numbers are recalculated from table 6 using an average of 20 million Btu/ton rather than the 23
million Btu/ton used by CEQ in order to account for declines in average coal heat content as Western coal production increases. The 20 million Btu/ton is taken fromthe national average projected in 1990 by Congressional Research Service project Interdependence: U.S. and World Energy Outlook Through 1990, Senate Committeeon Energy and Natural Resources, Pub. No. 95-31 (Washington, D. C.: U.S. Government Printing Office, 1977).
blncluded for comparison to forecasts. See discussion in text for difference between the DOE production goals and production forecasts.
I SOURCES (in order listed in table):Table 4.26, V.III Energy Information Administration, Annual Report to Congress, 1979 (Washington, DC.: U.S. Government Printing Office, 1980).Council on Environmental Quality, The Good News About Energy (Washington, DC.: U.S. Government Printing Office, 1979).Exxon Co., U.S. Energy Outlook 1980-2000 (Houston, Tex. Exxon USA, December 1979), p. 12.U.S. Department of Energy, Preliminary National and Regional Coal Production Goals for 1985, 1990 and 1995 (Washington, DC.: DOE, Aug. 7, 1980).ICF, Inc. Analysis and Critque of the Department of Energy’s August 7, 1980 Report Ent/tied “Preliminary National and Regional Coal Production Goals for1985, 1990 and 1995” prepared for Rocky Mountain Energy Co. (Washington, D, C.: ICF, inc. October 1980),Data Resources, Inc., production forecast as reported in Coal Week, Sept. 22, 1980.National Coal Association NCA Long-Term Forecast (Washington, D. C.: NCA, March 1981).U.S. Department of Energy, The 1980 Biennial Update of National and Regional Coal Product/on Goals for 1985, 1990, and 1995 (Washington, D.C., DOE,January 1981).
to different regions or States. A fundamentalweakness of all computer models is that theyare least accurate when results are disag-gregate to small geographic regions. Thereason for this is that when modeling complexsystems, simplifying assumptions must bemade. At the aggregate level, simplifyingassumptions that may distort results one wayor another tend to cancel each other out. Atthe specific geographic level, small changesin assumptions may create large shifts in pro-jected demand between regions.38 It must alsobe realized that models reflect the assump-tions, perceptions and biases of the modelmanager. In addition, models tend to seek op-timal (least cost) solutions to fuel procure-ment and the entire system tends to approacha general equilibrium solution. Rarely, ifever, are these conditions totally achieved inreality.
The OTA task force estimates, on the otherhand, were developed based on analysis andjudgments by a group of people familiar withthe effect that specific conditions in the
38 Additional discussion of this problem can be found in theICF report cited previously and also in Energy and Environmen-tal Analysis, Inc., Feasibility of Using Coal Market ProjectionsTo Appraise Potential Production of Federal Coal Leaseholds,draft report prepared for OTA, 1980.
region or State could have for the demand forcoal from that area. The advantage of this ap-proach is that it reflects a sensitivity to localconditions that a computer model cannothave. The disadvantage of this approach isthat events or conditions outside of the Stateor region might affect demand for coal fromthat region in ways not anticipated by thetask force. There is also a possibility that in-dividuals closely associated with develop-ment in a region or State may underestimatethe effects of competition from another regionor State.
The value of looking at both kinds of fore-casts is that the two can be used as a checkagainst each other. If several different fore-casts are in close agreement, then it can beexpected with a reasonably high level of con-fidence that actual production will be close tothe levels forecasted. On the other hand, ifdifferent forecasts of the “most likely” levelof production differ substantially, then acloser look at the forecasts is merited to try tounderstand the reasons for the differences.
Given the inherent uncertainty in fore-casts, it is necessary to identify a range* to
* I t should be noted that this range is distinctly different fromthe kinds of ranges developed by computer models such as the
Ch. 5—Markets and Projected Demand for Federal Coal . 105
account for contingencies and factors thatcannot be predicted, The rest of this sectionexamines more closely the different forecastsin the regions and states shown in figures 21and 22, identifying, where possible, the rea-sons for divergence between the forecasts.
Fort Union Region
Virtually all production from this regioncomes from North Dakota; only 0.5 milliontons were produced in the Montana portion ofthe Fort Union region in 1979, compared to15.0 million tons in North Dakota. The DOEand ICF forecasts are in close agreement in1985 (see fig. 21) but diverge widely in 1990with the ICF high forecast nearly the same asthe DOE low forecast. OTA did not convene atask force for this region, so no projectionsare available for comparison, but OTA’sevaluation of existing leases found that 30million tons would be needed to meet the re-quirements of existing and new coal conver-sion facilities currently planned or under con-struction. Given the leadtime necessary toconstruct these large facilities, it appearsthat demand for Fort Union coal in 1990 islikely to be closer to the ICF forecast than thehigher DOE forecasts.
Powder River Basin
All three forecasts show quite good agree-ment for 1985 (see fig. 21) with the ICF basecase of 169 million tons exactly the same asthe OTA task force most likely productionestimate, and DOE’s medium forecast 10 mil-lion tons lower. However, OTA’s likely highdemand in 1985 is considerably lower thanthe DOE and ICF high forecasts. In 1990 thereis considerable divergence between the three
DOE and ICF forecasts shown in table 31, Tbese ranges are in-dicative of the sensitivity of demand to changes in assump(i(ms(ha I are plugged into the model. but are not necessarily inciica-tive of what is likely to happen in the real world. Even though(he low to high ranges identified bV OTA for analysis of exis[ingh’ederal leases are narrower than the model ranges, it is Iikel}that (iemand for 1985 and 1990 w1lI be within the ran~e. After1990 unrerta inlies and ran~es in forecasts increase r(Jnsider-ablv (see final section of this chapter]; OTA did not allempt todevelop m[)s t likdv ranges of dema n(i for the post- I {)90 period,
forecasts, with OTA’s likely high estimate of212 million tons being 14 million tons lowerthan the ICF base case, and 63 million tonslower than DOE’s medium forecast. The mainreason the DOE forecast is so much higherthan the ICF forecast is that the DOE fore-casts included unrealistically low increasesin transportation costs that were modified inthe ICF forecast. OTA used the DOE mediumforecast as its high-demand scenario foranalysis of production potential of leases,even though it is probably beyond the rangeof “likely” high production levels. (See ch. 7for further discussion of demand for PowderRiver basin coal,)
Southern Wyoming
The OTA task force and ICF projections of38 million tons for southern Wyoming are ex-actly the same in 1985 (see fig. 21 ) and areconsiderably lower than DOE’s midrangeforecast of 50 million tons, In fact, DOE’s mid-range forecast for 1985 is almost the same asthe OTA likely high estimate of 51 million tonsfor 1990. The primary reason for the highDOE numbers is that the DOE model consider-ably understates transportation costs fromsouthern Wyoming because distances in themodel are calculated using a centroid locatedin the Powder River basin, In 1990, DOE’s lowforecast is still higher than ICF’s high fore-cast (for the reason just mentioned) and theOTA range of likely to likely high productionfalls within the midrange to upper range ofthe ICF forecast. For reasons that are notclear, the ICF base forecast drops below its1985 forecast (from 38 million to 36 milliontons) and is thus lower than the OTA taskforce projection.
Colorado
The DOE and ICF forecasts for 1985 arevery close (36 million and 35 million tonsrespectively); the OTA task force estimate inthis case is an estimate of minimum demand.For 1990, the OTA task force estimate of 32million to 38 million tons is comparable to theICF and DOE low forecasts, The ICF baseforecast is considerably higher than the DOE

-. —
106 ● An Assessment of Development and Production Potential of Federal Coal Leases
400
300
200
100
Figure 21 .—Demand Projections for the Fort Union and Powder River Coal Regionsand Southern Wyoming, Compared to OTA Task Force Estimates
1985 1990 1985 1990 1985 1990
Fort Union region a Powder River basin Southern Wyoming
aNo OTA protection
SOURCE Table 30
medium forecast (52 million v. 42 milliontons). The OTA task force estimate was con-servative; and although the DOE and ICFmodels may not be sensitive to the especiallydisadvantageous situation in Colorado withrespect to transportation costs, as discussedearlier in this chapter, demand in 1990 maybe closer to the DOE range than the OTArange.
Utah
The forecasted ranges by DOE and ICF donot overlap at all in 1985. The OTA task force
estimated that 1985 production in Utah wouldcome from mines currently in operation orconstruction. In 1980, the State geologicalsurvey estimated planned 1985 productionwould be between 15 million to 18 milliontons. Probably the ICF base of 16 million tonsand the DOE medium forecast of 29 milliontons is a reasonable low to high range. In1990 the ICF base projection and OTA mis-estimate are close (27 million and 30 milliontons respectively) but are considerably lowerthan the DOE midrange forecast of 43 milliontons. The DOE medium forecast is quite closeto the OTA high estimate of 40 million tons.

Ch. 5—Markets and Projected Demand for Federal Coal ● 107
Figure 22.—Demand Projections for Colorado, Utah, and New Mexico,Compared to OTA Task Force Estimates
—
I 51
95
67
52
42
Key:
DOE final production goals
ICF Coal Electric Utility Model
14 15 l a
40
3432 30
‘-J9
1 -44
115
i 1 I I I I I1985
Colorado
aFigures shown are low ranges.bOTA demand estimates for-central Utah onlycFigure represents maximum likely demand.
SOURCE Table 30
New Mexico
The ICF base forecast and the OTA esti-mate in 1985 are exactly the same (30 milliontons) and 4 million tons lower than the DOEforecast, which indicates good agreementamong all three forecasts. In 1990 the DOEand ICF forecasts are very close (57 millionand 58 million tons respectively) but are con-siderably lower than the OTA task force esti-mate of 72 million tons. The OTA task forceestimate was admittedly an optimistic esti-mate, and assumed that in the 1990’s NewMexico would be shipping 20 or more milliontons of coal to Texas markets. A substantialportion of Texas exports would come fromcaptive mines. The OTA task force estimatehas been categorized in table 31 as a poten-
Utahb New Mexico
tial high production level rather than a “mostlikely” level of production. If it is assumedthat New Mexico exports a more modest levelof 10 million tons per year to the South-Cen-tral States in 1990, the OTA estimate woulddrop to 62 million tons, which is close to theDOE and ICF projections.
Comparisons of ForecastsThe comparisons between the three sets of
forecasts for the major Federal coal regionsand States allow a few generalizations. First,compared to the DOE and ICF forecasts, theOTA task force estimates are quite consist-ently lower than, or near the lower of the mid-range forecasts of the two models. Althoughthe specific reasons for this vary, this is prob-

108 . An Assessment of Development and Production Potential of Federal Coal Leases
ably generally because the OTA task force es-timates are more sensitive to some of the fac-tors discussed earlier in this chapter thathave weakened the competitive position ofWestern coal. Another reason is that theOTA task forces quite uniformly did not con-sider synthetic fuels or foreign exports to besignificant sources of demand before 1990.Should demand from these sources material-ize to a greater extent than expected by thetask forces, demand might be higher than the“most likely” levels estimated. However, in-clusion of the higher midlevel forecasts fromother sources increases the upper range ofthe “most likely” estimates sufficiently thatpossible demand from these sources is likelyto be adequately accounted for. A secondgeneralization is that the 1990 forecasts fromall sources tend to have wider ranges thanthe 1985 forecasts. This can be attributed tothe higher levels of uncertainty in the factors
affecting demand 10 years from now com-pared to 5 years from now.
Demand for Western Coal: 1990=2000
Forecasts for the demand for Western coalafter 1990 have a much higher level of uncer-tainty than the period from 1980 to 1990, andOTA has not tried to conduct any quantitativeanalysis for the 1990’s. However, a numberof demand forecasts are available for theUnited States through 2000, and these can beused to get a general idea of possible trendsand development through to the end of thiscentury.
Table 32 shows eight forecasts made in thelast few years for total U.S. coal productionin 1985, 1990, 1995, and 2000. Elements ofthese forecasts are compared schematicallyin figure 23. Also shown in figure 23 for 1985
aColorado
Figure 23.– Demand and Production Forecasts for the United States: 1985-2000 andthe Six Major Federal Coal States:a 1985-90
3,000
2,500
2,000
1,500
1,000
1985 1990 1995 2000
Key: Year
Range of “most likely” forecasts ❑ Range of low and high forecasts
CEQ Council on Environmental Quality EIA Energy Information AdministrationDRI Data Resources, Inc. ICF ICF Coal Electric Utility ModelDOE Dept. of Energy National Coal Modelc NCA National Coal Association
, Montana. New Mexico, North Dakota, Utah, and Wyomingblntermediate high and Iow forecasts from the various sources not shown.cDOE’s 19S0 preliminary production goals are shown here rather than the final goals because they are more comparable with other production forecasts See discussionp 100
SOURCE Table 32.
Ch. 5—Markets and Projected Demand for Federal Coal ● 109
and 1990 are the DOE and ICF forecasts forthe six major Federal coal States combined.From 1990 to 2000 both the range of “mostlikely” forecasts in figure 23 (shaded) and therange of low to high increase greatly, reflect-ing the greater uncertainties inherent in fore-casting over longer periods of time. In fact thelow forecast in 2000 (899 million tons) madeby the Council on Environmental Quality(CEQ), is lower than the lowest medium pro-jection in 1985 (963 million tons by DOE) (seetable 32). The CEQ forecast is based on a low-energy growth scenario in which conserva-tion is the main focus of national energypolicy.
Electrical growth rates after 1990 are gen-
erally projected to be similar to or lower thangrowth projected for the 1980-90 decade. Forexample, Exxon’s projection of 5.3 percentfrom 1978 to 1990 drops to 2,9 percent from1990 to 2000. ICF projects electrical growthrate continuing at 3.0 percent from 1990 to1995. Consequently, according to these pro-jections of electrical growth rate, rates of in-crease in coal demand for utility use can beexpected to be somewhat lower or about thesame in the last decade of this century, al-though conversion of oil and gas to coal may
offset lower overall electrical growth rates.
Significant areas of potential new demandfor western coal after 1990 include: 1) syn-thetic fuels, 2) industrial boilers, and 3) for-eign export. Possible (but not necessarilyprobable) levels of demand for Western coalfor these uses after 1990 could total on theorder of 250 million tons, which is more thanthe total of 231 million tons produced in theWest in 1979. Coal consumption for syntheticfuels plants could be around 100 million tons
(see p. 100), Incremental demand for indus-trial boilers from 1990 to 2000 in the wholeUnited States could be on the order of 100million tons (assuming the 7-percent growthin demand projected by NCA from 1979 to
1990 continues) of which perhaps half mightbe supplied by the West, Foreign exportscould possibly range from 50 million to 100million tons,
Most of the projections shown in table 32are not disaggregated to a level that allows aclose look at trends in forecasted productionfrom the six major Federal coal States, butmost forecasts make a breakdown betweenproduction from the West and East. Sometrends are evident when Western coal pro-duction is translated into percentage of totalU.S. coal production (see table 33). All theforecasts show a steady increase in theWest’s share of total U.S. coal production be-tween 1985 and 2000. A significant part ofthis increase is due to the fact that moreWestern coal must be mined to make a nequivalent contribution to U.S. energy needscompared to Eastern coal. For example, theCEQ forecast did not take this into account,and adjusting their forecast to correct for thelower heat content of Western coal increasedCEQ’s low coal demand scenario in 2000 from782 million to 899 million tons (see footnote,table 32).
A comparison of the different forecasts forany given year in table 33 shows that there isa considerable range in the percentage that isprojected to come from the West. In 1985 theWest’s share of total U.S. production is pro-jected to range from 33 to 43 percent and in1990 f rom 38 to 49 percen t . The Energy In-f o r m a t i o n A d m i n i s t r a t i o n p r o d u c t i o n f o r e -cas ts , which are the lowest for these 2 yearsa g r e e w i t h t h e m o s t r e c e n t f o r e c a s t i n t a b l e33 made by NCA and i t seems l ike ly tha t theg r o w t h r a t e o f W e s t e r n c o a l p r o d u c t i o n w i l li n c r e a s e a t a l o w e r r a t e t h a n t h e v a r i o u smodel forecasts (DOE, ICF, and DRI) indicate.In 1995 the forecasted percentage of West-ern coal product ion begins to converge ( f rom47 to 52 percent) with a mid point of 49.5 per-c e n t a n d i n 2 0 0 0 W e s t e r n c o a l p r o d u c t i o n i sp r o j e c t e d t o e x c e e d s o p e r c e n t o f U . S . p r o -d u c t i o n .
In tab le 33 the numbers in parentheses in-d i c a t e t h e p e r c e n t a g e o f t o t a l U . S . c o a l p r o -d u c t i o n t h a t w o u l d c o m e f r o m t h e s i x m a j o rFederal coal Sta tes . I t i s c lear f r o m t h e s epercentages that these States account formost of the product ion f rom the West , bu t theDOE and ICF forecas ts show product ion f rom

.
110 ● An Assessment of Development and Production Potential of Federal Coal Leases
Table 33.—Forecasted Changes in Contribution ofWestern Coal to Total U.S. Production
SOURCE. See table 32
t h e m a j o r F e d e r a l c o a l S t a t e s g r o w i n g a t as o m e w h a t s l o w e r r a t e t h a n t o t a l W e s t e r ncoa l p roduc t ion be tween 1985 and 1995 . TheD R I f o r e c a s t s h o w s p r o d u c t i o n f r o m t h em a j o r F e d e r a l c o a l S t a t e s g r o w i n g a t as l i g h t l y f a s t e r r a t e t h a n t o t a l W e s t e r n c o a lp r o d u c t i o n b e t w e e n 1 9 8 5 a n d 1 9 9 5 . I t i s i n -t e r e s t i n g t o n o t e t h a t t h e f i n a l D O E p r o d u c -t i o n g o a l s i n d i c a t e a r e l a t i v e l y s m a l l e r p r o -por t ion of product ion f rom the major Federa lcoal S ta tes compared to the pre l iminary goals(i.e., 32 v. 38 percent in 1990). The final goalsa r e c o n s i d e r a b l y h i g h e r t h a n t h e p r e l i m i n a r yg o a l s , b u t t h e a s s u m e d h i g h e r c o s t i n c r e a s e si n t r a n s p o r t a t i o n a p p e a r t o h a v e r e s t r i c t e dt h e s h a r e t h a t t h e F e d e r a l c o a l S t a t e s o b t a i nof the higher goals.
Summary
The analysis of the various factors affect-i n g d e m a n d f o r c o a l f r o m t h e m a j o r F e d e r a lcoal Sta tes in th is chapter a l lows a few gen-e r a l c o n c l u s i o n s :
1. The demand for coal from the major Fed-era l coal Sta tes wi l l cont inue to grow ata fas ter ra te than the to ta l growth in thedemand for coa l in the Uni ted Sta tes due
3.
pr imar i ly to the low cos t of mining th iscoal compared to the Midwest and A p -palachia, and to the fact that more coalmust be mined to meet equivalent energyneeds because of the lower heat contentof the coal.
2 . However , because of severa l fac tors ( in-c r e a s i n g t r a n s p o r t a t i o n c o s t s a n d p r e s -e n t S O2 e m i s s i o n s t a n d a r d s b e i n g a m o n gthe most impor tant ) the compet i t ive pos i -t ion of Western coal in the Midwest andS o u t h - C e n t r a l U n i t e d S t a t e s ( w h i c h a r et h e m a j o r c e n t e r s o f d e m a n d f o r W e s t -ern coal) wi l l not be as favorable dur ingt h e n e x t 1 0 y e a r s . a s c o m p a r e d t o t h e
previous 10 years. The net effect ofthese factors, combined with downwardr e v i s i o n s i n p r o j e c t e d g r o w t h r a t e s f o re l e c t r i c i t y m e a n s t h a t t h e g r o w t h i n d e -mand for Western coa l wi l l p robably notb e a s g r e a t a s s o m e e a r l i e r f o r e c a s t sh a d p r e d i c t e d .A f t e r 1 9 9 0 W e s t e r n c o a l i s e x p e c t e d t oc o n t i n u e i n c r e a s i n g i t s s h a r e o f t o t a lU . S . c o a l p r o d u c t i o n , b u t t o t a l W e s t e r nc o a l p r o d u c t i o n m a y i n c r e a s e a t as l i g h t l y f a s t e r r a t e t h a n c o a l p r o d u c t i o nfrom the major Federa l coal Sta tes . Off-s e t t i n g s l o w e d g r o w t h i n d e m a n d b e -c a u s e o f p o s s i b l e r e d u c e d e l e c t r i c a lg r o w t h a r e a n u m b e r o f p o s s i b l e n e wmarkets for Western coal for which pre-c ise demands are d i f f icul t to predic t , butwhich could potent ia l ly be la rge consum-e r s o f c o a l . T h e s e p o t e n t i a l m a j o r n e wm a r k e t s f o r W e s t e r n c o a l a f t e r 1 9 9 0 a r es y n t h e t i c f u e l s , i n d u s t r i a l b o i l e r c o n v e r -s ions , and expor ts to Asia .