Chapter 410 Circulation and Passenger Waiting · Chapter 410 Circulation and Passenger Waiting WSF...
20
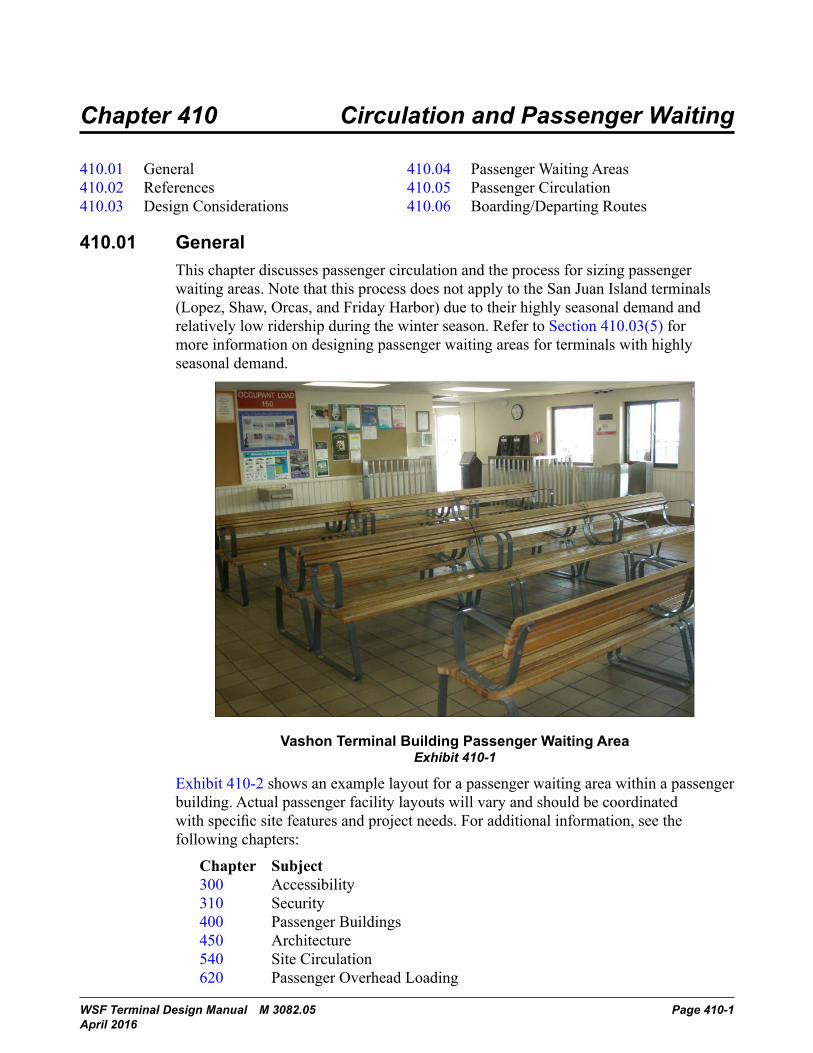
WSF Terminal Design Manual M 3082.05 Page 410-1 April 2016 Chapter 410 Circulation and Passenger Waiting 410.01 General 410.02 References 410.03 Design Considerations 410.04 Passenger Waiting Areas 410.05 Passenger Circulation 410.06 Boarding/Departing Routes 410.01 General This chapter discusses passenger circulation and the process for sizing passenger waiting areas. Note that this process does not apply to the San Juan Island terminals (Lopez, Shaw, Orcas, and Friday Harbor) due to their highly seasonal demand and relatively low ridership during the winter season. Refer to Section 410.03(5) for more information on designing passenger waiting areas for terminals with highly seasonal demand. Vashon Terminal Building Passenger Waiting Area Exhibit 410-1 Exhibit 410-2 shows an example layout for a passenger waiting area within a passenger building. Actual passenger facility layouts will vary and should be coordinated with specific site features and project needs. For additional information, see the following chapters: Chapter Subject 300 Accessibility 310 Security 400 Passenger Buildings 450 Architecture 540 Site Circulation 620 Passenger Overhead Loading
Transcript of Chapter 410 Circulation and Passenger Waiting · Chapter 410 Circulation and Passenger Waiting WSF...
WSF Terminal Design Manual M 3082.05 Page 410-1 April 2016
Chapter 410 Circulation and Passenger Waiting
410.01 General410.02 References410.03 Design Considerations
410.04 Passenger Waiting Areas410.05 Passenger Circulation410.06 Boarding/Departing Routes
410.01 GeneralThis chapter discusses passenger circulation and the process for sizing passenger waiting areas. Note that this process does not apply to the San Juan Island terminals (Lopez, Shaw, Orcas, and Friday Harbor) due to their highly seasonal demand and relatively low ridership during the winter season. Refer to Section 410.03(5) for more information on designing passenger waiting areas for terminals with highly seasonal demand.
Terminal Design Manual M 3082 Page 410-1June 2015
Chapter 410 Circulation and Passenger Waiting
410.01 General410.02 References410.03 Design Considerations410.04 Passenger Waiting Areas410.05 Passenger Circulation410.06 Boarding/Departing Routes
410.01 GeneralThis chapter discusses passenger circulation and the process for sizing passenger waiting areas.Note that this process does not apply to the San Juan Island terminals (Lopez, Shaw, Orcas, and Friday Harbor) due to their highly seasonal demand and relatively low ridership during the winter season. Refer to Section 410.03(5) for more information on designing passenger waiting areas for terminals with highly seasonal demand.
Vashon Terminal Building Passenger Waiting AreaExhibit 410-1
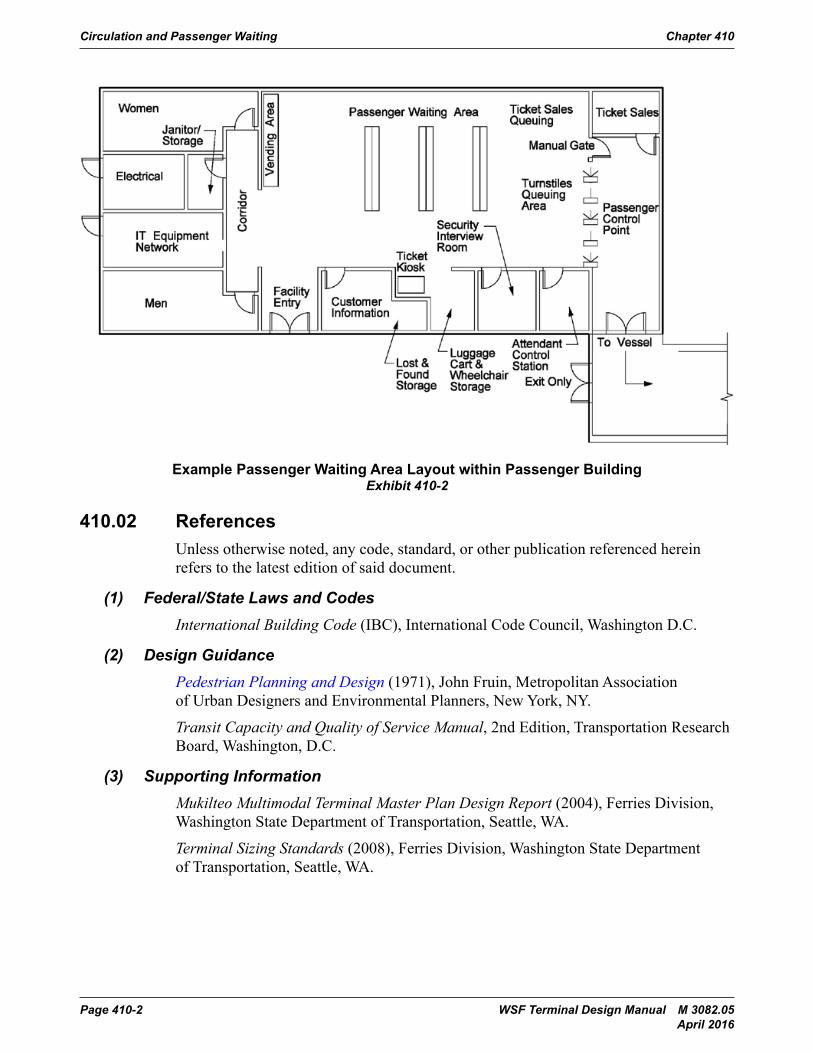
Exhibit 410-2 shows an example layout for a passenger waiting area within a passenger building. Actual passenger facility layouts will vary and should be coordinated with specific site features and project needs. For additional information, see the following chapters:
Chapter Subject300 Accessibility310 Security400 Passenger Buildings450 Architecture540 Site Circulation620 Passenger Overhead Loading
Vashon Terminal Building Passenger Waiting AreaExhibit 410-1
Exhibit 410-2 shows an example layout for a passenger waiting area within a passenger building. Actual passenger facility layouts will vary and should be coordinated with specific site features and project needs. For additional information, see the following chapters:
Chapter Subject 300 Accessibility 310 Security 400 Passenger Buildings 450 Architecture 540 Site Circulation 620 Passenger Overhead Loading
Circulation and Passenger Waiting Chapter 410
Page 410-2 WSF Terminal Design Manual M 3082.05 April 2016
Circulation and Passenger Waiting Chapter 410
Page 410-2 Terminal Design Manual M 3082June 2015
Example Passenger Waiting Area Layout within Passenger BuildingExhibit 410-2
410.02 ReferencesUnless otherwise noted, any code, standard, or other publication referenced herein refers to the latest edition of said document.
(1) Federal/State Laws and Codes
International Building Code (IBC), International Code Council, Washington D.C.
(2) Design Guidance
Pedestrian Planning and Design (1971), John Fruin, Metropolitan Association of Urban Designers and Environmental Planners, New York, NY.
Transit Capacity and Quality of Service Manual, 2nd Edition, Transportation Research Board, Washington, D.C.
(3) Supporting Information
Mukilteo Multimodal Terminal Master Plan Design Report (2004), Ferries Division, Washington State Department of Transportation, Seattle, WA.
Terminal Sizing Standards (2008), Ferries Division, Washington State Department of Transportation, Seattle, WA.
410.03 Design Considerations
(1) Accessibility
Wherever pedestrian facilities are intended to be a part of a transportation facility, 28 CFR Part 35 requires that those pedestrian facilities meet ADA guidelines. Federal regulations require that all new construction, reconstruction, or alteration of existing transportation facilities be designed
Example Passenger Waiting Area Layout within Passenger BuildingExhibit 410-2
410.02 ReferencesUnless otherwise noted, any code, standard, or other publication referenced herein refers to the latest edition of said document.
(1) Federal/State Laws and CodesInternational Building Code (IBC), International Code Council, Washington D.C.
(2) Design GuidancePedestrian Planning and Design (1971), John Fruin, Metropolitan Association of Urban Designers and Environmental Planners, New York, NY.
Transit Capacity and Quality of Service Manual, 2nd Edition, Transportation Research Board, Washington, D.C.
(3) Supporting InformationMukilteo Multimodal Terminal Master Plan Design Report (2004), Ferries Division, Washington State Department of Transportation, Seattle, WA.
Terminal Sizing Standards (2008), Ferries Division, Washington State Department of Transportation, Seattle, WA.
Chapter 410 Circulation and Passenger Waiting
WSF Terminal Design Manual M 3082.05 Page 410-3 April 2016
410.03 Design Considerations(1) Accessibility
Wherever pedestrian facilities are intended to be a part of a transportation facility, 28 CFR Part 35 requires that those pedestrian facilities meet ADA guidelines. Federal regulations require that all new construction, reconstruction, or alteration of existing transportation facilities be designed and constructed to be accessible and useable by those with disabilities and that existing facilities be retrofitted to be accessible. Design pedestrian facilities to accommodate all types of pedestrians, including children, adults, the elderly, and persons with mobility, sensory, or cognitive disabilities. Refer to Chapter 300 for accessibility requirements.
(2) SecurityChapter 310 includes a general discussion of the United States Coast Guard (USCG) three-tiered system of Maritime Security (MARSEC) levels, vessel security requirements, and additional information pertaining to passenger buildings. Below are links to relevant sections by topic. Coordinate with the WSF Company Security Officer (CSO) regarding design issues pertaining to security.• MARSEC Levels: 310.04• Passenger Security Screening Area: 310.06• Closed Circuit Television: 310.11• Signage: 310.13
(3) Environmental ConsiderationsRefer to Chapter 320 for general environmental requirements and design guidance. Refer to the project NEPA/SEPA documentation for project-specific environmental impacts and mitigation.
(4) BuildingsRefer to Chapter 350 for general building design criteria pertaining to passenger buildings. Below are links to relevant sections by topic.• Building Structures: 350.04• Building Foundations: 350.05• Building Utilities: 350.06
(5) Terminals with Seasonal DemandRecreational terminals are characterized by their seasonal use, typically exhibiting much higher ridership in the summer months when passengers can wait comfortably outside. When designing waiting areas for these terminals, it is important to consider both the relative demand for the terminal and the frequency in which the indoor facilities will get used. The Anacortes terminal is the largest of the recreational terminals and is a major hub for four routes going to the San Juan Islands in addition to an international route to Sidney B.C. At the other end of the spectrum are the San Juan Island terminals (Lopez, Shaw, Orcas, and Friday Harbor) which have relatively low ridership except during the summer season.
Circulation and Passenger Waiting Chapter 410
Page 410-4 WSF Terminal Design Manual M 3082.05 April 2016
Consider designing indoor passenger waiting areas at larger recreational terminals, such as Anacortes, for winter/shoulder season ridership levels (at LOS C). The surplus ridership during the summer season can be accommodated outdoors (refer to Section 410.04(14) for information on providing covered verses non-covered outdoor waiting areas). The sizing calculations for recreational terminals presented in Section 410.04 are designed to approximate this condition. However, the results should be compared against historic ridership data, where available.
Size indoor passenger waiting areas for smaller recreational terminals, namely the San Juan Island terminals, according to their winter demand with the idea of providing minimum weather protection. Summer ridership for the San Juan Island terminals is accommodated outdoors and is typically more of a staging and operational issue.
(6) Phasing of Passenger Waiting AreasAlthough phasing of a passenger waiting area is likely to result in a higher cost per square foot, there are several circumstances in which phasing may be beneficial. In certain cases, phasing may reduce the risk of oversizing a facility, improve public perception, and/or allow a project with a funding shortfall to be constructed. If a passenger waiting area is to be phased, design the terminal building to allow for continued terminal operation during the expansion with minimal disruption to the remainder of the terminal building.
Unlike many terminal building spaces, appropriate sizing of the passenger waiting area is highly dependent on ridership and growth projections through the terminal design year. When high growth rates are projected approaching the design year, the passenger waiting area may be significantly oversized for the early years after terminal opening even if future ridership projections are accurate. Phasing of the terminal building may be a good option under this scenario, especially if there is inadequate funding for the proposed terminal building improvements.
410.04 Passenger Waiting AreasPassenger waiting refers to areas for passengers to sit and stand, both inside and outside the terminal building, when they are not actively buying tickets or retail items or walking through the terminal. Locate passenger waiting areas as close as possible to the ferry slips to allow for boarding passengers to load as quickly as possible.
Passenger waiting areas accommodate walk-on passengers as well as drive-on passengers who have entered the terminal building after temporarily parking their vehicles in the vehicle holding area. The sizing of passenger waiting areas for these customers is based on three parameters: pedestrian level of service, design event methodology, and route type.
This section provides a planning level approach to sizing the passenger waiting areas. During detailed design, perform a more detailed calculation taking into account additional factors such as:• Direction of travel: WSF currently does not collect fares for passengers traveling
east-bound. Therefore, the size of the waiting areas for the western terminals may be smaller than the calculated value.
• Luggage/Backpacks: Consider providing additional space for passenger’s luggage, especially at recreational terminals or where inter-city rail connections exist.
Chapter 410 Circulation and Passenger Waiting
WSF Terminal Design Manual M 3082.05 Page 410-5 April 2016
• Accessibility: Provide additional space for passengers in wheelchairs and for persons with mobility disabilities to sit.
• Consider other potential users of the terminal waiting area space such as users of a nearby transit station that has no indoor seating.
(1) Pedestrian Level of Service (LOS)It is common industry practice to size terminal waiting areas based on a level of service (LOS) standard. Levels of service range from the highest, LOS “A” (most commodious) to “F” (crowded to the point of system breakdown), as categorized in “Pedestrian Planning and Design” by John F. Fruin, Ph.D. Higher levels of service result in larger, more comfortable, more expensive facilities. Lower levels of service exhibit smaller, less comfortable, and less expensive facilities.
WSF uses LOS C for sizing terminal building waiting areas and corridors. LOS C provides a balance between passenger comfort and capital expenditure and is considered an appropriate design objective for the peak sailing condition. LOS C translates into a space allotment of 8.5 square feet per passenger for standing and queuing, 13 square feet per passenger for seating (without tables) and 20 square feet per passenger for walking. Tables are not provided in the general passenger waiting areas. If a retail function requires seating at tables, include tables in the sizing of the retail function. Refer to Section 400.22 for retail area sizing recommendations.
(2) Design Event MethodologyThe design of passenger waiting areas incorporates the “85th percentile” method commonly used in transportation analysis. A method based on statistical theory, the “85th percentile” covers 85 percent of all cases within a defined data set. For example, the 85th percentile busiest day for walk-ons would have a ridership as large as 85 percent of all days in the design year (15 percent of the days would have a higher ridership). The main benefit of utilizing this method is that facilities are not oversized for the great majority of the year.
Design passenger waiting areas for the peak walk-on passenger sailing on the 85th percentile busiest day in the design year. For the purpose of sizing the passenger waiting area, the busiest day is defined as the day with the highest total walk-on passengers. The “85th percentile” day equates to the 55th busiest day in the design year (365 – (0.85 x 365) = 55). The WSF Planning Department is responsible for identifying the design year which is typically twenty years out from the projected year of terminal opening.
Using current ridership data, determine the number of walk-on passengers for the peak sailing on the 55th busiest day. Escalate the determined value to the design year using projected growth rates. Use this projected walk-on passenger count in the passenger waiting area size calculation described in Section 410.04(5). In the case of the “85th percentile” (i.e. the 55th busiest day), the facility is adequately designed for 310 days of the year. Using this approach, the facility is undersized for 55 days of the year, meaning the facility operates at a lower level of service than LOS C during the peak periods on those days.
Coordinate with the WSF Planning Department to obtain ridership data and projected growth rates for existing terminals.
Circulation and Passenger Waiting Chapter 410
Page 410-6 WSF Terminal Design Manual M 3082.05 April 2016
(3) Route TypesFor the purpose of sizing passenger waiting areas, WSF ferry terminals are categorized by the type of route the terminal serves. Ferry routes and their corresponding ridership are divided into two distinct categories: commuter routes and recreational routes. An important distinction between these two route types is their associated passenger arrival trends (i.e. the amount of time passengers wait at the terminal prior to vessel departure).
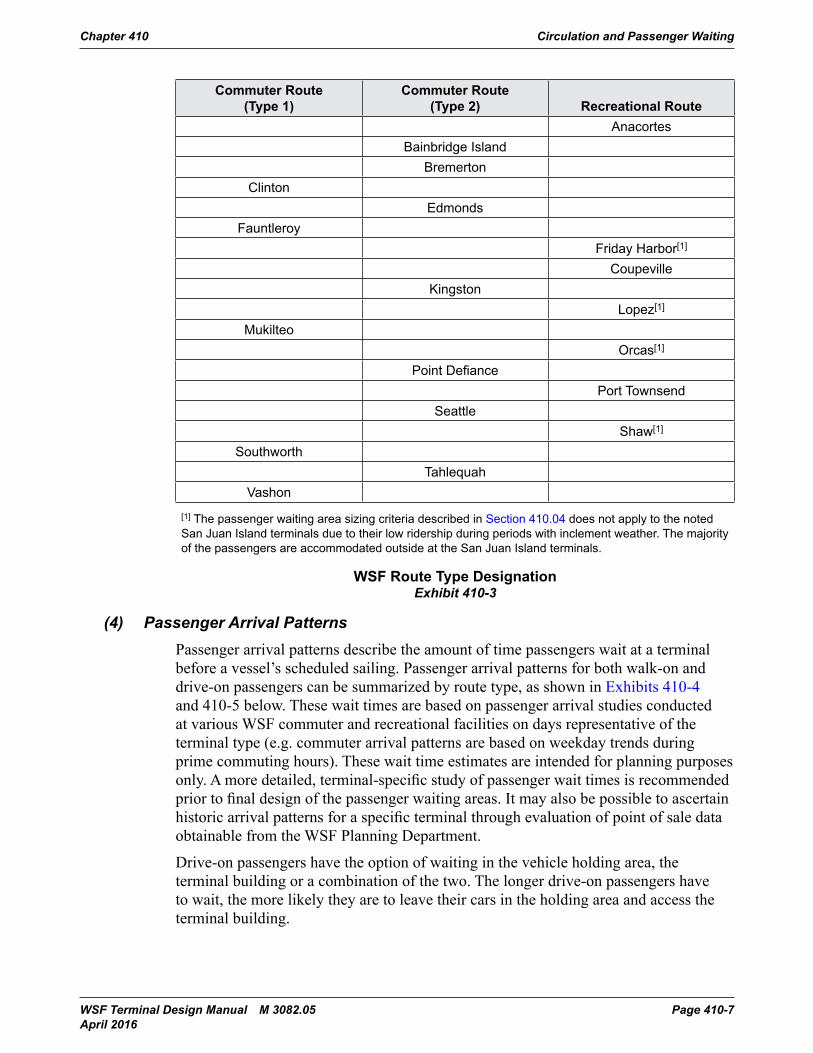
Tailoring the design of the passenger areas to each route type is critical to achieving the most efficient balance between capital and operating investments. Exhibit 410-3 categorizes each terminal by its route type. Note that these categories summarize the typical characteristics of the terminal. Terminal traits may vary somewhat depending on time of day, week, and year.
(a) Commuter RoutesCommuter routes are generally busy year-round and exhibit minimal increases in traffic flow during the summer months. Commuter passengers ride the ferries on a regular basis and are familiar with the terminals. They tend to arrive close to the time of the vessel’s scheduled departure, which results in a shorter wait time. The Bainbridge Island to Seattle route is a good example of a “commuter route.” For a typical sailing from Bainbridge, approximately 55 percent of the walk-on passengers arrive within 10 minutes of the scheduled departure and all of the drive-on passengers arrive within 60 minutes of the scheduled departure. (Note that some of the highest ridership at commuter terminals occurs on summer weekends, holidays, and during special events when these terminals behave more like recreational routes. However, the passenger waiting area is only designed to accommodate the peak sailing for 85 percent of the days in the design year.)
Typical wait times are not only a function of route type but also vary with the frequency of sailings (headways). For this reason, the commuter ferry routes are further subdivided into Type 1 and Type 2 commuter routes, based on headway during the peak period. Type 1 commuter routes are defined as having headways of 30 minutes or less during the peak period. Type 2 routes have headways greater than 30 minutes during the peak period. Typically, Type 1 commuter routes have headways between 20 and 30 minutes and Type 2 commuter routes between 40 and 60 minutes.
(b) Recreational RoutesRecreational routes exhibit large increases in traffic flow during the summer months and are relatively quiet during the winter months. Recreational passengers may be unfamiliar with the terminal or are on a leisurely schedule, which results in longer wait times. The Anacortes - San-Juan Islands route is a good example of a “recreational route.” For a typical sailing from Anacortes, only 10 percent of the walk-on passengers arrive within 10 minutes of the scheduled departure and all of the drive-on passengers arrive more than 60 minutes prior to the scheduled departure.
Headways for recreational routes are generally less frequent than commuter routes. Typically, WSF recreational routes have headways between 1½ and 3 hours, which plays a role in the longer wait times for these routes.
Chapter 410 Circulation and Passenger Waiting
WSF Terminal Design Manual M 3082.05 Page 410-7 April 2016
Commuter Route (Type 1)
Commuter Route (Type 2) Recreational Route
AnacortesBainbridge Island
BremertonClinton
EdmondsFauntleroy
Friday Harbor[1]
CoupevilleKingston
Lopez[1]
MukilteoOrcas[1]
Point DefiancePort Townsend
SeattleShaw[1]
SouthworthTahlequah
Vashon
[1] The passenger waiting area sizing criteria described in Section 410.04 does not apply to the noted San Juan Island terminals due to their low ridership during periods with inclement weather. The majority of the passengers are accommodated outside at the San Juan Island terminals.
WSF Route Type DesignationExhibit 410-3
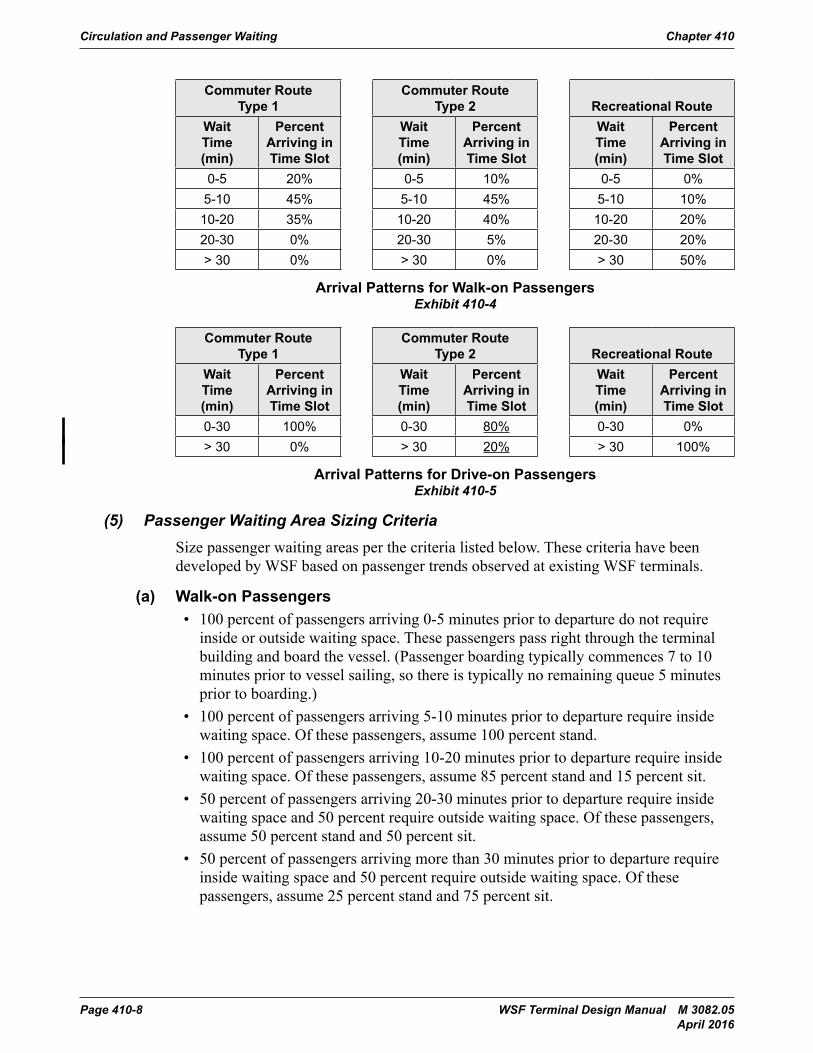
(4) Passenger Arrival PatternsPassenger arrival patterns describe the amount of time passengers wait at a terminal before a vessel’s scheduled sailing. Passenger arrival patterns for both walk-on and drive-on passengers can be summarized by route type, as shown in Exhibits 410-4 and 410-5 below. These wait times are based on passenger arrival studies conducted at various WSF commuter and recreational facilities on days representative of the terminal type (e.g. commuter arrival patterns are based on weekday trends during prime commuting hours). These wait time estimates are intended for planning purposes only. A more detailed, terminal-specific study of passenger wait times is recommended prior to final design of the passenger waiting areas. It may also be possible to ascertain historic arrival patterns for a specific terminal through evaluation of point of sale data obtainable from the WSF Planning Department.
Drive-on passengers have the option of waiting in the vehicle holding area, the terminal building or a combination of the two. The longer drive-on passengers have to wait, the more likely they are to leave their cars in the holding area and access the terminal building.
Circulation and Passenger Waiting Chapter 410
Page 410-8 WSF Terminal Design Manual M 3082.05 April 2016
Commuter Route Type 1
Commuter Route Type 2 Recreational Route
Wait Time (min)
Percent Arriving in Time Slot
Wait Time (min)
Percent Arriving in Time Slot
Wait Time (min)
Percent Arriving in Time Slot
0-5 20% 0-5 10% 0-5 0%5-10 45% 5-10 45% 5-10 10%10-20 35% 10-20 40% 10-20 20%20-30 0% 20-30 5% 20-30 20%> 30 0% > 30 0% > 30 50%
Arrival Patterns for Walk-on PassengersExhibit 410-4
Commuter Route Type 1
Commuter Route Type 2 Recreational Route
Wait Time (min)
Percent Arriving in Time Slot
Wait Time (min)
Percent Arriving in Time Slot
Wait Time (min)
Percent Arriving in Time Slot
0-30 100% 0-30 80% 0-30 0%> 30 0% > 30 20% > 30 100%
Arrival Patterns for Drive-on PassengersExhibit 410-5
(5) Passenger Waiting Area Sizing CriteriaSize passenger waiting areas per the criteria listed below. These criteria have been developed by WSF based on passenger trends observed at existing WSF terminals.
(a) Walk-on Passengers• 100 percent of passengers arriving 0-5 minutes prior to departure do not require
inside or outside waiting space. These passengers pass right through the terminal building and board the vessel. (Passenger boarding typically commences 7 to 10 minutes prior to vessel sailing, so there is typically no remaining queue 5 minutes prior to boarding.)
• 100 percent of passengers arriving 5-10 minutes prior to departure require inside waiting space. Of these passengers, assume 100 percent stand.
• 100 percent of passengers arriving 10-20 minutes prior to departure require inside waiting space. Of these passengers, assume 85 percent stand and 15 percent sit.
• 50 percent of passengers arriving 20-30 minutes prior to departure require inside waiting space and 50 percent require outside waiting space. Of these passengers, assume 50 percent stand and 50 percent sit.
• 50 percent of passengers arriving more than 30 minutes prior to departure require inside waiting space and 50 percent require outside waiting space. Of these passengers, assume 25 percent stand and 75 percent sit.
Chapter 410 Circulation and Passenger Waiting
WSF Terminal Design Manual M 3082.05 Page 410-9 April 2016
(b) Drive-on PassengersThe majority of drive-on passengers never enter the terminal building. Most drive-on passengers remain in their vehicles or utilize amenities within the vehicle holding area. WSF recommends that drive-on passengers return to their vehicles a minimum of 20 minutes prior to a scheduled sailing in order to minimize pedestrian traffic in the holding area during vehicle unloading. Hence, any vehicle passengers utilizing the terminal building and arriving less than 30 minutes prior to departure are not likely to require any seating within the waiting area, especially in the critical (most crowded) period just prior to vessel boarding. No outside waiting is required for drive-on passengers at the terminal building. Assume the following when sizing the passenger waiting area.• 5 percent of drive-on passengers arriving 0-30 minutes prior to departure require
inside waiting space. Of these passengers, assume 100 percent stand.• 5 percent of drive-on passengers arriving more than 30 minutes prior to departure
require inside waiting space. Of these passengers, assume 25 percent stand and 75 percent sit. (Note that this 5 percent value represents only that portion of the drive-on passengers arriving in this interval that will still be in the terminal building at the critical period just prior to loading.)
(6) Calculate Passengers Using Terminal Waiting Areas
(a) Walk-on PassengersUse Exhibit 410-6, as outlined in Steps 1 through 8 below, to estimate the number of walk-on passengers to be accommodated in the terminal building waiting areas. The designer populates/computes the highlighted cells, and the other cells are fixed.
1. Using current ridership data from the WSF Planning Department, determine the 85th percentile busiest day (the 55th busiest day in the year) based on total walk-on passengers.
2. Determine the number of walk-on passengers for the peak sailing occurring on the 55th busiest day identified in Step 1.
3. Estimate the 55th busiest day peak walk-on ridership for the design year by applying the projected walk-on growth rate for the route, as identified by the WSF Planning Department, to the value determined in Step 2. The design year is defined by WSF Planning and is typically 20 years out from the projected terminal year of opening. Note that growth rates for 2010 to 2020 and 2030 are available in the Long Range Plan Appendix F.
4. Identify the terminal route type based on Exhibit 410-3.
5. Based on the route type determined in Step 4, populate Percent Arriving in Time Slot (Column 2) in Exhibit 410-6 using the corresponding values from Exhibit 410-4.
6. Calculate the number of People Waiting (Column 3) by multiplying the peak sailing passenger volume determined in Step 3 by Percent Arriving in Time Slot (Column 2).
Circulation and Passenger Waiting Chapter 410
Page 410-10 WSF Terminal Design Manual M 3082.05 April 2016
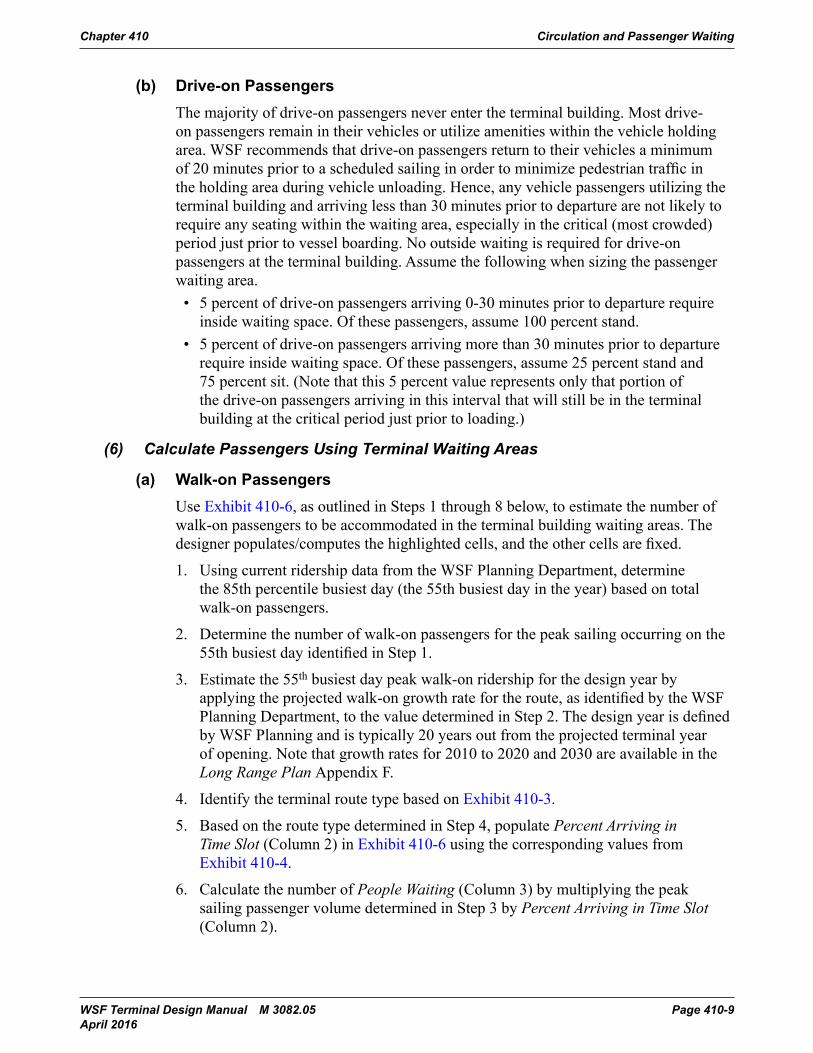
7. Calculate the number of People Waiting Inside (Column 6) by multiplying People Waiting (Column 3) by Percent Inside (Column 4).
8. Calculate the number of People Waiting Outside (Column 7) by multiplying People Waiting (Column 3) by Percent Outside (Column 5).
(1) (2) (3) (4) (5) (6) (7)Wait Time
Before Boat
Departs (min)
Percent Arriving in Time Slot
People Waiting
Percent Inside
Percent Outside
People Waiting Inside
People Waiting Outside
0-5 0% 0%5-10 100% 0%10-20 100% 0%20-30 50% 50%> 30 50% 50%
Walk-on Passengers Using Terminal Waiting AreasExhibit 410-6
(b) Drive-on PassengersUse Exhibit 410-7, as outlined in Steps 1 through 7 below, to estimate the number of drive-on passengers to be accommodated in the terminal building waiting areas. The designer populates/computes the highlighted cells, and the other cells are fixed.
1. Using current ridership data from the WSF Planning Department, determine the 85th percentile busiest day (the 55th busiest day in the year) based on total drive-on passengers.
2. Determine the number of drive-on passengers for the peak sailing occurring on the 55th busiest day identified in Step 1.
3. Estimate the 55th busiest day peak drive-on ridership for the design year by applying the projected drive-on growth rate for the route, as identified by the WSF Planning Department, to the value determined in Step 2. The design year is defined by WSF Planning and is typically 20 years out from the projected terminal year of opening. Note that growth rates for 2010 to 2020 and 2030 are available in the Long Range Plan Appendix F.
4. Identify the terminal route type based on Exhibit 410-3.
5. Based on the route type determined in Step 4, populate Percent Arriving in Time Slot (Column 2) in Exhibit 410-7 using the corresponding values from Exhibit 410-5.
6. Calculate the number of People Waiting (Column 3) by multiplying the peak sailing passenger volume determined in Step 3 by Percent Arriving in Time Slot (Column 2).
Chapter 410 Circulation and Passenger Waiting
WSF Terminal Design Manual M 3082.05 Page 410-11 April 2016
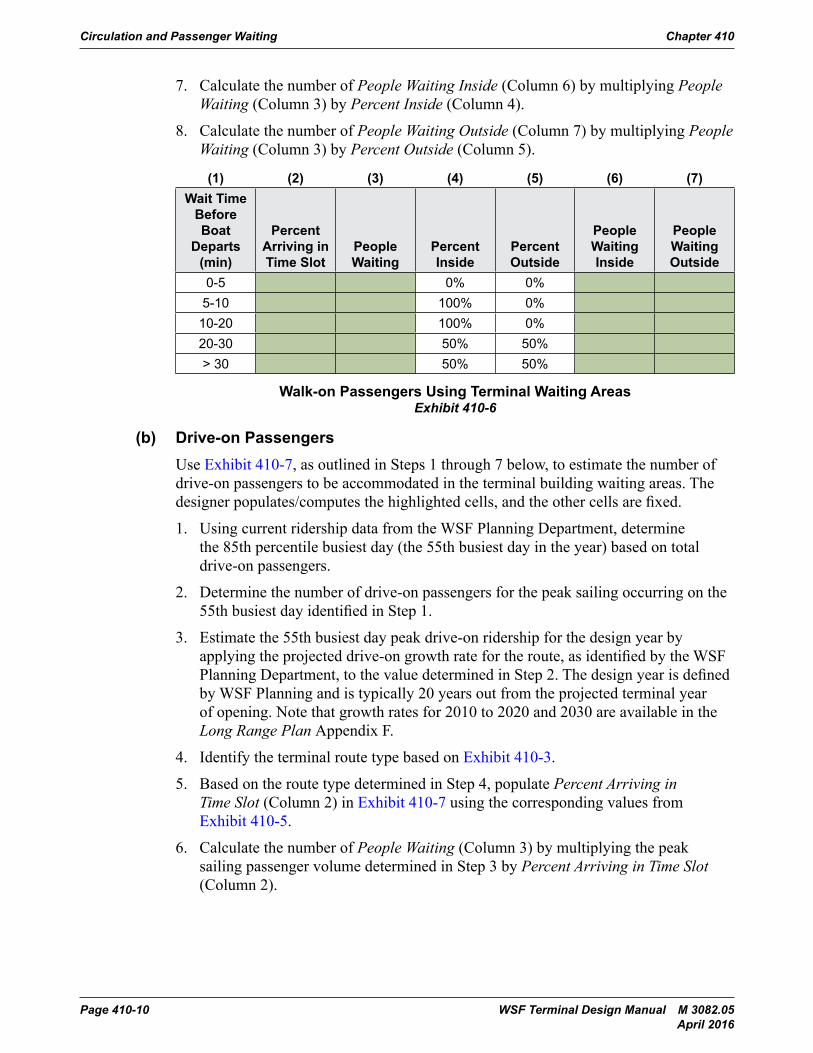
7. Calculate the number of People Waiting Inside (Column 6) by multiplying People Waiting (Column 3) by Percent Inside (Column 4).
(1) (2) (3) (4) (5) (6) (7)Wait Time
Before Boat
Departs (min)
Percent Arriving in Time Slot
People Waiting
Percent Inside
Percent Outside
People Waiting Inside
People Waiting Outside
0-30 5% 0% N/A> 30 5% 0% N/A
Drive-on Passengers Using Terminal Waiting AreasExhibit 410-7
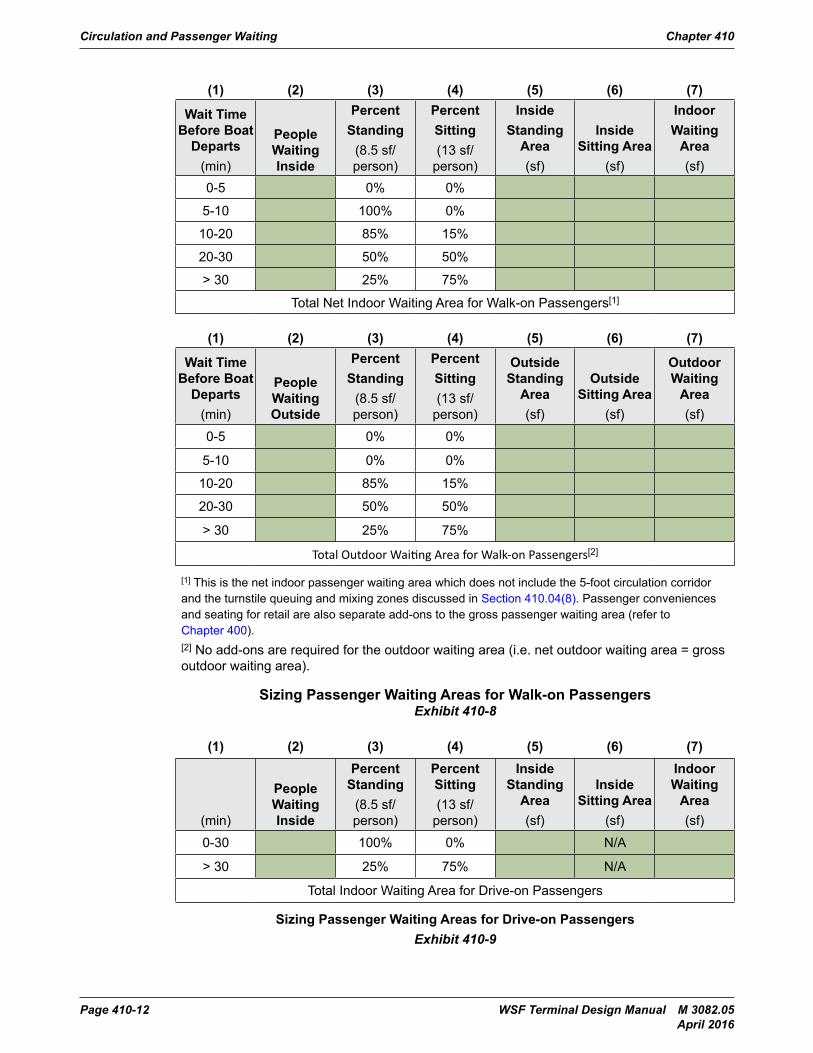
(7) Calculate Net Passenger Waiting AreaUse Exhibits 410-8 and 410-9, as outlined in Steps 1 through 4 below, to estimate the indoor and outdoor waiting area sizes for walk-on and drive-on passengers, respectively. (The steps below outline the process for computing Indoor Waiting Areas. The same process is used to calculate Outside Waiting Areas.) The designer populates/computes the highlighted cells, and the other cells are fixed.
The total indoor waiting area is the sum of the respective areas for the walk-on and drive-on passengers. For terminals serving multiple routes and with multiple main operating slips, size the total passenger waiting area to accommodate the sum of the waiting areas required for each route. If multiple routes operate from a single slip, size the waiting area for the route with the highest peak passenger volume. (Note that separate turnstiles may be required for different routes using the same slip. Coordinate with WSF Operations on turnstile requirements.)
1. Populate People Waiting Inside (Column 2) in Exhibits 410-8 and 410-9 using the corresponding values from Column 6 in Exhibit 410-6 and Exhibit 410-7, respectively.
2. Calculate Inside Standing Area (Column 5) by multiplying People Waiting Inside (Column 2) by Percent Standing (Column 3) by 8.5 sf per person (the space allotment for people standing at LOS C). (Column 5 = Column 2 x Column 3 x 8.5sf)
3. Calculate Inside Sitting Area (Column 6) by multiplying People Waiting Inside (Column 2) by Percent Sitting (Column 4) by 13 sf per person (the space allotment for people sitting at LOS C). (Column 6 = Column 2 x Column 4 x 13sf)
4. Calculate Net Indoor Waiting Area (Column 7) by adding Inside Standing Area (Column 5) and Inside Sitting Area (Column 6). (Column 7 = Column 5 + Column 6)
Circulation and Passenger Waiting Chapter 410
Page 410-12 WSF Terminal Design Manual M 3082.05 April 2016
(1) (2) (3) (4) (5) (6) (7)
Wait Time Before Boat
Departs(min)
People Waiting Inside
PercentStanding
(8.5 sf/person)
PercentSitting(13 sf/
person)
InsideStanding
Area(sf)
Inside Sitting Area
(sf)
IndoorWaiting
Area(sf)
0-5 0% 0%
5-10 100% 0%
10-20 85% 15%
20-30 50% 50%
> 30 25% 75%
Total Net Indoor Waiting Area for Walk-on Passengers[1]
(1) (2) (3) (4) (5) (6) (7)
Wait Time Before Boat
Departs(min)
People Waiting Outside
PercentStanding
(8.5 sf/person)
PercentSitting(13 sf/
person)
Outside Standing
Area(sf)
Outside Sitting Area
(sf)
Outdoor Waiting
Area(sf)
0-5 0% 0%
5-10 0% 0%
10-20 85% 15%
20-30 50% 50%
> 30 25% 75%
Total Outdoor Waiting Area for Walk-on Passengers[2]
[1] This is the net indoor passenger waiting area which does not include the 5-foot circulation corridor and the turnstile queuing and mixing zones discussed in Section 410.04(8). Passenger conveniences and seating for retail are also separate add-ons to the gross passenger waiting area (refer to Chapter 400).[2] No add-ons are required for the outdoor waiting area (i.e. net outdoor waiting area = gross outdoor waiting area).
Sizing Passenger Waiting Areas for Walk-on PassengersExhibit 410-8
(1) (2) (3) (4) (5) (6) (7)
(min)
People Waiting Inside
Percent Standing
(8.5 sf/person)
Percent Sitting(13 sf/
person)
Inside Standing
Area(sf)
Inside Sitting Area
(sf)
Indoor Waiting
Area(sf)
0-30 100% 0% N/A
> 30 25% 75% N/A
Total Indoor Waiting Area for Drive-on Passengers
Sizing Passenger Waiting Areas for Drive-on PassengersExhibit 410-9
Chapter 410 Circulation and Passenger Waiting
WSF Terminal Design Manual M 3082.05 Page 410-13 April 2016
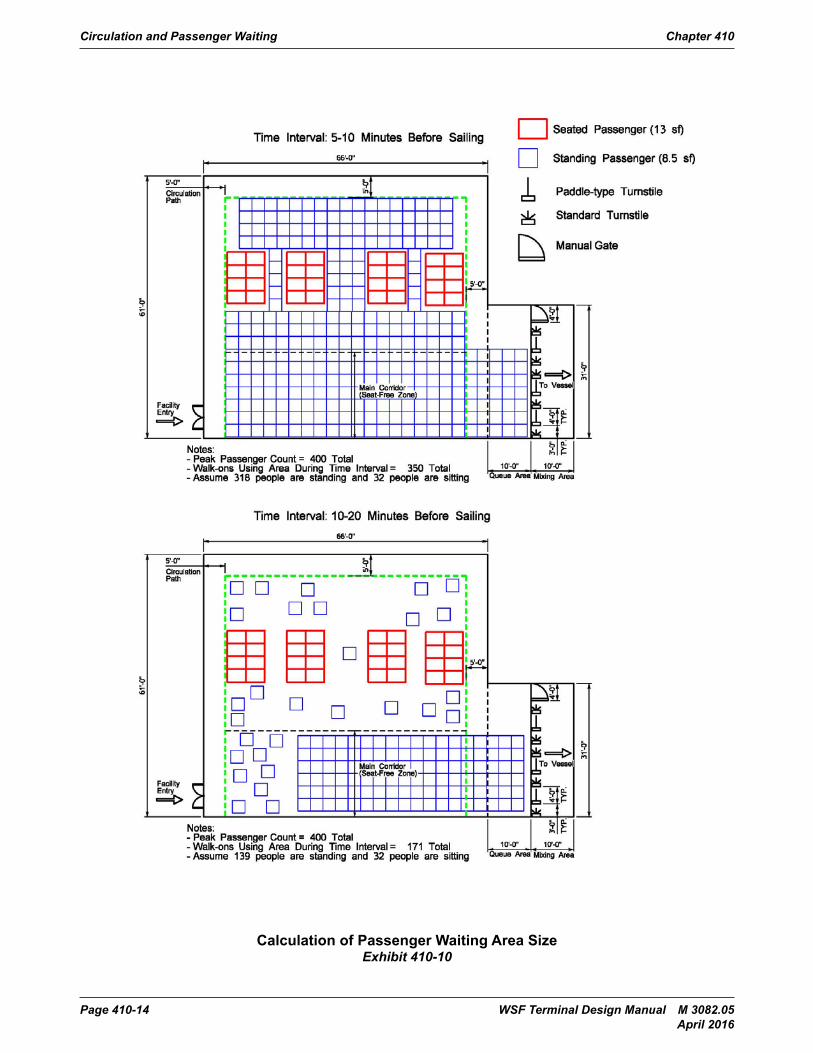
(8) Calculate Gross Indoor Passenger Waiting AreaThe net indoor passenger waiting area calculated in Section 410.04(7) accounts for the area required for passengers to sit and stand. However, it does not account for all necessary circulation within the waiting area. It is assumed that the main corridor upstream of the turnstiles is accounted for in the net passenger waiting area for people to stand since waiting passengers will fill this corridor prior to loading. However, it is still necessary to have some ability for circulation throughout the waiting area just prior to boarding (referred to herein as secondary circulation corridors) when the terminal building is at its maximum occupancy and the main corridor is filled with people. It is also important to have space for passengers to queue in front of the turnstiles (queuing area) and to transition back into a normal traffic flow after they pass through the turnstiles (mixing area). The sizing of these areas is discussed below and illustrated in Exhibit 410-10.
Exhibit 410-10 illustrates the passenger waiting area for two different time intervals of a Commuter Route Type 2 terminal. The peak occupancy occurs in the 5-10 minute range just prior to boarding. Using the process described below, all terminals will have the same degree of crowdedness at their peak occupancy. The degree of crowdedness at other time intervals will vary depending on the passenger arrival patterns (i.e. on the terminal type).
(a) Primary Circulation Corridor (included in net passenger waiting area)Provide a circulation corridor upstream of the turnstiles along the length of the passenger waiting area. This corridor is the primary route between the terminal entrance and the turnstiles which lead to vessel boarding.
The main corridor is included in the net passenger waiting area calculation and doubles as a place for waiting passengers. However, this corridor must remain unobstructed and is therefore designated as a seat-free zone, meaning no seating may be placed within this corridor.
Design the main corridor with a minimum width equal to the combined width of all turnstiles required to process the peak walk-on passenger sailing on the 85th percentile busiest day in the design year in the scheduled vessel loading time for the terminal. The scheduled vessel loading time for WSF terminals ranges between 7 and 10 minutes. Coordinate with WSF Operations for the scheduled vessel loading time for specific terminals.
Circulation and Passenger Waiting Chapter 410
Page 410-14 WSF Terminal Design Manual M 3082.05 April 2016
Circulation and Passenger Waiting Chapter 410
Page 410-14 Terminal Design Manual M 3082June 2015
Calculation of Passenger Waiting Area SizeExhibit 410-10Calculation of Passenger Waiting Area Size
Exhibit 410-10
Chapter 410 Circulation and Passenger Waiting
WSF Terminal Design Manual M 3082.05 Page 410-15 April 2016
(b) Secondary Circulation Corridors (add-on to net passenger waiting area)Include a 5-foot circulation corridor around three sides of the net passenger waiting area calculated in Section 410.04(7). This will allow passengers to access passenger conveniences such as vending, telephones, change machines and terminal exits when the building is at its maximum occupancy, in the 5-10 minute arrival period, just prior to boarding.
In order to estimate the length of this 5-foot corridor, approximate the net passenger waiting area as a square. The length of each side of the square then becomes the square root of the net passenger waiting area. Exhibit 410-10 illustrates the net passenger waiting area (shown within the green dashed line) with a 5-foot corridor around three sides.
(c) Queuing Area (add-on to net passenger waiting area)Include a queuing area immediately upstream of the turnstiles which is the combined width of all the required turnstiles (primary plus redundant) by 10 feet deep (refer to Turnstile Requirements below). This queuing area provides passengers a place to congregate without interfering with passenger circulation and seating in the main passenger waiting area.
(d) Mixing Area (add-on to net passenger waiting area)Include a mixing area immediately downstream of the turnstiles which is the combined width of all the required turnstiles (primary plus redundant) by 10 feet deep (refer to Turnstile Requirements below). This mixing area provides passengers a transitional space between turnstiles and the vessel loading corridor.
(e) Turnstile RequirementsBase primary turnstile quantities on the projected peak walk-on passenger sailing volume for the 100th percentile day (busiest sailing day) of the design year. The number of primary standard and paddle gates should be such that this peak passenger sailing volume can be processed within the scheduled vessel loading period for the terminal. Scheduled vessel loading times range between 7 and 10 minutes (coordinate with WSF Operations for terminal-specific values). Provide at least one primary standard turnstile and one primary paddle turnstile regardless of the peak passenger volume.
In addition to the primary turnstile requirements described above, provide one redundant standard turnstile and one redundant paddle turnstile which can be used when a primary turnstile is shut down for maintenance reasons. In addition, provide a single manual gate at each terminal. A redundant manual gate is not required. The number of required turnstiles is the combined total of the primary and redundant turnstiles and the manual gate.
1. Standard Turnstiles
A standard turnstile is approximately 3 feet wide and has a processing speed of approximately 17 transactions per minute as measured by WSF Operations. This processing speed may be used for scoping purposes. Actual processing rates may vary by terminal and should be re-evaluated during the design phase.
Circulation and Passenger Waiting Chapter 410
Page 410-16 WSF Terminal Design Manual M 3082.05 April 2016
2. Paddle Turnstiles
A paddle turnstile is approximately 4 feet wide and has a processing speed of approximately 9 transactions per minute as measured by WSF Operations. This processing speed may be used for scoping purposes. Actual processing rates may vary by terminal and should be re-evaluated during the design phase. Paddle turnstiles meet ADA requirements and have the added benefit of accommodating passengers carrying larger items such as suitcases and backpacks.
3. Manual Gates
A manual gate is approximately 4 feet wide. It is used to accommodate groups of pre-paid passengers such as a bus load of school kids. Since manual gates are used intermittently, they are not included in the passenger processing capacity of the terminal.
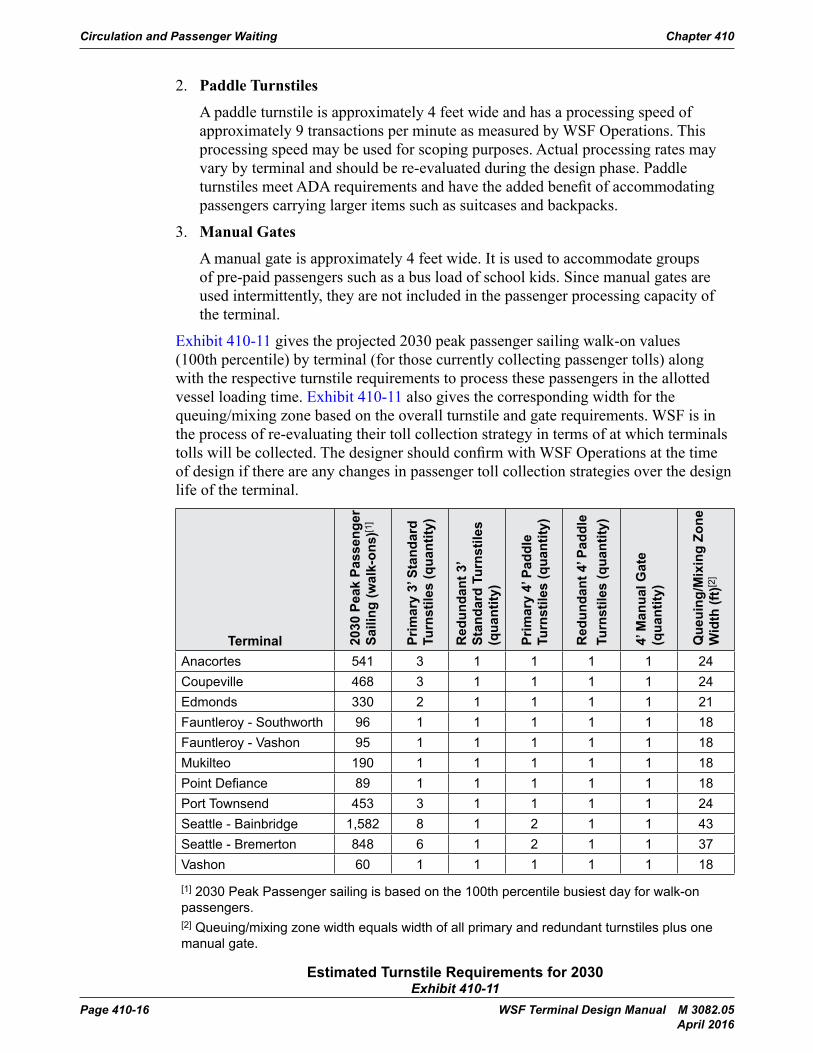
Exhibit 410-11 gives the projected 2030 peak passenger sailing walk-on values (100th percentile) by terminal (for those currently collecting passenger tolls) along with the respective turnstile requirements to process these passengers in the allotted vessel loading time. Exhibit 410-11 also gives the corresponding width for the queuing/mixing zone based on the overall turnstile and gate requirements. WSF is in the process of re-evaluating their toll collection strategy in terms of at which terminals tolls will be collected. The designer should confirm with WSF Operations at the time of design if there are any changes in passenger toll collection strategies over the design life of the terminal.
Terminal 2030
Pea
k Pa
ssen
ger
Saili
ng (w
alk-
ons)
[1]
Prim
ary
3’ S
tand
ard
Turn
stile
s (q
uant
ity)
Red
unda
nt 3
’ St
anda
rd T
urns
tiles
(q
uant
ity)
Prim
ary
4’ P
addl
e Tu
rnst
iles
(qua
ntity
)
Red
unda
nt 4
’ Pad
dle
Turn
stile
s (q
uant
ity)
4’ M
anua
l Gat
e (q
uant
ity)
Que
uing
/Mix
ing
Zone
W
idth
(ft)[
2]
Anacortes 541 3 1 1 1 1 24Coupeville 468 3 1 1 1 1 24Edmonds 330 2 1 1 1 1 21Fauntleroy - Southworth 96 1 1 1 1 1 18Fauntleroy - Vashon 95 1 1 1 1 1 18Mukilteo 190 1 1 1 1 1 18Point Defiance 89 1 1 1 1 1 18Port Townsend 453 3 1 1 1 1 24Seattle - Bainbridge 1,582 8 1 2 1 1 43Seattle - Bremerton 848 6 1 2 1 1 37Vashon 60 1 1 1 1 1 18
[1] 2030 Peak Passenger sailing is based on the 100th percentile busiest day for walk-on passengers.[2] Queuing/mixing zone width equals width of all primary and redundant turnstiles plus one manual gate.
Estimated Turnstile Requirements for 2030Exhibit 410-11
Chapter 410 Circulation and Passenger Waiting
WSF Terminal Design Manual M 3082.05 Page 410-17 April 2016
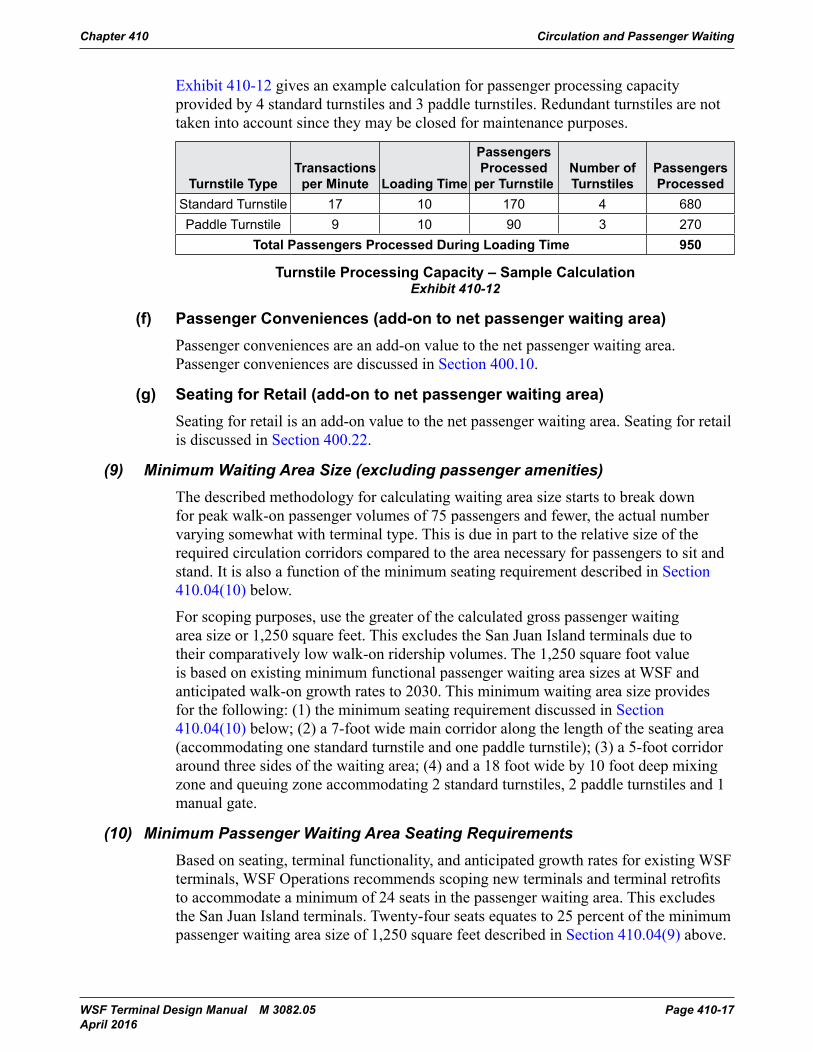
Exhibit 410-12 gives an example calculation for passenger processing capacity provided by 4 standard turnstiles and 3 paddle turnstiles. Redundant turnstiles are not taken into account since they may be closed for maintenance purposes.
Turnstile TypeTransactions
per Minute Loading Time
Passengers Processed
per TurnstileNumber of Turnstiles
Passengers Processed
Standard Turnstile 17 10 170 4 680Paddle Turnstile 9 10 90 3 270
Total Passengers Processed During Loading Time 950
Turnstile Processing Capacity – Sample CalculationExhibit 410-12
(f) Passenger Conveniences (add-on to net passenger waiting area)Passenger conveniences are an add-on value to the net passenger waiting area. Passenger conveniences are discussed in Section 400.10.
(g) Seating for Retail (add-on to net passenger waiting area)Seating for retail is an add-on value to the net passenger waiting area. Seating for retail is discussed in Section 400.22.
(9) Minimum Waiting Area Size (excluding passenger amenities)The described methodology for calculating waiting area size starts to break down for peak walk-on passenger volumes of 75 passengers and fewer, the actual number varying somewhat with terminal type. This is due in part to the relative size of the required circulation corridors compared to the area necessary for passengers to sit and stand. It is also a function of the minimum seating requirement described in Section 410.04(10) below.
For scoping purposes, use the greater of the calculated gross passenger waiting area size or 1,250 square feet. This excludes the San Juan Island terminals due to their comparatively low walk-on ridership volumes. The 1,250 square foot value is based on existing minimum functional passenger waiting area sizes at WSF and anticipated walk-on growth rates to 2030. This minimum waiting area size provides for the following: (1) the minimum seating requirement discussed in Section 410.04(10) below; (2) a 7-foot wide main corridor along the length of the seating area (accommodating one standard turnstile and one paddle turnstile); (3) a 5-foot corridor around three sides of the waiting area; (4) and a 18 foot wide by 10 foot deep mixing zone and queuing zone accommodating 2 standard turnstiles, 2 paddle turnstiles and 1 manual gate.
(10) Minimum Passenger Waiting Area Seating RequirementsBased on seating, terminal functionality, and anticipated growth rates for existing WSF terminals, WSF Operations recommends scoping new terminals and terminal retrofits to accommodate a minimum of 24 seats in the passenger waiting area. This excludes the San Juan Island terminals. Twenty-four seats equates to 25 percent of the minimum passenger waiting area size of 1,250 square feet described in Section 410.04(9) above.
Circulation and Passenger Waiting Chapter 410
Page 410-18 WSF Terminal Design Manual M 3082.05 April 2016
(11) Wheelchair, Companion, and Priority SeatingEquip terminal seating areas with wheelchair and companion seating in accordance with applicable ADA regulations (refer to Chapter 300). At a minimum provide the following wheelchair spaces: one wheelchair space for 4-25 seats, two wheelchair spaces for 26-50 seats, and four wheelchair spaces for greater than 51 seats. Provide at least one companion seat (a seat adjacent to the wheelchair space, at the same elevation as the wheelchair space) for each wheelchair space. Companion seats are to be equivalent in size, quality, comfort, and amenities to the seating in the immediate area.
In addition to the required wheelchair and companion seating, consider providing one priority seat (for elderly and persons with mobility disabilities) for each wheelchair space provided. Where priority seating is provided, include signage displaying the “international symbol of accessibility” and the terms “Priority Seating”.
(12) Winter Season Check on Passenger Waiting Area SizePeak sailings typically occur during the summer months when passengers can wait comfortably outside the terminal building. During the winter season, waiting outside the terminal building is less desirable. Compare the total indoor waiting area computed in Step 4 of Section 410.04(7) to the space required for all walk-on passengers in the peak “winter” sailing to stand (use November through February data for determining the peak winter sailing). Use the greater of the two values for the terminal building indoor waiting area sizing calculation. Consult with the WSF Planning Department to obtain the highest walk-on passenger count for a single sailing during the November to February time period. Inside accommodations are not required for drive-on passengers as they can wait in their vehicles.
(13) BuildingOfficialandFireMarshallApprovalDesign approval by the local Building Official and Fire Marshall is required to obtain building permits for the terminal buildings. Coordinate passenger waiting area size and layout with the local Building Official and Fire Marshall to ensure that the passenger waiting area complies with all building codes (IBC), federal emergency egress code, and local fire code. Adjust waiting area size and layout as required.
(14) Passenger Waiting Area FeaturesPassenger waiting area features may include heating, semi-heating, ventilation, cover, weather screening, and views. The passenger waiting areas are divided into three different conditioning types: heated/semi-heated space, covered space (non-heated), and open space (non-covered, non-heated). Terminals which cater to recreational uses have a higher degree of outside use during their peak season (summer) than commuter route terminals and require less semi-heated and covered space.
As a general rule of thumb, design the total covered passenger waiting area (indoor and outdoor combined) to accommodate the design event (peak sailing on 55th busiest day) at LOS E which translates into a space allotment of 2.5 square feet per passenger for standing and queuing and 6 square feet per passenger for sitting. Any additional passenger waiting space need not be covered. The need for weather screening is highly dependent on wind exposure and is evaluated on a terminal by terminal basis in conjunction with the outdoor spaces.
Chapter 410 Circulation and Passenger Waiting
WSF Terminal Design Manual M 3082.05 Page 410-19 April 2016
It is difficult to quantify the incorporation of views into passenger waiting areas. Views enhance the customer experience and are a valuable asset of the terminal. The incorporation of views into the passenger waiting areas can also provide credits toward LEED® building certification as part of the Indoor Environmental Quality evaluation (refer to Section 450.07 for discussion of LEED® building certification).
410.05 Passenger CirculationPassenger circulation refers to the travel paths through the terminal building used by passengers during loading and unloading and while accessing various terminal amenities.
(1) Primary Corridor Width for Passenger TerminalThe primary corridor width is the minimum required width for the walkways on the main travel path for boarding and departure within the terminal building. The minimum width for the primary corridor is based on the 85th percentile design event (the 55th busiest day peak sailing for walk-on ridership in the design year) as described in Section 410.04(2). Drive-on passengers do not impact the passenger terminal corridor width because they are required to be in their vehicles 20 minutes prior to loading. Design the primary corridor within the passenger waiting area per Section 410.04(8). Additionally, the primary corridor width must comply with current ADA standards for width. Refer to Chapter 300.
(2) Vertical CirculationVertical circulation components include stairs and elevators. Refer to local building codes for design and placement of elevators and stairs. Provide elevators that are ADA accessible and are capable of accepting a gurney. Dual elevators are strongly advised in areas of high traffic to promote public accessibility and provide redundancy in the event that an elevator is down for service or repair. Design elevators for a harsh waterfront environment and provide stainless steel finishes when used in public areas. Space requirements for stairs and elevators are not included in the Circulation, Structure, and Envelope Multipliers.
(3) Circulation, Structure, and Envelope MultipliersAccount for space requirements associated with terminal building circulation corridors, structural columns, and the building envelope (walls). For scoping purposes, estimate these building space requirements through the use of percentage multipliers applied to specific terminal building areas. Terminal building areas and their associated multipliers are identified in Appendix S. Note that circulation corridors are already taken into account in the indoor passenger waiting area calculations performed in Section 410.04(8), so only a building structure and envelope multiplier of 7 percent applies to this area.
Circulation and Passenger Waiting Chapter 410
Page 410-20 WSF Terminal Design Manual M 3082.05 April 2016
410.06 Boarding/Departing RoutesBoarding/departing routes are those designated routes between the pedestrian transfer span and the street or public way. Route walk-on passengers departing the ferry away from the boarding passengers and to public space as soon as possible. Minimize turning movements to the extent feasible along these routes.
Chapter 620 addresses the fixed and movable portions of the boarding/departing route which lie between the terminal building and the hinge point of the pedestrian transfer span. Boarding and departing routes within the terminal building are discussed in Section 410.05. All other portions of the boarding/departing routes, such as those providing access to the terminal building from the street, parking areas, and other transit facilities, are covered in Chapter 300 (Accessibility) and Chapter 550 (Site Circulation).