CHAPTER 4: GROUNDWATER EXPLOITATION IN KARNATAKA: A...
29
67 CHAPTER 4: GROUNDWATER EXPLOITATION IN KARNATAKA: A MACRO PERSPECTIVE 4.1 Introduction Groundwater resource in Karnataka is under severe stress for years owing to increasing demand and unwise planning. About 30 per cent of the state has been over exploited and the over-draft is estimated to be about 0.22 million hectare meters. The problem is so acute that it is likely to cause severe social stress and strong agitations. The groundwater exploitation went unabated due to absence of any institutional control. The current practice of water management is not supported by legislative control of these adverse impacts. Karnataka is largely dependent on groundwater to meet industrial, municipal, domestic and irrigation needs. This is due to variations in the availability of precipitation and lack of perennial surface water bodies. Normal rainfall in the state is 1,139 mms which is highly erratic in both space and time, varying from less than 600 mm in the northern districts to more than 4,000 mms in the coastal and Malnad districts. Rainfall in the vast southern plateau varies from 575 mm to 1,664 mms. Surface water availability is limited throughout the southern plateau of Karnataka. As a result, groundwater extraction in Karnataka has increased very rapidly over the past four decades. It has also witnessed rapid expansion of groundwater irrigation during the last five decades. Groundwater is now used so extensively that we can no longer afford to overlook the consequences. At the local level, an increasing number of districts today have larger areas of land irrigated by groundwater rather than surface water (GoK 2002). Besides, more than 90 per cent of rural water supply schemes are based on groundwater. With lack of adequate legal safeguards to control extraction and use of groundwater, the issue has become more of a collective responsibility now. The number of mechanised wells and tube wells also illustrates the rate at which groundwater irrigation has spread. At a macro level, there has been a steep increase in the number of wells running dry due to over exploitation of groundwater. Further, nearly 42 per cent of the total area in Karnataka has been overexploited and further groundwater development is creating several adverse externalities. Against this backdrop, this chapter looks into the extent to which groundwater is used in the state. The chapter sketches the development of groundwater in the state and shows how groundwater irrigation is historically grounded in the different regions. The much debated issue of water scarcity in Karnataka has been discussed
Transcript of CHAPTER 4: GROUNDWATER EXPLOITATION IN KARNATAKA: A...

67
CHAPTER 4: GROUNDWATER EXPLOITATION IN KARNATAKA: A MACRO PERSPECTIVE
4.1 Introduction Groundwater resource in Karnataka is under severe stress for years owing to
increasing demand and unwise planning. About 30 per cent of the state has been
over exploited and the over-draft is estimated to be about 0.22 million hectare
meters. The problem is so acute that it is likely to cause severe social stress and
strong agitations. The groundwater exploitation went unabated due to absence of
any institutional control. The current practice of water management is not supported
by legislative control of these adverse impacts. Karnataka is largely dependent on
groundwater to meet industrial, municipal, domestic and irrigation needs. This is due
to variations in the availability of precipitation and lack of perennial surface water
bodies. Normal rainfall in the state is 1,139 mms which is highly erratic in both space
and time, varying from less than 600 mm in the northern districts to more than
4,000 mms in the coastal and Malnad districts. Rainfall in the vast southern plateau
varies from 575 mm to 1,664 mms. Surface water availability is limited throughout
the southern plateau of Karnataka. As a result, groundwater extraction in Karnataka
has increased very rapidly over the past four decades. It has also witnessed rapid
expansion of groundwater irrigation during the last five decades. Groundwater is
now used so extensively that we can no longer afford to overlook the consequences.
At the local level, an increasing number of districts today have larger areas of land
irrigated by groundwater rather than surface water (GoK 2002). Besides, more than
90 per cent of rural water supply schemes are based on groundwater. With lack of
adequate legal safeguards to control extraction and use of groundwater, the issue
has become more of a collective responsibility now. The number of mechanised wells
and tube wells also illustrates the rate at which groundwater irrigation has spread. At
a macro level, there has been a steep increase in the number of wells running dry
due to over exploitation of groundwater. Further, nearly 42 per cent of the total area
in Karnataka has been overexploited and further groundwater development is
creating several adverse externalities.
Against this backdrop, this chapter looks into the extent to which groundwater is
used in the state. The chapter sketches the development of groundwater in the state
and shows how groundwater irrigation is his torically grounded in the different
regions. The much debated issue of water scarcity in Karnataka has been discussed

68
with the State’s response to groundwater management. Karnataka is the second
largest dry land agriculture economy in the country, next only to Rajasthan. The
demand for a secure water source is a prerequisite for agricultural development in
the state. Therefore, the development of groundwater assumes greater significance
in view of lack of surface water supply and an irregular rainfall pattern.
4.2 Pathways of Groundwater Development in Karnataka The spread of groundwater irrigation began in the 1950s in Karnataka. Since then,
Karnataka has witnessed three distinct phases of groundwater development mainly
due to institutional and technological changes. Later, due to aquifer development,
the groundwater scenario changed drastically leading to groundwater over-
exploitation. The three phases of groundwater development are presented below in
order to understand the resource utilisation pattern in Karnataka (Table 4.1).
First phase: The first phase that commenced in the 1950s was dominated by
traditional dug wells with depths ranging between 25 – 30 feet and a diameter of 25
feet. This was the trend till the mid-1960s. The major mode of water extraction
during this period was the ‘Persian wheel’ and other labour-intensive devices. There
was combined use of groundwater and tank water for irrigation. Since water
extraction was through shallow dug wells, the extraction rate matched demand and
supply has provided aquifer sustainability. Importantly, the distance between wells
was beyond the hydrological threshold. Most of the wells were located near water
bodies which provided recharging facility. Therefore, water quality was not a
problem. During this phase agriculture was not commercialised and food production
was only for domestic purposes. Commercial crops were not cultivated and it
restricted demand for water. This phase witnessed more stable and sustainable use
of groundwater with overall balance between extraction and recharge.
Second phase: The second phase of groundwater development in Karnataka was
dominated by the growth of dug-cum-bore wells (DCBWs). This phase commenced
in 1970 and lasted till 1980. The growth of DCBWs was the major remarkable
change in this phase. These wells had depths ranging between 45-100 feet. This
phase also witnessed the growing use of technology in water extraction. DCBWs
were drilled inside the dug wells to enhance the yield and centrifugal pumps were
used for water extraction. The water yield of a DCBW was more compared to that of
a dug well. Thus, farmers brought more area under groundwater irrigation. During
this period there was a gradual shift in the cropping pattern from food to commercial
crops that required more water. The shift in the technology used for groundwater

69
extraction from dug wells to DCBWs was a welcome change for the farmers who
brought more areas under cultivation. This reduced the fallow season. Since farmers
were using centrifugal pumps, they started pumping more water to meet increased
demand without regard to the recharge capabilities of the wells. This caused a
recurring shortfall of water in the wells. To augment water in the DCBWs, farmers
opted for multiple bore wells within the dug wells involving additional investments
and increased cost of extraction because they were paying pro-rata electricity
charges.
Third phase: The third phase began in 1980 with the introduction of surface bore
wells with a diameter of 6 inches and a depth of 300 to 450 ft. The yield level of
surface bore wells was higher than the dug wells and the DCBWs. The extraction
mechanism shifted from centrifugal pumps to submersible pump of high capacity up
to 10 hp. Thus, the yield of bore wells was higher than the DCBWs and dug wells.
With the introduction of deep surface bore wells fitted with high capacity
submersible pump sets, groundwater extraction changed considerably.
During this phase, the groundwater irrigation received a boost from the government
in terms of electricity subsidy for agricultural pump sets. As a result, the marginal
cost of groundwater extraction became zero. The electricity subsidy acted as a
strong incentive to sink more wells and draw greater volumes of water to meet the
increased demand of commercial crops. The progressive expansion of groundwater
based commercial agriculture induced well interference and a high incidence of well
failures. Nagaraj (1994) observed that the introduction of bore well technology
induced a shift in the cropping pattern from low water-intensive food crops to high
water-intensive commercial crops such as vegetables, flowers, fruits and sugarcane
in the hard rock areas.
Table 4:1: Pathways of groundwater development in Karnataka
Particulars First phase Second phase Third phase Year of commencement 1950 1970 1980 Type of wells Dug wells Dug well and Dug-
Cum-Bore Wells Bore wells
Average depth (ft) 25 to 30 45 to 100 350 to 400 Average life (yr) 15-20 10 2-5 Pump capacity (hp) 3 hp 5 hp 10 hp Mode of extraction Persian
wheel Centrifugal pump Submersible pumpsets
Average yield (gallons) - 3500 2000-800 Energy type Animals Electricity Electricity Cropping pattern Paddy, Ragi,
Jowar Paddy, Ragi, Jowar, Sugarcane
Paddy, Ragi, Jowar, Sugarcane, Turmeric, Mulberry
The introduction of surface bore wells in the development of groundwater irrigation
produced several negative impacts. After 1980s, groundwater-based agriculture

70
shifted to commercial crops and induced higher demand for reliable water sources.
Groundwater from deep surface bore wells provided reliable and democratic
exploitation of water to sustain these crops. In this process the yield of dug wells
and DCBWs declined drastically. The investments in deep bore wells increased
manifold. The depth of the wells also increased the cost of operation and
maintenance of pump sets. Rapid changes were noticed over four decades in the
groundwater irrigation economy of the hard rock regions in Karnataka. The
significant changes include growth of wells, increasing depth of wells, failure of
wells, disappearance of traditional lifts, increasing cost per unit of water extracted,
high density of wells per unit of area without considering spacing criteria, increasing
area under commercial crops, increasing cost of well improvement and shift to dry
land agriculture in some cases. All this indicates that groundwater sustainability is in
a precarious condition in the hard rock areas.
The above discussion raises several questions for further research. How much
groundwater is used and what is the status of groundwater resources in Karnataka?
What is the status of the gross and net irrigated area with regard to stages of
groundwater development? What are the implications of the water scarcity problem
in Karnataka? What is the response from the state in dealing with the problem of
water scarcity? These questions have been discussed in the subsequent sections.
4.3 Groundwater Availability and Utilisation in Karnataka
Groundwater occurs in the state in three major hydro-geological provinces31 under
unconfined to semi-confined conditions and under confined conditions in depth.32
The rock units of the provinces do not have the primary porosity, therefore the
occurrence and movement of groundwater is through secondary porosity developed
from the erosion and structural deformity of the rocks. The main source of
recharge33 for the aquifers is by precipitation and applied irrigation (DMG & CGWB
2005).34
31 The three hydro-geological provinces are: (a) The Achaean Crystalline Hard Rock Province; (b) Metamorphosed Sedimentary Province; and (c) Deccan Trap Province. 32 Confined and un-confined conditions refers to the situation where the groundwater table is shallow in case of unconfined aquifers whereas deep water table in the case of confined conditions. 33 Annual recharge has been computed by adding monsoon and non-monsoon rainfall recharge, return recharge from irrigation and seepages from surface water bodies, canals and water conservation structures. Annual groundwater availability is computed by deducting unaccounted natural discharge from annual recharge as suggested in GEM-1997. 34 The major improvements over the GEC 1984 are as follows: (i) watershed is taken as assessment unit and then appropriated for administrative units (ii) Sub areas viz., hilly area is excluded, poor quality areas as per local standards separately dealt with and the rest of the area is classified as command and non-command for groundwater assessment. (iii) Season-wise groundwater resource assessment is done for each sub area. For monsoon recharge,

71
According to the Department of Mines and Geology, the net annual groundwater
availability is about 0.158 m ham which is spread across four major blocks (Table
4.2). However, the existing gross groundwater draft for all uses varies from 0.024 m
ham in safe blocks to 0.023 m ham in overexploited blocks. This suggests that the
gross groundwater availability in Karnataka is almost evenly distributed across all the
blocks. Net groundwater availability for future development of irrigation indicates
that groundwater based agriculture might face a severe resource crunch. The
situation is worst in the case of over exploited blocks compared to others (Table
4.2).
Table 4:2: Groundwater availability in Karnataka – 2004-05 (m.ham)
Blocks AGWR NAGWA EGGWDI EGGWDDI EGGWDA ADI NGWI BGWIP
Safe 0.070 0.067 0.020 0.004 0.024 0.006 0.043 0.056
Semi critical 0.052 0.050 0.034 0.003 0.038 0.005 0.017 0.020
Critical 0.022 0.021 0.021 0.001 0.023 0.002 0.004 0.005
Overexploited 0.013 0.013 0.022 0.001 0.023 0.002 0.001 0.001
Total 0.158 0.152 0.097 0.010 0.107 0.014 0.064 0.081 Notes: AGWR: Total Annual Ground Water Recharge (Ham) NAGWA: Net Annual Ground Water Availability (Ham); EGGWDI: Existing Gross Ground Water Draft for Irrigation (Ham); EGGWDDI: Existing Gross Ground Water Draft for Domestic and Industrial Water Supply (Ham); EGGWDA: Existing Gross Ground Water Draft for All Uses (Ham); ADI: Allocation for Domestic and Industrial Use for Next 25 Years (Ham); NGWI: Net Ground Water Availability for Future Irrigation Development (Ham); BGWIP: Balance Ground Water Irrigation Potential Available (Ha) Source: Dept. of Mines & Geology, 2004-05.
The net annual recharge rate, as estimated in 1994, was 1.62 m ham, of which
about 0.496 m ham was exploited for irrigation. In 1999, the net recharge was
estimated to be 2.50 m ham in safe watersheds and 0.297 m ham in over-developed
watersheds. The groundwater available after being used for different purposes was
1.568 m ham in safe areas and –0.038 m ham in over-developed areas (Table 4.3).35
The 1999 survey was based on the Groundwater Estimation Committee Methodology post monsoon water levels is taken after a month cessation there by ensuring that base flow immediately after monsoon, not utilised for development, is avoided during estimation. (vi) Methodology has been provided for determination of specific yield based on ground water balance approach in dry season for non-command area in hard rock terrain. (v) Norm for return flow from irrigation is based on type of source, type of crop and depth to water table. (vi) Categorisation based on stage of development and long term trend in pre and post monsoon water levels. (vii) Allocation for domestic and industrial use is more realistic based on population density and relative load on groundwater for the purpose. 35 Safe areas: (i) Safe areas where stage of development is less than 70 per cent and there is no significant long term decline of pre monsoon or post monsoon water level trend. Such areas have potential for groundwater development. (ii) Areas where stage of development is between 70-90 per cent and there is no significant decline of water level trend. Semi-critical areas: Semi-critical areas where stage of groundwater development is 70-90 per cent and water table during either pre or post monsoon shows a significant long term declining trend. Critical areas: (i) Areas where stage of groundwater development is more than 90 per cent and long term water level trend of either pre-monsoon or post monsoon shows a falling trend. (ii) Areas where stage of groundwater development is less than or equal to 100 per cent and the water table trend during both pre-monsoon and post monsoon shows a significant long term falling trend. Overexploited: Areas where groundwater development is more than 100 per cent and long term water table trend during both pre-monsoon and post-monsoon show significant declining trend.
72
(GEM) of 1997, in which recharge from canals, tanks and fields, including rainfall
infiltration, was considered (SOER 2003).
Table 4:3: Groundwater Utilisation in Karnataka
Groundwater Utilisation across Different Sectors (in m ham) Year Domestic & Industrial
Use Irrigation Balance Potential
available for utilisation 1994 0.242 0.496 0.879
1999 0.112 (safe) 0.014(over developed)
0.823 (safe) 0.297 (ove r developed)
1.568 (safe) -0.038 (over developed)
2004 0.140 0.647 1.071
Source: Department of Mines & Geology, GoK (2003) The gross draft for irrigation was reported to be nearly 85 to 90 per cent of the
groundwater used in the state. About 6 per cent of the total groundwater available
in the state was reportedly used for domestic purposes (as per the Department of
Mines and Geology it is approximately 766 m cubic mts). Nearly, 79 per cent of the
population is depending on groundwater for domestic water requirements
(Department of Mines & Geology, 2002). The dependency is higher in rural (about
90 per cent) areas. Groundwater draft in overdeveloped areas is more than the net
annual recharge.
In 2004, based on GEM 1997, the recharge from rainfall during monsoon season was
estimated to be 8.17 lakh hectare metre, which contributes to nearly 15.92 lakh
hectare metre of the annual groundwater recharge in the state (DMG & CGWB
2005). Similarly, recharge from other sources during the monsoon season (nearly 4
lakh ham), recharge from rainfall during non-monsoon season (1.49 lakh ham) and
recharge from other sources during non-monsoon period (2.25 lakh ham)
contributed to the total annual recharge. Importantly, the total resource of the over
exploited watersheds was 0.38 m ham as against the draft of 0.60 m ham thus
accounting for an over draft of 0.22 m ham.
4. 4 Irrigation and Land use in Karnataka There are 30 districts spread across four major sub-regions in Karnataka. Prior to
1996, there were 20 districts in the state. Between 1996 and 1998, seven new
districts and in 2008 three more districts were carved out. In this chapter, however,
the data has been organised for 30 districts to facilitate comparison in the analysis
over a period of time. We have categorised the 30 districts into four sub-regions viz.,
Sub-region 1, Sub-region 2, Sub-region 3 and Sub-region 4 on the basis of agro-
climatic features such as soil type, rainfall and crop pattern. The districts that fall
under the different sub-regions are shown in Table 4.4. The purpose of this analysis

73
is to establish whether or not there was any variation in the extraction of
groundwater for irrigation in these sub-regions.
Table 4:4: Districts of Karnataka state falling under different sub-regions
Sl. No.
Sub-regions Districts
1 Sub-region 1 Belgaum, Bellary, Bijapur, Bidar, Dharwad, Gulbarga, Raichur, Koppal, Bagalkot, Haveri and Gadag
2 Sub-region 2 Bangalore (U), Bangalore (R), Chitradurga, Davanagere, Kolar and Tumkur, Chikkaballapur, Ramanagaram
3 Sub-region 3 Mandya, Mysore, Hassan and Chamarajanagar 4 Sub-region 4 Chikmagalur, Kodagu, Shimoga, Dakshina Kannada,
Uttara Kannada and Udupi Source: High Power Committee, GoK, 2002.
Agriculture is the predominant sector that enhances rural livelihood for nearly 60 per
cent of the rural population. Groundwater over-exploitation is a major constraint
faced by the agricultural sector. Many parts of the state are bearing the brunt of
rapidly declining groundwater tables. Irrigation intensity, an indicator of agricultural
efficiency, reveals that the potential of irrigation has been declining marginally over
a period of time indicating that the expansion of irrigated area could result in a
negative marginal increment. The sub-regional analysis of irrigation intensity
indicates that Sub-region 1 is showing positive intensity while other regions show
declining trends (Table 4.5). Importantly, Sub-region 2, being a region with poor
water resources, is experiencing dwindling irrigation intensity indicating the negative
impact of water scarcity. This was due to heavy demand for groundwater
accompanied by limited supply of surface irrigation, which was affected by varying
rainfall patterns.
In terms of absolute figures, while the gross irrigated area in the state has increased
from 2,101 thousand hectares in 1984-85 to 3,632 thousand hectares in 2005-06,
the net irrigated area increased from 1,693 thousand hectares to 2,969 thousand
hectares during the same period. This increasing trend in gross and net irrigated
area has been associated with the groundwater availability in the state. Significantly,
among all the sub-regions, Sub-region 1 has shown an impressive improvement in
terms of gross and net irrigated area. This was due to the initiation of the Upper
Krishna Project. The Ghataprabha and Malaprabha irrigation projects have also
brought more areas under irrigation (KDR 2007). Sub-region 2 has also shown
impressive growth in irrigated area which was predominantly dependent on
groundwater. This is an indication of groundwater emerging as an important source
of irrigation in Sub-region 2. Moreover, Sub-region 2 does not have any perennial
source of surface irrigation to facilitate irrigated agriculture. Thus, the area under

74
irrigation in terms of gross and net irrigated area was increasing in this region
(Figure 4.1).
Table 4:5: Gross and Net irrigated area in Karnataka
Gross Irrigated Area (000’ ha) Net Irrigated Area (000’ ha) Irrigation Intensity (%) Sub-regions 1984-85 1995-96 2005-06 1984-85 1995-96 2005-06 1984-85 1995-96 2005-06 SR1 1015.9 1638.5 2129.6 809.9 1325.3 1700.8 125 124 125 SR2 427.9 493.0 667.7 337.5 362.8 548.7 127 136 122 SR3 314.8 389.5 491.2 265.4 330.8 413.9 119 118 119 SR4 342.5 359.9 343.7 280.3 305.7 306.5 122 118 112 Total 2101.0 2880.9 3632.2 1693.1 2324.5 2969.9 124 124 122
Source: Directorate of Economic and Statistics, GoK
The growth rates estimated for gross and net irrigated area were positive for almost
all the blocks (Table 4.6). Gross irrigated area decreased at 2.3 per cent during
1984-85 to 2005-06 while net irrigated area increased marginally. Interestingly, the
growth rates of gross and net irrigated area has been increasing rapidly in Sub-
region 2 though the region is heavily dependent on groundwater. This shows that
the intensity of groundwater extraction in the region. Evidently, the growth rate of
gross irrigated area was just 1.3 per cent in 1984-85 to 1995-96, it increased to 3.1
per cent from 1995-96 to 2005-06. However, the net irrigated area showed
significant growth from 0.7 per cent to 4.2 per cent during the same period.
0
500
1000
1500
2000
2500
1984-85 1995-96 2005-06 1984-85 1995-96 2005-06
Gross Irrigated Area Net Irrigated Area Year
Are
a (0
00' h
a)
SR1 SR2 SR3 SR4
Figure 4-1: Gross and net irrigated area in sub-regions of Karnataka The increasing trend in gross and net irrigated area in Sub-region 1 and Sub-region
2 was due to the expansion of surface irrigation sources and private investment in
groundwater extraction (Figure 4.1 and Table 4.6). In Sub-region 1 the Upper
Krishna Project brought about phenomenal changes in the agricultural development
of northern Karnataka. Larger areas were irrigated and agriculture productivity
increased. Besides, in a fragile region such as Sub-region 2 with no surface irrigation
projects, private investment in bore well irrigation boosted the gross and net
75
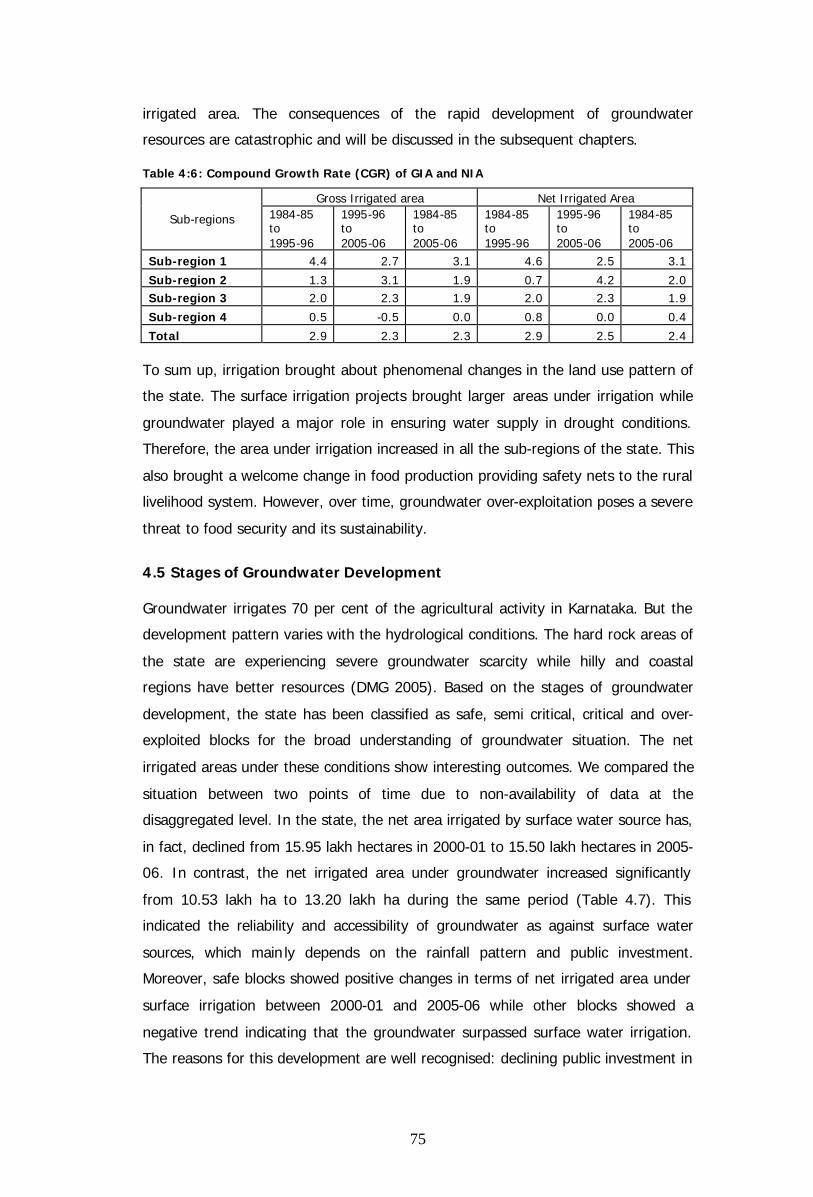
irrigated area. The consequences of the rapid development of groundwater
resources are catastrophic and will be discussed in the subsequent chapters.
Table 4:6: Compound Growth Rate (CGR) of GIA and NIA
Gross Irrigated area Net Irrigated Area
Sub-regions 1984-85 to 1995-96
1995-96 to 2005-06
1984-85 to 2005-06
1984-85 to 1995-96
1995-96 to 2005-06
1984-85 to 2005-06
Sub-region 1 4.4 2.7 3.1 4.6 2.5 3.1
Sub-region 2 1.3 3.1 1.9 0.7 4.2 2.0 Sub-region 3 2.0 2.3 1.9 2.0 2.3 1.9
Sub-region 4 0.5 -0.5 0.0 0.8 0.0 0.4
Total 2.9 2.3 2.3 2.9 2.5 2.4 To sum up, irrigation brought about phenomenal changes in the land use pattern of
the state. The surface irrigation projects brought larger areas under irrigation while
groundwater played a major role in ensuring water supply in drought conditions.
Therefore, the area under irrigation increased in all the sub-regions of the state. This
also brought a welcome change in food production providing safety nets to the rural
livelihood system. However, over time, groundwater over-exploitation poses a severe
threat to food security and its sustainability.
4.5 Stages of Groundwater Development Groundwater irrigates 70 per cent of the agricultural activity in Karnataka. But the
development pattern varies with the hydrological conditions. The hard rock areas of
the state are experiencing severe groundwater scarcity while hilly and coastal
regions have better resources (DMG 2005). Based on the stages of groundwater
development, the state has been classified as safe, semi critical, critical and over-
exploited blocks for the broad understanding of groundwater situation. The net
irrigated areas under these conditions show interesting outcomes. We compared the
situation between two points of time due to non-availability of data at the
disaggregated level. In the state, the net area irrigated by surface water source has,
in fact, declined from 15.95 lakh hectares in 2000-01 to 15.50 lakh hectares in 2005-
06. In contrast, the net irrigated area under groundwater increased significantly
from 10.53 lakh ha to 13.20 lakh ha during the same period (Table 4.7). This
indicated the reliability and accessibility of groundwater as against surface water
sources, which main ly depends on the rainfall pattern and public investment.
Moreover, safe blocks showed positive changes in terms of net irrigated area under
surface irrigation between 2000-01 and 2005-06 while other blocks showed a
negative trend indicating that the groundwater surpassed surface water irrigation.
The reasons for this development are well recognised: declining public investment in
76
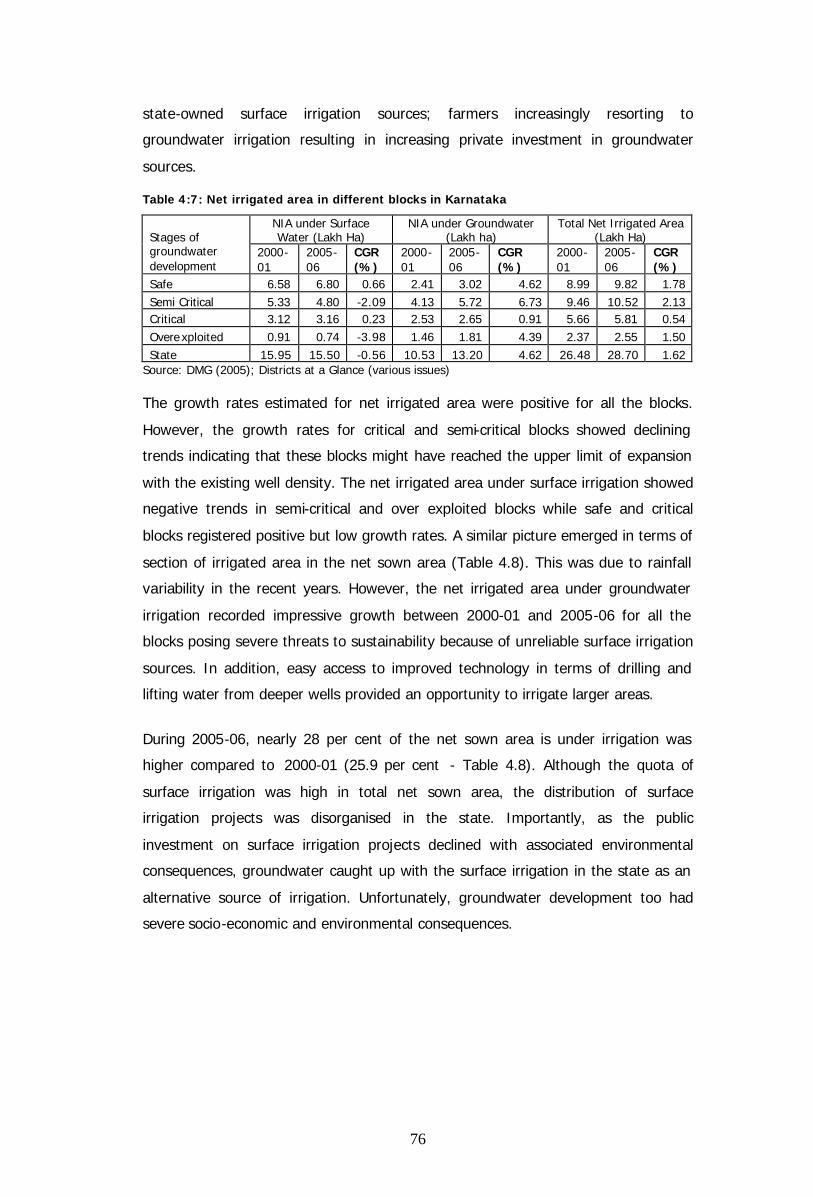
state-owned surface irrigation sources; farmers increasingly resorting to
groundwater irrigation resulting in increasing private investment in groundwater
sources.
Table 4:7: Net irrigated area in different blocks in Karnataka
NIA under Surface Water (Lakh Ha)
NIA under Groundwater (Lakh ha)
Total Net Irrigated Area (Lakh Ha) Stages of
groundwater development
2000-01
2005-06
CGR (%)
2000-01
2005-06
CGR (%)
2000-01
2005-06
CGR (%)
Safe 6.58 6.80 0.66 2.41 3.02 4.62 8.99 9.82 1.78 Semi Critical 5.33 4.80 -2.09 4.13 5.72 6.73 9.46 10.52 2.13 Critical 3.12 3.16 0.23 2.53 2.65 0.91 5.66 5.81 0.54 Overexploited 0.91 0.74 -3.98 1.46 1.81 4.39 2.37 2.55 1.50 State 15.95 15.50 -0.56 10.53 13.20 4.62 26.48 28.70 1.62
Source: DMG (2005); Districts at a Glance (various issues) The growth rates estimated for net irrigated area were positive for all the blocks.
However, the growth rates for critical and semi-critical blocks showed declining
trends indicating that these blocks might have reached the upper limit of expansion
with the existing well density. The net irrigated area under surface irrigation showed
negative trends in semi-critical and over exploited blocks while safe and critical
blocks registered positive but low growth rates. A similar picture emerged in terms of
section of irrigated area in the net sown area (Table 4.8). This was due to rainfall
variability in the recent years. However, the net irrigated area under groundwater
irrigation recorded impressive growth between 2000-01 and 2005-06 for all the
blocks posing severe threats to sustainability because of unreliable surface irrigation
sources. In addition, easy access to improved technology in terms of drilling and
lifting water from deeper wells provided an opportunity to irrigate larger areas.
During 2005-06, nearly 28 per cent of the net sown area is under irrigation was
higher compared to 2000-01 (25.9 per cent - Table 4.8). Although the quota of
surface irrigation was high in total net sown area, the distribution of surface
irrigation projects was disorganised in the state. Importantly, as the public
investment on surface irrigation projects declined with associated environmental
consequences, groundwater caught up with the surface irrigation in the state as an
alternative source of irrigation. Unfortunately, groundwater development too had
severe socio-economic and environmental consequences.

77
Table 4:8: Irigation as a percentage of Net Sown area in Karnataka
2000-01 2005-06
Blocks
Irrigation as a % of NSA
NIA under surface as a % of NSA
NIA under groundwater as a % of NSA
Irrigation as a % of NSA
NIA under surface as a % of NSA
NIA under groundwater as a % of NSA
Safe 21.8 16.0 5.8 24.0 16.6 7.4 Semi critical 27.8 15.7 12.1 29.6 13.5 16.1 Critical 31.8 17.5 14.2 32.0 17.4 14.6 Overexploited 25.8 9.9 15.9 26.4 7.7 18.7 Karnataka 25.9 15.6 10.3 27.5 14.9 12.7
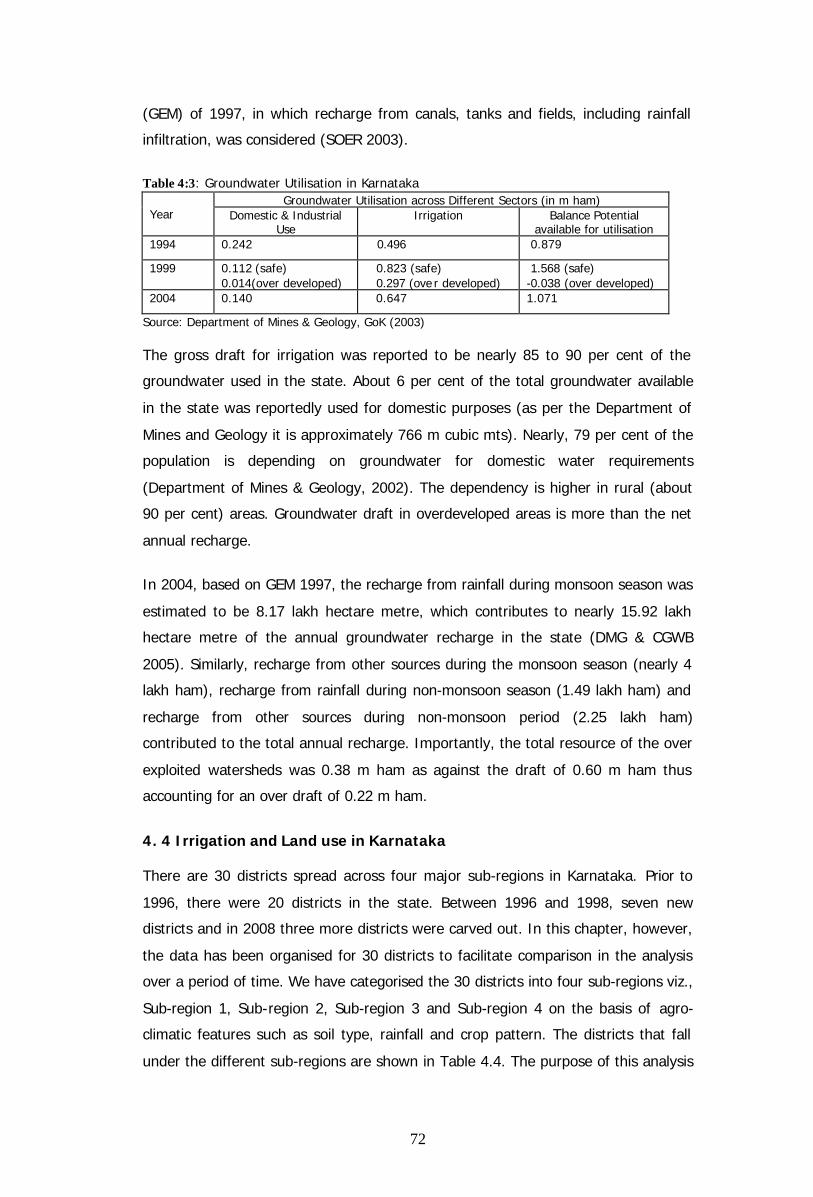
Table 4.9 shows a break up of the growth in irrigation in the different sources of
irrigation. A few interesting observations can be made. First, in terms of canal
irrigation there was a positive change over a period of time. The positive growth of
canal irrigation was due to the recent investment made by the government in canal
irrigation. However, surface irrigation as a whole, has shown mixed trends in terms
of contribution to the net irrigated area. Second, the area covered by tank irrigation
has fallen by almost 0.9 per cent. This could be due to several reasons - Karnataka
is historically dependent on tank irrigation, but the region might be going through a
phase wherein the old traditional collective system of tank maintenance was
collapsing with newer systems were yet to emerge. Third, farmers were increasingly
resorting to groundwater irrigation through open wells, dug-cum-bore wells and bore
wells. Importantly, the segment of well irrigated areas in the net sown area has
fallen by 0.6 per cent while area under bore wells has increased significantly to over
3 per cent. This also suggests that the emergence of groundwater as a productive
resource due to lack of surface irrigation facilities. The change in net irrigated area
during 2000-01 and 2005-06 is presented in Table 4.9 and figure 4.2.
-3.0
-2.0
-1.0
0.0
1.0
2.0
3.0
4.0
5.0
6.0
Canal Tank Well Bore Lift Others Total
Irrigation Sources
Cha
nge
in N
IA (%
)
Safe Semi critical Critical Overexploited Total
Figure 4-2: Changes in net irrigated area in Karnataka
Among all the sources, area under bore wells and lift irrigation have shown positive
change over a period of time while other sources have registered negative change
(Figure 4.2). Importantly, the area irrigated by tanks in the total net sown area has
been showing negative change indicating that the old community ownership and

78
management has shifted to market oriented management mechanisms. This change
is also due to rainfall variations leading to ecological insecurity among the rural
people. On the other hand, open wells and dug-cum-bore wells have lost their
irrigation potential due to the introduction of high technology-oriented deeper
surface bore wells. These also have negative impact on the cost of groundwater
extraction as well as higher draw down of the resource. This resulted in drying up of
open wells and area irrigated by these sources declined while area irrigated by bore
wells increased significantly.

79
Table 4:9: Irrigation as a percentage of Net Sown Area according to sources
2000-01 2005-06 Change (%)
Sources Safe Semi critical Critical
Over exploited Total Safe
Semi critical Crit ical
Over exploited Total Safe
Semi critical Critical
Over exploited Total
Canal 10.0 9.8 9.5 4.3 9.3 11.9 8.5 9.7 3.5 9.6 1.9 -1.3 0.2 -0.7 0.3 Tank 3.1 2.1 1.9 3.2 2.6 2.6 1.0 1.2 0.9 1.7 -0.5 -1.1 -0.6 -2.3 -0.9 Well 3.4 5.9 6.1 3.4 4.7 3.9 5.1 4.2 1.4 4.1 0.5 -0.9 -1.9 -1.9 -0.6 Bore wells 2.4 6.2 8.1 12.5 5.6 3.5 11.1 10.4 17.3 8.5 1.0 4.9 2.3 4.7 3.0 Lift irrigation 0.3 0.6 1.8 0.1 0.7 0.4 1.7 2.5 0.5 1.2 0.1 1.1 0.6 0.3 0.6 Others 2.5 3.2 4.3 2.3 3.0 1.6 2.3 4.0 2.8 2.4 -0.9 -0.9 -0.3 0.5 -0.7 Total 21.8 27.8 31.8 25.8 25.9 24.0 29.6 32.0 26.4 27.5 2.1 1.8 0.2 0.6 1.6
Note: Change has been estimated taking the difference between percentages obtained in 2005-06 less percentages obtained in 2000-01. Source: Directorate of Economics and statistics, GoK.

80
4.6 Groundwater Over-exploitation in Karnataka The above discussion amply demonstrates that there was increasing pressure on the
groundwater resource in the state. Grossly mismanaged water resources resulted in
a water crisis in Karnataka that lasted for more than a decade. Due to uneven
distribution of surface water sources, the state’s water needs were largely met
through exploitation of groundwater. During 2005-06, of the 28.69 lakh hectare of
net irrigated area, nearly 46 per cent of the area was irrigated by groundwater and
the contribution from bore wells (31 per cent) was higher than the other wells
(nearly 15 per cent). As a result, groundwater resources showed signs of over-
extraction. Recent figures released by the Department of Mines and Geology show
that groundwater is deteriorating in the state and more than 80 watersheds have
been categorised as over-exploited covering nearly 30 per cent of the state’s total
geographical area (GoK 2005).
In 1994, about 40 watersheds were declared overexploited while in 2005 it increased
to 80. The number of over-exploited taluks increased from 43 in 1994 to almost 86
and majority of them were either critical or over-exploited (Table 4.10). About one-
third of the state’s total geographical area was in the overexploited and critical
category. As per the 1994 status, in 43 taluks water withdrawal exceeded 65 per
cent of water availability; in 29 taluks groundwater extraction exceeded 50 per cent
of available water. A recent estimate shows that 72 taluks are overdrawing
groundwater in the state (SOER 2003).
Table 4:10: Groundwater resource condition in the state
Sl. No.
Categorisation Area (Sq. km) No. of watersheds
No. of taluks % area of the state
1 Safe 1,11,934.62 127 51 58.1 2 Semi-critical 16,763.52 17 0 8.7 3 Critical 7,347.23 10 0 3.8 4 Overexploited 56,618.96 80 22 29.4 Total 1,92,664.39 234 73* 100
Note: * 102 taluks are partly safe/semi-critical/critical/over-exploited. Source: DMG & CGWB, 2005. The estimate in the report on Dynamics of Groundwater Resources reveals that
the demand from the agricultural and domestic sectors is a major threat to
sustainability. However, the projection made by the Water and Land Management
Institute (WALMI) reveals that the percentage of water utilised by the agriculture
sector would decrease during the next 20 years while that of the others would
increase (WALMI 1998). How to meet the demand for additional water in 2025 is a
major issue challenging water management efforts in the state.

81
Several studies have revealed that the scarcity of groundwater is a worrying issue
with the number of failed wells constantly increasing. A study by Nagaraj et al
(2003) revealed that the number of wells increased three times with simultaneous
reduction in the percentage of functioning wells. The investment per well increased
one-and-a-half times, water extraction per well reduced by three times and the
annual irrigation cost increased by three times (Nagaraj et al 2003). With the
number of failed wells increasing and the water tables declining, the annual cost of
irrigation per acre of NIA dramatically increased in the hard rock areas of the state
(Shivakumaraswamy and Chandrakanth 1997; Chandrakanth et al 2004; Dhiwakara
et al 2006).
Consequently, numerous problems cropped up in Karnataka. The problems with
regard to groundwater development are manifold undermining the socio-economic
and ecological security among people. The impact was catastrophic with regard to
agricultural development and the domestic sector owing to heavy dependence on
groundwater for irrigation, drinking water supply and sanitation services. The major
consequences of groundwater development are discussed below:
4.6.1 Rising Irrigation Structures Due to indiscriminate pumping of groundwater, the water table has gone down in
several blocks. When withdrawal exceeds the replenishing capacity of the aquifer, it
will lead to unsustainable extraction levels in the hard rock regions. It is clear from
Table 4.11 that since 1980s over exploitation of groundwater has taken place in the
state by digging more wells. The analysis reveals that the total number of wells in
Karnataka has grown from merely 4.33 lakhs in 1985-86 to 10.01 lakhs in 2004-05
(Table 4.11). The number of bore wells increased rapidly during this period while
other types of wells showed steady growth. For instance, the number of bore wells
has increased from 0.18 lakhs in 1985-86 to almost 5.21 lakhs in 2004-05. This
shows how the groundwater extraction is taking place in the state.
The growth rate of wells was positive for all the sub-regions (SR). For the state as a
whole, the number of wells has been growing at a rate of 4.42 per cent during 1980-
81 to 2004-05. The growth rates are high for SR3 followed by SR2, SR1 and SR4
during 2000-01 to 2004-05. Interestingly, the growth of wells in SR4 is low indicating
the lower intensity of groundwater extraction in the region.

82
Table 4:11: Compound Growth Rate of wells across sub-regions in Karnataka
Sub Regions
1980-81 to 1984-85
1985-86 to 1989-90
1990-91 to 1994-95
1995-96 to 1999-2000
2000-01 to 2004-05
1980-81 to 2004-05
SR1 2.22 2.32 6.69 3.28 7.52 3.82
SR2 5.19 3.65 6.68 4.29 4.10 5.07
SR3 9.33 7.52 3.57 17.70 4.93 8.76
SR4 1.90 6.12 3.69 -13.23 10.05 1.82
Karnataka 3.21 3.91 5.91 2.39 5.96 4.42 CGR = Compound Growth Rate was worked out using the formula; Y = ab t where Y = log value of number of wells; a = intercept, b = regression coefficient and t = time period in years, CGR = (antilog of b-1)*100. There are several reasons behind the rapid increase in groundwater irrigation wells
in the state. First, the state intervened initially through agrarian reforms, later by
providing credit facilities and indirectly supporting over exploitation of groundwater.
Second, availability and access to improved technology in drilling contributed much
to accelerate the extraction of groundwater. Third, increasing demand for food
grains encouraged the adoption of multi-season crop patterns which in turn
accelerated groundwater extraction. Fourth, in addition to credit facilities, the
government provided electricity at zero marginal rates for irrigation pump sets. This
provided an opportunity even to small and marginal farmers to have irrigation we lls.
The effects were catastrophic – there was high demand for electricity to run the
pump sets. As a result the electricity board supplying subsidised power faced a
severe financial crunch; the quality of electricity supply services too deteriorated.
4.6.2 Multiplication of Failed Wells The above factors influenced farmers to install irrigation wells indiscriminately. In
addition, fragmentation of landholding due to division of families developed
competition among farmers in exploitation of groundwater resources. This not only
facilitated competitive drilling but also promoted indiscriminate pumping. As a result,
in most of the areas progressive lowering of water table became a severe problem
leading to higher incidences of well failure.
Karnataka had 10.01 lakh irrigation wells at the end of 2004-05 with bore wells
numbering about 5.21 lakh and other wells about 4.8 lakh. Sub-region 2 (2.76 lakhs)
and Sub-region 1 (1.33 lakhs) contributed significantly to the bore well strength in
the state. These two regions also have the maximum number of open wells (Table
4.12). As the number of bore wells multiplies, the rate of extraction also increases.
Consequently, shallow wells run dry and contribute to the number of failed wells.
The incidence of well failure was a common occurrence in recent years due to
declining water tables in the state. Recent data shows that about 10.4 per cent of
the total wells failed during 2004-05. It was about 7.5 per cent and 12.6 per cent

83
during 1985-86 and 1995-96, respectively. Sub-region2 registered the highest
percent of failed wells compared to other sub-regions (Table 4.12). This was due to
the following reasons: First, limited supply of surface irrigation encourages use of
groundwater by drilling more wells. The declining draft-recharge ratio in the region
results in failure of shallow wells. Second, there are no significant recharge sources
except rainfall infiltration and applied irrigation. Third, declining storage capacity of
tanks has led to the current level of well failure in the region.
Unfortunately, the above discussion is incomplete owing to lack of information on
the number of wells in general and failed wells in particular. Due to lack of adequate
documentation, the state has not been able to track groundwater extraction.
Therefore, the need of the hour is to develop a documentation wing to record
resource stock and utilisation. It helps not only to evolve economic instruments to
deal with the problem of resource depletion but also to formulate suitable policies to
strengthen the resource base.

84
Table 4:12: Total number of wells and failed wells in Karnataka (in lakh)
Number of Bore wells Number of Open wells Total number of wells Percentage of failed wells Sub regions 1985-86 1995-96 2004-05 1985-86 1995-96 2004-05 1985-86 1995-96 2004-05 1985-86 1995-96 2004-05 Sub Region 1 0.02 0.55 1.33 1.49 1.66 1.93 1.51 2.21 3.27 8.1 7.5 6.1 Sub Region 2 0.12 1.37 2.76 1.63 1.67 1.61 1.75 3.04 4.37 6.7 19.4 16.5 Sub Region 3 0.00 0.06 0.83 0.24 0.43 0.31 0.24 0.49 1.15 3.9 5.9 4.7 Sub Region 4 0.04 0.32 0.28 0.78 0.97 0.95 0.82 1.28 1.23 9.2 7.8 5.0 Karnataka 0.18 2.30 5.21 4.14 4.73 4.80 4.33 7.03 10.01 7.5 12.6 10.4
Source: Directorate of Economics and Statistics, GoK.

85
4.6.3 Declining Groundwater Levels The fall in groundwater levels is a serious issue in Karnataka. Hard rock areas are
losing resources due to heavy demand for groundwater. The Department of Mines
and Geology analysed groundwater levels in 500 stations in the state during May
2002 to May 2003. About 76 per cent of the stations recorded fall in water levels
(Annexure Table 4.1). Further, in about 48 per cent of the stations the water level
had fallen by 2 mts; about 21 per cent reveal a fall of 2-4 mts; only 7 per cent of the
stations recorded a decline of more than 4 mts. The severity of declining
groundwater levels appeared to be high in the southern parts of the state viz.,
Chitradurga, Tumkur, Kolar and Haveri. Most of the hard rock areas in Sub-region 2
witnessed this trend (Table 4.13). This decline in groundwater levels indicates that
resource replenishment is an urgent requirement. About 14 per cent of the total
sample stations witnessed decline in water tables of more than 4 mts during May
2002 to May 2003 which is highest among all the regions.
Table 4:13: Sub-region wise falling groundwater levels from May 2002 to may 2003
Fall in Groundwater level (m) Sub-regions
No. of stations analysed
0 -2 m
Per cent
2 – 4 m
Per cent > 4m
Per cent
Total stations recording fall in Groundwater
levels Sub-region 1 198 77 38.9 43 21.7 16 8.1 136 (68.7)
Sub-region 2 85 27 31.8 38 44.7 12 14.1 77 (90.6) Sub-region 3 69 35 50.7 10 14.5 3 4.3 48 (69.6)
Sub-region 4 148 100 67.6 15 10.1 4 2.7 119 (80.4)
Total 500 239 47.8 106 21.2 35 7.0 380 (76.0) Note: Figures in parentheses indicate percentage to total number of sample stations. Source: State of Environment Report, GoK, 2003 Current levels of groundwater extraction over and above the natural rate of
replenishment are significant, but the aquifer systems exhibited a variety of
responses to stress of over extraction which require some attention before the alarm
is raised. The groundwater level decline and groundwater overdraft can lead to a
wide array of social, economic and environmental consequences. First, theoretically,
the critical changes that occur in groundwater flow to and from adjacent aquifer
systems. Second, the overdraft or decline in water tables results in decline in stream
base flows, wetlands etc., with consequent damage to ecosystems and downstream
86
users. Third, in economic sense, groundwater overdraft can lead to increased
pumping costs and energy usage. This increases demand for energy leading to
energy crisis. Fourth, as the economically accessible buffer stock of groundwater
declines, there is an increase in the vulnerability of agriculture leading to food
insecurity.
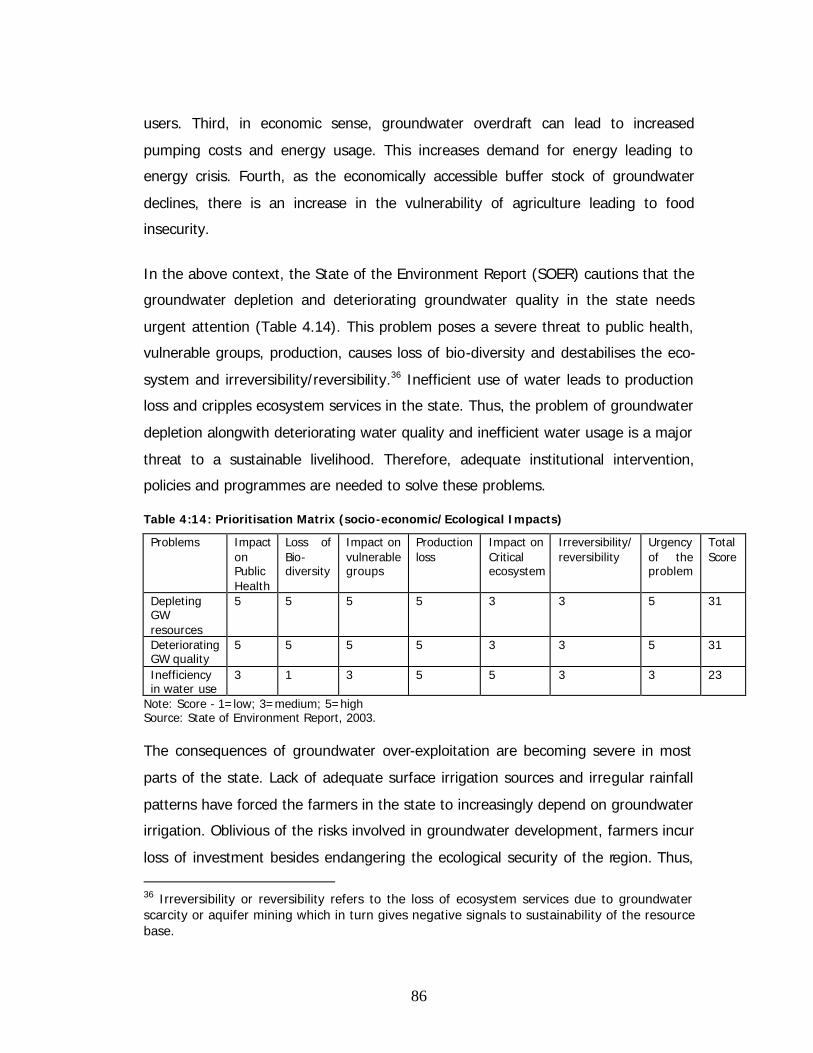
In the above context, the State of the Environment Report (SOER) cautions that the
groundwater depletion and deteriorating groundwater quality in the state needs
urgent attention (Table 4.14). This problem poses a severe threat to public health,
vulnerable groups, production, causes loss of bio-diversity and destabilises the eco-
system and irreversibility/reversibility.36 Inefficient use of water leads to production
loss and cripples ecosystem services in the state. Thus, the problem of groundwater
depletion alongwith deteriorating water quality and inefficient water usage is a major
threat to a sustainable livelihood. Therefore, adequate institutional intervention,
policies and programmes are needed to solve these problems.
Table 4:14: Prioritisation Matrix (socio-economic/Ecological Impacts)
Problems Impact on Public Health
Loss of Bio-diversity
Impact on vulnerable groups
Production loss
Impact on Critical ecosystem
Irreversibility/ reversibility
Urgency of the problem
Total Score
Depleting GW resources
5 5 5 5 3 3 5 31
Deteriorating GW quality
5 5 5 5 3 3 5 31
Inefficiency in water use
3 1 3 5 5 3 3 23
Note: Score - 1=low; 3=medium; 5=high Source: State of Environment Report, 2003. The consequences of groundwater over-exploitation are becoming severe in most
parts of the state. Lack of adequate surface irrigation sources and irregular rainfall
patterns have forced the farmers in the state to increasingly depend on groundwater
irrigation. Oblivious of the risks involved in groundwater development, farmers incur
loss of investment besides endangering the ecological security of the region. Thus,
36 Irreversibility or reversibility refers to the loss of ecosystem services due to groundwater scarcity or aquifer mining which in turn gives negative signals to sustainability of the resource base.

87
the problems of over extraction of groundwater are the consequences of institutional
failure to ensure appropriate measures. Lack of groundwater management has led to
inter-generational, inter-temporal and interspatial misallocation and serious overdraft
situation creating several externalities. Thus, there is a need to evolve appropriate
management tools to control and manage groundwater resources in Karnataka.
4.7 Groundwater - Energy Nexus The scale and rate of groundwater exploitation is directly related to the massive
expansion in pumping capacity that has occurred over the past few decades in the
state. For instance, the number of electric pump sets, ranging from 5 hp to 20 hp,
has jumped from 13.15 lakh in 2000-01 to 15.12 lakhs in 2005-06 (GoK 2006) and
consequently, energy consumption reached 2,931 million units during 2005-06,
generating tariff of about Rs 1,143 million (Table 4.15). Currently, there are 17.2
lakh irrigation pump sets in the state consuming 14.08 lakh units of electricity at the
rate of 8,188 units of power/IP/year (Department of Energy, GoK 2008). The major
institutional backup to exploit groundwater in Karnataka came with free power
supply to irrigation pump sets prior to 1997. The Government of Karnataka,
however, imposed a flat charge of Rs 300 per HP per year up to 10 HP pump set
from April 1997 (Hemalatha and Chandrakanth 2003). Prior to April 1997, there were
no explicit costs of irrigation as there were no operational costs like payments for
utilisation of electricity. This continued with vested political interests and hastened
the exploitation of aquifers beyond its natural recharging capacity.
The progressive lowering of the water table had a multiple impact on the
groundwater-energy nexus. First, as water table declined, the pumping depth
increased resulting in decline of the water table and failure of shallow wells. Second,
as water tables declined, more electricity was consumed to pump water from deeper
wells. The steady rise in energy consumption in different blocks is the best indication
of the progressive decline in the water tables in the state (Table 4.15).

88
Table 4:15: Energy consumption for agricultural purpose in Karnataka (2005-06)
Total no. of electric pump sets Stages of GW
development 2000-01 2005-06
Total energy consumed for agricultural
purpose (Million Units)
Average energy consumed by electric well
(units)
Estimated tariff for the agricultural
sector (Million Rs.)
Safe 3,39,375 4,30,374 751.0 1,745.0 292.9 Semi critical 4,77,891 5,47,408 1,028.5 1,878.8 401.1
Critical 2,57,717 2,94,140 559.6 1,902.5 218.2
Over-exploited 2,40,047 2,94,140 592.0 2,463.3 230.9 Total 1,3,15,030 1,5,12,241 2,931.0 1,938.2 1,143.1
Source: Directorate of Economics and Statistics, GoK - 2000-01 and 2005-06.
Interestingly, electricity consumption per well increases with the decline in the water
tables (Table 4.15). It is clear that in an area where the water table is shallow the
less power would be required to lift water. This is an indication of low energy
consumption in the safe category blocks. In the critical and over exploited blocks as
the water table reached lower levels, consumption of electricity rose rapidly. So
Karnataka initiated several measures to control and manage groundwater resources.
4.8 The State’s Response
The groundwater resource, as indicated above, is dwindling in Karnataka. About 30
per cent of the state has been over exploited and the over draft is estimated to be
about 0.22 m ham. If this trend continuous, it will have severe adverse impact on
the environment and the ecological balance of the region (GoK 2005). The current
practice of water management is not supported by legislation to control ownership
over groundwater resources. Groundwater extraction, under common law is chattel
to land (MOWR 1996). Extraction of groundwater is the right of every landowner
(Sinha and Sharma 1987; Jacob 1989; Singh 1991). Since groundwater rights are
attached to land, this statutory law reflects the customary practice. As a result, every
landowner, who has water extraction mechanisms (WEMs), takes pride in accessing
groundwater and regards wells as his own and views others, including government,
as having no control over his access.
In response to the problems emerging from over extraction of groundwater, the
state initiated several policies and programmes. The state’s response with regard to
groundwater management can be categorised thus: (i) to increase the supply of

89
water and (ii) to curtail demand through various policy measures. The watershed
programme was the major water conservation initiative implemented to increase the
supply of groundwater with the assistance of multi-national agencies. The policy
response included the enforcement of a groundwater law, control of refinancing
activities, and changes in electricity tariffs and its supply.
4.8.1 Regulation of Institutional Finance
The overexploitation of groundwater and its adverse consequences can be attributed
to certain processes of development in agriculture that led to the depletion of
aquifers. Some of the indirect approaches to manage groundwater resources came
through the efforts to curb institutional credit for well development. Institutional
finance for sinking wells was denied in areas that had been notified as dark zones37
by the Central Groundwater Board (CGWB) through National Agricultural Bank for
Rural Development (NABARD). According to CGBW, this decision was timely in
several areas to control groundwater extraction. NABARD also insisted on minimum
distance between wells as a precondition for obtaining institutional credit.38 Neither
credit restraints nor the distance stipulation was particularly effective in curbing the
extraction of groundwater. In fact, the decision to impose conditions on availability
of institutional finance affected poor farmers while wealthy farmers tapped private
sources of capital to finance well construction.39 In several villages, informal sources
such as SHGs and money lenders offered finance at reasonable rates of interest.
Moreover, wealthy farmers had never been dependent on the state for finance.
37 Prior to 1994, Department of Mines and Geology has classified state into white, grey and dark areas on the basis of usage of groundwater. White areas refers to areas where groundwater resource use is less than 65 per cent; Grey area refers to areas where groundwater utilisation is between 65 and 85 per cent; Dark areas refers to areas where groundwater utilisation is more than 85 per cent. However, the classification of areas changed, later, considering long term trend in groundwater level and pre and post monsoon fluctuations (GEM 1997). 38 The spacing norms following the NABARD guidelines are: spacing between two dug wells 150 mts, two shallow tube wells and two dug-cum-bore wells 175 mts, two medium and two deep tubewells 600 mts and dug wells and deep tube wells 375 mts. However, the distance is mentioned in the approved Groundwater Bill is 250 mts between two successful irrigation dug-cum-bore wells; 182 mts between two dug wells and 130 mts between two dug wells in command area (Department of Energy, GoK 2008). 39 See Chapter 6 for more discussion on the implications of the debt trap.

90
4.8.2 Power Tariff Policy
During the early period of groundwater boom in the state, diesel pump set were
used to lift groundwater as wells were shallow and the infrastructure to support
electric pump set was still underdeveloped. Diesel was provided at subsidised rates.
Since the number of groundwater users was small, the demand for diesel was
limited. As the number of wells increased and modern drilling techniques became
available, the overall draft ratio increased. To curb heavy demand for diesel, the
Government of India decided to promote supply of electricity for agricultural use by
strengthening the rural electrification programme during 1976-78. This led to
installation of additional electric pump sets and a spurt in groundwater irrigated
areas.
Groundwater irrigation received a boost prior to 1997 when the state was supplying
free electricity for agricultural purposes. This has brought radical changes in irrigated
agriculture. The resultant zero marginal cost of pumping acted as an incentive for
farmers to pump more water because he/she did not incur additional expenditure.
After the economic liberalisation policies came into force, subsidies on diesel and the
administered pricing policies were withdrawn. This has made diesel more costly.
Therefore, the number of farmers investing in bore wells with electric pumps
increased. Marginal and small farmers too could own and operate pump sets. The
fixed tariff encouraged farmers to use as much electricity as they wanted.
In 1989 the National Conference of Power Ministers acknowledged that the flat
power tariff was an incentive to over extract groundwater and decided that
agricultural consumers would be charged a minimum of Re 0.50 per unit (KWh).
However, there were no metres on the pump sets to record the quantity of
electricity being supplied to the farmers and to bill them accordingly. Therefore, this
decision could not be implemented. The flat power tariff to the agricultural sector
became a powerful tool for politicians during elections. It was politicised during the
1990s when up to 10 HP electric pump sets were provided free electricity. Therefore,
during the 1990s groundwater abstraction levels went up in the state. Similar

91
situations were noticed in Punjab and Tamil Nadu where free power supply was
introduced during the same time (Narayana and Scott 2004; Janakarajan 1997).
Power consumed for agricultural purposes stood at 29 per cent of the total
consumption of electricity in the state during 2008-09 (Department of Energy, GoK
2008). This is based on a study covering 44 Distribution Transformer Centres. The
Karnataka Electricity Regulatory Commission (KERC) prescribed an upper limit of
8,188 units per IP set per annum. On an average, 682.33 units per IP set per month.
However, a BESCOM study indicated 585 units per IP set per month (Department of
Energy, GoK 2008).
Considering the feasibility criterion for arranging free power supply to IP sets, the
Committee on Ground Water and Energy Nexus has suggested restructuring
the tariff for energy efficient exploitation of water in the state. The Committee has
suggested energy entitlement based on agro-climatic zones. Accordingly, dry land
and command areas with unasserted water sources were entitled to 8,000 and 4,000
units free per annum, respectively. In contrast, command areas with assured water
sources got 2000 units per annum. However, energy entitlement was further
extended on payment of Rs 3.85 as average cost of supply. At present, the State has
introduced cross subsidies, in addition to direct subsidies, to meet the power supply
expenditure, which is around Rs 3,500 crore to Rs 3,900 crore at the normal tariff of
Rs 3.90 per unit. Free power supply might even hurt farmers’ interests in the long
run as the Government might ignore quality of power supply in rural areas, thus
accentuating the urban-rural divide in the quality of power supply (Anantha 2009a).
4.8.3 Groundwater Legislations
Water is a state subject. Within the constitutional framework, various laws and
policies govern the right to water. The efforts to make regulatory interventions are
not of recent origin in the state. In the case of groundwater, the most important law
is the Easement Act of 1982 implemented by the British government. The act refers
to the right of every owner of land abutting a natural stream, lake or pond to use
and consume its water for domestic and irrigation purposes. The consequence of this
legal framework is that only landowners can own groundwater. In fact, in 1969, the

92
Ministry of Agriculture made, perhaps, the first attempt after independence to
prepare a model bill and circulated it to all states. However, nothing happened
because the states did not show any interest in taking further action. In 1985, the
Supreme Court passed a judgment requiring the government through the Ministry of
Environment and Forests to address the problems of groundwater overdraft.40 In
response, the Ministry issued a notification on January 14, 1997, creating the Central
Groundwater Authority, and designating the CGWB with administrative responsibility
of regulating and controlling groundwater extraction.41
The status of groundwater legislation in Karnataka has been presented in Table
4.16. In Karnataka, the first draft of the groundwater bill was prepared in 1985
focusing on groundwater overdraft and prevention of its wastage. However, the bill
not enacted. In a similar attempt, in 1996, the Karnataka Groundwater (Regulation
and Control) Bill, 1996 was prepared. It defined groundwater as state property and
the government had powers to cancel permits, certificates or registrations or
licenses; to seize any mechanical equipment utilised for illegal sinking of well and
extraction of groundwater. This bill too was not enacted. In 1999, a draft of the
Karnataka Groundwater (Regulation for Protection of Drinking Water Sources) Act
was prepared but due to political difficulties was not passed. Karnataka prepared
several bills to control groundwater over-exploitation but none of them were
enacted. The latest bill in this series is the Draft Karnataka Groundwater (Regulation
and Control of Development and Management), Bill, 2006. The focus of the bill
includes control of groundwater overdraft, regulation, management and prevention
of “waste” of groundwater. Besides powers to cancel permits and certification of
registration among other things, this bill empowers the authorities to alter, amend or
vary the terms of permit/certificate of registration as key provisions. Recently the bill
was tabled in the Legislative Assembly for discussion but there has been no progress
so far.
40 Supreme Court of India, Civil Original Jurisdiction, I. A. No. 32 IN W. P. (c) No. 4677 of 1985. 41 Gazette of India: Extraordinary, Part II, See 3, subsection, ii, No. 30, New Delhi, Tuesday, January 14, 1997.

93
Table 4:16: Status of Groundwater Legislation in Karnataka Status of
legislation Focus Implementin
g authority Powers Key provisions
First draft in 1985, Subsequent communications with the Central Government but bill never enacted
Groundwater overdraft, similar to 1970 Model Bill. Also prevention of ’waste’ of groundwater
Ground Water Authority
Regulates construction of new wells other than those used for domestic purposes
Defines groundwater as state property; Provides for imposition of fines of up to Rs 1000 for first offence, up to Rs 2000 or one year imprisonment for second offence.
The Karnataka Groundw ater (Regulation And Control) Bill, 1996
Regulation and control of extraction and prevention of waste of groundwater
Ground Water Authority
Cancellation of permit, certificate or registration or license. To seize any mechanical equipment utilised for illegal sinking of well and extraction of groundwater
Defines groundwater as state property;
Draft Karnataka Groundwater (Regulation for Protection of Drinking Water Sources) Act, 1999, yet to be enacted
Protection of drinking water sources and prohibition of sinking new wells in scarcity areas.
Deputy Commissioner and includes any officer not below the rank of Assistant Commissioner
Regulates construction of wells within a distance of 500 mts from a public drinking water source The appropriate authority shall have powers to prohibit sinking of wells in over exploited watersheds
Defines groundwater as state property Punishment with imprisonment which shall not be less than one month but which may extend to six months or with fine which shall not be less than Rs 1000 but may increased to Rs 5000 or with both
State Water Policy 2002
Limited surface and ground water resources need to be systematically developed and properly utilised adopting new approaches for the overall development of the State.
Water Resource Department with co-ordination
Complete rehabilitation and development of all minor irrigation tanks.
Establish State Water Resources Board. Restructure the Water Resources Department to improve planning and management capabilities.
Draft Karnataka Groundwater (Regulation and Control of Development and Management), Bill, 2006
To control groundwater overdraft, regulate and management. Also prevention of ‘waste’ of groundwater.
Ground Water Authority
Cancellation of permit or certification of registration. Ineligibility to avail financial assistance and power connection etc. To seize any mechanical equipment used for illegal sinking of wells
Power to alter, amend or vary the terms of permit/certificate of registration.
Source: Ministry of Water Resources, GoK.

94
4.9 Summary The preceding discussion reveals how groundwater exploitation, historically grounded in
the state through increasing number of bore wells, is of concern to policy makers and
groundwater managers. The state has witnessed three stages of groundwater
development since 1950s. Each stage is unique in depicting the change from dug well
technology to deep bore wells fitted with submersible pump sets. The change in
irrigation technology was also accompanied by changes in the cropping pattern. As bore
well technology was widely available, the irrigated area expanded with water-intensive
commercial crops. This improvement has been associated with several socio -economic
and ecological fallouts.
The response of the state to check groundwater exploitation was in terms of policies to
increase supply and curtail demand. These policies included direct and indirect forms of
regulations. The adoption of the model bill and creation of regulatory authorities are
direct forms of regulation to check over-exploitation of groundwater. The control over
institutional finance was an indirect form of regulation. Unfortunately, the indirect form
of regulation has been discriminatory in its effect on the access to groundwater
resources by marginalising poor farmers. Both forms of regulations were not helpful in
checking over-exploitation of groundwater in the state. Instead, they allowed
exploitation of groundwater resources for private gains making the pattern largely
unequal and unsustainable.
There is a need to evolve and implement certain policies in the state for sustainable
management of groundwater resources. Firstly, there should be a cap on energy
consumption as agriculture consumes about 29 per cent of the total electricity generated
at the state level. The high energy consumption is attributed to the energy inefficient
pump sets. Hence, improving pump efficiency would be an ideal way of reducing
consumption of electricity. Secondly, studies in the dry regions of the country suggested
that percolation tanks help in recharging groundwater structures.42 Since Karnataka is,
historically, a dominant user of tanks for various purposes, tank desiltation should
assume greater significance in restoring groundwater resources in the state.
42 It was estimated that the recharging capacity of normal percolation tank is about 7.87 mm/day while a desilted percolation tank can recharge up to 20.40 mm/day (Patel 2002) and the radius of this impact ranges from 1.1 km to 0.72 km depending on the type of soil (Reddy 2003).

95
Annexure Table 4:1: Groundwater levels from May 2002 to may 2003 Fall in Ground Water level (m)
Districts No. of stations analysed
0 -2 m
Per cent
2 - 4m
Per cent
> 4m
Per cent
Total stations recording fall in GW
% stations recording fall in GW
Bagalkot 13 6 46.2 5 38.5 0.0 11 84.6 Bangalore (R& U) 25 10 40.0 11 44.0 0.0 21 84.0 Belgaum 38 20 52.6 6 15.8 5 13.2 31 81.6 Bellary 12 5 41.7 4 33.3 2 16.7 11 91.7 Bidar 12 5 41.7 1 8.3 0.0 6 50.0 Bijapur 20 11 55.0 1 5.0 1 5.0 13 65.0 C R Nagar 8 3 37.5 0.0 0.0 3 37.5 Chikmagalur 25 18 72.0 1 4.0 1 4.0 20 80.0 Chitradurga 14 7 50.0 5 35.7 2 14.3 14 100.0 Dakshina Kannada 26 23 88.5 1 3.8 0.0 24 92.3 Davanagere 9 3 33.3 2 22.2 1 11.1 6 66.7 Dharwad 5 2 40.0 2 40.0 0.0 4 80.0 Gadag 11 3 27.3 5 45.5 1 9.1 9 81.8 Gulbarga 53 8 15.1 7 13.2 6 11.3 21 39.6 Hassan 27 18 66.7 6 22.2 1 3.7 25 92.6 Haveri 2 1 50.0 1 50.0 0.0 2 100.0 Kodagu 18 11 61.1 1 5.6 0.0 12 66.7 Kolar 17 4 23.5 11 64.7 2 11.8 17 100.0 Koppal 10 4 40.0 5 50.0 0.0 9 90.0 Mandya 21 8 38.1 3 14.3 2 9.5 13 61.9 Mysore 13 6 46.2 1 7.7 0.0 7 53.8 Raichur 22 12 54.5 6 27.3 1 4.5 19 86.4 Shimoga 26 16 61.5 2 7.7 3 11.5 21 80.8 Tumkur 20 3 15.0 9 45.0 7 35.0 19 95.0 Udupi 23 15 65.2 4 17.4 0.0 19 82.6 Uttara Kannada 30 17 56.7 6 20.0 0.0 23 76.7 Karnataka 500 239 47.8 106 21.2 35 7.0 380 76.0
Source: State of Environment Report, Karnataka, 2003.