E-ISSN: Groundwater quality assessment in a hard … · ... and land subsidence due to...
11
~ 51 ~ Journal of Pharmacognosy and Phytochemistry 2018; SP1: 51-61 E-ISSN: 2278-4136 P-ISSN: 2349-8234 JPP 2018; SP1: 51-61 AK Sinha Scientist (Agril. Engg.), KVK, Birsa Agricultural University, Ranchi, Jharkhand, India Vinay Kumar Scientist (Agril. Engg.), KVK, Birsa Agricultural University, Ranchi, Jharkhand, India PK Singh Professor & Head, Department of soil and water Engg., CTAE, MPUAT, Udaipur, Rajasthan, India Correspondence AK Sinha Scientist (Agril. Engg.), KVK, Birsa Agricultural University, Ranchi, Jharkhand, India Groundwater quality assessment in a hard rock hilly terrain of western India AK Sinha, Vinay Kumar and PK Singh Abstract Groundwater is a precious resource of limited extent. A systematic planning of groundwater exploitation using modern techniques is essential for the proper utilization and management of this precious but shrinking natural resource. Groundwater quality assessment is important to ensure sustainable safe use of water. The groundwater quality of the Wakal river basin was analyzed. It is located between 24° 46' 34.65'' to 24° 8' 49.41'' N latitude and 73° 6' 23.41'' to 73° 35' 54.18" E longitude with an area of 1914.32 km 2 , of which 1867.47 km 2 (98 per cent) falls in Udaipur district of Rajasthan and 46.84 km 2 in Gujarat. The maximum length of the basin is 71.22 km (N-S) and the maximum width is 41.01 km (E-W). The entire Wakal river basin is hard-rock terrain situated in southern part of Rajasthan. For assessment of groundwater quality in Wakal river basin of Udaipur district, the basin is divided into 66 grid considering size of one grid as 6km x 6km. The water samples were collected from 63 sites during pre monsoon and 60 sites during post monsoon period. These samples were analyzed in the laboratory to find out different water quality parameters such as pH, EC, TDS, Ca, Mg, Na, K, CO3, HCO3, Cl and SO4. The different water quality parameter map of the Wakal river basin was prepared under GIS environment and the spatio-temporal variations of groundwater quality parameters were analyzed. The highest EC, TDS, Na, SO4 was found in village Kotra and Ca, Mg, Cl in village Bira of Jhadol block during pre monsoon period. During post monsoon period the highest EC, TDS, Ca, Mg, Na, K, Cl and SO4 was found in village Kotra. The EC and TDS show highly significant and good positive correlation with most of the parameters except CO3 and HCO3 during both pre and post monsoon period. The EC also show highly significant and good positive correlation with TDS during both pre and post monsoon period. Keywords: Groundwater quality, Wakal river basin, GIS, Spatial and temporal variabi Introduction "Water" is a prime natural resource and is considered as a precious national asset. It is a major constituent of all living beings. Water is available in two basic forms i.e. Surface water and Ground water. Water is probably the only natural resource to touch all aspects of human civilization from agricultural and industrial development to cultural and religious values embedded in society. Water, no doubt, is a boon of nature for the whole living world and is essential for variety of purposes to human beings as well as to plants and animals. Its many uses include drinking and other domestic uses, irrigation, power generation, transportation, industrial cooling, fishing, mining and fire fighting etc. Earth is also called as ‘blue planet’ because 70 per cent area of it has been covered by water resource. The total water amount on the earth is about 1.35 billion cubic kilometers. About 97.1 per cent has been locked into oceans as saltwater. Ice sheets and glaciers have arrested 2.1 per cent. Only 0.2 per cent is the fresh water present on the earth, which can be used by human for variety of purposes. Remaining 0.6 per cent is in underground form (Status Report, 2007). But unfortunately, it has been getting polluted day by day due to different anthropogenic activities. The effects of water pollution are not only devastating to people but also to animals, fish, and birds. Polluted water is unsuitable for drinking, recreation, agriculture and industrial purposes. It diminishes the aesthetic quality of lakes and rivers. More seriously, contaminated water destroys aquatic life and reduces its reproductive ability. Eventually, it is a hazard to human health and nobody can escape the effects of water pollution. Therefore, it is burning need, to conserve the water and prevent it from every type of pollution. Groundwater is one of the most valuable natural and dynamic resource, but it is not unlimited. Its quantity and quality both varies from place to place and season to season. This supports human health, socio-economic development, and functioning of ecosystems (Zektser 2000; Humphreys 2009; Steube et al. 2009). Out of the 37 Mkm 3 of freshwater estimated to be present on the earth, about 22 per cent exists as groundwater, which constitutes about 97 per cent of all liquid freshwater potentially available for human use (Foster 1998). However, the worldwide groundwater overdraft, declining well yields, drying up of springs, stream flow
Transcript of E-ISSN: Groundwater quality assessment in a hard … · ... and land subsidence due to...

~ 51 ~
Journal of Pharmacognosy and Phytochemistry 2018; SP1: 51-61
E-ISSN: 2278-4136
P-ISSN: 2349-8234
JPP 2018; SP1: 51-61
AK Sinha
Scientist (Agril. Engg.),
KVK, Birsa Agricultural
University, Ranchi,
Jharkhand, India
Vinay Kumar
Scientist (Agril. Engg.),
KVK, Birsa Agricultural
University, Ranchi,
Jharkhand, India
PK Singh
Professor & Head,
Department of soil and water
Engg., CTAE, MPUAT,
Udaipur, Rajasthan, India
Correspondence
AK Sinha
Scientist (Agril. Engg.),
KVK, Birsa Agricultural
University, Ranchi, Jharkhand,
India
Groundwater quality assessment in a hard rock hilly
terrain of western India
AK Sinha, Vinay Kumar and PK Singh
Abstract Groundwater is a precious resource of limited extent. A systematic planning of groundwater exploitation
using modern techniques is essential for the proper utilization and management of this precious but
shrinking natural resource. Groundwater quality assessment is important to ensure sustainable safe use of
water. The groundwater quality of the Wakal river basin was analyzed. It is located between 24° 46'
34.65'' to 24° 8' 49.41'' N latitude and 73° 6' 23.41'' to 73° 35' 54.18" E longitude with an area of 1914.32
km2, of which 1867.47 km2 (98 per cent) falls in Udaipur district of Rajasthan and 46.84 km2 in Gujarat.
The maximum length of the basin is 71.22 km (N-S) and the maximum width is 41.01 km (E-W). The
entire Wakal river basin is hard-rock terrain situated in southern part of Rajasthan. For assessment of
groundwater quality in Wakal river basin of Udaipur district, the basin is divided into 66 grid considering
size of one grid as 6km x 6km. The water samples were collected from 63 sites during pre monsoon and
60 sites during post monsoon period. These samples were analyzed in the laboratory to find out different
water quality parameters such as pH, EC, TDS, Ca, Mg, Na, K, CO3, HCO3, Cl and SO4. The different
water quality parameter map of the Wakal river basin was prepared under GIS environment and the
spatio-temporal variations of groundwater quality parameters were analyzed. The highest EC, TDS, Na,
SO4 was found in village Kotra and Ca, Mg, Cl in village Bira of Jhadol block during pre monsoon
period. During post monsoon period the highest EC, TDS, Ca, Mg, Na, K, Cl and SO4 was found in
village Kotra. The EC and TDS show highly significant and good positive correlation with most of the
parameters except CO3 and HCO3 during both pre and post monsoon period. The EC also show highly
significant and good positive correlation with TDS during both pre and post monsoon period.
Keywords: Groundwater quality, Wakal river basin, GIS, Spatial and temporal variabi
Introduction "Water" is a prime natural resource and is considered as a precious national asset. It is a major
constituent of all living beings. Water is available in two basic forms i.e. Surface water and
Ground water. Water is probably the only natural resource to touch all aspects of human
civilization from agricultural and industrial development to cultural and religious values
embedded in society. Water, no doubt, is a boon of nature for the whole living world and is
essential for variety of purposes to human beings as well as to plants and animals. Its many
uses include drinking and other domestic uses, irrigation, power generation, transportation,
industrial cooling, fishing, mining and fire fighting etc.
Earth is also called as ‘blue planet’ because 70 per cent area of it has been covered by water
resource. The total water amount on the earth is about 1.35 billion cubic kilometers. About
97.1 per cent has been locked into oceans as saltwater. Ice sheets and glaciers have arrested 2.1
per cent. Only 0.2 per cent is the fresh water present on the earth, which can be used by human
for variety of purposes. Remaining 0.6 per cent is in underground form (Status Report, 2007).
But unfortunately, it has been getting polluted day by day due to different anthropogenic
activities. The effects of water pollution are not only devastating to people but also to animals,
fish, and birds. Polluted water is unsuitable for drinking, recreation, agriculture and industrial
purposes. It diminishes the aesthetic quality of lakes and rivers. More seriously, contaminated
water destroys aquatic life and reduces its reproductive ability. Eventually, it is a hazard to
human health and nobody can escape the effects of water pollution. Therefore, it is burning
need, to conserve the water and prevent it from every type of pollution.
Groundwater is one of the most valuable natural and dynamic resource, but it is not unlimited.
Its quantity and quality both varies from place to place and season to season. This supports
human health, socio-economic development, and functioning of ecosystems (Zektser 2000;
Humphreys 2009; Steube et al. 2009). Out of the 37 Mkm3 of freshwater estimated to be
present on the earth, about 22 per cent exists as groundwater, which constitutes about 97 per
cent of all liquid freshwater potentially available for human use (Foster 1998). However, the
worldwide groundwater overdraft, declining well yields, drying up of springs, stream flow
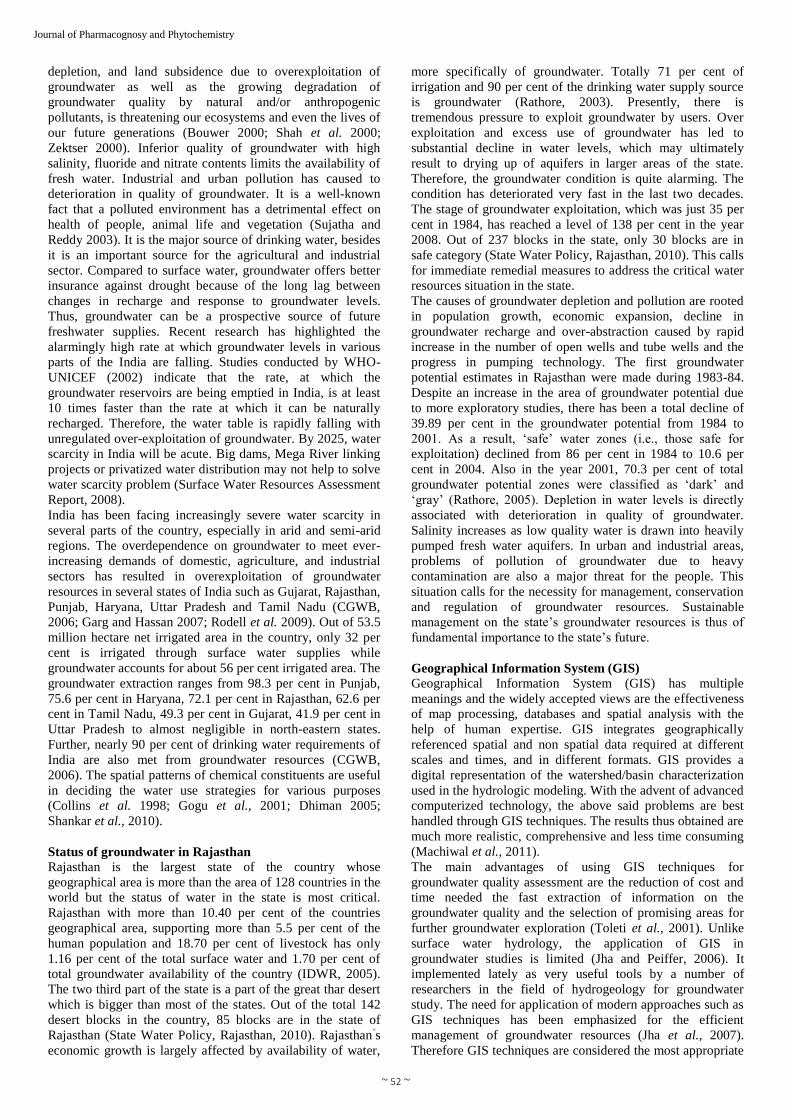
~ 52 ~
Journal of Pharmacognosy and Phytochemistry
depletion, and land subsidence due to overexploitation of
groundwater as well as the growing degradation of
groundwater quality by natural and/or anthropogenic
pollutants, is threatening our ecosystems and even the lives of
our future generations (Bouwer 2000; Shah et al. 2000;
Zektser 2000). Inferior quality of groundwater with high
salinity, fluoride and nitrate contents limits the availability of
fresh water. Industrial and urban pollution has caused to
deterioration in quality of groundwater. It is a well-known
fact that a polluted environment has a detrimental effect on
health of people, animal life and vegetation (Sujatha and
Reddy 2003). It is the major source of drinking water, besides
it is an important source for the agricultural and industrial
sector. Compared to surface water, groundwater offers better
insurance against drought because of the long lag between
changes in recharge and response to groundwater levels.
Thus, groundwater can be a prospective source of future
freshwater supplies. Recent research has highlighted the
alarmingly high rate at which groundwater levels in various
parts of the India are falling. Studies conducted by WHO-
UNICEF (2002) indicate that the rate, at which the
groundwater reservoirs are being emptied in India, is at least
10 times faster than the rate at which it can be naturally
recharged. Therefore, the water table is rapidly falling with
unregulated over-exploitation of groundwater. By 2025, water
scarcity in India will be acute. Big dams, Mega River linking
projects or privatized water distribution may not help to solve
water scarcity problem (Surface Water Resources Assessment
Report, 2008).
India has been facing increasingly severe water scarcity in
several parts of the country, especially in arid and semi-arid
regions. The overdependence on groundwater to meet ever-
increasing demands of domestic, agriculture, and industrial
sectors has resulted in overexploitation of groundwater
resources in several states of India such as Gujarat, Rajasthan,
Punjab, Haryana, Uttar Pradesh and Tamil Nadu (CGWB,
2006; Garg and Hassan 2007; Rodell et al. 2009). Out of 53.5
million hectare net irrigated area in the country, only 32 per
cent is irrigated through surface water supplies while
groundwater accounts for about 56 per cent irrigated area. The
groundwater extraction ranges from 98.3 per cent in Punjab,
75.6 per cent in Haryana, 72.1 per cent in Rajasthan, 62.6 per
cent in Tamil Nadu, 49.3 per cent in Gujarat, 41.9 per cent in
Uttar Pradesh to almost negligible in north-eastern states.
Further, nearly 90 per cent of drinking water requirements of
India are also met from groundwater resources (CGWB,
2006). The spatial patterns of chemical constituents are useful
in deciding the water use strategies for various purposes
(Collins et al. 1998; Gogu et al., 2001; Dhiman 2005;
Shankar et al., 2010).
Status of groundwater in Rajasthan
Rajasthan is the largest state of the country whose
geographical area is more than the area of 128 countries in the
world but the status of water in the state is most critical.
Rajasthan with more than 10.40 per cent of the countries
geographical area, supporting more than 5.5 per cent of the
human population and 18.70 per cent of livestock has only
1.16 per cent of the total surface water and 1.70 per cent of
total groundwater availability of the country (IDWR, 2005).
The two third part of the state is a part of the great thar desert
which is bigger than most of the states. Out of the total 142
desert blocks in the country, 85 blocks are in the state of
Rajasthan (State Water Policy, Rajasthan, 2010). Rajasthan’s
economic growth is largely affected by availability of water,
more specifically of groundwater. Totally 71 per cent of
irrigation and 90 per cent of the drinking water supply source
is groundwater (Rathore, 2003). Presently, there is
tremendous pressure to exploit groundwater by users. Over
exploitation and excess use of groundwater has led to
substantial decline in water levels, which may ultimately
result to drying up of aquifers in larger areas of the state.
Therefore, the groundwater condition is quite alarming. The
condition has deteriorated very fast in the last two decades.
The stage of groundwater exploitation, which was just 35 per
cent in 1984, has reached a level of 138 per cent in the year
2008. Out of 237 blocks in the state, only 30 blocks are in
safe category (State Water Policy, Rajasthan, 2010). This calls
for immediate remedial measures to address the critical water
resources situation in the state.
The causes of groundwater depletion and pollution are rooted
in population growth, economic expansion, decline in
groundwater recharge and over-abstraction caused by rapid
increase in the number of open wells and tube wells and the
progress in pumping technology. The first groundwater
potential estimates in Rajasthan were made during 1983-84.
Despite an increase in the area of groundwater potential due
to more exploratory studies, there has been a total decline of
39.89 per cent in the groundwater potential from 1984 to
2001. As a result, ‘safe’ water zones (i.e., those safe for
exploitation) declined from 86 per cent in 1984 to 10.6 per
cent in 2004. Also in the year 2001, 70.3 per cent of total
groundwater potential zones were classified as ‘dark’ and
‘gray’ (Rathore, 2005). Depletion in water levels is directly
associated with deterioration in quality of groundwater.
Salinity increases as low quality water is drawn into heavily
pumped fresh water aquifers. In urban and industrial areas,
problems of pollution of groundwater due to heavy
contamination are also a major threat for the people. This
situation calls for the necessity for management, conservation
and regulation of groundwater resources. Sustainable
management on the state’s groundwater resources is thus of
fundamental importance to the state’s future.
Geographical Information System (GIS)
Geographical Information System (GIS) has multiple
meanings and the widely accepted views are the effectiveness
of map processing, databases and spatial analysis with the
help of human expertise. GIS integrates geographically
referenced spatial and non spatial data required at different
scales and times, and in different formats. GIS provides a
digital representation of the watershed/basin characterization
used in the hydrologic modeling. With the advent of advanced
computerized technology, the above said problems are best
handled through GIS techniques. The results thus obtained are
much more realistic, comprehensive and less time consuming
(Machiwal et al., 2011).
The main advantages of using GIS techniques for
groundwater quality assessment are the reduction of cost and
time needed the fast extraction of information on the
groundwater quality and the selection of promising areas for
further groundwater exploration (Toleti et al., 2001). Unlike
surface water hydrology, the application of GIS in
groundwater studies is limited (Jha and Peiffer, 2006). It
implemented lately as very useful tools by a number of
researchers in the field of hydrogeology for groundwater
study. The need for application of modern approaches such as
GIS techniques has been emphasized for the efficient
management of groundwater resources (Jha et al., 2007).
Therefore GIS techniques are considered the most appropriate

~ 53 ~
Journal of Pharmacognosy and Phytochemistry
new alternative tools for assessment of groundwater quality.
Need of the study
In Wakal river basin, water quality is one of the major regions
of acquiring water born diseases to the tribal peoples. Health
hazard due to poor quality water is becoming a major issue in
the area. The scientists of CTAE, Udaipur during the year
2008, carried out study on assessment of surface water
resources of Wakal river basin. In Wakal river basin 90 per
cent drinking water supply depends on groundwater resources
which is depleting at an alarming rate. Large number of wells,
hand pumps and tube wells become dry in many areas causing
acute shortage of irrigation and drinking water supply in the
state. Depletion in water levels is directly associated with
deterioration in quality of groundwater. Salinity increases as
low quality water is drawn into heavily pumped fresh water
aquifers. In urban and industrial areas, problems of pollution
of groundwater due to heavy contamination are also a major
threat for the people. This situation calls for the necessity for
management, conservation and regulation of groundwater
resources. Sustainable management on the state’s
groundwater resources is thus of fundamental importance to
the state’s future. Looking to the magnitude of the problem of
declining trend of water table and water quality in the Wakal
river basin, an effort have made to conduct groundwater
resources study of the basin which will provide a guide line to
mitigate the problem.
Material and Methods
Description of study area
Wakal river is one of the tributaries of Sabarmati river basin.
It is a rain fed river basin lies on the west coast of India
between 24° 46' 34.65'' N to 24° 8' 49.41'' N latitudes and 73°
6' 23.41'' E to 73° 35' 54.18" E longitudes and spread across
the states of Rajasthan and Gujarat. It is situated in southern
part of Rajasthan. Total area of the basin is 1914.32 km2
whereas maximum length of basin is 71.22 km which is
draining to Sabarmati River in Gujarat. The entire Wakal river
basin is falling in 5 tehsils i.e. Gogunda, Girwa, Jhadol, Kotra
tehsil of Udaipur district of Rajasthan and Khedbrahma tehsil
of Sabarakanta district of Gujarat. The 98 per cent area of
total basin falls in the Udaipur district of Rajasthan. Most of
the rivers or streams in this basin are ephemeral, therefore,
groundwater provides the main source of supply for human as
well as livestock. The study area falls in Survey of India
(SOI) toposheets of 45H/2, 45H/3, 45H/4, 45H/5, 45H/6,
45H/7, 45H/8, 45H/10 and 45H/11. The location map of the
Wakal river basin is shown in Fig.1.
Fig 1: Map of Wakal river basin with square grid pattern.

~ 54 ~
Journal of Pharmacognosy and Phytochemistry
Groundwater Quality Analysis
Analyzing the groundwater quality of the basin, pre and post
monsoon groundwater samples were collected in sampling
bottles by dividing the entire basin into 6km x 6km grid. The
village map of the Wakal river basin is divided into 66
systematic square grids (6km x 6km) as shown in Fig.3.2. The
water samples were collected from 63 sites during pre
monsoon and 60 sites during post monsoon period. These
samples were analyzed in the laboratory to find out different
water quality parameters such as pH, EC, TDS, CO3, HCO3,
SO4, Cl, Ca, Mg, Na and K. On the basis of the results of the
analysis the different water quality parameter map of the
Wakal river basin was prepared under GIS environment.
Water sampling techniques
Water samples for quality assessment are analysed for
chemical constituents. Therefore, more attention were given
to avoid the possibility of any external contamination. The
samples were collected in plastic bottles thoroughly cleaned
and sterilized. The samples were collected using rope and
bucket. The water surface were disturbed a little to remove
any floating material before collection of the sample. The
sampling site in the study area is shown in Fig. 2.
Fig 2: Sampling site in Wakal river basin.
Analysis of water samples The physicochemical parameters such as pH, Electrical
Conductivity (EC), Total Dissolved Solids (TDS), Calcium
(Ca2+), Magnesium (Mg2+), Sodium (Na+), Potassium (K+),
Bicarbonate (HCO3), Carbonate (CO3), Chloride (Cl-), and
Sulphate (SO4) were determined using standard methods. AR
grade reagents were used for the analysis and double distilled
water was used for preparation of solutions. The methods
used for estimation of various physicochemical parameters are
given in Table 1. The water samples were analyzed in the
laboratory of AICRP on groundwater utilization as shown in
Plate 1.

~ 55 ~
Journal of Pharmacognosy and Phytochemistry
Table 1: Methods used for estimation of physiochemical parameters.
S.No. Parameters Method References
1 pH Using Glass Electrode pH meter Jackson (1973)
2 Electrical Conductivity Using EC meter Wilcox (1950)
3 Total Dissolved Solids Using TDS meter Singh and Kalra (1975)
4 Calcium and Magnesium EDTA titration Cheng & Bray (1951) and Diehl et. al. (1950)
5 Sodium Flame Photometric method Toth et. al. (1948)
7 Potassium Flame Photometric method Stanford and English (1949)
8 CO3 and HCO3 Titration with standard H2SO4 A.O.A.C. (1950)
9 Chloride Silver Nitrate method A.O.A.C (1950)
10 Sulphate Titrimetric method Munger et. al. (1950)
Plate 1: Testing of water quality in laboratory
Results and Discussion
Groundwater Chemistry of the Study Area
The different physicochemical parameters such as pH,
electrical conductivity (EC), total dissolved solids (TDS),
calcium (Ca+), magnesium (Mg+), sodium (Na+), potassium
(K+), bicarbonate (HCO3), carbonate (CO3), chloride (Cl-),
and sulphate (SO4) present in pre and post monsoon samples
of the study area were determined using standard methods.
The maximum and minimum values of these parameters of
the study area present in the groundwater during pre and post
monsoon is presented in Table 2. The variations in individual
groundwater quality parameters map are prepared in GIS
environments and shown in Fig.3a to Fig.3k for pre monsoon
and Fig.4a to Fig. 4k for post monsoon period.
Table 2: Maximum and minimum value of water quality parameters in
groundwater samples
Parameters
Pre-monsoon samples
(meq/l)
Post-monsoon samples
(meq/l)
Min. Max. Mean Min. Max. Mean
pH 6.0 8.0 6.98 6.5 7.6 7.11
EC 0.40 3.20 0.96 0.30 2.90 0.81
TDS 223 2600 641.38 200 2020 575.17
Ca 1.6 7.0 3.10 1.1 15.0 3.40
Mg 0.8 14.0 3.25 0.0 7.4 1.94
Na 0.2 12.1 2.98 0.2 6.4 2.47
K 0.0 1.2 0.13 0.0 0.6 0.06
HCO3 0.0 5.2 1.58 0.4 5.5 1.65
CO3 0.0 4.2 0.24 0.0 2.0 0.05
Cl 2.8 19.5 4.92 1.5 13.5 3.69
SO4 0.0 17.2 2.75 0.0 14.2 2.52
Pre- monsoon water quality parameter Post- monsoon water quality parameter
Fig 3a: Variation of pH in Wakal river basin during pre-monsoon
Fig 4a: Variation of pH in Wakal river basin during post-monsoon

~ 56 ~
Journal of Pharmacognosy and Phytochemistry
Fig 3b: Variation of EC in Wakal river basin during pre-monsoon
Fig. 4b: Variation of EC in Wakal river basin during post-monsoon
Fig 3c: Variation of TDS in Wakal river basin during pre-monsoon
Fig 4c: Variation of TDS in Wakal river basin during post-monsoon
Fig 3d: Variation of Ca in Wakal river basin during pre-monsoon
Fig 4d: Variation of Ca in Wakal river basin during post-monsoon

~ 57 ~
Journal of Pharmacognosy and Phytochemistry
Fig 3e: Variation of Mg in Wakal river basin during pre-monsoon
Fig 4e: Variation of Mg in Wakal river basin during post-monsoon
Fig 3f: Variation of Na in Wakal river basin during pre-monsoon
Fig 4f: Variation of Na in Wakal river basin during post-monsoon
Fig 3g: Variation of K in Wakal river basin during pre-monsoon
Fig 4g: Variation of K in Wakal river basin during post-monsoon

~ 58 ~
Journal of Pharmacognosy and Phytochemistry
Fig 3h: Variation of HCO3 in Wakal river basin during pre-monsoon
Fig 4h: Variation of HCO3 in Wakal river basin during post-monsoon
Fig 3i: Variation of CO3 in Wakal river basin during pre-monsoon
Fig 4i: Variation of CO3 in Wakal river basin during post-monsoon
Fig 3j: Variation of Cl in Wakal river basin during pre-monsoon
Fig 4j: Variation of Cl in Wakal river basin during post-monsoon
~ 59 ~
Journal of Pharmacognosy and Phytochemistry
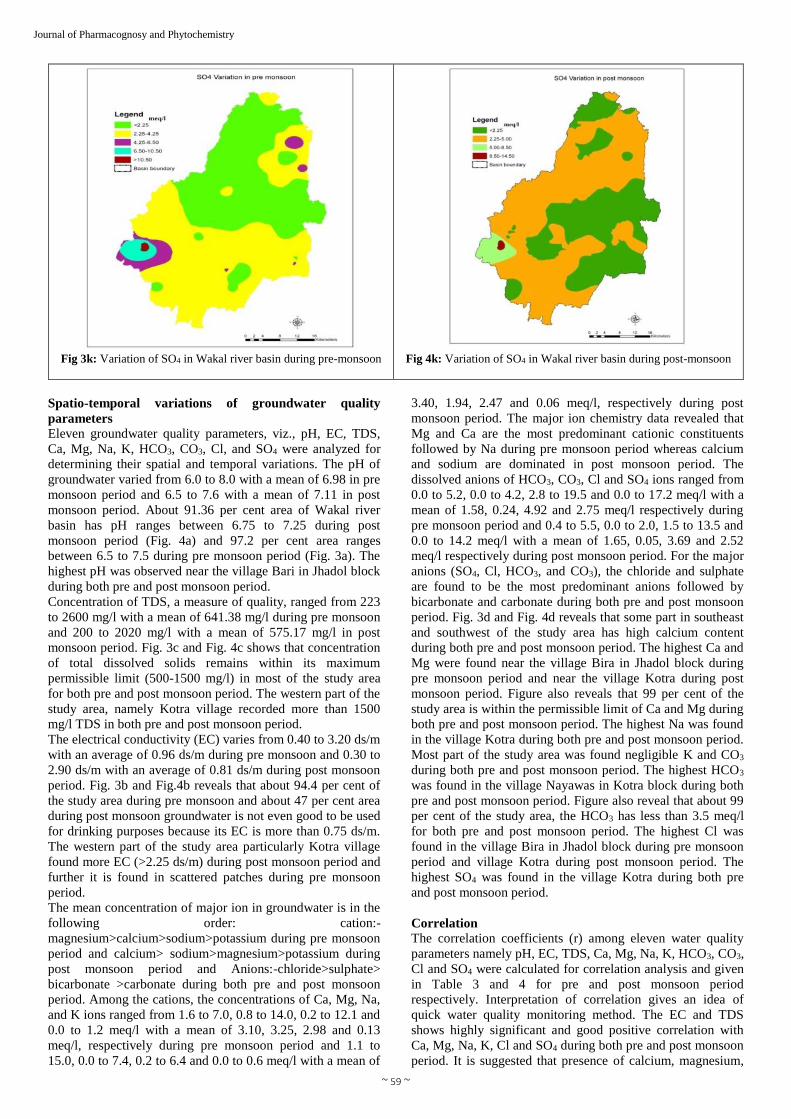
Fig 3k: Variation of SO4 in Wakal river basin during pre-monsoon
Fig 4k: Variation of SO4 in Wakal river basin during post-monsoon
Spatio-temporal variations of groundwater quality
parameters
Eleven groundwater quality parameters, viz., pH, EC, TDS,
Ca, Mg, Na, K, HCO3, CO3, Cl, and SO4 were analyzed for
determining their spatial and temporal variations. The pH of
groundwater varied from 6.0 to 8.0 with a mean of 6.98 in pre
monsoon period and 6.5 to 7.6 with a mean of 7.11 in post
monsoon period. About 91.36 per cent area of Wakal river
basin has pH ranges between 6.75 to 7.25 during post
monsoon period (Fig. 4a) and 97.2 per cent area ranges
between 6.5 to 7.5 during pre monsoon period (Fig. 3a). The
highest pH was observed near the village Bari in Jhadol block
during both pre and post monsoon period.
Concentration of TDS, a measure of quality, ranged from 223
to 2600 mg/l with a mean of 641.38 mg/l during pre monsoon
and 200 to 2020 mg/l with a mean of 575.17 mg/l in post
monsoon period. Fig. 3c and Fig. 4c shows that concentration
of total dissolved solids remains within its maximum
permissible limit (500-1500 mg/l) in most of the study area
for both pre and post monsoon period. The western part of the
study area, namely Kotra village recorded more than 1500
mg/l TDS in both pre and post monsoon period.
The electrical conductivity (EC) varies from 0.40 to 3.20 ds/m
with an average of 0.96 ds/m during pre monsoon and 0.30 to
2.90 ds/m with an average of 0.81 ds/m during post monsoon
period. Fig. 3b and Fig.4b reveals that about 94.4 per cent of
the study area during pre monsoon and about 47 per cent area
during post monsoon groundwater is not even good to be used
for drinking purposes because its EC is more than 0.75 ds/m.
The western part of the study area particularly Kotra village
found more EC (>2.25 ds/m) during post monsoon period and
further it is found in scattered patches during pre monsoon
period.
The mean concentration of major ion in groundwater is in the
following order: cation:-
magnesium>calcium>sodium>potassium during pre monsoon
period and calcium> sodium>magnesium>potassium during
post monsoon period and Anions:-chloride>sulphate>
bicarbonate >carbonate during both pre and post monsoon
period. Among the cations, the concentrations of Ca, Mg, Na,
and K ions ranged from 1.6 to 7.0, 0.8 to 14.0, 0.2 to 12.1 and
0.0 to 1.2 meq/l with a mean of 3.10, 3.25, 2.98 and 0.13
meq/l, respectively during pre monsoon period and 1.1 to
15.0, 0.0 to 7.4, 0.2 to 6.4 and 0.0 to 0.6 meq/l with a mean of
3.40, 1.94, 2.47 and 0.06 meq/l, respectively during post
monsoon period. The major ion chemistry data revealed that
Mg and Ca are the most predominant cationic constituents
followed by Na during pre monsoon period whereas calcium
and sodium are dominated in post monsoon period. The
dissolved anions of HCO3, CO3, Cl and SO4 ions ranged from
0.0 to 5.2, 0.0 to 4.2, 2.8 to 19.5 and 0.0 to 17.2 meq/l with a
mean of 1.58, 0.24, 4.92 and 2.75 meq/l respectively during
pre monsoon period and 0.4 to 5.5, 0.0 to 2.0, 1.5 to 13.5 and
0.0 to 14.2 meq/l with a mean of 1.65, 0.05, 3.69 and 2.52
meq/l respectively during post monsoon period. For the major
anions (SO4, Cl, HCO3, and CO3), the chloride and sulphate
are found to be the most predominant anions followed by
bicarbonate and carbonate during both pre and post monsoon
period. Fig. 3d and Fig. 4d reveals that some part in southeast
and southwest of the study area has high calcium content
during both pre and post monsoon period. The highest Ca and
Mg were found near the village Bira in Jhadol block during
pre monsoon period and near the village Kotra during post
monsoon period. Figure also reveals that 99 per cent of the
study area is within the permissible limit of Ca and Mg during
both pre and post monsoon period. The highest Na was found
in the village Kotra during both pre and post monsoon period.
Most part of the study area was found negligible K and CO3
during both pre and post monsoon period. The highest HCO3
was found in the village Nayawas in Kotra block during both
pre and post monsoon period. Figure also reveal that about 99
per cent of the study area, the HCO3 has less than 3.5 meq/l
for both pre and post monsoon period. The highest Cl was
found in the village Bira in Jhadol block during pre monsoon
period and village Kotra during post monsoon period. The
highest SO4 was found in the village Kotra during both pre
and post monsoon period.
Correlation
The correlation coefficients (r) among eleven water quality
parameters namely pH, EC, TDS, Ca, Mg, Na, K, HCO3, CO3,
Cl and SO4 were calculated for correlation analysis and given
in Table 3 and 4 for pre and post monsoon period
respectively. Interpretation of correlation gives an idea of
quick water quality monitoring method. The EC and TDS
shows highly significant and good positive correlation with
Ca, Mg, Na, K, Cl and SO4 during both pre and post monsoon
period. It is suggested that presence of calcium, magnesium,

~ 60 ~
Journal of Pharmacognosy and Phytochemistry
sodium, potassium, chloride and sulphate in the study area
greatly influence the TDS and EC. The EC also shows highly
significant and good positive correlation with TDS during
both pre and post monsoon period. The chloride and sulphate
also shows highly significant and positive correlation with
calcium, magnesium and sodium. Potassium also exhibit
highly significant and positive correlation with carbonate and
chloride during pre monsoon period and with sulphate during
post monsoon period. Chloride is also significant and positive
correlation with sulphate during both the period. It is revealed
that pH, CO3 and HCO3 exhibit negative or poor correlation
with most of the variable during both pre and post monsoon
period (Table 3 and 4).
Conclusion
Present study aimed at in-depth geochemical investigations in
the study area for efficient management of scarce
groundwater resources. It was analysed in the process of study
that use of GIS can make the cumbersome groundwater
quality analysis as an easy task. The groundwater quality of
the Wakal river basin was analyzed. The different water
quality parameter map was prepared under GIS environment
and the spatio-temporal variations of groundwater quality
parameters were analyzed. The highest EC, TDS, Na, SO4
was found in village Kotra and Ca, Mg, Cl in village Bira of
Jhadol block during pre monsoon period. During post
monsoon period the highest EC, TDS, Ca, Mg, Na, K, Cl and
SO4 was found in village Kotra.
Table 3: Correlation matrix for different water quality parameters in pre-monsoon
parameter pH TDS EC Ca Mg Na K HCO3 CO3 Cl SO4
pH 1.000 0.044 0.080 -0.076 -0.023 0.248* -0.012 0.246* 0.066 -0.075 0.070
TDS 0.044 1.000 0.980** 0.598** 0.786** 0.707** 0.414** 0.015 0.124 0.781** 0.758**
EC 0.080 0.980** 1.000 0.614** 0.811** 0.702** 0.423** 0.065 0.165 0.828** 0.699**
Ca -0.076 0.598** 0.614** 1.000 0.516** 0.131 -0.051 -0.052 -0.104 0.611** 0.408**
Mg -0.023 0.786** 0.811** 0.516** 1.000 0.226* 0.173 -0.105 -0.091 0.791** 0.568**
Na 0.248* 0.707** 0.702** 0.131 0.226* 1.000 0.507** 0.231* 0.371** 0.407** 0.535**
K -0.012 0.414** 0.423** -0.051 0.173 0.507** 1.000 0.054 0.434** 0.294** 0.236*
HCO3 0.246* 0.015 0.065 -0.052 -0.105 0.231* 0.054 1.000 0.081 -0.078 -0.295**
CO3 0.066 0.124 0.165 -0.104 -0.091 0.371** 0.434** 0.081 1.000 0.062 -0.102
Cl -0.075 0.781** 0.828** 0.611** 0.791** 0.407** 0.294** -0.078 0.062 1.000 0.317**
SO4 0.070 0.758** 0.699** 0.408** 0.568** 0.535** 0.236* -0.295** -0.102 0.317** 1.000
Table 4: Correlation matrix for different water quality parameters in post-monsoon
parameter pH TDS EC Ca Mg Na K HCO3 CO3 Cl SO4
pH 1.000 0.041 0.037 -0.105 0.109 0.167 0.157 0.224 0.040 -0.195 0.206
TDS 0.041 1.000 0.994** 0.846** 0.739** 0.639** 0.552** 0.319* 0.108 0.836** 0.792**
EC 0.037 0.994** 1.000 0.865** 0.734** 0.635** 0.535** 0.329* 0.096 0.848** 0.789**
Ca -0.105 0.846** 0.865** 1.000 0.519** 0.275* 0.337** 0.186 -0.074 0.840** 0.652**
Mg 0.109 0.739** 0.734** 0.519** 1.000 0.262* 0.326* 0.162 0.037 0.582** 0.669**
Na 0.167 0.639** 0.635** 0.275* 0.262* 1.000 0.541** 0.434** 0.312* 0.406** 0.482**
K 0.157 0.552** 0.535** 0.337** 0.326* 0.541** 1.000 0.224 0.241 0.299* 0.544**
HCO3 0.224 0.319* 0.329* 0.186 0.162 0.434** 0.224 1.000 0.004 0.028 0.087
CO3 0.040 0.108 0.096 -0.074 0.037 0.312* 0.241 0.004 1.000 0.082 -0.090
Cl -0.195 0.836** 0.848** 0.840** 0.582** 0.406** 0.299* 0.028 0.082 1.000 0.466**
SO4 0.206 0.792** 0.789** 0.652** 0.669** 0.482** 0.544** 0.087 -0.090 0.466** 1.000 **Correlation is significant at the p<0.01 level (2-tailed), *Correlation is significant at the p<0.05level (2-tailed)
References 1. A.O.A.C. Official and Tentative Methods of Analysis of
the Association of Official Agricultural Chemists, Ed. 7,
910 pp. Washington., 1950.
2. Bouwer H. Integrated water management: Emerging
issues and challenges. Agricultural Water Management,
2000; 45:217–228.
3. CGWB. Dynamic groundwater resources of India (as on
March 2004). Central Ground Water Board (CGWB),
Ministry of water resources (pp.120). New Delhi:
Government of India., 2006.
4. Cheng KL, Bray RH. Determination of calcium and
magnesium in soil and plant material. Soil Science, 1951;
72:449-458.
5. Collins RP, Jenkins A, Sloan WT. A GIS framework for
modeling nitrogen leaching from agricultural areas in the
Middle Hills, Nepal. International Journal of
Geographical Information Science, 1998; 12(5):479-490.
6. Dhiman SD. Factoring groundwater quality”, Geospatial
Today, 2005; 4(1):50-54.
7. Diehl H, Goetz CA, Hauch CC. The versene titration for
total hardness. Amer. Water Works Assoc. Journal, 1950;
42:40-48.
8. Foster S. Groundwater: Assessing vulnerability and
promoting protection of a threatened resource. In:
Proceedings of the 8th Stockholm Water Symposium (pp.
79–90), 10–13 August, Sweden., 1998.
9. Garg NK, Hassan Q. Alarming scarcity of water in India.
Current Science, 2007; 93:932–941.
10. Gogu RC, Carabin G, Hallet V, Peters V, Dassargues A.
GIS-based hydrogeological databases and groundwater
modeling. Hydrogeology Journal, 2001; 9:555-569.
11. Humphreys WF. Hydrogeology and groundwater
ecology: Does each inform the other? Hydrogeology
Journal, 2009; 17(1):5-21.
12. IDWR. Water and Rajasthan. Report of the Expert
Committee on Integrated Development of Water
Resources, June 2005. Water Resources Department,
Government of Rajasthan., 2005.
13. Jackson ML. Soil Chemical Analysis Prentice Hall of
India Private Limited, New Delhi., 1973.
14. Jha MK, Peiffer S. Applications of Remote Sensing and
GIS Technologies in Groundwater Hydrology: Past,
Present and Future. BayCEER, Bayreuth, Germany,
~ 61 ~
Journal of Pharmacognosy and Phytochemistry
2006, 201.
15. Jha MK, Chowdhury A, Chowdary VM, Peifer S.
Groundwater management and development by
integrated remote sensing and geographic information
systems: prospects and constraints. Water Resour
Manage, 2007; 21(2):427–467.
16. Machiwal D, Jha MK, Mal BC. GIS-based assessment
and characterization of groundwater quality in a hard-
rock hilly terrain of Western India. Journal of
Environmental monitoring and assessment, 2011; 174(1-
4):645-663.
17. Munger JR, Nippier RW, Ingold RS. Analytical
chemistry of the sulphur acids. Anal. Chem., 1950;
22:1455.
18. Rathore MS. Community based management of ground
water resources: a case study of Arwari River Basin.
Institute of Development Studies, Jaipur (Project Report
submitted to British Geological Survey)., 2003
19. Rathore MS. Report on groundwater exploration and
augmentation efforts in Rajasthan–a review. Institute of
Development Studies, Jhalana Institutional Area, Jaipur,
2005, 33.
20. Rodell M, Velicogna I, Famiglietti JS. Satellite-based
estimates of groundwater depletion in India. Nature,
2009; 460:999–1002.
21. Shah T, Molden D, Sakthivadivel R, Seckler D. The
Global Groundwater Situation: Overview of
Opportunities and Challenges. Colombo: IWMI., 2000.
22. Shankar K, Aravindan S, Rajendran S. GIS based
Groundwater Quality Mapping in Paravanar River Sub-
Basin, Tamil Nadu, India”, International Journal of
Geomatics and Geosciences, 2010; 1(3):282-296.
23. Singh T, Kalra YP. Specific conductance method for in
situ estimation of total dissolved solids. J. Am. Water
Works Assoc, 1975; 67(2):99.
24. Standford S, English L. Use of the flame photometer in
rapid soil tests for K and Ca. Agron. Journal, 1949;
4:446-447.
25. State Water Policy. State Water Resource Planning
Department, Government of Rajasthan, Jaipur, 2010, 16p.
26. Status Report. Status report on water quality of water
bodies and groundwater in Maharastra for the year 2004-
2005. Hydrology Project (SW), Water Resources
Department, Government of Maharastra., 2007.
27. Steube C, Richter S, Griebler C. First attempts towards an
integrative concept for the ecological assessment of
groundwater ecosystems. Hydrogeology Journal,
17(1):23-35.
28. Sujatha D, Rajeswara Reddy B. Quality characterization
of groundwater in the south-eastern part of the Ranga
Reddy district, Andhra Pradesh. Indian Journal of
Environmental Geology, 2003; 44:579-586.
29. Surface Water Resources Assessment Report: Wakal
River Basin, India. Global Water for Sustainability
Program, Florida International University, 2008, 36.
30. Toleti BVMR, Chaudhary BS, Kumar KEM, Saroha GP,
Yadar M, Singh A, et al. 2001. Integrated groundwater
resources mapping in Gurgoan District (Haryana) India
using remote sensing and GIS techniques. Assian
Association on Remote Sensing (AARS)-Proceeding.
31. Toth SJ, Prince AI, Wallace A, Mikkelsen DS. Rapid
quantitative determination of eight mineral elements in
plant tissue by a systematic procedure involving use of a
flame photometer. Soil Science, 1948; 66:459-466.
32. WHO-UNICEF. 2002. India Assessment 2002. Water
Supply and Sanitation. Planning Commission,
Government of India. Zektser, I. S. 2000. Groundwater
and the environment: Applications for the global
community (pp. 175). BocaRaton: Lewis.
33. Wilcox LV. Electrical Conductivity. Amer. Water Works
Assoc. Journal, 1950; 42:775-776.
34. Zektser IS. Groundwater and the Environment:
Applications for the Global Community. Lewis
Publishers, Boca Raton, Florida, 2000, 175.