Reactive Magnetron Sputter Deposition and Characterization of Thin Films from the Ti-Al-N and Sc

Chapter 4: Deposition of Nitric Acid and Reactive Nitrogen at Harvard Forest
Abstract
The hourly gas-phase HNO3 concentration was measured at the Harvard Forest
Environmental Measurement Site during the spring, summer, and fall of 2000 using a
Tunable Diode Laser Absorption Spectrometer (TDLAS). A dry deposition inferential
method (DDIM) employed micrometeorological data to estimate the deposition velocity
of HNO3 on an hourly basis. HNO3 fluxes were calculated hourly as the product of
measured concentration and inferred deposition velocity. We aggregated the hourly data
on daily and weekly timescales to simulate standard dry deposition monitoring
procedures which use long-time averaging techniques, such as filterpacks and denuders,
to measure concentrations. We found that the longer averages introduced noise, but not
significant bias, into the resulting HNO3 fluxes. HNO3 concentrations were slightly
lower under clean (NW flow) conditions compared to more polluted (SW); inferred
Vd(HNO3) was nearly the same for the two flow regimes. Vd(PAN) was estimated by
comparison with Vd(O3) on nights were first-order decays of both species were observed
and deposition to the surface was likely to be the primary loss mechanism. Using
estimated PAN and NOx deposition velocities and measured concentrations, we find that
the concentration and flux budgets of NOy are essentially closed for the NW, and
unaccounted by up to 50% for the SW. We calculated that the deposition velocity of the
unmeasured species (SW flow) was approximately 3 cm s-1.
104

4.1. Introduction
Reactive nitrogen trace gas species play an important role in tropospheric
photochemistry by stimulating ozone formation, affecting the concentration of hydroxyl
radicals, and contributing to acid precipitation. Emissions of reactive nitrogen are largely
in the form of nitric oxide, NO, predominantly from combustion of fossil fuel and
production by soil microbes. Additional sources of NO to the troposphere come from
biomass burning, lightning, ammonia oxidation, emission from the oceans and transport
from the stratosphere. NO is quickly oxidized to nitrogen dioxide, NO2, by reaction with
ozone, O3, or peroxy radical species, RO2. During the day, NO2 may be photolyzed back
to NO, and the product oxygen atom regenerates O3 by combining with molecular O2.
When NO oxidation proceeds via RO2 instead of O3, NO2 photolysis results in net
production of O3.
NOx is converted to nitric acid, HNO3, via both homogeneous and heterogeneous
chemical pathways. Recycling of HNO3 back to NOx is very inefficient in the
troposphere compared to wet and dry deposition, and thus oxidation of NOx to HNO3
represents a termination step for NOx photochemistry in the troposphere. NOx may also
form temporary non-radical reservoir species such as peroxyacetyl nitrate (PAN) and
other organic nitrates, allowing alternative deposition pathways or export to remote
regions where radicals may be regenerated. Thus conversion of NOx radicals to HNO3
and subsequent deposition is considered the primary loss process for reactive nitrogen
and an important sink for HOx radicals, which participate in the oxidation of
hydrocarbons to form ozone [Logan et al., 1981; Logan, 1983].
105

Deposition of HNO3 contributes acid to ecosystems second only to sulfuric acid
deposition in the northeastern United States [U.S. Environmental Protection Agency,
2001]. HNO3 can act as a fertilizer, delivering fixed nitrogen to forests and crops, or as a
damaging toxicant, stripping base cations and mobilizing toxic elements such as
aluminum in soils. Thus the partitioning of total reactive nitrogen, NOy = NO + NO2 +
NO3 + N2O5 + HNO3 + peroxyacetylnitrate (PAN) + other organic nitrates + aerosol
nitrate, among the individual species, has direct effects on photochemical production of
ozone in rural and urban areas, on deposition of acidic species to ecosystems, and on the
export of atmospheric nitrogen from the continent to the global troposphere.
Comparisons have been made previously between the sum of concentrations of
individual NOy species, Σ(NOy)i, and total NOy measured by catalytic conversion (on hot
gold or molybdenum) to NO at continental rural sites [e.g. Parrish et al., 1993; Aneja et
al., 1996; Thornberry et al., 2001], coastal sites [e.g. Harrison et al., 1999], and for the
remote free troposphere [e.g. Bradshaw et al., 2000]. Discrepancies between [NOy] and
Σ(NOy)i have been largely attributed to interference of reduced nitrogen species such as
NH3, HCN, and other organic molecules with direct C-N bonds, in the NOy
measurements [Kliner et al., 1997; Bradshaw et al. 1998; Harrison et al., 1999]. Taking
into account possible interference, total NOy measurements appear to be dominated by
NOx, HNO3, and PANs, with lesser contributions from aerosol nitrates, under a wide
variety of lower tropospheric conditions.
Few studies have attempted to speciate the deposition flux of reactive nitrogen to
the surface. Munger et al. [1996; 1998] observed concentrations and eddy covariance
fluxes of NOy and NOx, and inferred that nearly all dry deposition of NOy occurs in the
106
form of rapidly-depositing species such as HNO3, with a summertime contribution due to
organic hydroxyalkyl nitrates formed during the oxidation of biogenic hydrocarbons
(isoprene and monoterpenes). We have confirmed (see Chapter 3) that direct deposition
of NO and NO2 are small compared to NOy fluxes. Prior estimates of PAN deposition
velocity to vegetation also indicate that it should contribute negligibly to the flux of NOy
[Shepson et al., 1992; Schrimpf et al., 1996; McFayden and Cape, 1999].
Due in part to its tendency to adsorb onto many types of surfaces, HNO3
measurement techniques with demonstrated accuracy, high precision, and a lack of
interferences have taken decades to develop. Increasingly reliable methods have
appeared over the last several years. Filter packs and denuders of various designs are
employed for routine monitoring [e.g. Harrison et al., 1999; Rosman et al., 2001; Clarke
et al., 1997]. These techniques often require collection times on the order of hours to
days, after which the filter or denuder is removed, extracted, and processed to detect NO3-
in solution by ion chromatography. Potential interferences inherent to filters and
denuders have been documented and minimized during the last two decades.
Nevertheless, positive and negative artifacts remain possible under certain conditions,
and the degree to which various organic nitrate-containing species are sampled remains
unknown. Mist chamber techniques rely on capture and dissolution of HNO3 and
detection by ion chromatography; recent implementations have the advantage of much
shorter integration times (minutes) and thorough calibration procedures, which have
greatly reduced the uncertainties associated with the measurements [cf. Talbot et al.,
1997; Bradshaw et al., 1998]. Day et al. [2002] employ thermal dissociation of NOy
compounds at calibrated temperatures (including HNO3), followed by laser-induced
107
fluorescence detection of NO2. This instrument design has the advantage of measuring
peroxy nitrates and alkyl nitrates in addition to HNO3.
Recently developed Chemical Ionization Mass Spectrometers (CIMS) have
demonstrated faster time response (~1 s) for HNO3 measurements. Sensitivity in these
instruments is also very good, under 50 pmol mol-1 HNO3 concentration in air, and
interferences have been minimized through careful selection of ion chemistry and
standard addition calibrations of HNO3 from heated, constant-flow permeation tubes
[Huey et al., 1998; Mauldin et al., 1998; Miller et al., 2000; Furutani and Akimoto,
2002]. Permeation devices require long stabilization times, and very constant
temperatures and flow rates must be maintained in all parts of the calibration oven and
delivery tubing to ensure quantitative HNO3 calibrations. Nevertheless, recently
developed systems have agreed well in intercomparisons and have no obvious or large
interferences [e.g. Fehsenfeld et al., 1998].
Tunable Diode Laser Absorption Spectroscopy (TDLAS) provides a useful
alternative for continuous, unattended field monitoring of HNO3. The TDLAS
instrument used in this study employs recent advances in long path length/low volume
absorption cells, inlet material and design, and real-time data processing to achieve a
spectroscopically-calibrated measurement of HNO3 concentration. A prototype HNO3
TDLAS instrument participated in an informal intercomparison with the CIMS HNO3
instrument described by Huey et al. [1998] in 1996. The TDLAS compared well with the
CIMS results over a wide range of concentrations, ambient relative humidity, and
pollution levels [see Chapter 2; Horii et al., 1999].
108

We present measurements of NOy and HNO3, along with NO, NO2, and PAN
during summer and fall of 2000 at the Harvard Forest Environmental Measurement Site.
In order to disaggregate the flux of reactive nitrogen by species, we measured the eddy
covariance flux of NOy, inferred the flux of HNO3 using a standard approach, and
estimated the contributions of NOx and PAN to NOy deposition. Using the speciated NOy
concentrations and fluxes, we determined the concentration and average deposition
velocity of a class of rapidly-depositing compounds present under the more polluted,
warmer, and more humid flow regime at the site.
4.2. Methods
4.2.1. Experimental Methods
HNO3 and NOy were measured at the Harvard Forest Environmental
Measurement Site in central Massachusetts, along with micrometeorological and
supporting data, during the summer and fall of 2000 (the site is described more fully in
Chapter 3). The concentration of HNO3 was measured using a tunable diode laser
absorption spectrometer (TDLAS) installed on a tower above the forest canopy (refer to
Chapter 2 for full description of the instrument). The inlet was designed to keep the
residence time short, to minimize wall effects, and to exclude aerosols from the sample
flow. Sampling height for HNO3 was 22 m, ~2 m above the canopy top. The TDLAS
specifically and quantitatively measured gas-phase HNO3, using spectroscopic fitting of
several absorption lines to eliminate interferences from other reactive nitrogen species
such as PAN, hydroxyalkyl nitrates, NOx, and fine aerosols. These species are however
all included in the NOy measurement. Ongoing NOy concentrations and eddy covariance
109

flux measurements on a nearby tower at a sampling height of 29 m employed a hot gold
catalyst to reduce total nitrogen oxide to NO in the presence of H2. The catalyst was
located at the inlet so that species with the tendency to adsorb onto tubing walls, such as
HNO3, were not lost. A complete description of the NOy instrument can be found in
Munger et al. [1996]. PAN was measured using capillary-column gas chromatography
(Metcon Inc.) with electron-capture detection. The instrument calibration was checked
periodically by introduction of PAN generated by photolysis of acetone in the presence of
NO2 [Warneck and Zerbach, 1992].
4.2.2. Data Analysis Methods
Dry Deposition Inferential Method for HNO3
The hourly deposition velocity of HNO3 was estimated using a dry deposition
inferential method (DDIM) in which the deposition velocity, Vd, is modeled as a set of
resistances in series depending on meteorological and site-specific conditions. The flux
was computed as the product of measured HNO3 concentration and inferred Vd.
[HNO3] Vd = [HNO3] (Ra + Rb + Rc)-1 (Eq. 4.1)
Ra represents aerodynamic resistance, Rb approximates the diffusive boundary layer
resistance, and Rc is a species-specific resistance to uptake. High solubility and surface
reactivity make Rc ≈ 0 for HNO3 [Wesely and Hicks, 2000; Hanson and Lindberg, 1991].
After Wesley and Hicks [1977], Hicks et al. [1987], Wesley [1989], and Meyers et al.
[1989], Ra and Rb were calculated as follows:
110
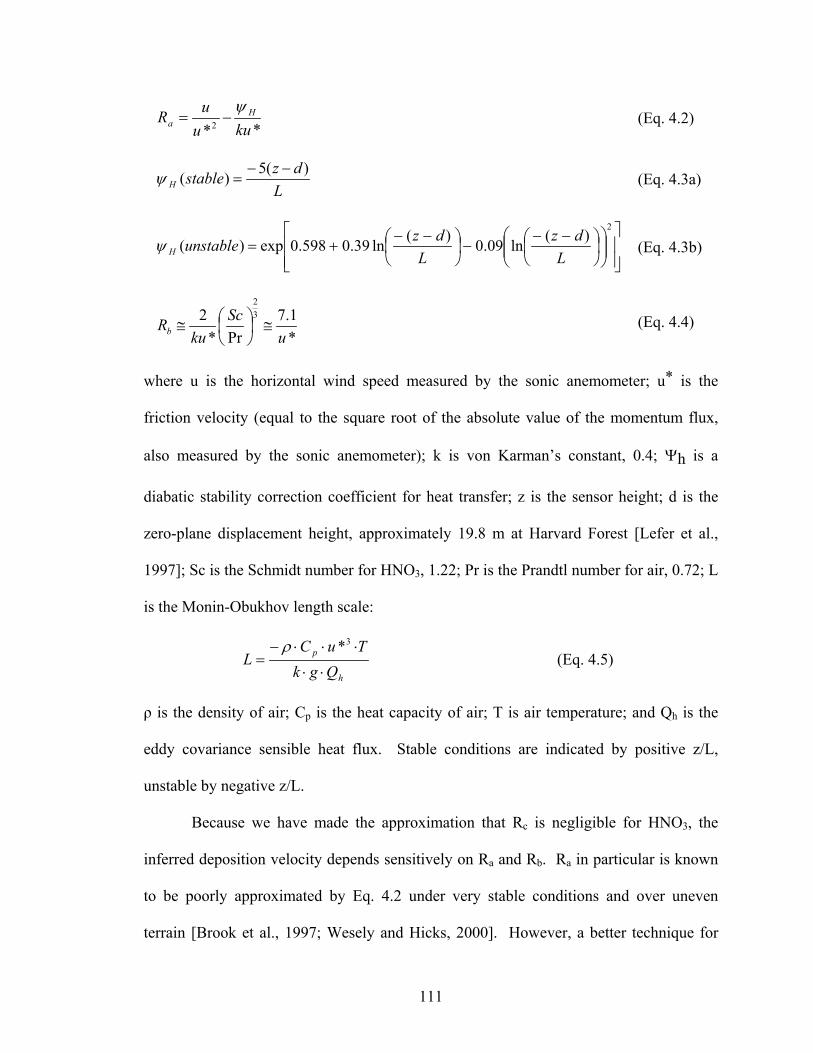
**2 kuuuR H
aψ
−= (Eq. 4.2)
LdzstableH
)(5)( −−=ψ (Eq. 4.3a)
−−
−
−−
+=2
)(ln09.0)(ln39.0598.0exp)(L
dzL
dzunstableHψ (Eq. 4.3b)
*1.7
Pr*2 3
2
uSc
kuRb ≅
≅ (Eq. 4.4)
where u is the horizontal wind speed measured by the sonic anemometer; u* is the
friction velocity (equal to the square root of the absolute value of the momentum flux,
also measured by the sonic anemometer); k is von Karman’s constant, 0.4; Ψh is a
diabatic stability correction coefficient for heat transfer; z is the sensor height; d is the
zero-plane displacement height, approximately 19.8 m at Harvard Forest [Lefer et al.,
1997]; Sc is the Schmidt number for HNO3, 1.22; Pr is the Prandtl number for air, 0.72; L
is the Monin-Obukhov length scale:
h
p
QgkTuC
L⋅⋅
⋅⋅⋅−=
3*ρ (Eq. 4.5)
ρ is the density of air; Cp is the heat capacity of air; T is air temperature; and Qh is the
eddy covariance sensible heat flux. Stable conditions are indicated by positive z/L,
unstable by negative z/L.
Because we have made the approximation that Rc is negligible for HNO3, the
inferred deposition velocity depends sensitively on Ra and Rb. Ra in particular is known
to be poorly approximated by Eq. 4.2 under very stable conditions and over uneven
terrain [Brook et al., 1997; Wesely and Hicks, 2000]. However, a better technique for
111
estimating Vd(HNO3) without a multi-layer aerodynamic and boundary layer resistance
model has not been developed.
4.3. Results
4.3.1. HNO3 Concentrations and Inferred Fluxes
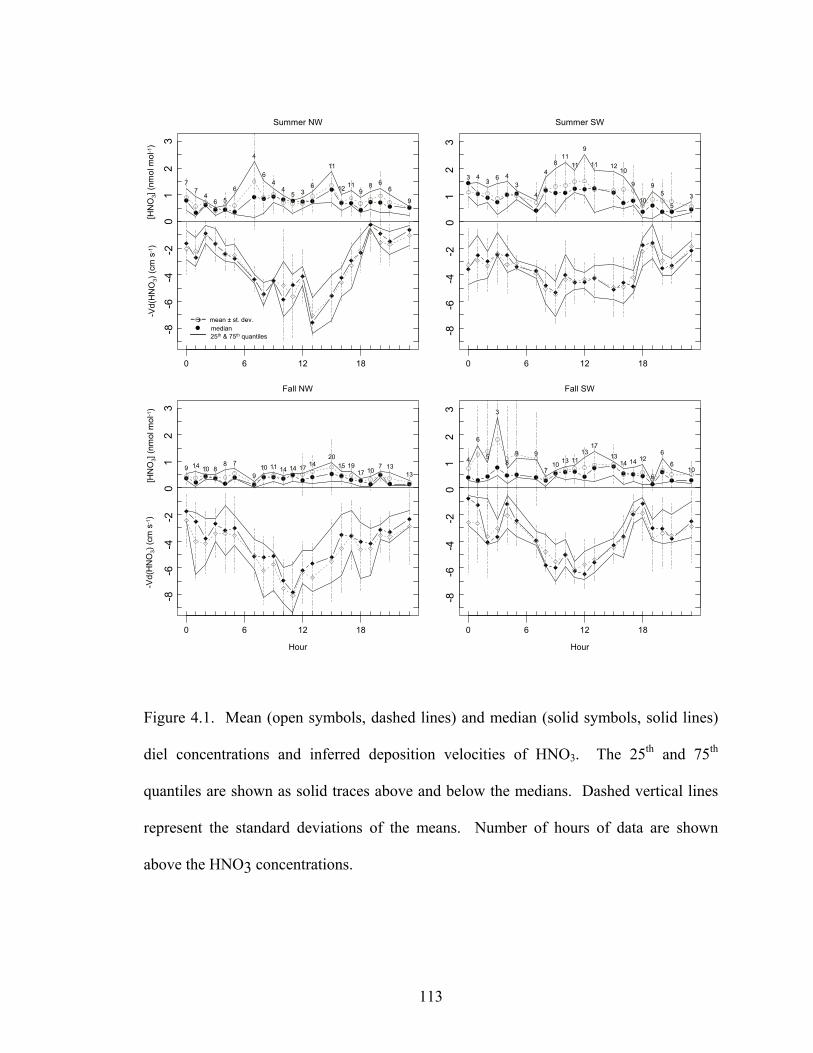
In Figure 4.1, the measured HNO3 concentrations and inferred deposition
velocities are shown on a diel basis, separated into the dominant wind sectors of
Northwest (270°-45°) and Southwest (180°-270°) for summer and fall 2000. As in
Chapter 3, -Vd or “exchange velocity” is plotted, so that negative values represent
deposition. At Harvard Forest, northwesterly flows correspond to relatively cool, dry,
and unpolluted conditions, and southwest winds transport warmer, more humid, and
significantly more polluted air masses to the site [Moody et al., 1998]. On average, the
HNO3 concentration has a slight diel cycle in the summer, and is nearly constant over the
day during the fall. All data collected during the spring, summer, and fall of 2000,
segregated by wind direction, are considered together in Figure 4.2. There is remarkably
little difference in the observed HNO3 concentration between Northwest and Southwest
flow regimes in both seasons. The inferred deposition velocity, in contrast, has a strong
diel cycle, driven by the larger u* during the day than at night. A sample time series in
Figure 4.3 shows that the inferred HNO3 deposition flux exceeds the measured downward
NOy flux during some hours, but the two generally follow one another. Conditions when
deposition flux of NOy greatly exceeds the sum of measured, inferred, and estimated
fluxes of NOx, HNO3, and PAN are discussed in section 4.4 below.
112
Hour
9 14 10 88 7
910 11 14 14 17 14
2015 19
17 107 13
13
0 6 12 18
Fall NW
77
46 5
6
4
64
45 3
6
11
12 119
8 66
9
0 6 12 18
Summer NW
[HN
O3]
(nm
ol m
ol-1)
-Vd(
HN
O3)
(cm
s-1)
[HN
O3]
(nm
ol m
ol-1)
-Vd(
HN
O3)
(cm
s-1)
mean ± st. dev.median25th & 75th quantiles
3 43 6 4
34
48
1111
9
11 1210
9
10
95
53
0 6 12 18
Summer SW
Hour
4
6
5
3
89 9
710 13 11
1317
1314 14 12
6
6
610
0 6 12 18
Fall SW
-8-6
-4-2
01
23
-8-6
-4-2
01
23
-8-6
-4-2
01
23
-8-6
-4-2
01
23
Figure 4.1. Mean (open symbols, dashed lines) and median (solid symbols, solid lines)
diel concentrations and inferred deposition velocities of HNO3. The 25th and 75th
quantiles are shown as solid traces above and below the medians. Dashed vertical lines
represent the standard deviations of the means. Number of hours of data are shown
above the HNO3 concentrations.
113

0.0
0.4
0.8
0.0
0.4
0.8
SWNW
All Data
-8-6
-4-2
0
Hour
0 5 10 15 20
-6-4
-20
[HN
O3]
(nm
ol m
ol-1
)V(
HN
O3)
(cm
s-1
)V
·[H
NO
3] (n
mol
mol
-1cm
s-1)
Figure 4.2. Median diel HNO3 concentrations (upper panel), inferred deposition
velocities (center panel), and flux, V(HNO3)·[HNO3], (lower panel) for Southwest and
Northwest wind sectors, summer and fall, 2000.
114

25
20
15
10
5
0
[NO
y], [H
NO
3] (n
mol
mol
-1)
286284282280278276274272270
Day of Year 2000
-25
-20
-15
-10
-5
0
FNO
y, FH
NO
3 (µm
ol m
-2 h
r-1)
NOy HNO3 HNO3 + NOx
Figure 4.3. Time series from 25 September to 12 October 2000. [NOy] and [HNO3] are
in the upper panel, along with [HNO3]+[NOx]. Eddy covariance NOy flux and inferred
HNO3 flux are shown in the lower panel.
115
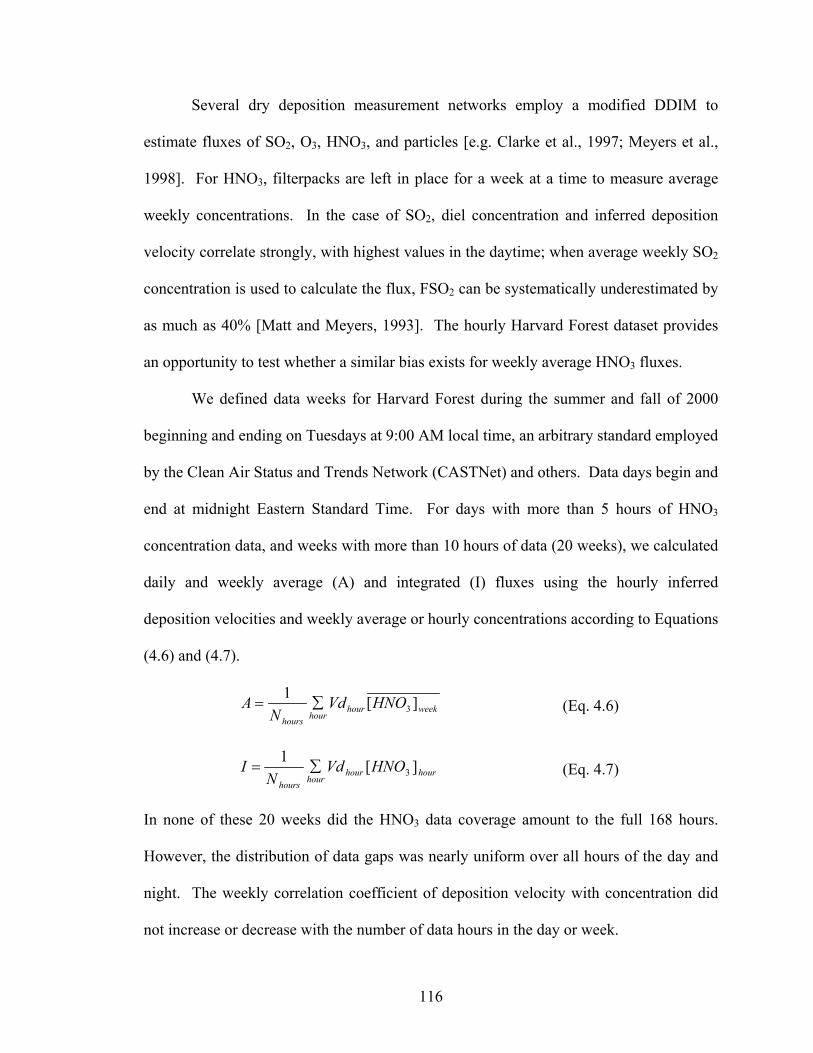
Several dry deposition measurement networks employ a modified DDIM to
estimate fluxes of SO2, O3, HNO3, and particles [e.g. Clarke et al., 1997; Meyers et al.,
1998]. For HNO3, filterpacks are left in place for a week at a time to measure average
weekly concentrations. In the case of SO2, diel concentration and inferred deposition
velocity correlate strongly, with highest values in the daytime; when average weekly SO2
concentration is used to calculate the flux, FSO2 can be systematically underestimated by
as much as 40% [Matt and Meyers, 1993]. The hourly Harvard Forest dataset provides
an opportunity to test whether a similar bias exists for weekly average HNO3 fluxes.
We defined data weeks for Harvard Forest during the summer and fall of 2000
beginning and ending on Tuesdays at 9:00 AM local time, an arbitrary standard employed
by the Clean Air Status and Trends Network (CASTNet) and others. Data days begin and
end at midnight Eastern Standard Time. For days with more than 5 hours of HNO3
concentration data, and weeks with more than 10 hours of data (20 weeks), we calculated
daily and weekly average (A) and integrated (I) fluxes using the hourly inferred
deposition velocities and weekly average or hourly concentrations according to Equations
(4.6) and (4.7).
weekhourhourhours
HNOVdN
A ][13∑= (Eq. 4.6)
hourhourhourhours
HNOVdN
I ][13∑= (Eq. 4.7)
In none of these 20 weeks did the HNO3 data coverage amount to the full 168 hours.
However, the distribution of data gaps was nearly uniform over all hours of the day and
night. The weekly correlation coefficient of deposition velocity with concentration did
not increase or decrease with the number of data hours in the day or week.
116

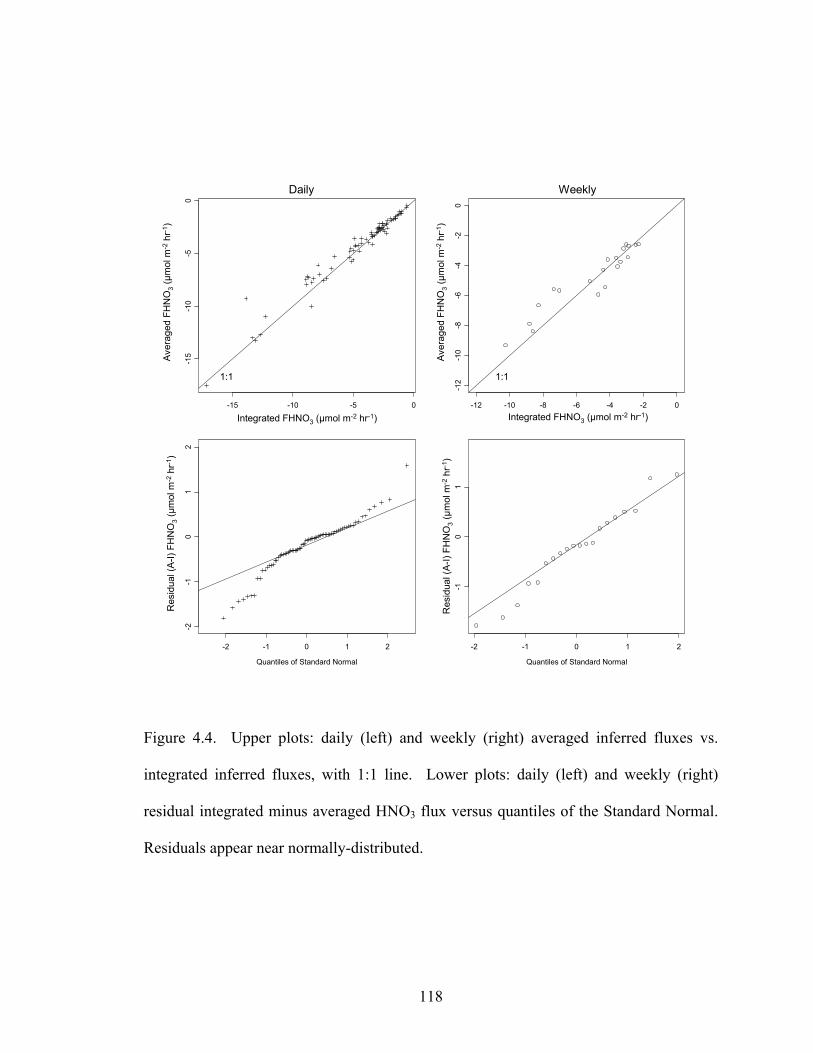
Figure 4.4 shows the daily and weekly averaged vs. integrated HNO3 fluxes. In
both cases, the results fall near the 1:1 line. Also shown are the daily and weekly
residuals (A-I) plotted against the quantiles of the standard normal. Residuals appear
near-normally distributed, with extended wings in the daily case. The mean (± 1 standard
deviation) correlation coefficients were r(Vd,HNO3)daily = -0.1±0.5 and r(Vd,HNO3)weekly
= 0.1±0.3, indicating no significant correlation on either timescale (cf. Figure 4.2). For
weeks with 20 or more hours of data, r(Vd, HNO3)weekly was as large as ±0.5, but unlike
Matt and Meyers’ [1993] results for SO2, there was no consistent positive or negative
correlation. Thus it appears that differences between A and I were largely due to random
errors in both deposition velocity and concentration. Diel correlations between HNO3
concentration and Vd are much smaller than for SO2 and did not introduce a substantial
bias in the weekly average flux, compared to weekly integrated flux, over the 20 data
weeks considered here.
4.3.2. Estimates of NOx and PAN Fluxes
In order to evaluate the contributions of HNO3, NOx, and PAN to the total
deposition flux of NOy, we use the inferred hourly flux of HNO3 discussed above, the
parameterization of NO and NO2 fluxes presented in Chapter 3, and an estimate of the
nighttime deposition velocity of peroxyacetyl nitrate (PAN), CH3C(O)OONO2. In order
to obtain an estimate of the deposition part of the NO and NO2 fluxes during both day
and night, we calculate FNOx(dep) by excluding the light-dependent, coupled flux term in
the parameterizations (see Chapter 3 for details):
FNOx(dep) ≈ V0 · [NO2] + a · [NO2]2 + Γ · Vd(O3), (Eq. 4.8)
117
-15 -10 -5 0
-15
-10
-50
Quantiles of Standard Normal
-2 -1 0 1 2
-2-1
01
2
-12 -10 -8 -6 -4 -2 0
-12
-10
-8-6
-4-2
0
Quantiles of Standard Normal
-2 -1 0 1 2
-10
1
Aver
aged
FH
NO
3(µ
mol
m-2
hr-1
)
Daily Weekly
Aver
aged
FH
NO
3(µ
mol
m-2
hr-1
)
Integrated FHNO3 (µmol m-2 hr-1) Integrated FHNO3 (µmol m-2 hr-1)
Res
idua
l (A-
I) FH
NO
3(µ
mol
m-2
hr-1
)
Res
idua
l (A-
I) FH
NO
3(µ
mol
m-2
hr-1
)
1:1 1:1
Figure 4.4. Upper plots: daily (left) and weekly (right) averaged inferred fluxes vs.
integrated inferred fluxes, with 1:1 line. Lower plots: daily (left) and weekly (right)
residual integrated minus averaged HNO3 flux versus quantiles of the Standard Normal.
Residuals appear near normally-distributed.
118
where V0 = -0.21 cm s-1, a = -0.013 nmol-1 mol cm s-1, and Γ = 0.21 (see Chapter 3 for
associated errors). Equations (4.9) may be considered an upper limit to nighttime NOx
deposition, since it is possible that heterogeneous NO2 hydrolysis may produce gas-phase
HONO at night, regenerating NOx and associated redox chemistry the following morning
upon photolysis.
Using selected nights at Harvard Forest when first order decay of [PAN] and [O3]
were observed, we obtained an estimate of the deposition velocity of PAN assuming that
the primary loss mechanism of both species is deposition to the surface. This assumption
is reasonable for O3, where the nighttime chemistry is well characterized, but would
render the estimate of Vd(PAN) an upper limit if unknown loss reactions were important.
As described in detail in Appendix B, we find Vd(PAN) ≤ 0.8 ± 0.4 cm s-1.
4.3.3. NOy Concentration and Flux Budget
Median diel cycles of the measured concentrations of NO, NO2, HNO3, PAN, and
NOy are plotted in Figure 4.5 for June, July, and August 2000, for Northwest and
Southwest wind sectors. The measured flux of NOy is shown along with the inferred flux
of HNO3, the parameterized NO and NO2 deposition fluxes, and estimated PAN flux.
The latter was obtained by multiplying the estimated nighttime deposition velocity, 0.8
cm s-1, with the median diel PAN concentration. Figure 4.6 follows the same format as
Figure 4.5 for September, October, and November, omitting PAN concentration and flux
because the instrument was not operational after 18 July 2000. Table 4.1 summarizes the
fractional contributions of NOx, HNO3, and PAN to total NOy concentration and flux by
wind sector, day and night, and season, obtained by finding the slope m of the linear
regressions to the hourly data, Ci = m · NOy and Fi = n · FNOy. Standard errors and p-
values for the regressions are given.
119

02
46
80
24
68
NW
0.0
0.4
0.8
1.2
0.0
0.4
0.8
1.2
0 5 10 15 20
-25
-15
-50
SW
0 5 10 15 20
Hour
Summer 2000
NOyNOx+HNO3+PANNOx+HNO3NOx = NO+NO2NO
Flux
(µm
ol m
-2hr
-1)
Con
cent
ratio
n (n
mol
mol
-1)
Frac
tion
of [N
Oy]
FPAN (est.)FNOx (param.)FHNO3 (DDIM)FNOy (e.c.)
Figure 4.5. Summer 2000 median concentrations (upper panels), fractions of NOy (middle
panels), and fluxes (lower panels) of NOy and component species separated by wind
direction (Northwest on the left, Southwest on the right). Vertical lines in the flux panels
show 25th and 75th quantiles of FNOy and FHNO3; negative fluxes represent deposition;
FPAN is an estimate, FNOx is parameterized, FHNO3 is inferred, and FNOy was
measured by eddy covariance. The NOy concentration and flux budgets are largely
closed for northwesterly (unpolluted background) flows, whereas up to 50% of NOy and
FNOy under southwesterly flows are in the form of reactive nitrogen species whose
fluxes are not measured or estimated here.
120

igure 4.6. Same format as Figure 4.5 for September, October, and November 2000.
PAN concentrations were not measured during the fall of 2000.
02
46
80
24
68
NW
0.0
0.4
0.8
1.2
0.0
0.4
0.8
1.2
0 5 10 15 20
-25
-15
-50
SW
0 5 10 15 20
Hour
Fall 2000
Flux
(µm
ol m
-2hr
-1)
Con
cent
ratio
n (n
mol
mol
-1)
Frac
tion
of [N
Oy]
NOyNOx+HNO3NOx = NO+NO2NO
FNOx (param.)FHNO3 (DDIM)FNOy (e.c.)
F
121

Table 4.1a,b. Fractional concentrations and fluxes of reactive nitrogen species at Harvard
Forest, 2000. Linear regressions (Ci=m·[NO]y and Fi=n·FNOy) were computed on hourly
data. PAN is not included in summations due to an insufficient number of overlapping
data hours. Day: 08:00-16:00 Eastern Standard Time. Night: 20:00-04:00 EST.
a) SUMMER NW SW
slope ± std. error (p-value)
day night day night
[NOx]/[NOy] 0.38±0.02 (<1E-4)
0.56±0.02 (<1E-4)
0.39±0.02 (<1E-4)
0.46±0.01 (<1E-4)
[HNO3]/[NOy] 0.35±0.05 (<1E-4)
0.28±0.04 (<1E-4)
0.20±0.02 (<1E-4)
0.19±0.02 (<1E-4)
[PAN]/[NOy] 0.133±0.008
(<1E-4) 0.131±0.005
(<1E-4) 0.138±0.009
(<1E-4) 0.069±0.005
(<1E-4)
([NOx]+[HNO3])/[NOy] 0.61±0.09 (3E-4)
0.8±0.2 (1E-3)
0.70±0.05 (<1E-4)
0.69±0.04 (<1E-4)
FNOx(dep)/FNOy 0.022±0.002
(<1E-4) 0.06±0.01 (<1E-4)
0.027±0.003 (<1E-4)
0.077±0.007 (<1E-4)
FHNO3/FNOy 0.7±0.1 (<1E-4)
0.2±0.2 (0.4)
0.46±0.06 (<1E-4)
0.6±0.1 (<1E-4)
FPAN/FNOy 0.039±0.003
(<1E-4) 0.096±0.006
(<1E-4) 0.047±0.005
(<1E-4) 0.049±0.005
(<1E-4)
(FNOx+FHNO3)/FNOy 0.8±0.1 (<1E-4)
0.2±0.1 (0.3)
0.53±0.04 (<1E-4)
0.5±0.1 (<1E-4)
b) FALL NW SW
slope ± std. error (p-value)
day night day night
[NOx]/[NOy] 0.83±0.05 (<1E-4)
0.65±0.04 (<1E-4)
0.73±0.02 (<1E-4)
0.58±0.03 (<1E-4)
[HNO3]/[NOy] 0.21±0.03 (<1E-4)
0.14±0.03 (<1E-4)
0.09±0.01 (<1E-4)
0.11±0.01 (<1E-4)
([NOx]+[HNO3])/[NOy] 1.03±0.07 (<1E-4)
0.97±0.06 (<1E-4)
0.84±0.02 (<1E-4)
0.70±0.03 (<1E-4)
FNOx(dep)/FNOy 0.08±0.01 (<1E-4)
0.21±0.03 (<1E-4)
0.13±0.03 (<1E-4)
0.18±0.03 (<1E-4)
FHNO3/FNOy 0.7±0.1 (<1E-4)
0.40±0.09 (1E-4)
0.74±0.07 (<1E-4)
0.38±0.07 (<1E-4)
(FNOx+FHNO3)/FNOy 0.9±0.2 (<1E-4)
0.6±0.1 (<1E-4)
0.9±0.1 (<1E-4)
0.6±0.1 (<1E-4)
122

During northwesterly flow conditions, the sum of individual reactive nitrogen
species, Σ[NOy]i = [NO] + [NO2] + [HNO3] + [PAN], was very close to the observed
concentration of NOy. HNO3 accounted for roughly a third of NOy during the day in
summer, a fifth in the fall, with the remainder of the NOy budget consisting largely of
NOx. The summertime concentration of PAN was on the order of 13% of [NOy]. During
northwesterly flows, NOy fluxes were dominated by HNO3 deposition fluxes in both
seasons.
During southwesterly flow conditions, a larger fraction of the NOy concentration
and flux was in the form of unmeasured species. HNO3 and NOx contributed less than
70% of the total NOy concentration, with summertime PAN accounting for 7 to 14%.
HNO3 flux was between 38 and 74% of FNOy, and neither FNOx nor FPAN accounted
for the difference.
4.4. Discussion
Accurate determination of the concentration of HNO3 depends critically on the
transmission efficiency through the inlet with varying temperature and humidity.
Because southwesterly winds at Harvard Forest tend to transport warmer, moister air than
northwesterlies [Moody et al., 1998], it is important to look closely at possible instrument
artifacts, especially of HNO3 transmission through the inlet, associated with these
differences. A complete description of TDLAS materials testing and response of the
fused silica and coated pyrex inlet at a typical ambient temperature and humidity is
included in Chapter 2. Neuman et al. [1999] noted a dramatic difference between the
transmission of HNO3 through Teflon fluoropolymer (“PFA”) tubing in dry and
123
humidified synthetic air. Ambient conditions at Harvard Forest rarely approach “dry”
laboratory conditions; during 90% of the summer 2000 measurement hours, relative
humidity was above 55%, and the minimum observed relative humidity during the
summer was 30.5%. In order to account for both temperature and relative humidity
differences between the dominant wind sectors, we used the H2O vapor pressure to
investigate a possible inlet response effect in the data. Mean ± standard deviation H2O
vapor pressure for the Northwest sector was 1.5 ± 0.4 KPa, and 1.9 ± 0.4 KPa for the
Southwest sector.
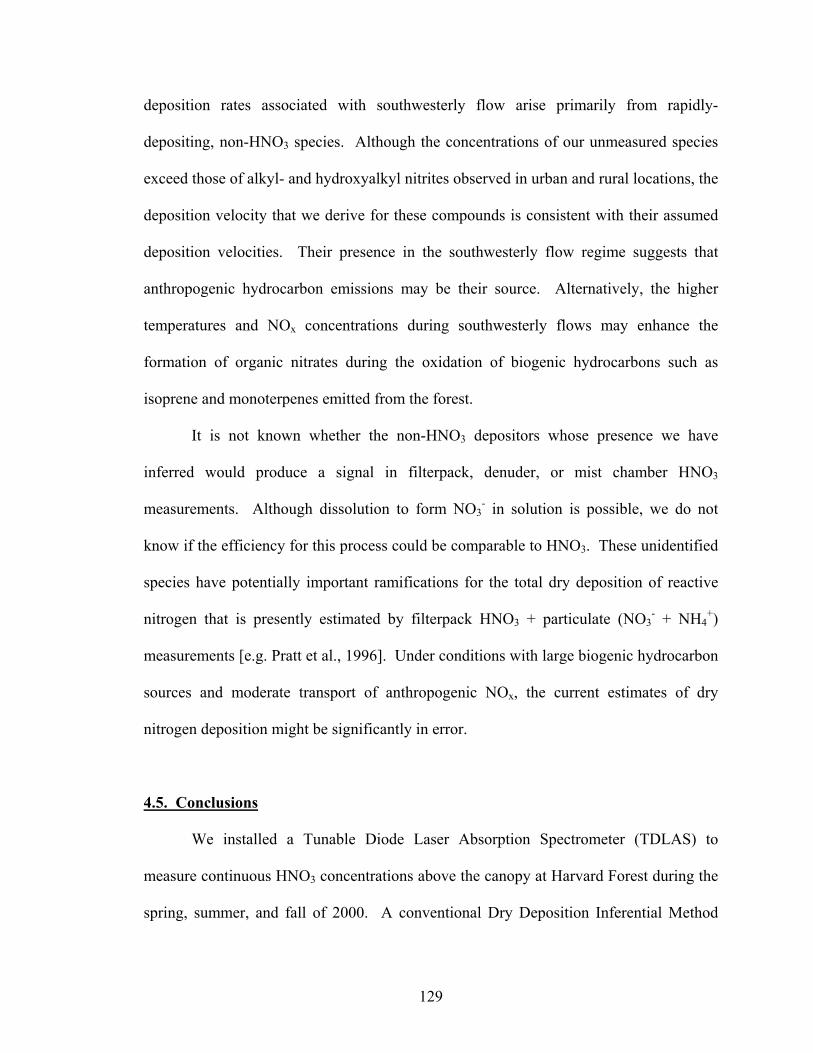
According to the HNO3 and NOy measurements presented in Section (4.3),
F(HNO3)/F(NOy) is smaller for southwesterly conditions where water vapor pressure is
higher. Inferred deposition velocities (from DDIM) for the two wind sectors are nearly
identical. In Figure 4.7, summer F(HNO3)/F(NOy) is shown as a function of H2O vapor
pressure for both wind sectors. Although the fractional HNO3 flux drops slightly at the
highest H2O vapor pressures observed under northwesterly conditions, it is consistently
lower under southwesterly conditions across all H2O vapor pressures. Note that the range
of observed vapor pressures overlaps considerably between the wind sectors. Although
we cannot rule out a small water vapor effect on HNO3 transmission in the TDLAS
instrument, the difference in F(HNO3)/F(NOy) between the wind sectors cannot be
entirely attributed to such an effect.
Catalytic NOy converters have been implicated in a number of cases where the
sum of individual reactive nitrogen species was substantially less than the observed
concentration of NOy. However, it is unlikely that this is the cause of the southwest
sector discrepancy observed at Harvard Forest. Kliner et al. [1997] found that conversion
124

01
23
40
12
34
0.0 0.5 1.0 1.5 2.0 2.5
01
23
4
0.0 0.5 1.0 1.5 2.0 2.5
01
23
4
FHN
O3/F
NO
yFH
NO
3/FN
Oy
H2O Vapor Pressure (KPa)
NW
SW
Figure 4.7. Fraction of HNO3 flux (inferred) to NOy flux (eddy covariance) as a function
of H2O vapor pressure for the northwest (upper) and southwest (lower) wind sectors at
Harvard Forest, summer 2000. Dots are individual hourly values, and squares with
vertical bars are means and standard deviations of the fractional flux binned by quantiles
of H2O vapor pressure.
125
of reduced nitrogen species HCN, CH3CN, and NH3 on a hot 24 k Au catalyst in the
presence of H2 (as used at Harvard Forest) was exacerbated after cleaning the catalyst and
under very low humidity conditions. The Harvard Forest catalyst is well-aged, and as
noted above, ambient conditions are never very dry. In addition, NH3 concentrations
during the summer at Harvard Forest are only on the order of several hundred parts per
trillion by volume ([NH3] ≈ 0.2 to 0.4 nmol mol-1), independent of wind direction [Lefer
et al., 1999], far too small to influence these results even if a portion of the NH3 were
oxidized to NO in the catalyst.
Particulate NO3- also contributes to the total NOy measurement, but was not
independently monitored during the summer of 2000. Lefer et al. [2001] found that
summer median values of aerosol nitrate between 1991 and 1995 were 4.92 nmol m-3 (≈
0.1 nmol mol-1) for the northwest wind sector, and 9.41 nmol m-3 (≈ 0.2 nmol
mol-1) for the southwest. The concentrations of particulate NO3- appear too low to
account for the observed southwest sector discrepancy.
Munger et al. [1996] defined the deposition velocity of (NOy-NOx), Vd(NOy-NOx)
= FNOy/([NOy]-[NOx]) and found that Vd(NOy-NOx) varied little between Northwest and
Southwest wind sectors at Harvard Forest, much like the inferred HNO3 deposition
velocities presented here. The species composing NOy-NOx were not measured in the
earlier work, so the fraction of rapidly-depositing species in NOy-NOx was not known.
Such efficient depositors could include HNO3 and organic hydrocarbon oxidation
products such as alkyl- and hydroxyalkyl nitrates. Munger et al. [1998] estimated the
production rates of hydroxyalkyl nitrates from biogenic emissions of isoprene and
126

monoterpenes at the site, and found that they could account for 25% of the observed NOy
deposition during the summer.
Alkyl nitrates, products of alkane oxidation, and hydroxyalkyl nitrates, products
of alkene oxidation, have been observed in both rural and urban air masses [Rosen et al.,
2001; Ostling et al., 2001; O’Brien et al., 1997; Shepson et al., 1993; O’Brien et al.,
1995]. The alkyl nitrates undergo dry deposition, and the hydroxyalkyl nitrates undergo
wet and dry deposition due to high Henry’s law coefficients [Shepson et al., 1996; Treves
et al., 2000]. The observed concentrations of these species at urban and rural sites have
been no larger than 3% of total NOy [Ostling et al., 2001; O’Brien et al., 1997; Shepson
et al., 1993; O’Brien et al., 1995], or 10-20% of (NOy-NOx) [Rosen et al., 2001].
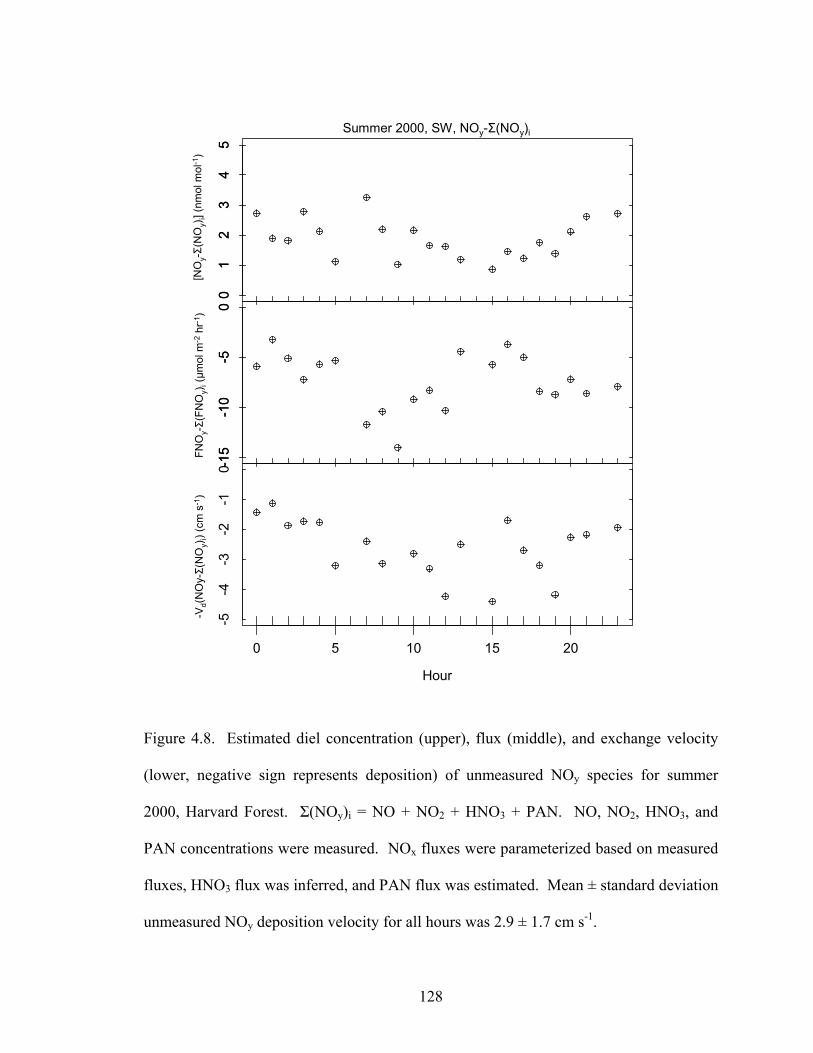
As shown in Figure 4.8 for southwesterly flows during the summer of 2000, the
unmeasured fraction of [NOy], NOy-Σ(NOy)i where Σ(NOy)i = [NO] + [NO2] + [HNO3] +
[PAN], was between 1 and 3 nmol mol-1, or approximately 25% of [NOy]. The flux of
unmeasured NOy, FNOy-Σ(FNOy)i where Σ(FNOy)i = FNO + FNO2 + FHNO3 + FPAN, is
also shown in Figure 4.8. Deposition fluxes of NO and NO2 were derived from the
parameterization presented in Chapter 3, HNO3 flux was inferred as described above, and
the flux of PAN was estimated, also described above. The deposition velocity of
unmeasured NOy species, (FNOy-Σ(FNOy)i)/ (NOy-Σ(NOy)i) was approximately 3 cm s-1,
of the same order as HNO3 deposition velocities. Hydroxyalkyl nitrates are generally
assumed to deposit like HNO3, although we know of no independent determinations of
their deposition rates [e.g. Liang et al., 1998].
Overall, we find that HNO3 concentration and flux are not substantially different
between the clean and polluted wind sectors at Harvard Forest. The higher NOy
127
[NO
y-Σ(N
Oy) i
](nm
ol m
ol-1
)FN
Oy-Σ
(FN
Oy) i
(µm
ol m
-2hr
-1)
-Vd(
NO
y-Σ(
NO
y) i) (
cm s
-1)
Summer 2000, SW, NOy-Σ(NOy)i
01
23
45
01
23
45
-15
-10
-50
-15
-10
-50
0 5 10 15 20
-5-4
-3-2
-10
Hour
Figure 4.8. Estimated diel concentration (upper), flux (middle), and exchange velocity
(lower, negative sign represents deposition) of unmeasured NOy species for summer
2000, Harvard Forest. Σ(NOy)i = NO + NO2 + HNO3 + PAN. NO, NO2, HNO3, and
PAN concentrations were measured. NOx fluxes were parameterized based on measured
fluxes, HNO3 flux was inferred, and PAN flux was estimated. Mean ± standard deviation
unmeasured NOy deposition velocity for all hours was 2.9 ± 1.7 cm s-1.
128
deposition rates associated with southwesterly flow arise primarily from rapidly-
depositing, non-HNO3 species. Although the concentrations of our unmeasured species
exceed those of alkyl- and hydroxyalkyl nitrites observed in urban and rural locations, the
deposition velocity that we derive for these compounds is consistent with their assumed
deposition velocities. Their presence in the southwesterly flow regime suggests that
anthropogenic hydrocarbon emissions may be their source. Alternatively, the higher
temperatures and NOx concentrations during southwesterly flows may enhance the
formation of organic nitrates during the oxidation of biogenic hydrocarbons such as
isoprene and monoterpenes emitted from the forest.
It is not known whether the non-HNO3 depositors whose presence we have
inferred would produce a signal in filterpack, denuder, or mist chamber HNO3
measurements. Although dissolution to form NO3- in solution is possible, we do not
know if the efficiency for this process could be comparable to HNO3. These unidentified
species have potentially important ramifications for the total dry deposition of reactive
nitrogen that is presently estimated by filterpack HNO3 + particulate (NO3- + NH4
+)
measurements [e.g. Pratt et al., 1996]. Under conditions with large biogenic hydrocarbon
sources and moderate transport of anthropogenic NOx, the current estimates of dry
nitrogen deposition might be significantly in error.
4.5. Conclusions
We installed a Tunable Diode Laser Absorption Spectrometer (TDLAS) to
measure continuous HNO3 concentrations above the canopy at Harvard Forest during the
spring, summer, and fall of 2000. A conventional Dry Deposition Inferential Method
129

(DDIM) was employed to estimate the hourly deposition flux of HNO3. The diurnal
variation of HNO3 concentration is weak, and thus DDIM applied in a weekly average
sense to our hourly data, analogous to the practice at nitrogen deposition network sites,
introduced noise but not a persistent bias. Using new and ongoing NOy, NOx, and PAN
measurements at the site, we present speciated NOy concentration and flux budgets for
clean (northwesterly) and polluted (southwesterly) conditions during summer and fall.
HNO3 concentrations and fluxes differed little between the two flow regimes.
The concentration of PAN was low (<15% of NOy) and, with its small estimated
deposition velocity (0.8 ± 0.4 cm s-1), PAN contributed little to the flux of NOy.
Parameterized NOx deposition, based on eddy covariance NO and NO2 measurements at
the site [Chapter 3], showed that NOx played only a minor role in total NOy deposition.
For the clean (NW) sector, HNO3 accounted for nearly all of the NOy flux, and the
concentration budget for the northwesterly flow conditions was essentially closed using
data for NOx, HNO3, and PAN. For the more polluted, warmer, and moister southwest
sector, as much as 50% of the NOy concentrations and fluxes were unaccounted by the
measured species. The differences could not be explained by water vapor effects on the
HNO3 concentration measurement, NH3 interference in the NOy measurement, or
particulate NO3-. We believe that the deficit in NOy concentration corresponds to
unmeasured depositing species, and we infer associated deposition velocities similar to
HNO3, approximately 3 cm s-1. The unidentified compound(s) could play an important
role in removing reactive nitrogen from the troposphere, contribute substantially to
nitrogen deposition, and affect the nutrient and toxicity loading of vegetation locally
and/or regionally, depending on the exact nature of the substances. Identifying these
130
species and determining whether current nitrogen deposition monitoring techniques
detect them should be a priority.
References
Aneja, V. P., D.-S. Kim, M. Das, and B. E. Hartsell, Measurements and analysis of reactive nitrogen species in the rural troposphere of southeast United States: Southern Oxidant Study Site SONIA, Atmos. Environ 30, 649-659, 1996.
Bradshaw, J., S. Sandholm, R. Talbot, An update on reactive odd-nitrogen measurements made during recent NASA Global Tropospheric Experiment programs, J. Geophys. Res. 103, 19129-19148, 1998.
Bradshaw, J., D. Davis, G. Grodzinsky, S. Smyth, R. Newell, S. Sandholm, S. Liu, Observed distributions of nitrogen oxides in the remote free troposphere from the NASA Global Tropopsheric Experiment Programs, Reviews of Geophysics 38, 61-116, 2000.
Brook, J. R., F. Di-Giovanni, S. Cakmak, T. P. Meyers, Estimation of dry deposition velocity using inferential models and site-specific meteorology – uncertainty due to siting of meteorological towers, Atmos. Environ. 31, 3911-3919, 1997.
Clarke, J. F., E. S. Edgerton, B. E. Martin, Dry deposition calculations for the clean air status and trends network, Atmos. Environ. 31, 3667-3678, 1997.
Day, D. A., P. J. Wooldridge, M. B. Dillon, J. A. Thornton, R. C. Cohen, A thermal dissociation laser-induced fluorescence instrument for in situ detection of NO2, peroxy nitroates, alkyl nitrates, and HNO3, J. Geophys. Res. 107, 10.1029/2001JD000779, 2002.
DeMore, W. B., S. P. Sander, D. M. Golden, R. F. Hampson, M. J. Kurylo, C. J. Howard, A. R. Ravishankara, C. E. Kolb, M. J. Molina, Chemical kinetics and pohotochemical data for use in stratospheric modeling, evaluation 11, JPL publication 97-4, 1997.
Fehsenfeld, F. C., L. G. Huey, D. T. Sueper, R. B. Norton, E. J. Williams, Ground-based intercomparison of nitric acid measurement techniques, J. Geophys. Res. 103, 3343-3353, 1998.
Furutani, H. and H. Akimoto, Development and characterization of a fast measurement system for gas-phase nitric acid with a chemical ionization mass spectrometer in the marine boundary layer, J. Geophys. Res. 107, 10.1029/2000JD000269, 2002.
Harrison, R. M., J. L. Grenfell, S. Yamulki, K. C. Clemitshaw, S. A. Penkett, J. N. Cape, G. G. McFadyen, Budget of NOy species measured at a coastal site, Atmos. Environ. 33, 4255-4272, 1999.
131

Hanson, P. and S. E. Lindberg, Dry deposition of reactive nitrogen compounds: a review of leaf, canopy, and non-foliar measurements, Atmos. Environ. 25A, 1615-1634, 1991.
Hicks, B. B., D. D. Baldocchi, T. P. Meyers, R. P. Hosker, Jr., D. R. Matt, A preliminary multiple resistance routein for deriving dry deposition velocities from measured quantities, Water, Air, and Soil Pollution 36, 311-330, 1987.
Horii, C. V., M. Zahniser, D. Nelson, J. B. McManus, S. C. Wofsy, Nitric Acid and Nitrogen Dioxide Flux Measurements: a New Application of Tunable Diode Laser Absorption Spectroscopy, Proc SPIE 3758, 152-161, 1999.
Hosker, R. P. Jr., and S. E. Lindberg, Review: Atmospheric deposition and plant assimilation of gases and particles, Atmos. Environ. 16, 889-910, 1982.
Huey, L. G., E. J. Dunlea, E. R. Lovejoy, D. R. Hanson, R. B. Norton, F. C. Fehsenfeld, C. J. Howard, Fast time response measurements of HNO3 in air with a chemical ionization mass spectrometer, J. Geophys. Res. 103, 3355-3360, 1998.
Jacob, D. J., Heterogeneous chemistry and tropospheric ozone, Atmos. Environ. 34, 2131-2159, 2000.
Janson, R. and L. Granat, A foliar rinse study of the dry deposition of nitric acid to a coniferous forest, Agricultural and Forest Meteorology 98-99, 683-696, 1999.
Kliner, D. A. V., B. C. Daube, J. D. Burley, S. C. Wofsy, Laboratory investigation of the catalytic reduction technique for measurement of atmospheric NOy, J. Geophys. Res. 102, 10759-10776, 1997.
Lefer, B. L., The chemistry and dry deposition of atmospheric nitrogen at a rural site in the northeastern United States, Ph.D. thesis, 119 pp., Univ. of N. H., Durham, Dec. 1997.
Lefer, B. L., and R.W. Talbot, Summertime measurements of aerosol nitrate and ammonium at a northeastern U.S. site, J. Geophys. Res. 106, 20365-20378, 2001.
Lefer, B. L., and R. W. Talbot, Nitric acid and ammonia at a rural northeastern U.S. site, J. Geophys. Res. 104, 1645-1661, 1999.
Liang, J., L. W. Horowitz, D. J. Jacob, Y. Want, A. M. Fiore, J. A. Logan, G. M. Gardner, J. W. Munger, Seasonal budgets of reactivenitrogen species and ozone over the United States, and export fluxes to the global atmosphere, J. Geophys. Res. 103, 13425-13450, 1998.
Matt, D. R. and T. P. Meyers, On the use of the interential technique to estimate dry deposition of SO2, Atmos. Environ. 27A, 493-501, 1993.
132

Mauldin, R. L. III, D. J. Tanner, F. L. Eisele, A new chemical ionization mass spectrometer technique for the fast measurement of gas phase nitric acid in the atmosphere, J. Geophys. Res. 103, 3361-3367, 1998.
McFadyen, G. G., and J. Neil Cape, Physical and chemical influences on PAN concentrations at a rural site, Atmos. Environ. 33, 2929-2940, 1999.
Miller, C. E., J. I. Lynton, D. M. Keevil, J. S. Francisco, Dissociation Pathways of Peroxyacetyl Nitrate (PAN), J. Phys. Chem. A 103, 11451-11459, 1999.
Miller, T. M., J. O. Ballenthin, R. F. Meads, D. E. Hunton, W. F. Thorn, A. A. Viggiano, Y. Kondo, M. Koiki, Y. Zhao, Chemical ionization mass spectrometer technique for the measurement of HNO3 in air traffic corridors in the upper troposphere during the SONEX campaign, J. Geophys. Res 105, 3701-3707, 2000.
Meyers, T. P., B. J. Huebert, B. B. Hicks, HNO3 Deposition to a Deciduous Forest, Bounary-Layer Meteorology 49, 395-410, 1989.
Meyers, T. P., P. Kinkelstein, J. Clarke, T. G. Ellestad, P. F. Sims, A multilayer model for inferring dry deposition using standard meteorological measurements, J. Geophys. Res. 103, 22645-22661, 1998.
Moise, T. W. Denzer, Y. Rudich, Direct Kinetics Study of the Reaction of Peroxyacetyl Radical with No between 218 and 370 K, J. Phys. Chem. A. 103, 6766-6771, 1999.
Moody, J. L., J. W. Munger, A. H. Goldstein, D. J. Jacob, and S. C. Wofsy, Harvard Forest regional-scale air mass composition by Patterns in Atmospheric Transport History (PATH), J. Geophys. Res. 103, 13181-13194, 1998.
Munger, J. W., S. C Wofsy, P. S. Bakwin, S-M. Fan, M. L. Goulden, B. C. Daube, and A. H. Goldstein, Atmospheric deposition of reactive nitrogen oxides and ozone in a temperate deciduous forest and a subarctic woodland: 1. Measurements and mechanisms, J. Geophys. Res. 101, 12639-12657, 1996.
Munger, J. W., S-M. Fan, P. S. Bakwin, M. L. Goulden, A. H. Goltstein, A. S. Colman, and S. C. Wofsy, Regional budgets for nitrogen oxides from continental sources: Variations of rates for oxidation and deposition with season and distance from source regions, J. Geophys. Res. 103, 8355-8368, 1998.
Neuman, J. A., L. G. Huey, T. B. Ryerson, D. W. Fahey, Study of Inlet Materials for Sampling Atmospheric Nitric Acid, Environ. Sci. Technol. 33, 1133-1136, 1999.
O’Brien, J. M., P. B. Shepson, K. Murhuramu, C. Hao, H. Niki, D. R. Hastie, Measurements of alkyl and multifunctional organic nitrates at a rural site in Ontario, J. Geophys. Res. 100, 22795-22804, 1995.
O’Brien, J. M., P. B. Shepson, Q. Wu, T. Biesenthal, J. W. Bottenheim, H. A. Wiebe, K. G. Anlauf, P. Brickell, Production and distribution of organic nitrates, and their
133

relationship to carbonyl compounds in an urban environment, Atmos. Environ. 31, 2059-2069, 1997.
Ostling, K., B. Kelly, S. Bird, S. Bertman, M. Pippin, T. Thornberr, M. A. Carroll, Fast-turnaround alkyl nitrate measurements during the PROPHET 1998 summer intensive, J. Geophys. Res. 106, 24439-24449, 2001.
Parrish, D. D., M. P. Buhr,, M. Trainer, R. B. Norteon, J. P. Shimshock, F. C. Fehsenfeld et al., The total reactive oxidized nitrogen levels and the partitioning between the individual species at six rural sites in eastern North America, J. Geophys. Res. 98, 2927-2939, 1993.
Pratt, G. C., E. J. Orr, D. C. Bock, R. L. Strassman, D. W. Fundine, C. J. Twaroski, J. D. Thornton, T. P. Meyers, Estimation of Dry Deposition of Inorganics Using Filter Pack Data and Inferred Deposition Velocity, Environ. Sci. Techno. 30, 2168-2177, 1996.
Rosen, R. S., E. Wood, P. J. Wooldridge, J. A. Thornton, R. C. Cohen, E. J. Williams, F. C. Fehsenfeld, J. M. Roberts, S. R. Hall, R. E. Shetter, M. Martinez, H. Harder, W. H. Brune, The Chemistry of ΣANs, ΣPANs, HNO3, and O3 in the Houston Urban Plume, EOS Trans. AGU, 82, Fall Meeting Suppl., A51F-0118, 2001
Rosman, K., M. Shimmo, A. Karlsson, H.-C. Hansson, P. Keronen, A. Allen, G. Hoenninger, Laboratory and field investigations of a new and simple design for the parallel plate denuder, Atmos. Environ. 35, 5301-5310, 2001.
Schrimpf, W., K. Lienaerts, K. P. Müller, J. Rudolph, R. Neubert, W. Schüßler, I. Levin, Dry deposition of peroxyacetyl nitrate (PAN): Determination of its deposition velocity at night from measurements of the atmospheric PAN and 222Radon concentration gradient, Geophys. Res. Lett. 23, 3599-3602, 1996.
Shepson, P. B., J. W. Bottenheim, D. R. Hastie, A. Venkatram, Determination of the relative ozone and PAN deposition velocities at night, Geophys. Res. Lett. 19, 1121-1124, 1992.
Shepson, P. B., K. G. Anlauf, J. W. Bottenheim, H. A. Wiebe, N. Gao, K. Muthuramu, G. I. Mackay, Alkyl nitrates and their contribution to reactive nitrogen at a rural site in Ontario, Atmos. Environ. 27A, 749-757, 1993.
Shepson, P. B., E. Mackay, K. Muthuramu, Henry’s Law Constants and Removal Processes for Several Atmospheric β-Hydroxy Alkyl Nitrates, Environ. Sci. Technol. 30, 3618-3623, 1996.
Sievering, H. T. Kelly, G. McConville, C. Seibold, A. Turnipseed, Nitric acid dry deposition to conifer forests: Niwot Ridge spruce-fir-pine study, Atmos. Environ. 35, 3851-3859, 2001.
134

135
Talbot, R. W., J. E. Dibb, B. L. Lefer, E. M. Scheuer, J. D. Bradshaw, S. T. Sandholm, S. Smyth, D. R. Blake, N. J. Blake, G. W. Sachse, J. E. Collins, G. L. Gregory, Large-scale distributions of tropospheric nitric, formic, and acetic acids over the western pacific basin during wintertime, J. Geophys. Res. 102, 28303-28313, 1997.
Thornberry, T. M. A. Carroll, G. J. Keeler, S. Sillman, S. B. Bertman, M. R. Pippin K. Ostling, J. W. Grossenbacher, P. B. Shepson, O. R. Cooper, J. L. Moody, W. R. Stockwell, Observations of reactive oxidized nitrogen and speciation of NOy during the PROPHET summer 1998 intensive, J. Geophys. Res. 106, 24359-24386, 2001.
Treves, K., L. Shragina, Y. Rudich, Henry’s Law Constants of some β-, γ-, and δ-Hydroxy Alkyl Nitrates of Atmospheric Interest, Environ. Sci. Technol. 34, 1197-1203, 2000.
U.S. Environmental Protection Agency, Atmospheric Deposition of Sulfur and Nitrogen Compounds, in National Air Quality and Emission Trends Report, 1999, EPS454/R-01-004, Office of Air Quality Planning and Standards, Research Triangle Park, NC, 2001.
Warneck, P. and T. Zerbach, Synthesis of peroxyacetyl nitrate in air by acetone photolysis, Environ. Sci. Technol. 26, 74-79, 1992.
Wesely, M. L. and B. B. Hicks, Some Factors that Affect the Deposition Rates of Sulfur Dioxide and Similar Gases on Vegetation, Journal of the Air Pollution Control Association 27, 1110-1116, 1977.
Wesely, M. L., Parameterization of surface resistances to gaseous dry deposition in regional-scale numerical models, Atmos. Environ. 23, 1293-1304, 1989.
Wesley, M. L., and B. B. Hicks, A review of the current status of knowledge on dry deposition, Atmos. Environ. 34, 2261-2282, 2000.