Chapter 3 System Analysis Event Tree Analysis › Literature › fmcea › eta.pdf · Tru e Tru e...
28
Marvin Rausand, October 7, 2005 System Reliability Theory (2nd ed), Wiley, 2004 – 1 / 28 Chapter 3 System Analysis Event Tree Analysis Marvin Rausand Department of Production and Quality Engineering Norwegian University of Science and Technology [email protected]
Transcript of Chapter 3 System Analysis Event Tree Analysis › Literature › fmcea › eta.pdf · Tru e Tru e...
Marvin Rausand, October 7, 2005 System Reliability Theory (2nd ed), Wiley, 2004 – 1 / 28
Chapter 3
System Analysis
Event Tree Analysis
Marvin Rausand
Department of Production and Quality EngineeringNorwegian University of Science and Technology
IntroductionConsequencespectrum
Barriers
What is ...?
Example
Applications
Construction
Example:Separator
Quantitativeanalysis
Conclusions
Marvin Rausand, October 7, 2005 System Reliability Theory (2nd ed), Wiley, 2004 – 2 / 28
Introduction

Consequence spectrum
IntroductionConsequencespectrum
Barriers
What is ...?
Example
Applications
Construction
Example:Separator
Quantitativeanalysis
Conclusions
Marvin Rausand, October 7, 2005 System Reliability Theory (2nd ed), Wiley, 2004 – 3 / 28
An accidental event is defined as the first significant deviationfrom a normal situation that may lead to unwanted consequences(e.g., gas leak, falling object, start of fire)
An accidental event may lead to many different consequences.The potential consequences may be illustrated by a consequence
spectrum
Accidental
event
C1
C2
C3
Ck
Barriers
IntroductionConsequencespectrum
Barriers
What is ...?
Example
Applications
Construction
Example:Separator
Quantitativeanalysis
Conclusions
Marvin Rausand, October 7, 2005 System Reliability Theory (2nd ed), Wiley, 2004 – 4 / 28
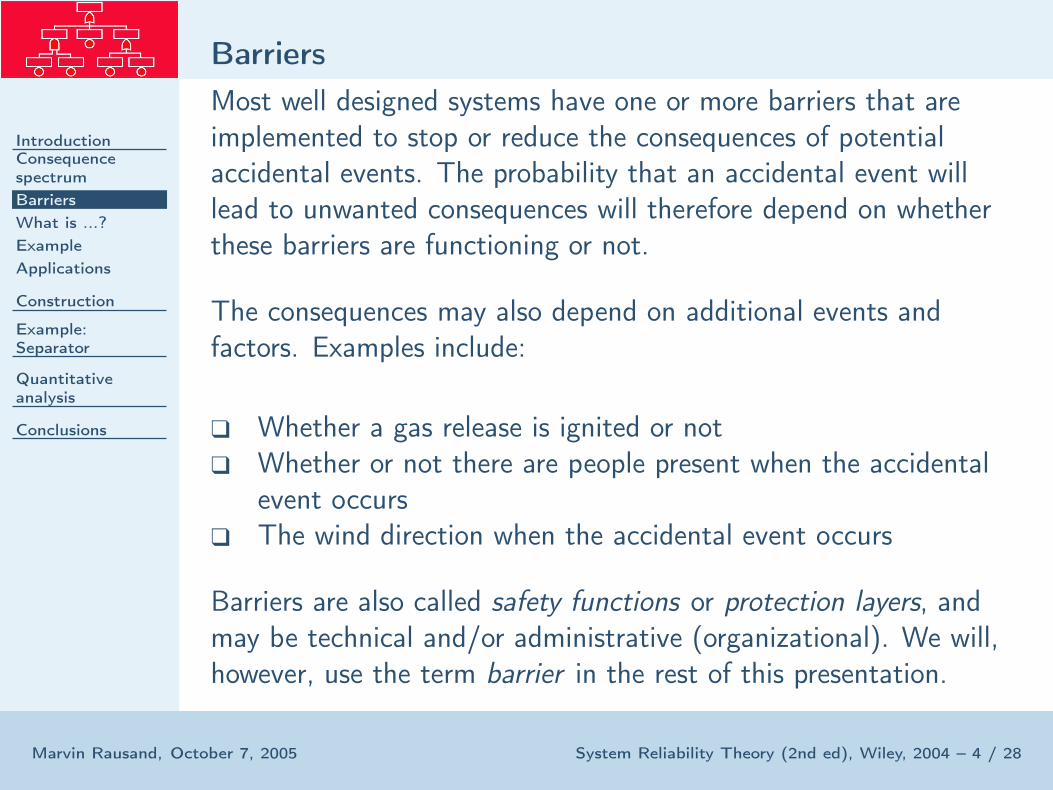
Most well designed systems have one or more barriers that areimplemented to stop or reduce the consequences of potentialaccidental events. The probability that an accidental event willlead to unwanted consequences will therefore depend on whetherthese barriers are functioning or not.
The consequences may also depend on additional events andfactors. Examples include:
❑ Whether a gas release is ignited or not❑ Whether or not there are people present when the accidental
event occurs❑ The wind direction when the accidental event occurs
Barriers are also called safety functions or protection layers, andmay be technical and/or administrative (organizational). We will,however, use the term barrier in the rest of this presentation.
What is event tree analysis?
IntroductionConsequencespectrum
Barriers
What is ...?
Example
Applications
Construction
Example:Separator
Quantitativeanalysis
Conclusions
Marvin Rausand, October 7, 2005 System Reliability Theory (2nd ed), Wiley, 2004 – 5 / 28
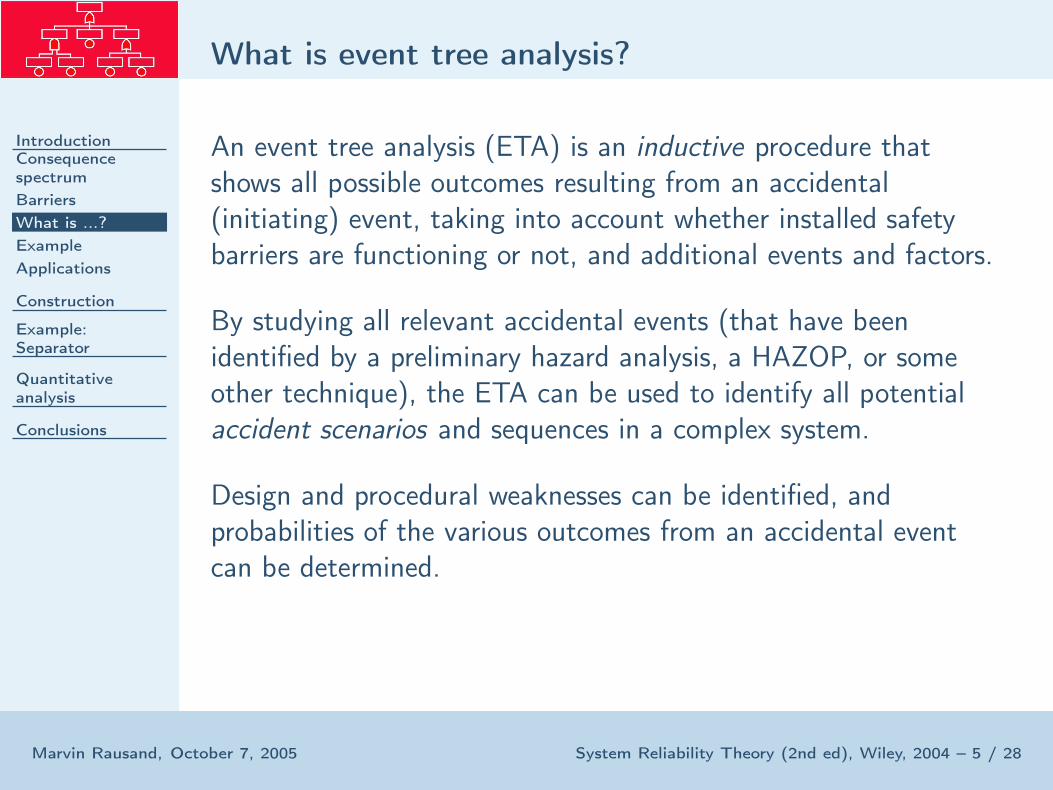
An event tree analysis (ETA) is an inductive procedure thatshows all possible outcomes resulting from an accidental(initiating) event, taking into account whether installed safetybarriers are functioning or not, and additional events and factors.
By studying all relevant accidental events (that have beenidentified by a preliminary hazard analysis, a HAZOP, or someother technique), the ETA can be used to identify all potentialaccident scenarios and sequences in a complex system.
Design and procedural weaknesses can be identified, andprobabilities of the various outcomes from an accidental eventcan be determined.
Example
IntroductionConsequencespectrum
Barriers
What is ...?
Example
Applications
Construction
Example:Separator
Quantitativeanalysis
Conclusions
Marvin Rausand, October 7, 2005 System Reliability Theory (2nd ed), Wiley, 2004 – 6 / 28
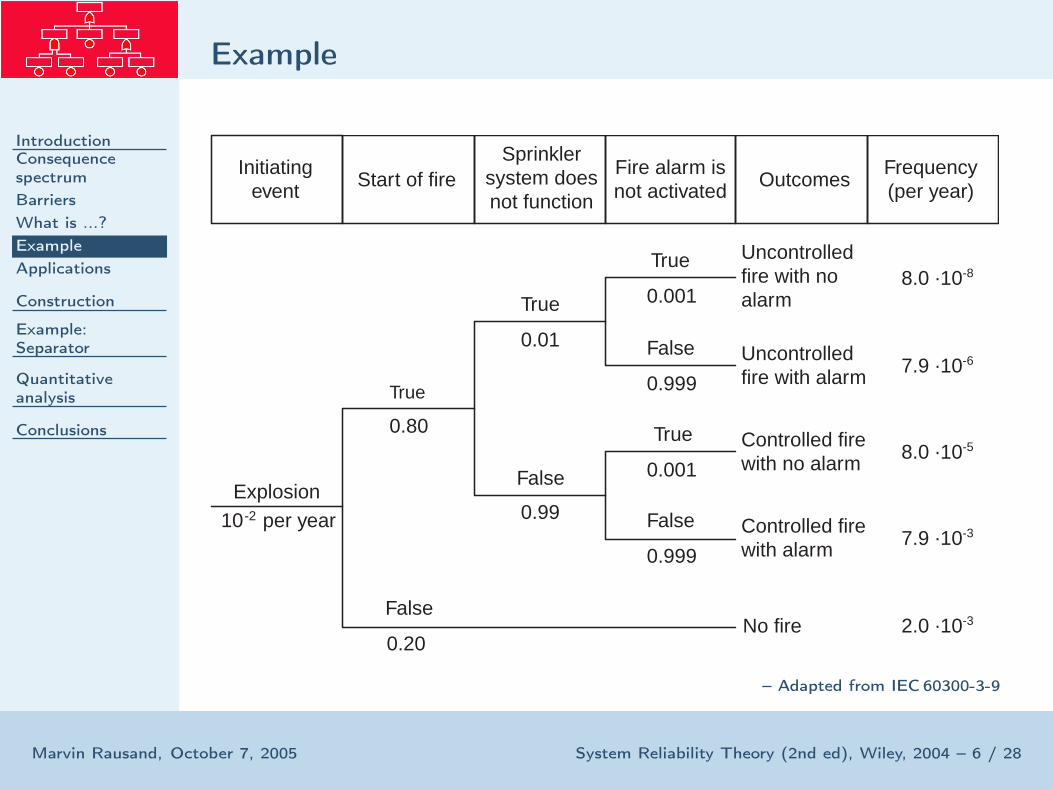
Initiatingevent Start of fire
Sprinklersystem doesnot function
Fire alarm isnot activated Outcomes
Frequency(per year)
Controlled firewith no alarm
Uncontrolledfire with alarm
Uncontrolledfire with noalarm
No fire
7.9 .10-6
8.0 .10-5
8.0 .10-8
2.0 .10-3
Explosion10-2 per year
True
0.80
True
True
True
False
0.20
0.01
False
0.99
False
False
0.999
0.999
0.001
0.001
Controlled firewith alarm 7.9 .10-3
– Adapted from IEC 60300-3-9
Applications
IntroductionConsequencespectrum
Barriers
What is ...?
Example
Applications
Construction
Example:Separator
Quantitativeanalysis
Conclusions
Marvin Rausand, October 7, 2005 System Reliability Theory (2nd ed), Wiley, 2004 – 7 / 28
❑ Risk analysis of technological systems❑ Identification of improvements in protection systems and
other safety functions
Introduction
Construction
Main Steps
Accidental event
Barriers
Event sequence
Outcomealternatives
End outcomes
Example:Separator
Quantitativeanalysis
Conclusions
Marvin Rausand, October 7, 2005 System Reliability Theory (2nd ed), Wiley, 2004 – 8 / 28
Event tree construction
Main Steps
Introduction
Construction
Main Steps
Accidental event
Barriers
Event sequence
Outcomealternatives
End outcomes
Example:Separator
Quantitativeanalysis
Conclusions
Marvin Rausand, October 7, 2005 System Reliability Theory (2nd ed), Wiley, 2004 – 9 / 28
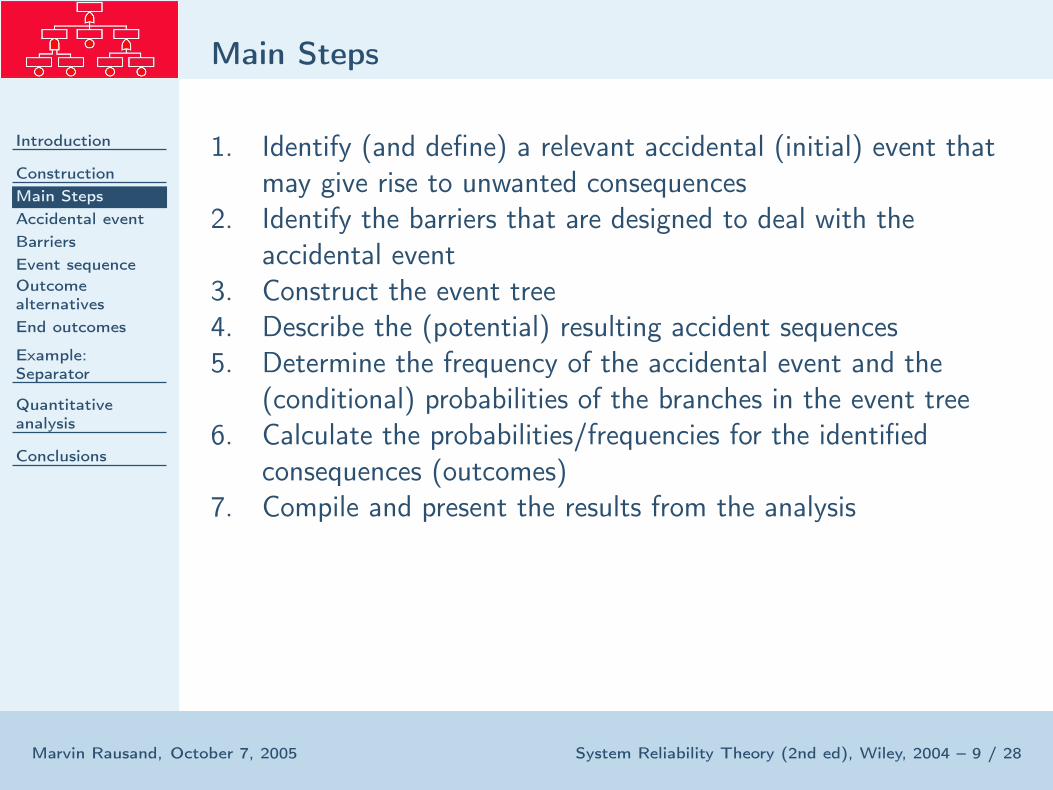
1. Identify (and define) a relevant accidental (initial) event thatmay give rise to unwanted consequences
2. Identify the barriers that are designed to deal with theaccidental event
3. Construct the event tree4. Describe the (potential) resulting accident sequences5. Determine the frequency of the accidental event and the
(conditional) probabilities of the branches in the event tree6. Calculate the probabilities/frequencies for the identified
consequences (outcomes)7. Compile and present the results from the analysis
Accidental event
Introduction
Construction
Main Steps
Accidental event
Barriers
Event sequence
Outcomealternatives
End outcomes
Example:Separator
Quantitativeanalysis
Conclusions
Marvin Rausand, October 7, 2005 System Reliability Theory (2nd ed), Wiley, 2004 – 10 / 28
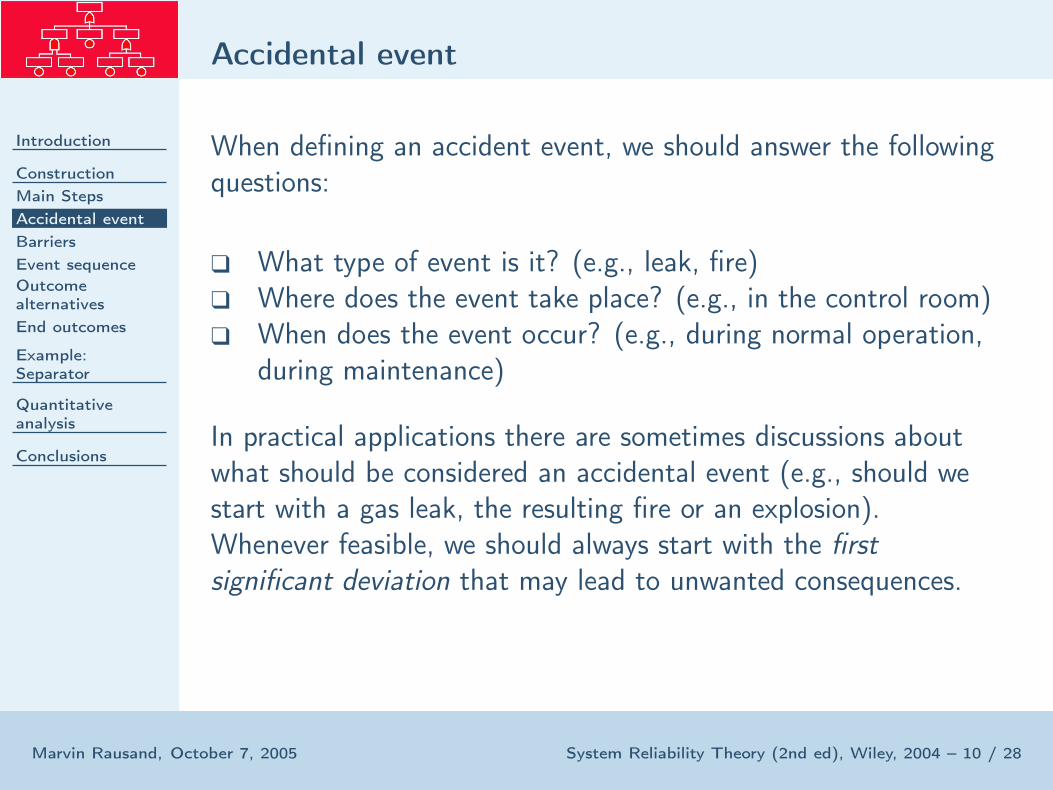
When defining an accident event, we should answer the followingquestions:
❑ What type of event is it? (e.g., leak, fire)❑ Where does the event take place? (e.g., in the control room)❑ When does the event occur? (e.g., during normal operation,
during maintenance)
In practical applications there are sometimes discussions aboutwhat should be considered an accidental event (e.g., should westart with a gas leak, the resulting fire or an explosion).Whenever feasible, we should always start with the first
significant deviation that may lead to unwanted consequences.
Accidental event
Introduction
Construction
Main Steps
Accidental event
Barriers
Event sequence
Outcomealternatives
End outcomes
Example:Separator
Quantitativeanalysis
Conclusions
Marvin Rausand, October 7, 2005 System Reliability Theory (2nd ed), Wiley, 2004 – 11 / 28
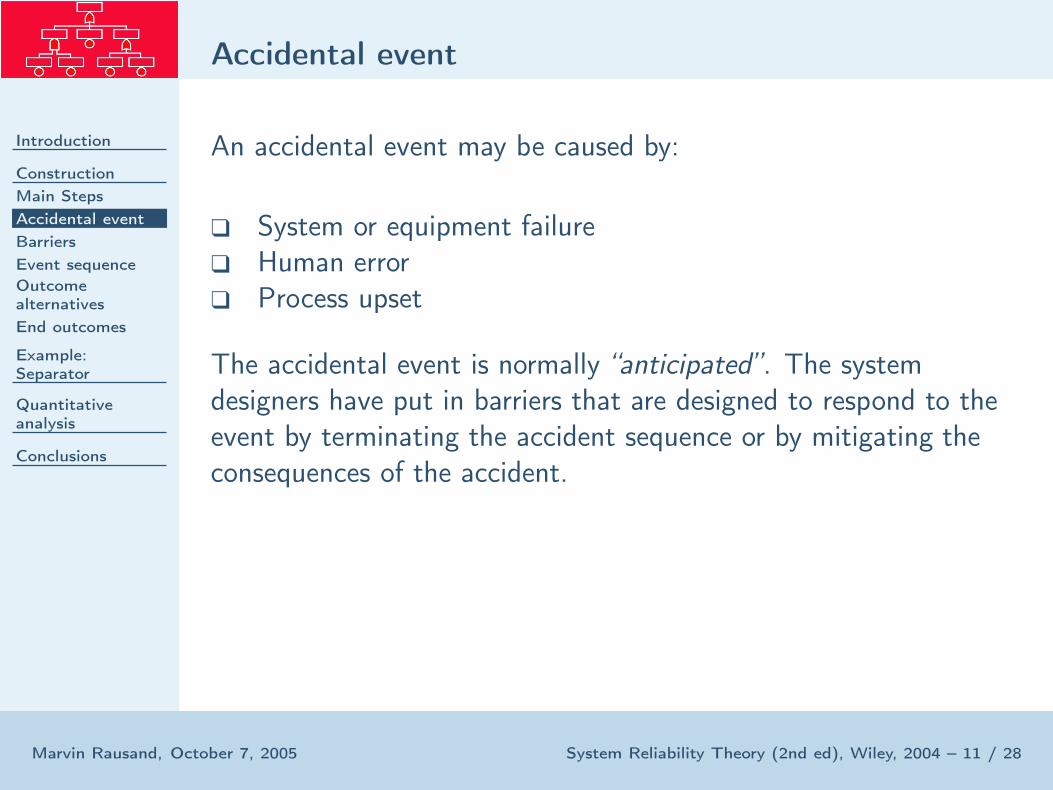
An accidental event may be caused by:
❑ System or equipment failure❑ Human error❑ Process upset
The accidental event is normally “anticipated”. The systemdesigners have put in barriers that are designed to respond to theevent by terminating the accident sequence or by mitigating theconsequences of the accident.

Accidental event
Introduction
Construction
Main Steps
Accidental event
Barriers
Event sequence
Outcomealternatives
End outcomes
Example:Separator
Quantitativeanalysis
Conclusions
Marvin Rausand, October 7, 2005 System Reliability Theory (2nd ed), Wiley, 2004 – 12 / 28
For each accidental event we should identify:
❑ The potential accident progression(s)❑ System dependencies❑ Conditional system responses
Barriers
Introduction
Construction
Main Steps
Accidental event
Barriers
Event sequence
Outcomealternatives
End outcomes
Example:Separator
Quantitativeanalysis
Conclusions
Marvin Rausand, October 7, 2005 System Reliability Theory (2nd ed), Wiley, 2004 – 13 / 28
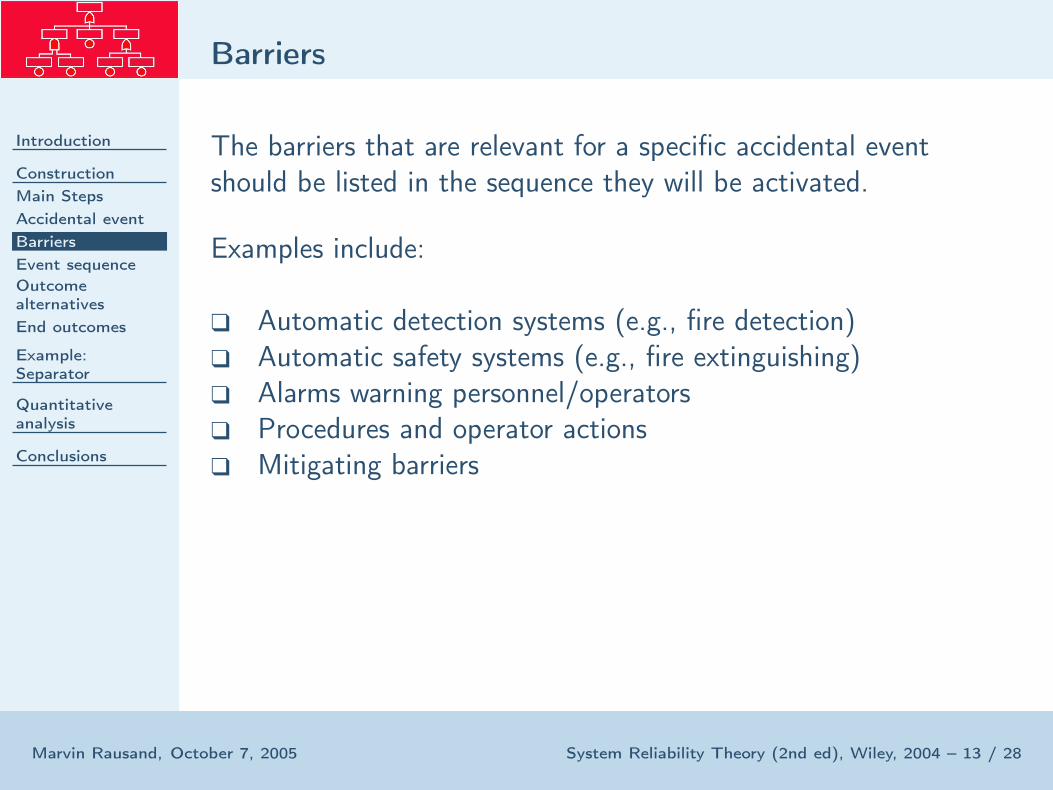
The barriers that are relevant for a specific accidental eventshould be listed in the sequence they will be activated.
Examples include:
❑ Automatic detection systems (e.g., fire detection)❑ Automatic safety systems (e.g., fire extinguishing)❑ Alarms warning personnel/operators❑ Procedures and operator actions❑ Mitigating barriers
Additional events/factors
Introduction
Construction
Main Steps
Accidental event
Barriers
Event sequence
Outcomealternatives
End outcomes
Example:Separator
Quantitativeanalysis
Conclusions
Marvin Rausand, October 7, 2005 System Reliability Theory (2nd ed), Wiley, 2004 – 14 / 28
Additional events and/or factors should be listed together withthe barriers, as far as possible in the sequence when they maytake place.
Some examples of additional events/factors were given on aprevious slide.
Event sequence
Introduction
Construction
Main Steps
Accidental event
Barriers
Event sequence
Outcomealternatives
End outcomes
Example:Separator
Quantitativeanalysis
Conclusions
Marvin Rausand, October 7, 2005 System Reliability Theory (2nd ed), Wiley, 2004 – 15 / 28
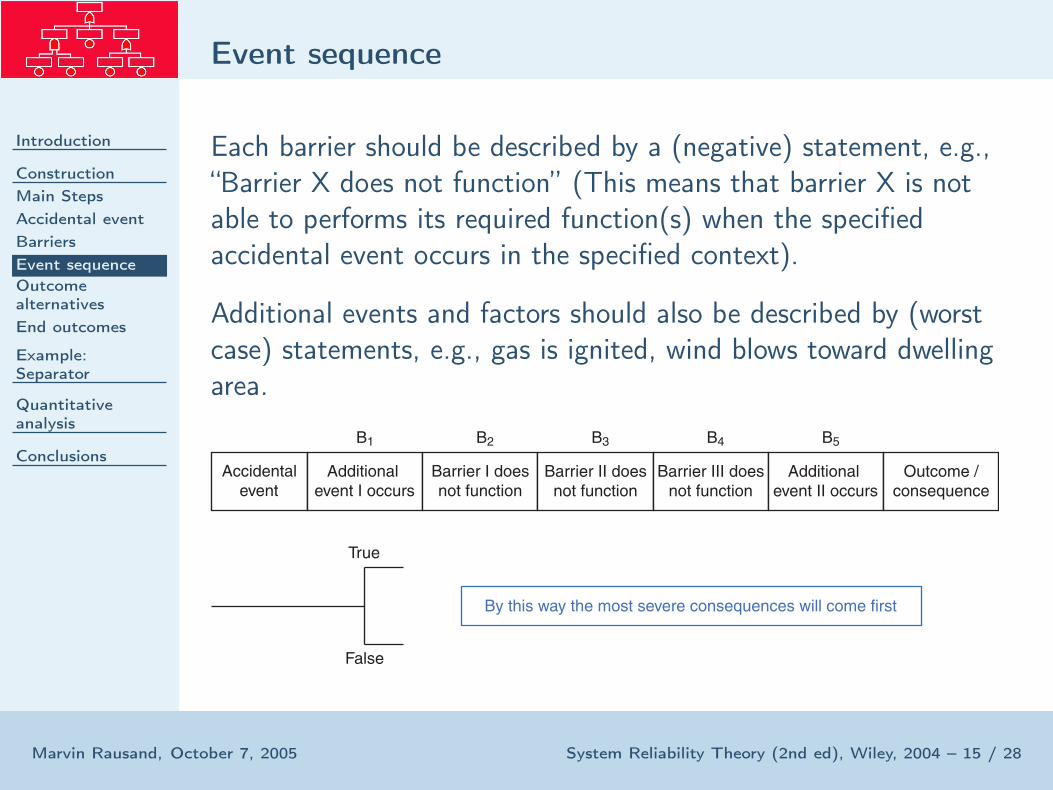
Each barrier should be described by a (negative) statement, e.g.,“Barrier X does not function” (This means that barrier X is notable to performs its required function(s) when the specifiedaccidental event occurs in the specified context).
Additional events and factors should also be described by (worstcase) statements, e.g., gas is ignited, wind blows toward dwellingarea.
Accidental
event
Additional
event I occurs
Barrier I does
not function
Barrier II does
not function
Barrier III does
not function
Additional
event II occurs
Outcome /
consequence
B1
True
False
By this way the most severe consequences will come first
B2 B3 B4 B5
Outcome alternatives
Introduction
Construction
Main Steps
Accidental event
Barriers
Event sequence
Outcomealternatives
End outcomes
Example:Separator
Quantitativeanalysis
Conclusions
Marvin Rausand, October 7, 2005 System Reliability Theory (2nd ed), Wiley, 2004 – 16 / 28
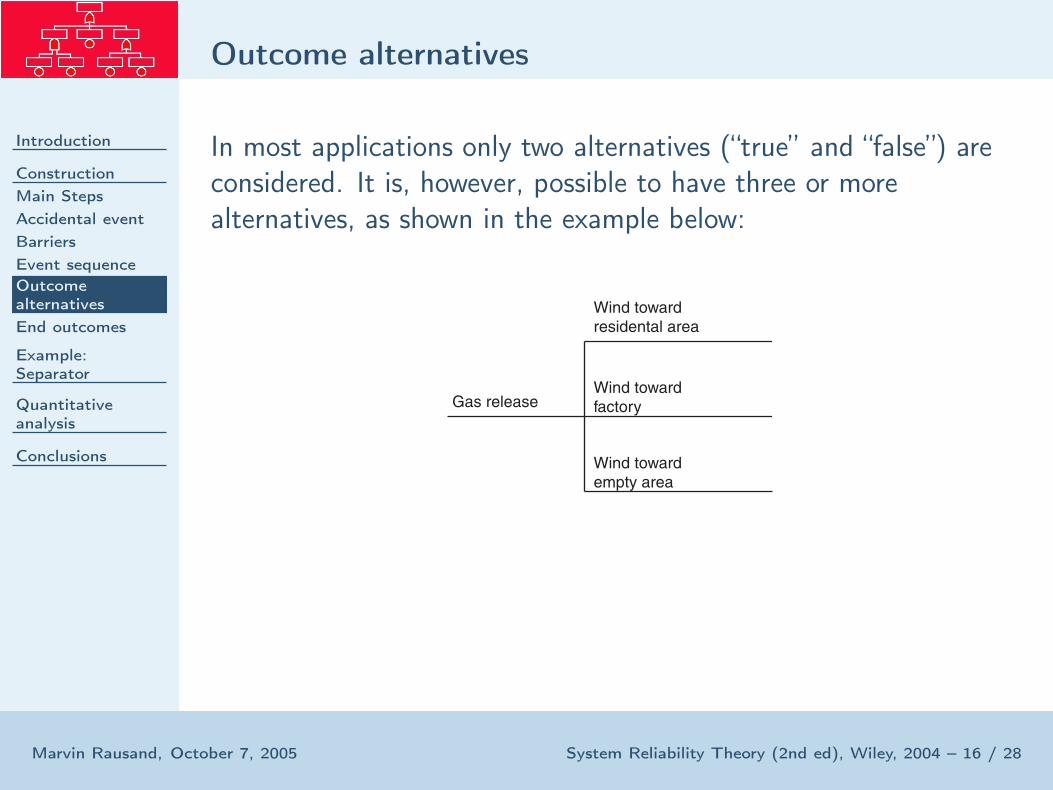
In most applications only two alternatives (“true” and “false”) areconsidered. It is, however, possible to have three or morealternatives, as shown in the example below:
Wind toward
residental area
Wind toward
factory
Wind toward
empty area
Gas release

End outcomes
Introduction
Construction
Main Steps
Accidental event
Barriers
Event sequence
Outcomealternatives
End outcomes
Example:Separator
Quantitativeanalysis
Conclusions
Marvin Rausand, October 7, 2005 System Reliability Theory (2nd ed), Wiley, 2004 – 17 / 28
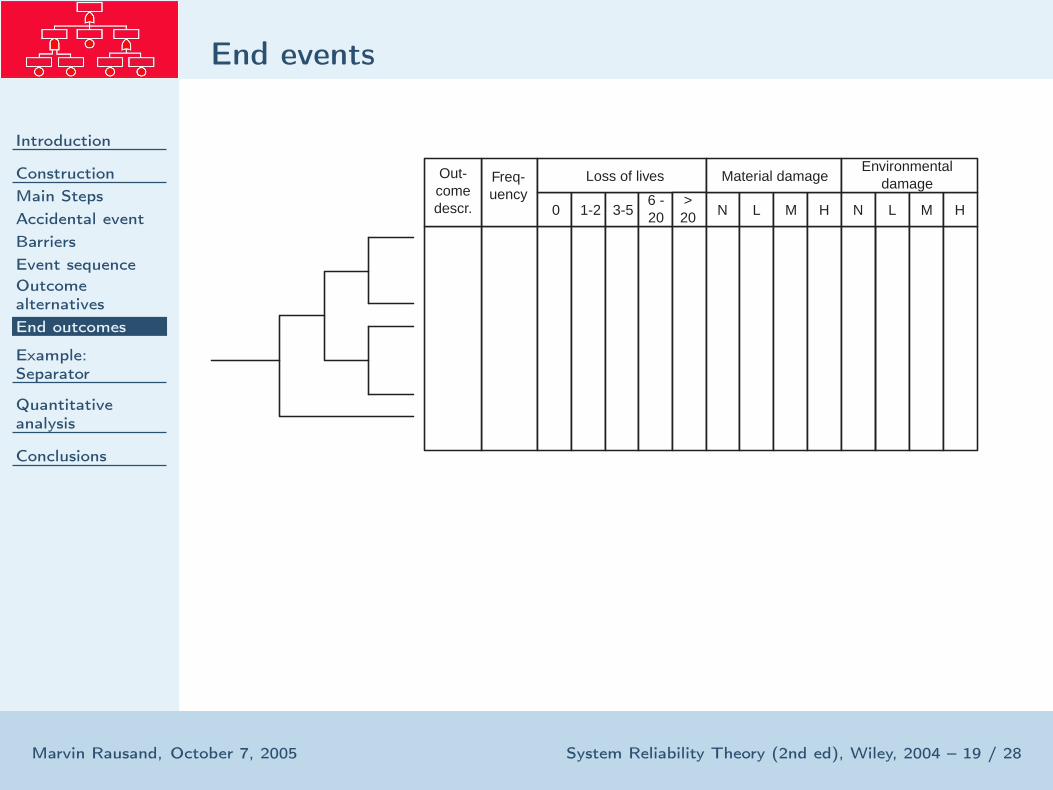
❑ In practice, many event trees are ended before the “final”consequences are reached
❑ Including these “final” consequences may give very large eventtrees that are impractical for visualization
❑ This is solved by establishing a consequence distribution foreach end event and the probability of each consequence isdetermined for each end event
❑ In effect, this is an extension of the event tree, but it gives amore elegant and simpler presentation and also eases thesummary of the end results
Results in decision making
Introduction
Construction
Main Steps
Accidental event
Barriers
Event sequence
Outcomealternatives
End outcomes
Example:Separator
Quantitativeanalysis
Conclusions
Marvin Rausand, October 7, 2005 System Reliability Theory (2nd ed), Wiley, 2004 – 18 / 28
The results from the event tree analysis may be used to:
❑ Judge the acceptability of the system❑ Identify improvement opportunities❑ Make recommendations for improvements❑ Justify allocation of resources for improvements
End events
Introduction
Construction
Main Steps
Accidental event
Barriers
Event sequence
Outcomealternatives
End outcomes
Example:Separator
Quantitativeanalysis
Conclusions
Marvin Rausand, October 7, 2005 System Reliability Theory (2nd ed), Wiley, 2004 – 19 / 28
Freq-uency
Out-comedescr. 0 1-2 3-5
6 -20
Loss of lives
>20 N L M H N L M H
Material damageEnvironmental
damage
Introduction
Construction
Example:Separator
Offshore separator
Event tree
Quantitativeanalysis
Conclusions
Marvin Rausand, October 7, 2005 System Reliability Theory (2nd ed), Wiley, 2004 – 20 / 28
Example: Separator
Offshore separator
Introduction
Construction
Example:Separator
Offshore separator
Event tree
Quantitativeanalysis
Conclusions
Marvin Rausand, October 7, 2005 System Reliability Theory (2nd ed), Wiley, 2004 – 21 / 28
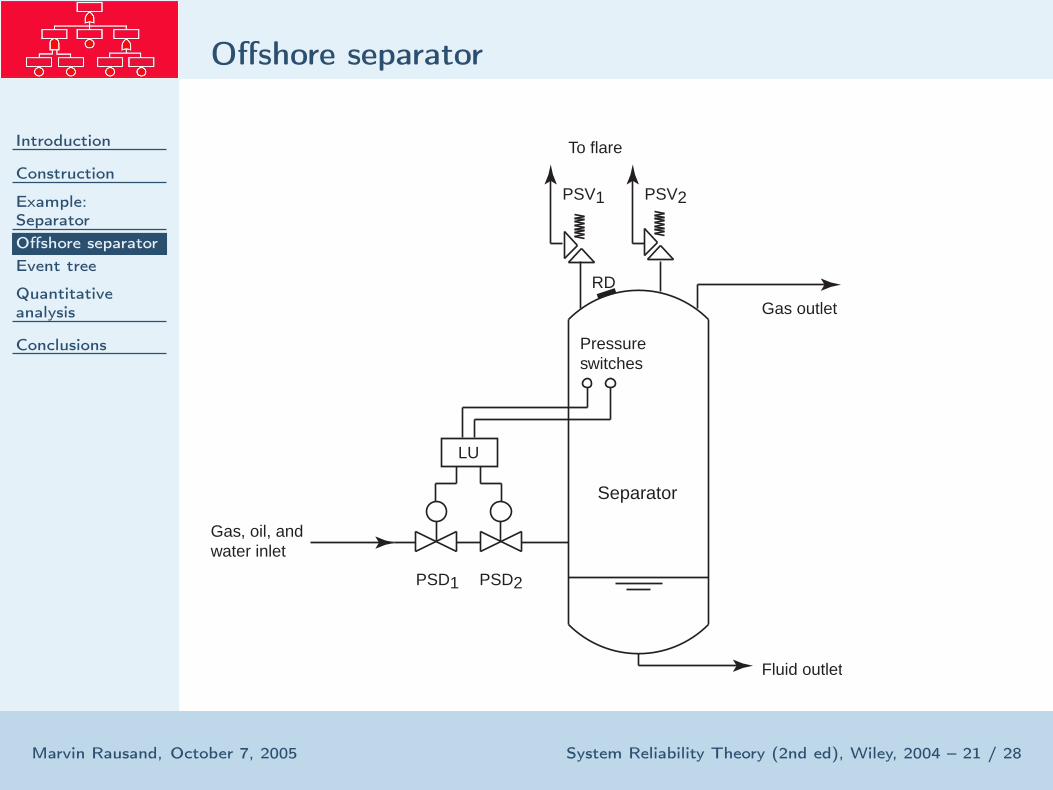
PSD1 PSD2
Gas, oil, andwater inlet
Pressureswitches
LU
Gas outlet
PSV1 PSV2
To flare
Separator
Fluid outlet
RD
Activation Pressures
Introduction
Construction
Example:Separator
Offshore separator
Event tree
Quantitativeanalysis
Conclusions
Marvin Rausand, October 7, 2005 System Reliability Theory (2nd ed), Wiley, 2004 – 22 / 28
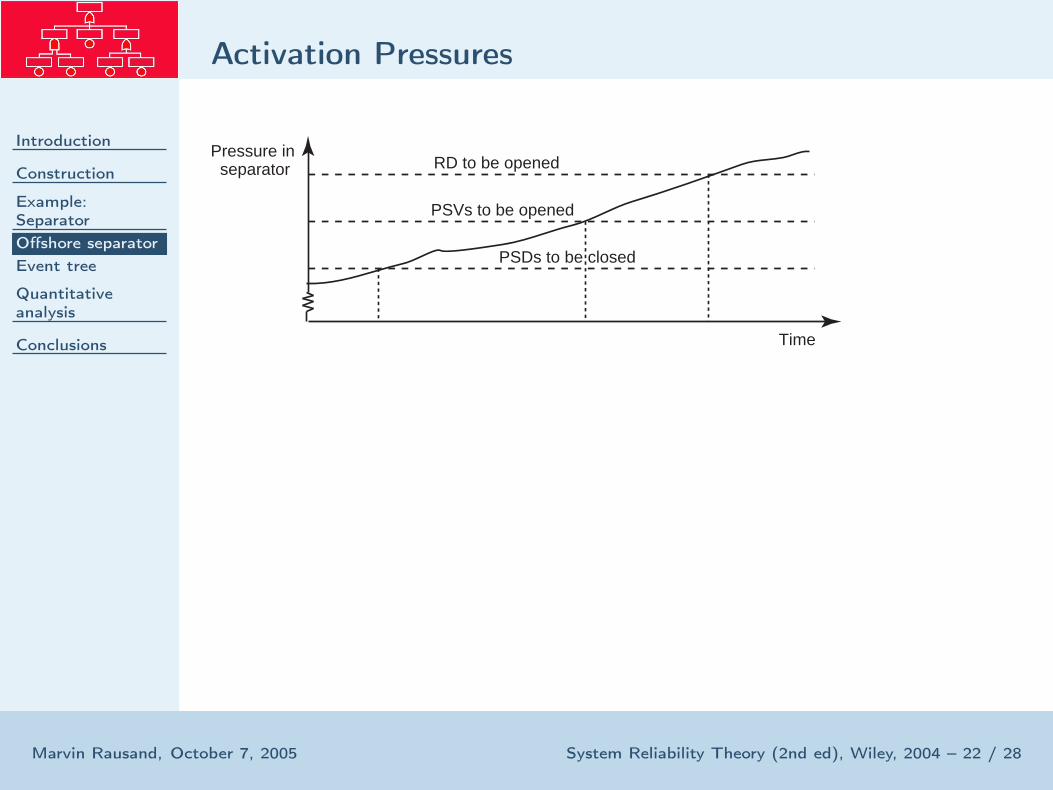
PSDs to be closed
PSVs to be opened
RD to be opened
Time
Pressure in separator

Event tree
Introduction
Construction
Example:Separator
Offshore separator
Event tree
Quantitativeanalysis
Conclusions
Marvin Rausand, October 7, 2005 System Reliability Theory (2nd ed), Wiley, 2004 – 23 / 28
Initiatingevent
PSDs do notclose flow into separator
PSVs do notrelieve
pressure
Rupture discdoes not open Outcomes
Gas relieved to flare
Gas flowing out of rupture disc
Rupture or explosion ofseparator
Gas outletblocked
True
True
True
False
False
Controlledshutdown, no gas "lost"
False
1 2 3
Introduction
Construction
Example:Separator
Quantitativeanalysis
Example
Frequencies ofoutcomes
Conclusions
Marvin Rausand, October 7, 2005 System Reliability Theory (2nd ed), Wiley, 2004 – 24 / 28
Quantitative analysis

Example
Introduction
Construction
Example:Separator
Quantitativeanalysis
Example
Frequencies ofoutcomes
Conclusions
Marvin Rausand, October 7, 2005 System Reliability Theory (2nd ed), Wiley, 2004 – 25 / 28
Consider the generic example:
Accidental
event
Additional
event I occurs
Barrier I does
not function
Barrier II does
not function
Additional
event II occurs
Outcome /
consequence
B1
True
False
B2 B3 B4
True
True
True
True
True
True
True
False
False
False
False
False
Outcome 1
Outcome 7
Outcome 6
Outcome 5
Outcome 4
Outcome 3
Outcome 2
Outcome 8
Outcome 9
False
Frequencies of outcomes
Introduction
Construction
Example:Separator
Quantitativeanalysis
Example
Frequencies ofoutcomes
Conclusions
Marvin Rausand, October 7, 2005 System Reliability Theory (2nd ed), Wiley, 2004 – 26 / 28
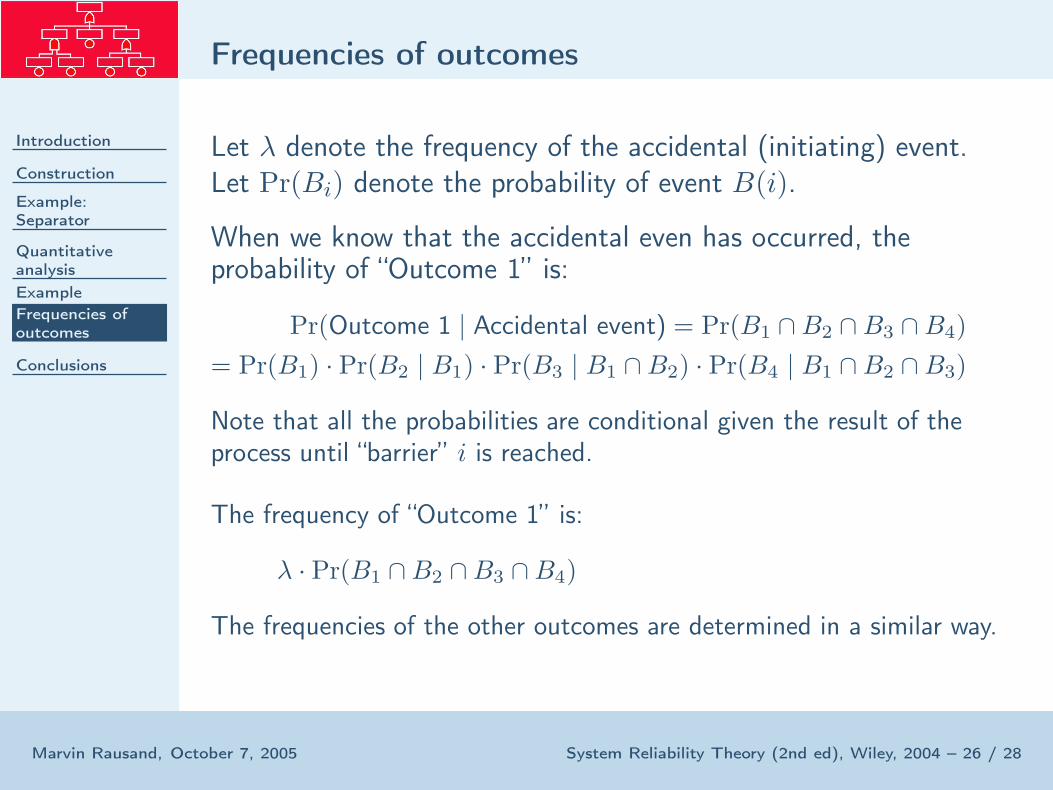
Let λ denote the frequency of the accidental (initiating) event.Let Pr(Bi) denote the probability of event B(i).
When we know that the accidental even has occurred, theprobability of “Outcome 1” is:
Pr(Outcome 1 | Accidental event) = Pr(B1 ∩ B2 ∩ B3 ∩ B4)
= Pr(B1) · Pr(B2 | B1) · Pr(B3 | B1 ∩ B2) · Pr(B4 | B1 ∩ B2 ∩ B3)
Note that all the probabilities are conditional given the result of theprocess until “barrier” i is reached.
The frequency of “Outcome 1” is:
λ · Pr(B1 ∩ B2 ∩ B3 ∩ B4)
The frequencies of the other outcomes are determined in a similar way.
Introduction
Construction
Example:Separator
Quantitativeanalysis
Conclusions
Pros and cons
Marvin Rausand, October 7, 2005 System Reliability Theory (2nd ed), Wiley, 2004 – 27 / 28
Conclusions
Pros and cons
Introduction
Construction
Example:Separator
Quantitativeanalysis
Conclusions
Pros and cons
Marvin Rausand, October 7, 2005 System Reliability Theory (2nd ed), Wiley, 2004 – 28 / 28
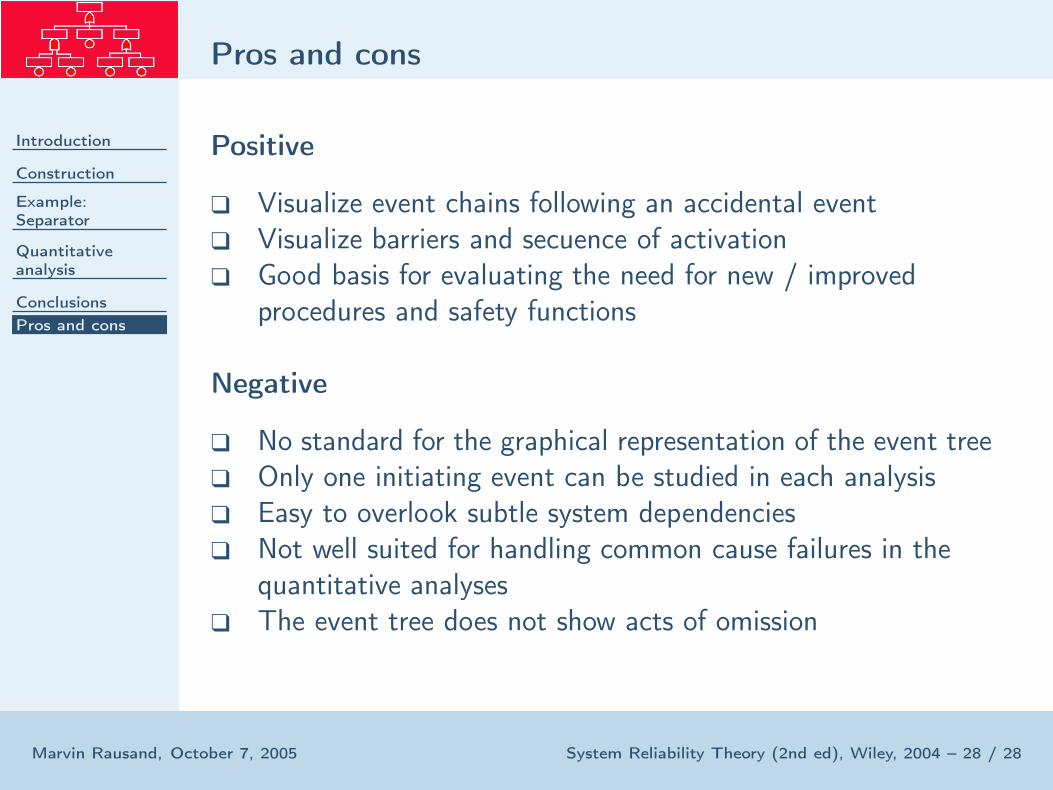
Positive
❑ Visualize event chains following an accidental event❑ Visualize barriers and secuence of activation❑ Good basis for evaluating the need for new / improved
procedures and safety functions
Negative
❑ No standard for the graphical representation of the event tree❑ Only one initiating event can be studied in each analysis❑ Easy to overlook subtle system dependencies❑ Not well suited for handling common cause failures in the
quantitative analyses❑ The event tree does not show acts of omission