Chapter 2 - buecher.de · 80 Chapter 2 different types of instruments, normally operatingaround or...
38
Chapter 2 VOLUMETRY / MANOMETRY Abstract The physical principles and experimental techniques of pure gas- and multi- component gas adsorption measurements by the volumetric (or manometric) method are outlined. Examples are given. Thermovolumetric and combined volumetric– calorimetric measurements are presented. Pros and cons of the method are discussed. References. List of Symbols. 1. INTRODUCTION Volumetry or, preferably “Manometry”, cp. Sect. 2.1, is the oldest method to investigate sorption of gases in solids. Early experiments had already been performed by C. W. Scheele (1777), Chappuis (1881), W. Ostwald (1905) and J. Langmuir (1912), [1.1]. Some of these experiments were designed to determine the volume of geometrically complicated objects like cauliflower or sea-urchins. A special instrument for this purpose was designed by R. W. Pohl about 1940 and was called a “volumimeter” [2.1]. It served as a prototype of many of today’s volumetric instruments. The physics of volumetric gas adsorption experiments is simple: a given amount of sorptive gas is expanded into a vessel which includes a sorbent sample and which initially has been evacuated. Upon expansion the sorptive gas is partly adsorbed on the (external and internal) surface of the sorbent material, partly remaining as gas phase around the sorbent. By a mass balance, the amount of gas being adsorbed can be calculated if the void volume of the sorbent, i. e. the volume which can not be penetrated by the sorptive gas molecules is known – at least approximately. The adsorbed mass per unit mass of sorbent is a characteristic quantity for a porous solid. Assuming a characteristic area per single molecule adsorbed on the surface of a solid – for at 77 K this area is for Kr at 87 K it is [2.2, p. 173] – the surface area of the solid can be calculated and from this the porous solid can be “characterized”. Actually, many
Transcript of Chapter 2 - buecher.de · 80 Chapter 2 different types of instruments, normally operatingaround or...
Chapter 2
VOLUMETRY / MANOMETRY
Abstract The physical principles and experimental techniques of pure gas- and multi-component gas adsorption measurements by the volumetric (or manometric) methodare outlined. Examples are given. Thermovolumetric and combined volumetric–calorimetric measurements are presented. Pros and cons of the method are discussed.References. List of Symbols.
1. INTRODUCTION
Volumetry or, preferably “Manometry”, cp. Sect. 2.1, is the oldest methodto investigate sorption of gases in solids. Early experiments had already beenperformed by C. W. Scheele (1777), Chappuis (1881), W. Ostwald (1905) andJ. Langmuir (1912), [1.1]. Some of these experiments were designed todetermine the volume of geometrically complicated objects like cauliflower orsea-urchins. A special instrument for this purpose was designed by R. W. Pohlabout 1940 and was called a “volumimeter” [2.1]. It served as a prototype ofmany of today’s volumetric instruments.
The physics of volumetric gas adsorption experiments is simple: a givenamount of sorptive gas is expanded into a vessel which includes a sorbentsample and which initially has been evacuated. Upon expansion the sorptivegas is partly adsorbed on the (external and internal) surface of the sorbentmaterial, partly remaining as gas phase around the sorbent. By a massbalance, the amount of gas being adsorbed can be calculated if the voidvolume of the sorbent, i. e. the volume which can not be penetrated by thesorptive gas molecules is known – at least approximately.
The adsorbed mass per unit mass of sorbent is a characteristic quantity fora porous solid. Assuming a characteristic area per single molecule adsorbedon the surface of a solid – for at 77 K this area is for Kr at 87 Kit is [2.2, p. 173] – the surface area of the solid can be calculatedand from this the porous solid can be “characterized”. Actually, many

80 Chapter 2
different types of instruments, normally operating around or below ambientpressure, have been designed for this purpose including static, gas flow anddifferential gas flow instruments. An overview is given in [2.2]; a list ofcommercial suppliers which in no way is meant to be exclusive or complete isgiven in Table 2.1 below, cp. also [2.3, 2.4, 3.7].

2. Volumetry / Manometry 81
As we here are mainly interested in adsorption measurement techniquesfor industrial purposes, i. e. at elevated pressures (and temperatures), werestrict this chapter to volumetric instruments which on principle can do thisfor pure sorptive gases (N = 1), Sect. 2. Thermovolumetric measurements, i.e. volumetric/manometric measurements at high temperatures (300 K - 700 K)are considered in Sect. 3. In Section 4 volumetric-chromatographicmeasurements for multi-component gases (N>1), are considered as mixturegas adsorption is becoming more and more important for a growing numberof industrial gas separation processes. In Section 5 we discuss combinedvolumetric-calorimetric measurements performed in a gas sensor calorimeter(GSC). Finally pros and cons of volumetry/manometry will be discussed inSect. 6, and a list of symbols, Sect. 7, and references will be given at the endof the chapter.
2. VOLUMETRIC MEASUREMENT OF PURE GASADSORPTION EQUILIBRIA (N = 1)
2.1 Experimental
An instrument for volumetric measurements of pure gas adsorptionbasically consists of a gas storage vessel (volume and an adsorptionchamber being connected by a tube bearing a valve. Both vesselsshould completely be placed within a thermostat (water, oil, air etc.) andprovided with tubes for gas supply and evacuation as well as withthermometers and manometers to measure the temperature (T) and pressure(p) inside the vessels, cp. Figure 2.1.
For pressures above ambient all vessels and tubes should be manufacturedof stainless steel, inside surfaces should be electropolished or, preferablygilded. For pressures below ambient, i. e. vacuum systems glass should bepreferred. Sealing materials should be chosen according to the sorptive gasesto be used and the ranges of temperature and pressure of operation. Forcorrosive gases and high pressures the use of metallic sealings (silver, steel)always is recommended. The adsorption chamber includes a sample ofsorbent material of mass which prior to measurement should have been“activated” at higher temperature and in vacuum for several hours to reducethe amount of pre-adsorbed molecules. Standard procedures for activationhave been described in [2.2, 2.5 – 2.7].

82 Chapter 2
Figure 2.1. Experimental setup for (static) volumetric measurements of pure gas adsorptionequilibria.
To measure adsorption a certain amount of gas of mass (m*) is prepared inthe storage vessel and the adsorption chamber is evacuated. Upon opening theexpansion valve, the gas expands to the adsorption chamber where it is partlyadsorbed on the (external and internal) surface of the sorbent material. Thisprocess may last milliseconds, minutes, hours or even several days – as incase of helium on activated carbon (Norit R1) [2.8]. After thermodynamicequilibrium, i. e. constancy of pressure (p) and temperature (T) inside thevessels has been realized, these data can be taken as a basis to calculate themass of the gas adsorbed on the sorbent That is, volumetric adsorptionexperiments mainly result in pressure measurements. Hence the name“Manometry” for this method should be used [2.2].
2.2 Theory
To determine the mass adsorbed in a volumetric experiment weconsider the mass balance of the sorptive gas:
Here is the mass of gas initially prepared in thestorage vessel, is the mass of the sorptive gas in the adsorption equilibriumstate considered. It also can be calculated from its thermal equation of state(EOS)

It should be emphasized that the auxiliary quantity only includesmeasurable quantities. Hence its numerical value is known from the gasexpansion experiment. According to Eq. (2.4), can be called “reducedmass” of the adsorbed phase as it is the difference between the mass of theadsorbed phase and the mass of the sorptive gas that would be includedin the void volume of both the sorbent and the sorbate phase [2.3, 2.7].As this quantity also is unknown, some model assumptions for it have to beintroduced to calculate the adsorbed mass from Eq. (2.4).
As outlined in Chapter 1, is often approximated by the so-calledhelium volume,
2. Volumetry / Manometry 83
In this equation M is the molar mass of the sorptive gas, R = 8.314 J/molK theuniversal gas constant and Z = Z (p, T) the compressibility factor or real gasfactor of the gas which can be determined from p, V, T-measurements.Analytic expressions for Z are given for example in [2.9, 2.10], numericalvalues for a variety of technical gases over a considerable range of pressureand temperature can be found in [2.11 – 2.15]. For an ideal gas we have Z = 1for any value of p, T. The volume of the sorptive gas in Eq. (2.2) can becalculated from the relation
where indicates the so-called void volume of the sorbent material and thesorbate phase which can not be penetrated by the sorptive’s gas molecules.Equations (2.1-2.3) can be combined to present the result of volumetricmeasurements:
Here has been introduced as an abbreviation being defined by
with the sorptive gas density, cp. (2.2),

84 Chapter 2
that is the volume of the sorbent without that of the sorbate phase as “seen” byhelium molecules which are assumed not to be adsorbed at all on the surfaceof the sorbent. Indeed under these conditions can be determined fromvolumetric experiments performed with helium – preferably at roomtemperature or even at higher temperatures – leading via (2.1 - 2.3) with
to
with
Here is the volume of the helium gas of mass at pressuretemperature T and is the compressibility or real gas factor of helium[2.11, 2.12]. In view of the approximation (2.7), the sorbate mass in Eq.(2.4) is the Gibbs surface excess mass (GSE) cp. Chap. 1. InsertingEqs. (2.5 - 2.7) in (2.4) this mass can be represented as
If the void volume in (2.4) is approximated by
cp. Chapter 1, in Eq. (2.4) is the absolute or total mass adsorbed whichequivalently to (2.8) via Eqs. (2.4 – 2.5, 2.8, 2.9) can be represented as
with as given by (2.8) and by (2.6).

2. Volumetry / Manometry 85
It should be noted that for and for
which reflects the occurrence of a liquid phase outside the sorbent material, i.e. a vapor-liquid-state of the sorptive fluid.
Auxiliary remarks:
1. The quantity in Eq. (2.1) on principle also includes the mass ofgas adsorbed on the walls of the adsorption chamber and possiblydesorbed from the walls of the storage vessel upon gas expansion
These quantities should be determined by calibration
experiments without using a sorbent sample, i. e. cp. Chapter4. If the surface of the walls of the adsorption chamber and thestorage vessel is small compared to the BET surface of the sorbentsample, one may assume i. e. neglect
compared to
2. The volumes should be determined experimentally byusing a sample, preferably a cylinder of calibrated volumemade of dense material (Ti, Au) and performing gas expansionexperiments as described above. The amount of gas adsorbed on thesurface of the sample normally can be neglected.**
3. Waiting times for thermodynamic equilibrium in the gas adsorptionsystem are based on experimental experience which comes fromgravimetric measurements, cp. Chap. 3. No general rules for thesetimes are available today.
2.3 Uncertainties or Errors of Measurements
An important part of any kind of experimental work is to consider errorsor uncertainties of measurements [2.16 – 2.18]. To keep these down, it isalways recommended to repeat measurements of any experimental quantity at
** Suppose the sample is placed in the adsorption chamber and a certain amount of nearlynot adsorbing gas (He, Ar at has been prepared at pressure (p*) in the storagevessel If after expansion to the adsorption chamber the gas is at pressure (p), thevolume can be calculated via Eq. (2.2) by
86 Chapter 2
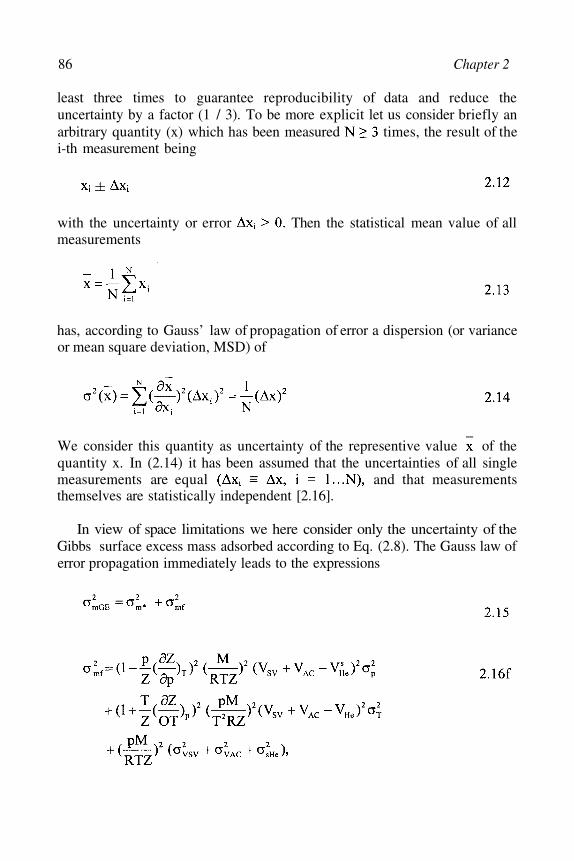
least three times to guarantee reproducibility of data and reduce theuncertainty by a factor (1 / 3). To be more explicit let us consider briefly anarbitrary quantity (x) which has been measured times, the result of thei-th measurement being
with the uncertainty or error Then the statistical mean value of allmeasurements
has, according to Gauss’ law of propagation of error a dispersion (or varianceor mean square deviation, MSD) of
We consider this quantity as uncertainty of the representive value of thequantity x. In (2.14) it has been assumed that the uncertainties of all singlemeasurements are equal and that measurementsthemselves are statistically independent [2.16].
In view of space limitations we here consider only the uncertainty of theGibbs surface excess mass adsorbed according to Eq. (2.8). The Gauss law oferror propagation immediately leads to the expressions

2. Volumetry / Manometry 87
Analysis of numerical data shows that measurements of pressures (p, p*), i. e.values of are the most crucial for accurate measurements of
followed of course by temperature measurements and those for basic
data of the equipment and of the sorbing material To
achieve useful results, i. e. limiting values of variances
should hold as follows [2.7]:
2.4 Example
In Figure 2.2 equilibrium adsorption data for carbon dioxide onzeolite Na 13X (Linde, UOP) are presented for temperatures 298 K and 303K. The mol numbers of the Gibbs surface excess amounts per unit mass ofsorbent are depicted as function of the sorptive gas pressure and temperature.Relative uncertainties of measurements are about
The subcritical isotherms are in the range of pressuremeasured of Type I – IUPAC classification [2.20].
However, the adsorption isotherms exhibit Type II structure if thesaturation pressure is approached, cp. Chapter 3. Prior to adsorption,the zeolite has been “activated” at 623 K for 3 hours under vacuum conditions(p < 15 Pa). Some characteristic data of the zeolite also have been measuredin our laboratory [2.19], namely the BET surface at 77 K being(UOP-date: the total pore volume being the He-expansion density being
Equilibration times varied from 15 minutes at low pressures up to (nearly)1 hour at the higher pressures considered, i. e. Thisinformation was gained from time dependent temperature signals produced bythe sorbent sample and gained simultaneously with adsorption equilibriameasurements [2.23], cp. Sect. 5.

88 Chapter 2
Figure 2.2. Adsorption equilibria of on zeolite Na13X (Linde, UOP) at 293 K and303 K for pressures up to 0.2 MPa. Lines indicate correlation of data by ageneralized Langmuir type adsorption isotherm, cp. Chap. 7.
3. THERMOVOLUMETRY
Sorption of gases in highly porous and thermally stable materials likezeolites at high temperatures are becoming important in view of an increasingnumber of technical applications with considerable economic potential. Twoexamples of these are
i)ii)
Sorption enhanced chemical reactions [2.21]Volumetric receivers of solar radiation in solar-thermalenergy converters [2.22].
In view of some inherent problems of traditional thermogravimetricmeasurements, cp. Chapter 3, it seems to be worthwhile to consider alsovolumetric / manometric measurements of gas adsorption equilibria at highertemperatures (T > 400 K). An instrument of this type has been designed andbuilt in the labs of the authors, the scheme of it being presented in Figure 2.3.A photo showing mainly the high temperature thermostat and auxiliaryequipment is given below.
Adsorption and desorption experiments of nitrogen on zeoliteKE-H 555 (UOP) have been performed in the temperature range

2. Volumetry / Manometry 89
293 K < T < 673 K and for pressures up to 5.5 MPa. Data are given in Figure2.5 that show clearly that nitrogen is adsorbed even at high temperatures.
Figure 2.3.
Experimental set-up for
volumetric high temperature
adsorption / desorption
experiments.
In calculating the adsorbed masses of nitrogen, the thermal expansion ofthe storage and of the adsorption vessel at higher temperatures must be takeninto account. Also slight changes in the so-called helium-volume of thezeolite depending also on temperature should be considered.
No coadsorption measurements at high temperatures using the volumetric /manometric method seem to have been performed yet. Some experimentswith humid nitrogen, i. e. mixtures are presently (2003) under wayat the author’s institute. Data will be reported in the homepage of IFT,cp. [4.15].

90 Chapter 2
Figure 2.4.
Volumetric high
temperature sorption
system
(293 K < T < 673 K,
p< 10MPa)
© IFT, University
of Siegen, 2000.
Figure 2.5. Adsorption isotherms of on zeolite KE-H 555 (UOP) at differenttemperatures (293 K – 673 K); helium volume

2. Volumetry / Manometry 91
4. VOLUMETRIC MEASUREMENT OFMULTICOMPONENT GAS ADSORPTIONEQUILIBRIA (N > 1)
4.1 Experimental
Coadsorption equilibria of multi-component gases on porous materialstoday most often are measured by using volumetric / manometric instruments.The flow diagram of such a device is sketched in Fig. 2.6. It basically has thesame structure as the instrument for pure gas adsorption measurements, Fig.2.1. However, one now has to provide a gas circulation loop including a pumpbetween the storage vessel and the adsorption chamber in order to maintainequal and constant sorptive gas concentrations everywhere in the system. Alsoa sample loop has to be added which may be outside the thermostat but in anycase has to be connected to a gas chromatograph or mass spectrometer. Nocommercial suppliers of volumetric multi-component gas adsorptioninstruments are known to the authors, cp. [2.3, 2.4]. However, an instrumentwhich easily can be used as such, after having been equipped with a standardgas chromatograph, is offered by BEL Japan, cp. Chapter 4. Materials ofvessels and tubes should be chosen according to the recommendations givenin Section 2.1. For the analysis of a sorptive gas sample in a gaschromatograph, helium at elevated temperatures (373 K – 473 K) should beused as a carrier gas. More information for design of a multicomponentvolumetric gas adsorption instrument is given in [2.20].
Figure 2.6. Experimental set-up for (static) volumetric / manometric measurements of
multicomponent gas adsorption equilibria.

92 Chapter 2
4.2 Theory
Let us assume a certain amount of gas mixture with known massconcentrations and molar concentrations is in the storagevessel of the instrument, Fig. 2.6. The adsorption chamberincluding the sorbent mass has been evacuated. Upon opening the valveconnecting both vessels, adsorption occurs. Recirculating the gas in thesystem will enhance equilibrium between the gas and the sorbate phase. If thisis attained, a gas sample may be taken to determine its molar concentrations
, i = 1...N). From this information the masses of components i =1...N of the adsorbate can be determined as follows: First we note the massbalances of all components
Here is the mass of component i of the sorptive gas filled to the storagevessel It can be calculated from the relation
with the total number of mols of the gas originally supplied being givenby the thermal equation of state (EOS)
Here
is the compressibility or real gas factor of the gas mixture. Its numerical valuecan be calculated from an analytical EOS, [2.9-2.25] measured values frompressure and Temperature (T) and known molar concentrations
of the gas.
Similarly to (2.21-2.23) we have for the mass of component i in thesorptive gas

2. Volumetry / Manometry 93
with the total mol number again being obtained from the EOS
including the compressibility factor
Inserting Eqs. (2.21-2.25) into the mass balance (2.20) and taking Eq. (2.3)into account we get the equations
with
being the “reduced mass” of component i in the sorbate phase, a quantitywhich according to its definition (2.28) can be calculated from measuredexperimental parameters of the adsorption system. In order to calculatefrom (2.27) we must introduce an approximate value for Choosingagain the helium volume approximation (2.7), the adsorbed mass indeed is theGibbs surface excess mass of component (i), cp. Chap. 1, for which we getfrom (2.27)
or in view of (2.28, 2.21, 2.24),
Choosing for in (2.27) instead of (2.7) the approximation (2.9) we getfor the absolute adsorbed masses of components i = 1...N in view of(2.21-2.25, 2.30), the relations

94 Chapter 2
This is a system of N linear equations from which the absolute adsorbedmasses of all components k = 1...N can be calculated. The symbol
for and for i = 1...N is the Kronecker Symbol. For the referencedensity of the adsorbed phase an approximate value
with – according to experience – roughly estimated values of the expectedconcentrations is used. Of course results can be improved by iteration, i.e. using numerical solutions of (2.31) to get a new approximation for (2.32)etc.
From either the set (2.30) or (2.31) the concentrations of
masses in the adsorbed phase i = 1…N and of mole
numbers i = l...N can be calculated. Hence the
selectivities of any two components i, k of the gas-adsorption-system
can be determined. These are key quantities for adsorption separationprocesses.
4.3 Uncertainties or Errors of Measurements
We restrict this discussion to dispersions or mean square deviations(MSD) of the Gibbs excess masses of component i = 1...N of amulticomponent adsorbate as given by Eqs. (2.30). Applying the Gauss law ofpropagation of error or uncertainty we have in view of (2.28), (2,24), (2.27):

2. Volumetry / Manometry 95
Here with is the mol number of the gas in the
storage vessel prior to adsorption, likewise with is
the mol number of the sorptive gas after equilibration. The dispersions
refer to concentrations in the gas prior and after adsorption
Approximate values of the dispersions referring to the total masses
of the sorptive gas prior and after adsorptionare given by Eqs.(2.16*) and (2.16f) respectively. Formulae (2.33, 2.34 a, b) clearly show theprofound influence of the dispersions of sorptive’s gas molar
concentrations respectively. Measurements of these should beperformed with meticulous care in order to get useful values of the masses
of the adsorbate components. In practice, concentration measurements
(by GC or MS) should maintain uncertainties of Provided
uncertainties of all the other measured quantities are of the orders ofmagnitude given at the end of Sect. 2.3, one may expect relative uncertaintiesfor binary (N = 2) mixture measurements of about and for
ternary (N = 3) mixture measurements of
4.4 Example
In this section we present data for the coadsorption equilibria ofgas mixtures on activated carbon (AC) Norit R 1 Extra taken at T = 298 K andtotal gas pressure p = 0.3 MPa. Measurements were performed using thevolumetric – gas chromatographic method described above (N = 2). Standardactivation procedures of the AC were applied, namely vacuum (10 Pa) at400 K for 4 hours, then cooling down to ambient temperature under vacuumwithin 12 hours. First the system was investigated by M. Tomalla at theauthor’s institution in 1993, [2.20]. Measurements were repeated using thesame method by St. Dohrmann in the labs of O. Talu, Cleveland StateUniversity, Cleveland, USA in 1997. Results of both measurements are shownin Figures 2.7 and 2.8 below. Figure 2.7 shows the partial molar Gibbs surface

96 Chapter 2
excess amounts of and respectively being adsorbed on the AC atconstant temperature (298 K) and pressure (0,3 MPa) but at varying molarconcentration of methane in the gas phase. Data show that for an equalmolar gas mixture nearly three times as much methane thannitrogen is adsorbed The dark full circles represent data takenat Cleveland. The open symbols indicate data taken 4 years earlier at Siegen.Differences between the data basically are due to the fact that AC is not a verystable material and the sample used may have changed somewhat over theperiod of 4 years. Also slightly different activation procedures may have beenapplied. In Figure 2.8 the corresponding Mc Cabe – Thiele diagram of theequilibria data is presented. Here the data seem to be nearly identical, thusproving experimental consistency.
Today there is a considerable amount of binary and also of some ternarycoadsorption data of technical gas mixtures on a variety of sorbens materialsavailable in the literature. The interested reader is referred to Journals like“Adsorption”, “Adsorption, Science & Technology”, “Langmuir” etc.
Figure 2.7.Coadsorption equilibria ofgas mixtures of AC Norit R1 Extra at298 K, 0.3 MPa. The data indicatepartial molar Gibbs excess amountsof (upper figure) and (lowerfigure) and their dependence on thesorptive gas concentration

2. Volumetry / Manometry 97
Figure 2.8.
Mc Cabe – Thiele diagram of
coadsorption equilibria of
gas mixtures on AC Noit R1 at
298 K, 0.3 MPa. Full circles
indicate data taken at Cleveland in
1997, shaded symbols refer to
measurements done at Siegen in
1993, [2.20].
5. VOLUMETRIC – CALORIMETRICMEASUREMENTSTHE SENSOR GAS CALORIMETER (SGC)
Assuming the adsorbed phase to be a thermodynamic system in the senseof W. Schottky [2.24], cp. Chap. 1, we can assign it an (integral) enthalpy
which can be considered as function of either the sorptive gas pressure(p) and temperature (T) or to depend on the mass of the adsorbate itstemperature (T) and the mass of the sorbent i. e.
This is an important quantity likewise for single and for multi-componentadsorbates which characterizes the energetic state of the adsorbed molecules.It normally is determined by measuring the difference between theenthalpies of the mass in the gaseous state and the adsorbed state
i.e. the so-called adsorption enthalpy
Today there are many experimental techniques and instruments at hand toperform measurements of this type both for characterization of the sorbentmaterial, cp. for example [2.25], but also for industrial purposes [2.26]. Agood overview of adsorption calorimetric measurement methods is given in[2.2].
98 Chapter 2
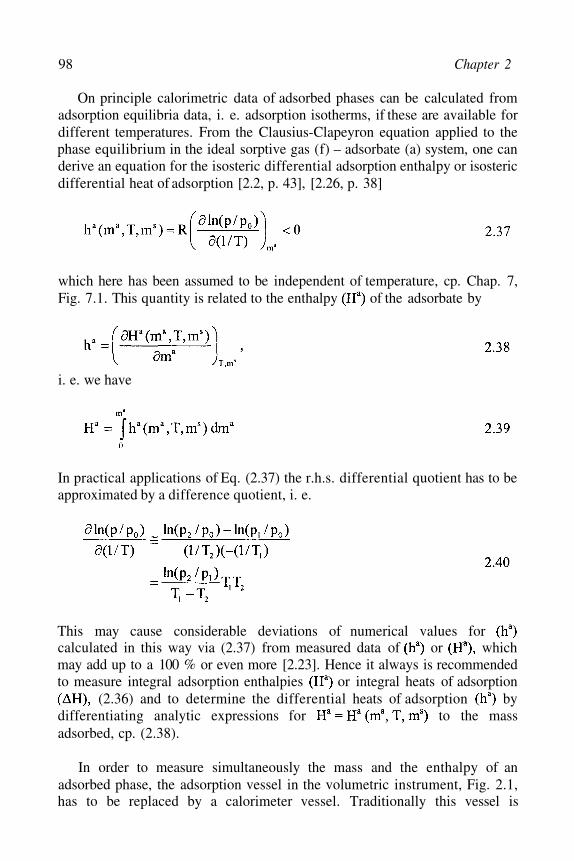
On principle calorimetric data of adsorbed phases can be calculated fromadsorption equilibria data, i. e. adsorption isotherms, if these are available fordifferent temperatures. From the Clausius-Clapeyron equation applied to thephase equilibrium in the ideal sorptive gas (f) – adsorbate (a) system, one canderive an equation for the isosteric differential adsorption enthalpy or isostericdifferential heat of adsorption [2.2, p. 43], [2.26, p. 38]
which here has been assumed to be independent of temperature, cp. Chap. 7,Fig. 7.1. This quantity is related to the enthalpy of the adsorbate by
i. e. we have
In practical applications of Eq. (2.37) the r.h.s. differential quotient has to beapproximated by a difference quotient, i. e.
This may cause considerable deviations of numerical values forcalculated in this way via (2.37) from measured data of or whichmay add up to a 100 % or even more [2.23]. Hence it always is recommendedto measure integral adsorption enthalpies or integral heats of adsorption
(2.36) and to determine the differential heats of adsorption bydifferentiating analytic expressions for to the massadsorbed, cp. (2.38).
In order to measure simultaneously the mass and the enthalpy of anadsorbed phase, the adsorption vessel in the volumetric instrument, Fig. 2.1,has to be replaced by a calorimeter vessel. Traditionally this vessel is

2. Volumetry / Manometry 99
provided with a large number of thermocouples allowing to measure changesin temperature due to transfer processes of the heat of adsorption flowingfrom the sorbent/sorbate system to the (isothermal) heat bath covering thesorption system. We here are not going to present this technique in detail asthis has been done in literature several times, [2.2], [2.25], [2.27], [2.28] andthe literature cited therein. Instead we would like to describe a new type ofcalorimeter avoiding thermocouples but using instead an inert gas as sensormedium. Hence, we will call it in what follows a sensor gas calorimeter(SGC). In Sect. 5.1 the basic experimental information is provided. Thetheory of the instrument is outlined in Sect. 5.2 followed by examples ofcalibration measurements. Examples of simultaneous mass and heat ofadsorption measurements are presented in Sect. 5.3. These are compared toresults of analytical calculations of the heat of adsorption via Eq. (2.37) anddiscussed to a certain extend.
5.1 Experimental
In 1994, W. Langer proposed to use a newly designed calorimeter forsimultaneous measurements of heats and isotherms of gas adsorption ordesorption processes [2.29]. This instrument may be called a sensor gascalorimeter (SGC), as the heat flowing during a gas adsorption process fromthe sorbent/sorbate system to the sorptive gas will then pass a gas jacketsurrounding the adsorption vessel. This gas, normally He or acts as asensor. The heat flux introduced changes its temperature and, as the gasvolume is constant, also its pressure. Actually, the time-dependent pressuresignal can be correlated with the heat flux passing the sensor gas and afterintegration over time gives a measure of the total heat of adsorption releasedfrom the adsorption vessel to the thermostat. A schematics of the instrument isgiven in Fig. 2.9, followed by a photo of the instrument as designed and builtby W. Zimmermann in Lab PB-A 320, IFT, University of Siegen [2.23].
The sensor gas calorimeter (SGC) basically consists of a classicalvolumetric gas adsorption device complemented by two gas thermometers(cp. Fig. 2.9). The core of the instrument is an adsorption vessel which isplaced within a second vessel, the sensor gas jacket. This jacket vessel isfilled with gas at pressure acting as a sensor via a capillary (1)connecting the vessel with a difference manometer (P3). Additionally, areference vessel also filled with the (same) sensor gas at pressure isplaced in the thermostat and connected via capillary (2) to the manometer(P3). Upon opening the valves (V7, V7A) the pressures of thesensor gases in the jacket vessel and the reference vessel are equalized, i. e.we have Thermal equilibrium at temperature (T*) in the system

100 Chapter 2
provided, these pressures remain to be equal and constant even after closingvalves (V7,V7A). Consequently, in thermal equilibrium there is a constantsignal at the difference manometer (P3).
However, if for any reason the temperature of the sensor gas in the jacketvessel is changed, so will be its pressure Hence the gas pressures onboth sides of the manometer (P3) will be different. This pressure differencesignal can be displayed and/or monitored by a supportingdata acquisition system. As the sensor gas pressure isdirectly related to the temperature of the sensor gas via its thermalequation of state it provides a direct indication of any change of thistemperature. Such a change my be caused by heat flowing from (or to) theadsorption vessel to (or from) the thermostat fluid via the sensor gas.
Figure 2.9. Schematic diagram of a sensor gas calorimeter (SGC), [2.23].

2. Volumetry / Manometry 101
Figure 2.10. Sensor gas calorimeter (SGC) for simultaneous measurements of adsorption
isotherms and enthalpies. © IFT, University of Siegen, 2003.
E-mail: [email protected]
The instrument is complemented by a gas reservoir and several solenoidvalves for the dozing of the gases coming from the gas reservoirs in order toadjust the sorptive gas pressure (p) inside the adsorption vessel. The capillary(3) connecting the adsorption vessel with valves and the sorptive gas reservoiroutside the thermostat has to be chosen carefully: diameter and length shouldbe such that the sorptive gas coming from the reservoir assumes thetemperature of the thermostat (T*), but also evacuation of the adsorptionvessel, which for example is necessary for activation processes of the sorbentmaterial, does not take too long or even becomes practically impossible.
Auxiliary equipment like vacuum system, thermostat, a data acquisitionsystem including a PC and safety installations also have to be provided.Depending on the specific surface and the density of the material used forexamination an amount between 0.5 g and 2g has to be filled into theadsorption vessel. At the beginning of an experiment the sample material isactivated by simultaneous evacuation and heating up of the adsorption vesseloutside the thermostat. For activated carbon sorbent materials temperaturesabout (100°C - 150°C) are recommended. For zeolite sorbent materials oftenactivation temperatures about (400°C) and even higher may be needed.

102 Chapter 2
Temperature gradients during heating up and cooling down of the sample aswell as the time of activation should be chosen carefully as they may haveconsiderable impact on the properties of the activated sorbent material. Afterthis pre-treatment procedure is completed the whole instrument has to beevacuated. Then sensor gas should be provided to the gas thermometers (1,2).After this the instrument is placed within the thermostat. When thermalequilibrium is reached valves (7,7A) are closed. At this moment the readingof the difference pressure gauge corresponding to equal pressures on bothsides of the instruments membrane is a stable signal providing the baseline ofany pressure signal measurement and hence also of any calorimetricmeasurement.
After filling the gas reservoir with an appropriate amount of sorptive gasthe adsorption process can be started by opening valve (V5). The sorptive gasis flowing from the reservoir via capillary (3) into the (evacuated) sorptionvessel. During this process it is important to make sure that the velocity of thegas flow is small enough to allow thermal equilibration of the gas temperatureto thermostat temperature (T*). Otherwise it would become difficult to set upa concise energy balance of the adsorption process as the enthalpy of theincoming sorptive gas would not be known exactly. As soon as the sorptivegas reaches the sorbent material prepared inside the adsorption vesseladsorption occurs and the heat of adsorption is released to the sorptive gas andthen transferred via the wall of the adsorption vessel to the sensor gas insidethe sensor gas vessel, cp. Fig. 1. As the temperature of the sensor gas isincreased due to this heat transfer so is its pressure compared to thepressure in the reference vessel Hence there is a pressure difference
which is monitored and registered by the differencepressure manometer (P3). Additionally, pressures at manometers (P1) and(P2) also are monitored allowing to determine the amount of gas adsorbed i. e.to evaluate the adsorption isotherm.
A numerical example for a pressure difference signal recorded during acalibration process of an SGC is given in Fig. 2.11. It shows an increase in itsfirst part reaching a maximum value after which it again approaches thebaseline i. e. its initial value indicating thermal equilibrium in the overallsystem. After this, sorptive gas again can be added to the adsorption vesselincreasing thus the inside pressure (p) and starting a new adsorption processwhich finally will lead to a new adsorption equilibrium at some higherpressure

5.2 Outline of Theory and Calibration
If heat is generated inside the adsorption vessel of the SGC, Fig. 2.9, itwill be transferred via the sensor gas to the surrounding thermostat fluid.According to the Newton-Fourier Law of heat transfer we have for the totalheat flow
Here K is an instrument parameter to be determined by calibrationexperiments; T = T(t) indicates the time dependent average temperature of thesensor gas and T* = const is the temperature of the thermostat fluidsurrounding the sensor gas jacket.* ) For an ideal sensor gas the temperature Teasily can be related to its pressure as
In (2.42) are the (constant) volume and mass of the sensor gas andits molar mass. Combining (2.41, 2.42) we get for the total heat released
during a process
As is the time dependent signal recorded by the pressuredifference manometer (P3, Fig. 2.9), with indicating the pressure inthe reference gas thermometer, the heat (Q) can be calculated from thisrelation by simple integration. As an example pressure signals asresponses to Ohm’s heat inputs of (0.5, 1.0, 1.5...5.0) J inside the adsorptionvessel are presented in Figure 2.11.
*) The Newton-Fourier Law (2.41) seems to be adequate for the heat transfer process from thesensor gas to the thermostat as long as there is no turbulent convection within the gas, i. e.for Grashof numbers [2.30, 2.31]. For situations with it has to begeneralized taking aftereffects, i. e. the history of the sensor gas temperature {T(s),
into account. This can be done by using the theory of Linear Passive Systems (LPS), cp.Chap. 6 and the literature cited there. Details will be published in a forthcoming paper[2.32].
2. Volumetry / Manometry 103

104 Chapter 2
Figure 2.11. Calibration experiments of the sensor gas calorimeter (SGC). Ohm’s heat of (0.5,1.0, 1.5 ... 5.0) J is supplied by electric heating inside the adsorption vessel. Thecorresponding pressure signals increase in height and size with increasing heatinput. The area below these curves is direct proportional to the total heat suppliedto the SGC. Sensor gas used: 5.0, p* = 0.15 MPa, T* = 298 K.
The monotonously decreasing curves at the left side present the input ofelectric power in (mW), their time integral the total electric energy supplied tothe system. The curves showing a maximum are the pressure signalscorresponding to the respective electric energy / Ohm’s heat signals. It shouldbe observed that the time scales related to the electric power input (upperscale) and the pressure signal (lower scale) are not identical, but for sake ofgraphical presentation differ by a factor 8. As indicated by Eq. (2.43) the area

below the signal pressure curves and the total Ohm’s heatsupplied (Q) are linearly related, i. e. we have The respectivecorrelation of all curves depicted in Fig. 2.11 is shown in Fig. 2.12.
Figure 2.12. Linear correlation of the so-called peak area A, Eq. (2.44) and its actuallymeasured reduced value A*
*
= A – 0.525 kPas, to the total Ohm’s heat (Q) suppliedduring calibration experiments, [2.23]. The statistical, i. e. least square correlationfunction is indicated in the diagram together with the correlation coefficient (R).Sensor gas: 5.0, p* = 0.16 MPa, T* = 298 K, [2.23].
As data recording during all calibration experiments was always stoppedafter only a certain portion (A*) of the total peak area (A) could beobserved, i. e. we have
At the time all pressure signals were at the detection limit ofthe difference manometer. Hence one could expect to assume the samenumerical value for all experiments performed. This holds true, indeed, andthe least square minimization of all data taken led to for theset of experiments shown in Figure 2.11.
2. Volumetry / Manometry 105

106 Chapter 2
5.3 Example
Integral heats of adsorption and Gibbs excess masses of n-butaneadsorbed on activated carbon (AC BAX 1100) have been measuredsimultaneously in a SGC at various temperatures for pressures up to 0.2 MPa.Results are sketched in Figures 2.13-2.15. In Fig. 2.13 the Gibbs excessadsorption isotherms are shown for temperatures 273 K, 298 K, 323 K, 343 K.Data were correlated by generalized isotherms of Langmuir type taking intoaccount the fractal character and the energetic heterogeneity of the sorbentmaterial, cp. Chap. 7, Sect. 2.1. Experimental uncertainties are about threetimes of the size of the graphical symbols of the data points in the figure.
Figure 2.13. Adsorption isotherms of n-butane on activated carbon (AC BAX 1100) at
temperatures T = 273 K, 298 K, 323 K, 343 K for pressures up to 0.2 MPa.
In Figure 2.14 the integral heats of adsorption cp. (2.36)) per unitmass of sorbent are shown as functions of the Gibbs excess mass ofn-butane adsorbed. Data were taken for 4 temperatures. Measurements at T =323 K were performed twice. Uncertainties of data are about three times thesize of the graphical symbols presenting data points. The experimentsperformed with the GSC so far indicate that the sensitivity of measurementsdecreases with increasing temperature but increases with decreasing thermalconductivity of both the sorptive gas and the sensor gas used in the SGC.

Figure 2.14. Integral heat of adsorption of n-butane per unit mass of sorbent (AC
BAX 1100), as function of the Gibbs excess mass of n-butane adsorbed
for temperatures T = 273 K, 298 K, 323 K, 343 K and corresponding pressures up
to 0.2 MPa.
In Figure 2.15 integral and differential heats of adsorption (2.36),(2.38)) of n-butane on activated carbon ( AC BAX 1100) are presented asfunction of the Gibbs excess amount of n-butane adsorbed per unit mass ofsorbent. Measurements refer to T = 25 °C and Data of theintegral heat of adsorption were correlated by a polynom of order 5,leading by differentiation to the correlation line of the differential heats ofadsorption
Uncertainties of are about 3 times the size of the graphicalsymbols representing the data, but of about 6 times the size of therespective symbols
The differential heats of adsorption decrease with increasing amountsof n-butane adsorbed approaching values of about 40 kJ/mol nearsaturation pressure (298 K) = 0.22 MPa which is about twice the value ofthe heat of condensation Approximate values of
2. Volumetry / Manometry 107

108 Chapter 2
have been calculated via Eq. (2.37) from adsorption isotherm measurementsat two different temperatures.
Figure 2.15. Differential and integral heats of adsorption of n-butane on
activated carbon (AC BAX 1100) at T = 298 K for pressures up to 0.2 MPa. The
correlation line for is calculated by differentiation of the order
polynomial correlation function of the integral heats of adsorption
Resulting data are deviating from direct measurement data by up to 30 %at low and 10 % - 20 % at higher adsorption loads. Hence we relinquish topresent them here but recommend direct calorimetric measurements ifaccurate and reliable enthalpy data are needed [2.2, 2.28].
In conclusion it can be said, that the sensor gas calorimeter (SGC) is avery useful instrument for simultaneous measurements of adsorptionisotherms and (integral and differential) heats of adsorption. Also hints on thekinetics of the gas adsorption process can be gained from the time dependenceof the pressure signal curve, cp. Fig. 2.11. However, to achieve highsensitivity and accuracy of measurements, type and amount of the sensor gashave to be chosen very carefully. At low temperatures (77 K) helium isrecommended at reference pressures of about (0.1 – 0,2) MPa. At highertemperatures (298 K) nitrogen should be preferred at the same pressures,[2.23, 2.29].

6. PROS AND CONS OF VOLUMETRY /MANOMETRY
In this section we will discuss some of the advantages and disadvantagesof the volumetric or manometric method of measuring gas adsorptionequilibria as they have appeared to us after more than 20 years ofexperimental work in this field.
6.1 Advantages
1.
2.
SimplicityVolumetric gas adsorption instruments are fairly simple and do notrequire sophisticated high tech equipment, cp. Figs. 2.1, 2.6. Also theexperiment in itself is simple - opening of a valve between gas storageand adsorption chamber. Therefore, volumetric instruments easily can beautomated and run without permanent supervision for hours and days[2.3, 2.4]. To achieve this it is recommended that every instrument isequipped with its own personal computer (PC) for data handling, storageand transmission. For screen based operation and control the program“Lab View” (Version 6.1) has proved to be very useful. Combined withthe program “PC Anywhere” it could allow remote operation of themeasuring instrument from nearly any place around the world.
Measuring techniquesVolumetric measurements of gas adsorption equilibria reduce, if themass of the sorbent sample used has been determined, to measurementsof pressures and temperatures in gas phases. For this a variety of highprecision measuring instruments operating in a fairly wide range andpartly also in corrosive environment are available today. Of course theseinstruments prior to measurement have to be calibrated with meticulouscare which may be laborious and even cumbersome. For pressuremeasuring devices, calibration with pressure maintaining valves ofDesgranges & Huot has proved to be successful.
6.2 Disadvantages
1. Amount of sorbent materialFor volumetric measurements of technical gas-sorbent equilibria acertain amount of sorbent material is needed, usually several grams. Thisis caused by the fact that only then considerable changes in the gaspressure which are due to adsorption can be observed. If only tiny
2. Volumetry / Manometry 109

110 Chapter 2
amounts – say several milligrams – of the sorbent are available,gravimetric measurements are strongly recommended.
2.
3.
4.
Approach to equilibriumGas adsorption processes may last for seconds, hours or – sometimes –even days. Therefore one never can be sure whether mermodynamicequilibrium in a volumetric experiment has been realized. Hence thetime which should elapse between opening the expansion valve andreading of instruments, especially thermometer and manometer has tobe chosen according to experience or accompanying gravimetricmeasurements which – contrary to volumetry / manometry – alsoprovide information on the kinetics or the sorption process, cp. Chap. 3.
Wall sorptionUpon expansion from the storage vessel the sorptive gas may not onlybe adsorbed on the surface of the sorbent material but also on the wallsof the adsorption vessel and the tube connecting both vessels. This maycause additional uncertainties in measurement. These often but notalways can be reduced by performing complementary experiments withgas expansion to the empty adsorption chamber including no sorbentmaterial at all. To reduce wall adsorption electropolishing of all innersurfaces is recommended. An experiment allowing to determine walladsorption is described in Chapter 4, Sect. 3.6.
Uncertainties in step-up experimentsIn step-up pressure experiments, i. e. gas expansion and adsorptionprocesses with remnant gas in the adsorption chamber, cp. Figs. 2.1,2.6, the uncertainties of the adsorbed mass accumulate due to thealgebraic structure of the sorptive gas mass balance equation
Here indicates the mass of gas added to the storage vessel in
step (n+1) at closed expansion valve. The quantities are themasses of the gas in the sorptive phase and of the adsorbed phase at theend of the n-th experiment respectively. Note that for step-upadsorption experiments whereas for step-down desorption
experiments In practice the total number of steps shouldnot exceed 3-4 as then uncertainties of about 20 % and more typicallyoccur.

5. In situ activation proceduresPrior to adsorption experiments the sorbent sample should be activatedby heating the adsorption chamber to (say) 420 K for activated carbons,670 K for zeolites, degassing etc. During this procedure the mass ofsorbent is changed by typically 1 % or more. This change normally cannot be included in volumetric experiments but must be taken into accountafterwards, at least approximately.
Volumetric / manometric adsorption experiments do not give information onthe kinetics of the process; they are not useful at extreme low or highpressures as pressure measurements in these regions become difficult andaccurate EOS of the sorptive gases not always are available. Also there maybe problems with the thermostatization of the vessels as during expansion thegas (normally) is cooled down due to the Joule-Thomson-effect and it willtake some time till heat transfer (and radiation) bring both sorbent andsorptive gas to the same temperature again. This is especially important fordesorption experiments which will take even longer till thermal equilibrium isreached [2.7, 2.20].
7. LIST OF SYMBOLS
A collection of most of symbols used in this Chapter including their SI-units is given.
kg
kg
kg
kg
kg
Gibbs excess mass of an adsorbed phase
mass of component i = 1 . . .N of a sorptivegas mixture supplied to the storage vesselprior to adsorption
mass of component i = 1...N beingadsorbed on a certain mass of sorbent
mass of component i = 1 . . .N of a sorptivegas in an adsorption equilibrium state
Gibbs excess mass of component i of anadsorbed phase
2. Volumetry / Manometry 111

112 Chapter 2
p
R=8.314
T
kg
kg
kg
g/mol
g/mol
mol
mol
Pa
J/Kmol
1
K
1
mass of sorptive gas in storage vessel priorto adsorption
mass of adsorbate on the surface of a certainmass of sorbent
mass of fluid, i. e. gaseous or liquid sorptivephase
molar mass of helium
molar mass of component i = 1...N of asorptive gas mixture
number of mols in a gas mixture filled in thestorage vessel prior to adsorption
number of mols of a sorptive gas mixture ina gas-adsorption equilibrium state
pressure of sorptive gas
universal gas constant
selectivity of component i relative tocomponent k in a multi-component gas-adsorption equilibrium state
absolute temperature
volume of sorption chamber
volume of the combined sorbate and sorbentsystem
volume of storage vessel
volume of a (porous) sorbent measured byhelium expansion experiments
mass concentration of component i in anadsorbed phase

x
Z
[x]
[x]
1
[x]
1
1
1
1
measurable physical quantity
mean value of a measurable quantity x
molar concentration of component i in anadsorbed phase
experimental uncertainty of the numericalvalue of a measurement of the
quantity (x)
molar concentration of component i = 1 ...Nin a sorptive gas mixture
molar concentration of component i = 1 ...Nin a sorptive gas mixture supplied to thestorage vessel prior to adsorption
compressibility or real gas factor
compressibility or real gas factor of helium
density of a sorptive gas
density of a sorptive medium in a liquidreference state
density of pure component i of a sorptive ina reference liquid state
dispersion, variance or mean statisticaldeviation (MSD) of a measurable quantity(x)
reduced mass of adsorbed phase measuredvolumetrically, cp. eqs. (2.4, 2.5)
2. Volumetry / Manometry 113

114 Chapter 2
REFERENCES
[2.1]
[2.2]
[2.3]
[2.4]
[2.5]
[2.6]
[2.7]
[2.8]
[2.9]
[2.10]
Pohl R. W.Experimentalphysik, Vol. 1, Mechanik, Akustik, WärmelehreSpringer, Berlin etc., 1954.
Rouquerol F., Rouquerol J., Sing K.S.W.Adsorption by Powders and Porous Solids, Academic Press, San Diego, USA, 1999.
Keller J. U., Robens E., von Hohenesche Cedric du FresneThermogravimetric and Sorption Measurement Techniques / Instruments,Proceedings of 6th Int. Symposium on the Characterization of Porous Solids (COPSVI), Alicante, Spain, May 8-11, 2002, Studies in Surface Sciences and Catalysis,Vol. 144, F. Rodriguez-Reinoso et al., Eds., p. 387-394, Elsevier,New York etc., 2003.
Keller J. U., Robens E.A Note on Sorption Measuring Instruments,Proceedings of the Int. Conf. on Vacuum Microbalance Technology, Lexica Ltd.,J. of Thermal Analysis and Calorimetry, 71 (2003), 37-45.
Keller J. U., Dreisbach F., Rave H., Staudt R., Tomalla M.Measurement of Gas Mixture Adsorption Equilibria of Natural Gas Compounds onMicroporous Sorbens,Adsorption, 5 (1999), 199-214.
Dreisbach F., Staudt R., Keller J. U.High Pressure Adsorption Data of Methane, Nitrogen, Carbon Dioxide and theirBinary and Ternary Mixtures on Activated CarbonAdsorption, 5 (1999), 215-227.
Staudt R.Gasadsorption, Ingenieurwissenschaftliche Grundlagen, Messmethoden zurBestimmung und Modelle zur Beschreibung von Adsorptionsgleichgewichten reinerGase und Gasgemische an porösen Stoffen,Habilitationsschrift, IFT, University of Siegen, Siegen, 2000.
Staudt R., Bohn S., Dreisbach F., Keller J. U.Gravimetric and Volumetric Measurements of Helium Adsorption Equilibria onDifferent Porous Solids, p. 261-266,Proceedings of IV Conference on Porous Solids, COPS IV, Bath UK, 1996, B. McEnany et al., Eds., The Royal Society of Chemistry, Special Publ. No. 213,London, 1997.
Reid R.C., Prausnitz J. M., Poling B. E.The properties of Gases and LiquidsMc Graw Hill, New York etc., 1983.
Sengers J. U., Kayser R. F., Peters C. J., White H. J., Eds.Equations of state for Fluids and Fluid Mixtures, 2 Vs.IUPAC Physical Chemistry Division,Commission on Thermodynamics, Elsevier, Amsterdam etc., 2000.

[2.11]
[2.12]
[2.13]
[2.14]
[2.15]
[2.16]
[2.17]
[2.18]
[2.19]
[2.20]
International Union of Pure and Applied ChemistryPhysical Chemistry Division, Commission of Thermodynamics,International Thermodynamic Tables of the Fluid State – Nos. 1, 2, 3..., PergamonPress, Oxford, UK, 1970 - ...
DECHEMA, e. V.DETHERM, DECHEMA Chemistry Data SeriesDatabase, Version 1.4 (December 2000)Frankfurt Main, Germany, 2000, Cp. also: www.dechema.de
Wagner W., de Reuck M.International thermodynamic tables of the fluid state – 13, methane, BlackwellScience, Oxford, 1996.
Wagner W., Pruß A.The IAPWS formulation 1995 for the thermodynamic properties of ordinary watersubstance for general and scientific use. J. Phys. Chem. Ref. Data 31(2002), 387-535.
Span R., Wagner W.Equations of state for technical applications.I.
II.
Simultaneously optimized functioned forms for nonpolar and polar fluids.Accepted for publication in Int. J. Thermodynamics 23 (2002).Results for nonpopular fluids. NAL.Accepted for publication in Int. J. Thermodynamics 23 (2002).
International Organization for Standardization, ISOGuide to the expression of uncertainty in measurement,
Printing, 1995, CH – 1211 Geneva
American Society Mechanical Engineers, ASMEInstruments and Apparatus, Pt. 2, “Measurement Uncertainty”ANSI / ASME PTC 19.1, New York, 1985.
Gränicher W. H. H.Messung beendet - was nun?Einführung und Nachschlagewerk für die Planung und Auswertung von Messungen,Hochschulverlag AG an der ETH Zürich,B. G. Teubner Stuttgart, 2. Aufl., 1996.
Schein E.Optimierung eines Wärmeleitungsgasdruckkalorimeters zur simultanen Messung derGasadsorption und Wärmetönung für 298,15 K,Diploma Thesis, Dept. Chemistry, University of Siegen, 2001,pdf-file available from the author.
Tomalla M.Experimentelle Untersuchung der Koadsorptionsgleichgewichte von und
an Aktivkohle bei T = 298 K im Bereich p = 0 - 12 MPa,PHD-Thesis, Institute of Fluid- and Thermodynamics, University of Siegen, 1994.
2. Volumetry / Manometry 115
116 Chapter 2
[2.21]
[2.22]
[2.23]
[2.24]
[2.25]
[2.26]
[2.27]
[2.28]
[2.29]
[2.30]
[2.31]
[2.32]
Hufton J.R., Mayorga S., Sircar S.Sorption-Enhanced Reaction Process for Hydrogen Production,AIChE Journal, 45 (1999), p. 248, also as paper 157 c at 1998 Annual AIChEMeeting, Miami Beach, Fl., USA.
Buch R. et al.Solar-Hybrid Gas Turbine-Based Power Tower System (REFOS),Proceedings of Solar Forum 2001, Solar Energy: The Power to Choose,April 2001, Washington D. C.
Zimmermann W., Keller J. U.A new calorimeter for simultaneous measurements of isotherms and heats ofadsorption, Thermochimica Acta, 405 (2003), p. 31-41.
Schottky W., Ulrich H., Wagner C.Thermodynamik (in German),Reprint of the 1929 Edition, Springer, Berlin (West), 1973.
Guillot A., Stoeckli F., Banguil Y.The Microporosity of Activated Carbon Fibre KF 1500 Assessed by CombinedAdsorption and Calorimetry Techniques and by Immersion Calorimetry,Adsorption, Science & Technology, 18 (2000), p. 1-14.
Kast W.Adsorption aus der Gasphase, Ingenieurwissenschaftliche Grundlagen undtechnische Verfahren, Verlag Chemie, Weinheim, Germany, 1988.
Webb P. A., Orr C.Analytical Methods in Fine Particle Technology,Micromeritics Inc., Norcross, GA, 1997.
Hemminger W., Höhne G.Grundlagen der Kalorimetrie,Verlag Chemie, Weinheim, Germany, 1979.
Langer W.Ein Wärmeleitungs-Gasdruck-Kalorimeter und die simultane Messung vonIsothermen und Wärmen der Adsorption von an Ph-D thesis, Dept. ofChemistry & Biology, University of Siegen, Siegen, 1994.
Schlichting H.Boundary Layer Theory, Ed. Mc Graw Hill, New York etc., 1979.
Baehr D., Stephan K.Wärme- und Stoffübertragung (in German)
Ed., Springer, Berlin etc., 1996.
Keller J. U., Zimmermann W.The Gas Sensor Calorimeter, Theoretical Analysis and Calibration Experiments,Thermochimica Acta, in preparation, 2004.