Chapter 12 OISE IN LECTROPHYSIOLOGICAL...
30
AXON GUIDE Chapter 12 NOISE IN ELECTROPHYSIOLOGICAL MEASUREMENTS In the most general sense, noise can be defined as any disturbance that interferes with the measurement of the desired signal. In electrophysiological measurements, such disturbances can arise from the preparation itself, the electrodes that couple the preparation to the measurement instrument, the electronic instrumentation (e.g., voltage-clamp amplifier, patch-clamp amplifier), interference from external sources (e.g., electrostatic and electromagnetic coupling between the circuitry and 50 or 60 Hz power lines, fluorescent lights, video monitors, and noise associated with mechanical vibrations), and, if the data is digitized (as is usually the case), from the digitization process itself (e.g., quantizing noise, aliasing). We will begin by discussing the basic noise mechanisms that arise from the physics of the materials and devices that comprise the electrical system. Interference from external sources and noise associated with digitization will be considered later. The main fundamental types of noise are: thermal noise, shot noise, dielectric noise, and "excess" noise (e.g., 1/f noise). These types of noise form the basis for a discussion of amplifier noise and electrode noise. All the fundamental types of noise are completely random in nature. Their average properties can be measured, but their actual values at any particular instant in time cannot be predicted. The most convenient measure of the amplitude of noise is its root-mean-square (rms) value. Many noise processes have a Gaussian distribution of instantaneous amplitudes versus time. The area under the Gaussian distribution represents the probability that a noise event of a particular amplitude will occur (the total area is unity). The probability that a noise peak will exceed plus or minus one times its rms value is 0.32; the probability of a particular noise peak exceeding plus or minus three times its rms value is 0.003. It is common engineering practice to define peak-to- peak noise as 6 times the rms value; if the noise process has Gaussian distribution, the noise will remain within this bound 99.7% of the time. However, peak-to-peak noise is not as clearly defined as is rms noise, and it is not uncommon to find peak-to-peak noise operationally defined as anything from 5 times to 8 times rms. When considering noise in the time domain, it is important to know the bandwidth over which the noise process is observed. Noise is made up of many frequency components, frequently extending from DC to many megahertz or gigahertz. Some noise processes are naturally
Transcript of Chapter 12 OISE IN LECTROPHYSIOLOGICAL...

A X O N G U I D E
Chapter 12
NOISE IN
ELECTROPHYSIOLOGICAL MEASUREMENTS
In the most general sense, noise can be defined as any disturbance that interferes with themeasurement of the desired signal. In electrophysiological measurements, such disturbances canarise from the preparation itself, the electrodes that couple the preparation to the measurementinstrument, the electronic instrumentation (e.g., voltage-clamp amplifier, patch-clamp amplifier),interference from external sources (e.g., electrostatic and electromagnetic coupling between thecircuitry and 50 or 60 Hz power lines, fluorescent lights, video monitors, and noise associatedwith mechanical vibrations), and, if the data is digitized (as is usually the case), from thedigitization process itself (e.g., quantizing noise, aliasing).
We will begin by discussing the basic noise mechanisms that arise from the physics of thematerials and devices that comprise the electrical system. Interference from external sources andnoise associated with digitization will be considered later.
The main fundamental types of noise are: thermal noise, shot noise, dielectric noise, and"excess" noise (e.g., 1/f noise). These types of noise form the basis for a discussion of amplifiernoise and electrode noise.
All the fundamental types of noise are completely random in nature. Their average propertiescan be measured, but their actual values at any particular instant in time cannot be predicted.The most convenient measure of the amplitude of noise is its root-mean-square (rms) value.Many noise processes have a Gaussian distribution of instantaneous amplitudes versus time. Thearea under the Gaussian distribution represents the probability that a noise event of a particularamplitude will occur (the total area is unity). The probability that a noise peak will exceed plusor minus one times its rms value is 0.32; the probability of a particular noise peak exceeding plusor minus three times its rms value is 0.003. It is common engineering practice to define peak-to-peak noise as 6 times the rms value; if the noise process has Gaussian distribution, the noise willremain within this bound 99.7% of the time. However, peak-to-peak noise is not as clearlydefined as is rms noise, and it is not uncommon to find peak-to-peak noise operationally definedas anything from 5 times to 8 times rms.
When considering noise in the time domain, it is important to know the bandwidth over whichthe noise process is observed. Noise is made up of many frequency components, frequentlyextending from DC to many megahertz or gigahertz. Some noise processes are naturally

236 / Chapter twelve
restricted in bandwidth, but most require the appropriate use of filtering to restrict the bandwidthof the noise while allowing adequate resolution of the signal. When a noise amplitude (rms orpeak-to-peak) is discussed, it is appropriate to also note the bandwidth over which the noise isobserved and the type of filter that has been used to restrict the bandwidth.
Due to the random nature of noise, uncorrelated noise sources will add in an rms fashion. Thusif E1, E2, and E3 are the rms values of three uncorrelated noise sources, the total rms noise, ET, ofthese sources together is given by:
E E E ET = + +12
22
32 (1)
Because of this relationship, the largest individual source of noise will tend to dominate the totalnoise. For example, if two noise sources with rms values of 100 µV and 20 µV are addedtogether, the resulting noise will have an amplitude of (100 µV)2 + (20 µV)2 1/2 = 102 µV rms.
Thermal Noise
Thermal noise results from random motion of thermally excited charge carriers in a conductor. Itis often referred to as Johnson noise or Nyquist noise. For a resistor, thermal noise can berepresented as a series voltage noise source or a parallel current noise source as illustrated inFigure 12-1. These two representations are equivalent.
E th
E = (4kTRB)th1/2
R (noiseless)
R (noiseless) th1/2
I = (4kTB/R)
Figure 12-1. Noise Equivalent Circuits of a Resistor
The power spectral density (PSD) of thermal noise is white, i.e., it does not vary with frequency.Its value, SthV
2 , is given as a voltage noise by:
SthV2 = 4kTR (units: Volt2/Hz) (2)
or, equivalently, as a current noise PSD, SthI2 , by:
SkT
RthI2 4= (units: Amp2/Hz) (3)
where k is Boltzmann's Constant (1.38 x 10⁻²³ J/°K), T is the absolute temperature in degreesKelvin (°K = °C + 273), and R is the resistance in ohms. It should be noted that spectraldensities are also often expressed in units of Volt/√Hz and Amp/√Hz.

Noise in Electrophysiological Measurements / 237
A X O N G U I D E
The variance (also called the noise power) over a bandwidth B (units: Hz) is then:
Eth2 = 4kTRB (units: Volt2) (4)
or
IkTB
Rth2 4= (units: Amp2) (5)
The rms noise over a bandwidth B is given by:
E kTRBth = 4 (units: Volt rms) (6)
or
IkTB
Rth = 4 (units: Amp rms) (7)
Spectral densities, rms current and voltage noise for bandwidths of 1 and 10 kHz are listed inTable 12-1 for resistances of 100 Ω to 100 GΩ. Note that while thermal voltage noise increaseswith increasing resistance, thermal current noise decreases as the resistor's value increases.
1 kHz 10 kHz 1 kHz 10 kHz Voltage CurrentV noise V noise I noise I noise Density Density
(µV rms) (µV rms) (pA rms) (pA rms) (nV/√Hz) (pA/√Hz)Value100 Ω 0.040 0.126 400 1260 1.26 12.6
1 kΩ 0.126 0.40 126 400 4.0 4.010 kΩ 0.4 1.26 40 126 12.6 1.26
100 kΩ 1.26 4.0 12.6 40 40 0.41 MΩ 4.0 12.6 4.0 12.6 126 0.126
10 MΩ 12.6 40 1.26 4.0 400 0.040100 MΩ 40 126 0.40 1.26 1260 0.0126
1 GΩ 126 400 0.126 0.40 4000 0.00410 GΩ 400 1260 0.040 0.126 12600 0.0013
100 GΩ 1260 4000 0.013 0.040 40000 0.0004
Table 12-1. Thermal Noise of Resistors
Shot Noise
Shot noise arises when current flows across a potential barrier, e.g., a p-n junction in asemiconductor device. Since potential barriers are not present in simple resistive elements,resistors do not display shot noise. Over a bandwidth B, the rms value of the shot noise currentis given by:

238 / Chapter twelve
I qIBsh = 2 (units: Amp rms) (8)
where q is the charge of the elementary charge carrier (for electrons q = 1.6 x 10⁻¹⁹ coulomb)and I is the DC current in Amps.
An important example of shot noise is the equivalent input current noise of an operationalamplifier that arises from its input bias current Ib (also referred to as gate current for FET1 inputdevices). For bipolar transistor input devices, Ib is typically in the range of 1 nA to 1 µA; forFET input operational amplifiers, Ib (at room temperature) is typically in the range of 1 to 10 pA,and can be less than 0.5 pA for special devices. The rms value of shot noise for operationalamplifiers with Ib ranging from 0.1 pA to 1 µA in a 1 and 10 kHz bandwidth are listed inTable 12-2. In capacitive-feedback patch voltage-clamp amplifiers (e.g., the Axopatch 200series), shot noise current from the headstage amplifier sets the noise floor at low-to-moderatefrequencies. By design these devices display very low levels of shot noise; selected units canhave gate currents as low as 0.2 pA, resulting in low-frequency current noise less than that of a250 GΩ resistor.
Op Amp Bias Current 1 kHz Shot Noise 10 kHz Shot Noise(pA rms) (pA rms)
1 µA 18 57100 nA 5.7 1810 nA 1.8 5.71 nA 0.57 1.8
100 pA 0.18 0.5710 pA 0.057 0.181 pA 0.018 0.0570.1 pA 0.0057 0.018
Table 12-2. Shot Noise
Dielectric Noise
An ideal lossless capacitor does not produce thermal noise. However, all real dielectric materialsdisplay some loss that results in the generation of thermal noise. For dielectrics with relatively
low losses, the spectral density of this noise SD2
can be described in terms of the dissipationfactor D and the capacitance CD of the dielectric:
SD2 = 4kTDCD(2πf) (units: Amp2/Hz) (9)
Where f is the frequency in Hz. The PSD of dielectric noise characteristically rises linearly withincreasing frequency. The dissipation factor is often listed as tan δe where δe is the loss angle(note that for small δe, tan δe ≈ δe); the "quality factor" Q is the inverse of D (Q = 1/D). Fora bandwidth extending from DC to an uppermost cut-off frequency B, the rms noise current ID,resulting from a lossy dielectric, is given by:
1FET is Field Effect Transistor
Noise in Electrophysiological Measurements / 239
A X O N G U I D E
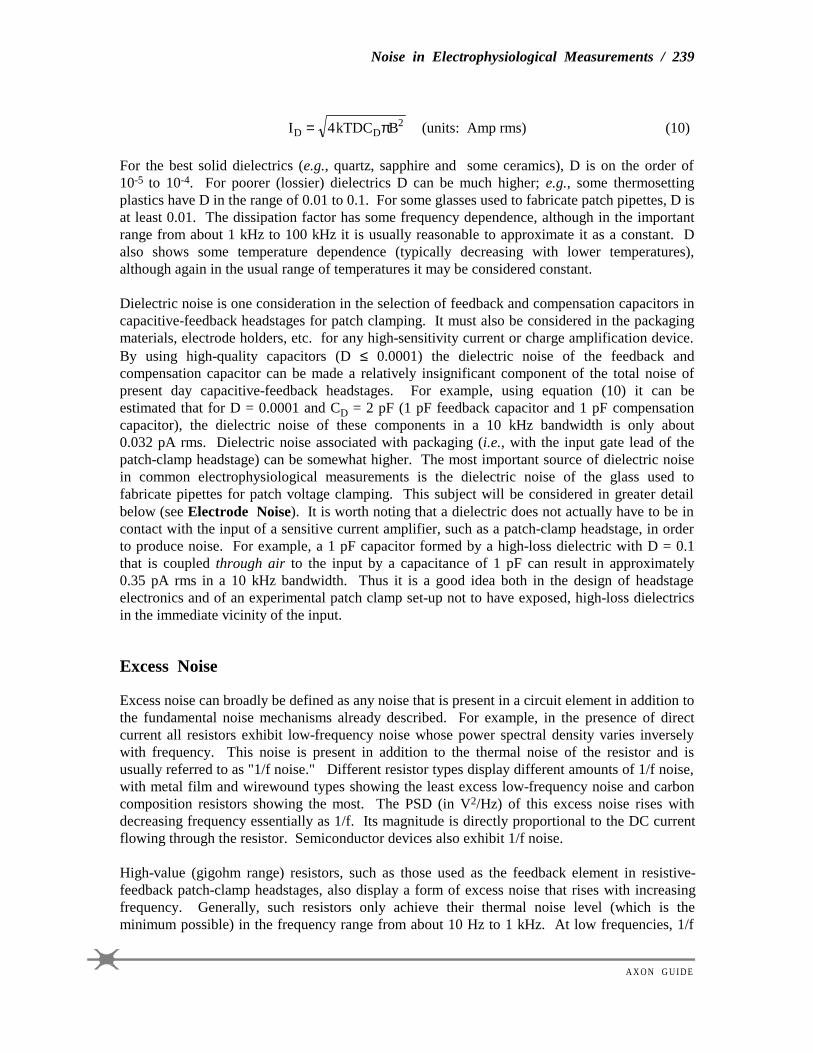
I kTDC BD D= 4 2π (units: Amp rms) (10)
For the best solid dielectrics (e.g., quartz, sapphire and some ceramics), D is on the order of10-5 to 10-4. For poorer (lossier) dielectrics D can be much higher; e.g., some thermosettingplastics have D in the range of 0.01 to 0.1. For some glasses used to fabricate patch pipettes, D isat least 0.01. The dissipation factor has some frequency dependence, although in the importantrange from about 1 kHz to 100 kHz it is usually reasonable to approximate it as a constant. Dalso shows some temperature dependence (typically decreasing with lower temperatures),although again in the usual range of temperatures it may be considered constant.
Dielectric noise is one consideration in the selection of feedback and compensation capacitors incapacitive-feedback headstages for patch clamping. It must also be considered in the packagingmaterials, electrode holders, etc. for any high-sensitivity current or charge amplification device.By using high-quality capacitors (D ≤ 0.0001) the dielectric noise of the feedback andcompensation capacitor can be made a relatively insignificant component of the total noise ofpresent day capacitive-feedback headstages. For example, using equation (10) it can beestimated that for D = 0.0001 and CD = 2 pF (1 pF feedback capacitor and 1 pF compensationcapacitor), the dielectric noise of these components in a 10 kHz bandwidth is only about0.032 pA rms. Dielectric noise associated with packaging (i.e., with the input gate lead of thepatch-clamp headstage) can be somewhat higher. The most important source of dielectric noisein common electrophysiological measurements is the dielectric noise of the glass used tofabricate pipettes for patch voltage clamping. This subject will be considered in greater detailbelow (see Electrode Noise). It is worth noting that a dielectric does not actually have to be incontact with the input of a sensitive current amplifier, such as a patch-clamp headstage, in orderto produce noise. For example, a 1 pF capacitor formed by a high-loss dielectric with D = 0.1that is coupled through air to the input by a capacitance of 1 pF can result in approximately0.35 pA rms in a 10 kHz bandwidth. Thus it is a good idea both in the design of headstageelectronics and of an experimental patch clamp set-up not to have exposed, high-loss dielectricsin the immediate vicinity of the input.
Excess Noise
Excess noise can broadly be defined as any noise that is present in a circuit element in addition tothe fundamental noise mechanisms already described. For example, in the presence of directcurrent all resistors exhibit low-frequency noise whose power spectral density varies inverselywith frequency. This noise is present in addition to the thermal noise of the resistor and isusually referred to as "1/f noise." Different resistor types display different amounts of 1/f noise,with metal film and wirewound types showing the least excess low-frequency noise and carboncomposition resistors showing the most. The PSD (in V2/Hz) of this excess noise rises withdecreasing frequency essentially as 1/f. Its magnitude is directly proportional to the DC currentflowing through the resistor. Semiconductor devices also exhibit 1/f noise.
High-value (gigohm range) resistors, such as those used as the feedback element in resistive-feedback patch-clamp headstages, also display a form of excess noise that rises with increasingfrequency. Generally, such resistors only achieve their thermal noise level (which is theminimum possible) in the frequency range from about 10 Hz to 1 kHz. At low frequencies, 1/f

240 / Chapter twelve
noise is observed, and at high frequencies the noise PSD typically rises as f α, where α is usuallyin the range of 1 to 2. This noise can result in rms noise from a resistor having several times thepredicted thermal noise value in a 10 kHz bandwidth. The elimination of this noise source is oneof the motivations behind using capacitive-feedback in patch clamps such as the Axopatch 200series.
Amplifier Noise
The intrinsic noise of an operational amplifier can be described by an equivalent input voltagenoise En in series with the negative (-) input and an equivalent input current noise In between thepositive (+) and negative (-) inputs (see Figure 12-2). These noise sources have been referred tothe input for convenience of analysis. It should be noted, however, that they are measured at theoutput. For example, in an open-loop situation (such as shown in Figure 12-2), if the inputs aregrounded, the voltage at the negative (-) input will be zero (ground). En must be inferred bymeasuring the output noise voltage and dividing it by the open-loop gain (both are frequencydependent) of the amplifier. On the other hand, in a closed-loop situation (which is always thecase when using operational amplifiers, as illustrated in Figure 12-3), En will actually appear atthe negative (-) input due to the action of the feedback loop.
E n
I n
Figure 12-2. Operational Amplifier Noise Model
en
i n
e f
Cg
R f
C U R R E N TINPUT
Figure 12-3. Noise Model of a Simplifier Current-to-Voltage Converter

Noise in Electrophysiological Measurements / 241
A X O N G U I D E
When analyzing the noise of an operational circuit it is convenient to consider the noise sourcesin terms of their power spectral densities. In this case the noise sources will be denoted by lowercase symbols, e.g., en(f) (units: V/√Hz) or en2(f) (units: V2/Hz). As a useful example of noiseanalysis in an operational circuit, consider the simplified current-to-voltage converter illustratedin Figure 12.3. In this circuit en and in are the input voltage and current noise PSDs, respectively,and ef is the PSD of the noise (thermal and excess) of the feedback resistor Rf. The current to bemeasured is introduced at the terminal labeled "input." For simplicity, the positive (+) input isshown to be grounded. Cg is any capacitance between the negative (-) input and ground; thisincludes the input capacitance of the amplifier plus strays and is usually about15 pF. The noise PSD at the output of the IV converter, Sout
2(f), can be shown to be:
S f i R e e f R Cout n f f n f g2 2 2 2 2 2 2 2 21 4( ) ( )= + + + π (units: V2/Hz) (11)
It is useful to present this result in terms of current so it can be compared directly with thecurrent signal being measured. This is accomplished by dividing the above expression by Rf
2,thus referring the noise to the input. The input referred PSD, Sin
2(f), is then given by:
S f ie
Re
Rf Cin n
f
fn
fg
2 22
22
22 2 21
4( ) ( )= + + + π (units: Amp2/Hz) (12)
In general, in, en and ef are all functions of frequency: in is the shot noise of the input gatecurrent of the amplifier but usually displays some 1/f behavior at low frequencies; ef is thethermal and excess noise of Rf; and en also displays 1/f behavior at low-to-moderate frequencies.Nevertheless, it is convenient to assume that each of these terms is independent of frequency sothat equation (12) can be easily integrated over a frequency band (for instance, DC to someuppermost bandwidth denoted by B). The square root of this result is then the rms noise for thebandwidth B:
I i Be
RB e
B
RC Bin n
f
fn
fg= + + +2
2
22
22 2 34
3π (13)
It should be noted that if it is assumed that ef is only the thermal noise of the feedback resistor,then the term ef
2/Rf 2 is simply 4kT/Rf (see equation (3) above).
It is instructive to consider the relative magnitudes of the various terms in equation (12) or (13).In the case of a patch voltage clamp, the value of Rf is selected to be very high, both to provideadequate gain to resolve tiny (pA) currents and to minimize the noise contribution of thisresistor; 50 GΩ is common for single-channel recording. The PSD of the thermal noise of anideal 50 GΩ resistor is 3.2 x 10⁻³¹ Amp2/Hz and the rms noise associated with such a componentover a bandwidth of 10 kHz is 0.057 pA rms (although as already noted, excess high-frequencynoise can increase this value several fold). The shot noise, which accounts for in, associated withan input gate current of 0.2 pA would, by itself, produce noise of about 0.025 pA rms in a10 kHz bandwidth. For a typical high-quality patch-clamp headstage, en is about 2 - 3 nV/√Hz atfrequencies above about 1 kHz; Cg is usually about 15 - 20 pF. With these values, the term( )4
32 2 2 3π e C Bn g
1/2 amounts to roughly 0.15 pA rms in a 10 kHz bandwidth. These three terms
should be uncorrelated; therefore, they sum in an rms fashion so that the total predicted noise is

242 / Chapter twelve
(0.0572 + 0.0252 + 0.152)1/2 = 0.162 pA rms. For a resistive-feedback headstage, actual noise in a10 kHz bandwidth is normally substantially higher (about 0.25 - 0.30 pA rms) both because ofexcess noise from the feedback resistor and because of the characteristics of the low-pass filtersthat do not abruptly cut off noise at the -3dB bandwidth (see below). Nevertheless, it isimportant to note that for bandwidths above a few kilohertz, the term arising from en and Cgdominates total noise. To intuitively understand the origin of this term, it is only required toremember that the current through a capacitor is directly proportional to the rate of change ofvoltage across the capacitor (I = C(dV/dt) ). Therefore, the voltage noise at the negative (-) inputof the amplifier produces current noise through the capacitor Cg. This noise increases withincreasing frequency simply because higher frequency components of the voltage noise involvemore rapidly changing voltages. The noise current through the capacitor is supplied by thefeedback resistor and therefore appears as noise at the amplifier output.
Electrode Noise
Noise associated with recording electrodes is significant and often dominant in mostelectrophysiological measurements. In microelectrode voltage clamps and the whole-cell variantof the patch voltage-clamp technique, the thermal voltage noise of the electrode is of greatestimportance since this noise will exist across the cell membrane and produce large levels ofcurrent noise in conjunction with the membrane capacitance. In patch single-channelmeasurements using the patch clamp, the voltage noise of the electrode is also important; buthere the situation is further complicated by such factors as the dielectric noise of the pipette thatproduces a major source to overall noise. We will consider noise associated with the electrode insingle-channel recording and whole-cell patch recording separately, beginning with the single-channel recording.
Electrode Noise in Single-Channel Patch Voltage ClampingThere are a variety of mechanisms by which the patch pipette contributes noise to the measuredcurrent in the patch voltage-clamp technique. The first mechanism we will consider here is thefact that the holder plus pipette add a significant amount of capacitance to the headstage input.This capacitance reacts with the input voltage noise, en, of the headstage amplifier to producecurrent noise with a PSD that rises with frequency in essentially the same fashion as the PSD ofthe open-circuit headstage. In fact, this noise is perfectly correlated with the noise resulting fromthe intrinsic capacitance, Cin, associated with the headstage input. Note that Cin consists of theinput capacitance of the JFET (Ciss = Cgs + Cgd, where Cgs is the gate-source capacitance and Cgdis the gate-drain capacitance), plus any compensation capacitors connected to the input, plus, fora capacitive-feedback headstage, the feedback capacitor (1 pF for the Axopatch 200) andcapacitance associated with the reset switch, plus about 1 - 2 pF of stray capacitance: in total, Cinis usually about 15 pF. Denoting the holder plus electrode capacitance as Che, the PSD of thecurrent noise arising from en is given by 4π2en
2(Cin+Che)f 2. The capacitance of the holder canvary from about 1 - 5 pF; larger capacitances are associated with holders with metallic shielding.The pipette capacitance depends on the depth of immersion of the pipette, the type of glass used,the thickness of the pipette wall, and the use of Sylgard coating. The total capacitance of thepipette will generally be in the range of 1 - 5 pF. Thus, Che can range from 2 - 10 pF. WithChe = 2 pF, the increment in wideband noise from this mechanism above that of the open-circuited headstage should not be much more than 10%. However, with Che = 10 pF the noise

Noise in Electrophysiological Measurements / 243
A X O N G U I D E
increment could be more than 50% from this mechanism alone. Obviously, from the point ofview of noise, it is important to minimize the capacitance of the holder and pipette.
Dielectric NoiseThe basic characteristics of dielectric noise have already been described above(see equations (9) and (10)). Dielectric noise of the pipette can be a major contributor tototal noise in patch voltage clamping; in some situations it can be the dominant noisesource. The dielectric noise arising from the pipette depends on the dissipation factor D ofthe glass used to fabricate the pipette, on the pipette capacitance (CD in equations (9) and(10)), and on the presence of Sylgard coating. The dissipation factor D of glasses other thanquartz that have been successfully used for patch pipettes generally falls in the ranges of0.001 - 0.01. The dissipation factor for quartz is variously reported to be 10-5 to as much as4 x 10-4. For Amersil T-08 quartz, which has been used in all of the preliminary tests ofquartz pipettes described below, the reported dissipation factor is 10-4. For uncoatedpipettes the value of CD is determined by the dielectric constant ε of the glass, the ratio ofthe outer diameter (OD) to the inner diameter (ID) of the pipette, the depth of immersion ofthe pipette into the bath, and to some extent by the pulling characteristics of the glass andthe geometry near its tip. The dielectric constant ε ranges from as little as 3.8 for quartz tomore than 9 for some high-lead glasses. Typical glass capillaries used in the fabrication ofpatch pipettes have an OD of 1.65 mm and an ID of 1.15 mm; thus OD/ID ≈ 1.43. If it isassumed that these proportions (OD/ID = 1.43) are maintained as the glass is drawn out inpulling, then for uncoated pipettes the value of CD will be approximately 0.15ε pF per mmof immersion into the bath. For thick-walled glass with OD/ID = 2, this value would fall to0.08 ε pF per mm of immersion; while for thin-walled glass with OD/ID = 1.2 thecapacitance would increase to about 0.30ε pF per mm.
Actual measurements with uncoated or lightly Sylgard-coated pipettes fabricated fromglasses with known ε and immersed to a depth of 2 - 3 mm indicate that these values oftenunderestimate pipette capacitance; therefore, the dielectric noise is also underestimated.This is probably due to non-uniform thinning near the tip and to some uncertainty as to thetrue depth of immersion (due to a meniscus of solution around the pipette). For example,using the popular Corning 7052 glass, which has ε = 4.9 and with OD/ID ≈ 1.43, it is notuncommon to measure a pipette capacitance as high as ≈ 3 pF, i.e., about twice the predictedvalue, when an uncoated pipette or a pipette very lightly coated with Sylgard is immersed ata depth of 2 mm.
Despite this precautionary note, it is clear that, all else being equal, the value of CD varieslinearly with the dielectric constant ε of the glass. Equation (10) indicates that if the depthof immersion and the OD/ID ratio are constant, the rms noise for a given bandwidth arisingfrom the lossy dielectric characteristics of pipettes fabricated from various glasses will beproportional to (Dε)1/2. Thus the lowest noise glasses are expected to be those thatminimize the product of the dissipation factor and the dielectric constant. This relationshiphas been born out experimentally in tests of some 20 different types of glass used tofabricate patch pipettes (Rae and Levis, Personal Communication).
To illustrate the range of results expected for different glass types, we will consider threepipettes with identical geometry fabricated from three different glasses. It will be assumedthat OD/ID ≈ 1.4, CD = 0.2ε pF per mm of immersion, the immersion depth is 2 mm, the

244 / Chapter twelve
pipettes are uncoated or are coated very lightly with Sylgard (so that the coating does notreduce the dielectric noise significantly), and the rms noise is measured at a 10 kHzbandwidth (-3 dB, 8-pole Bessel filter). Corning 7052 glass (D ≈ 0.003 and ε ≈ 5)represents reasonably low-loss glasses used to fabricate patch pipettes. Under the abovestated conditions, the CD value of this pipette is 2 pF and the dielectric noise contributionpredicted by equation 10 is about 0.17 pA rms, or about 0.2 pA rms if the characteristics ofan 8-pole Bessel filter are taken into account. On the other hand, 0080 soda lime glass(D ≈ 0.01, ε ≈ 7) represents high-loss glasses, which were commonly used in the early daysof patch clamping. Its CD = 2.8 pF and dielectric noise of about 0.44 pA rms is predicted.Finally, Corning 7760 is a very low-loss glass with D ≈ 0.0017 and ε ≈ 4.5. WithCD = 1.8 pF, a dielectric noise of slightly less than 0.15 pA rms is predicted. These figuresare in reasonable agreement with experimental findings that have attempted to separate thecomponents of total noise arising from the dielectric noise of pipettes fabricated fromvarious glasses.
Since the capacitance CD increases approximately linearly with increasing depth ofimmersion, the dielectric noise for any particular type of glass and OD/ID ratio should varyapproximately as the square root of the depth immersion. From the point of view of noisereduction, it is clearly useful with excised patches to withdraw the pipette tip as close to thesurface of the bath as possible. If the patch cannot be excised, then the bath should be asshallow as possible. For example, for a pipette fabricated from Corning 7760, as in theprevious example, dielectric noise is expected to decrease from about 0.15 pA rms in a10 kHz bandwidth for a 2 mm immersion depth to roughly 0.05 pA rms for a 0.2 mmimmersion depth. The effect of immersion depth on pipette noise has, at least qualitatively,been verified experimentally. A method employing Silicone fluid to minimize the effectivepipette immersion depth was introduced by Rae and Levis (1992) and is described below.
The above discussion dealt with expected behavior for uncoated pipettes. However, it iscommon practice (and highly recommended for low-noise measurements) to apply a coatingof Sylgard #184 covering the entire tapered region of the pipettes (i.e., approx.5 - 10 mm) and extending to within roughly 100 µm of the tip (see Chapter 4). Coatingwith a hydrophobic substance such as Sylgard is necessary to prevent the formation of a thinfilm of solution that will creep up the outer wall of an uncoated pipette. Such a film canproduce very large amounts of noise in uncoated pipettes. Sylgard coating not onlyvirtually eliminates this noise source but also thickens the wall of the pipette therebyreducing its capacitance. The dielectric constant of Sylgard #184 is 2.9 and its dissipationfactor is ≈ 0.002, which is lower than that of most glasses that have been used for patchpipette fabrication. Thus, coating with Sylgard will reduce dielectric noise of patchpipettes. It is expected that the improvement in noise associated with Sylgard coating willbe greatest for glasses with a high Dε product (e.g., soda lime glass); this has beenconfirmed experimentally. Improvement of noise should be less for glasses with very lowvalues of Dε, but coating with Sylgard will reduce the dielectric noise of all glasses. Theeffects of Sylgard coating on noise are, however, difficult to quantify theoretically primarilybecause the thickness of the coating is usually not uniform. In particular, it is difficult toachieve a very thick coating very near the tip.
Experimental tests of the noise properties of patch pipettes fabricated from 19 differentkinds of glass (see Chapter 4) have confirmed the general conclusions described above.

Noise in Electrophysiological Measurements / 245
A X O N G U I D E
With few exceptions, the noise attributable to the pipette is inversely correlated with the Dεproduct of the glass. In addition, thicker-walled pipettes and shallow depths of immersionreduce noise for any particular glass type. Sylgard coating has its greatest effect on theglasses with the poorest inherent electrical properties, but it is important to remember thatsuch coating is necessary for all types of glass.
It has been obvious for some time that pipettes fabricated from quartz should produce onlyvery small amounts of dielectric noise due to the low dielectric constant of quartz (ε = 3.8)and, more importantly, its extremely low dissipation factor (D ≈ 10-5 - 10-4). However, dueto the high melting point of quartz (≈ 1600°C), it has only recently become practical to pullpatch pipettes from quartz tubing. A quartz pipette with D = 10-4 that is immersed to adepth of 2 mm (again assuming 0.2ε pF per mm of immersion) would be predicted toproduce only about 0.03 pA rms of dielectric noise in a bandwidth of 10 kHz (-3 dB, 8-poleBessel filter); for D = 10-5 this value would fall to 0.01 pA rms. Preliminary measurementsusing Amersil T-08 quartz suggest that the amount of dielectric noise in this situation iscloser to 0.04 - 0.05 pA rms. A more detailed discussion of preliminary estimates of thenoise properties of quartz pipettes is provided below.
Dielectric noise is probably the largest source of noise for pipettes fabricated from allglasses other than quartz. For pipettes fabricated from quartz, due to its very lowdissipation factor sources of noise other than dielectric noise are expected to dominate totalpipette noise (see below).
To summarize, dielectric noise can be minimized by using thick-walled glasses with lowvalues of Dε and coating the pipette with Sylgard #184. The effects of Sylgard coating aregreatest for glasses with relatively poor electrical properties. For excised patches, dielectricnoise can be minimized by withdrawing the tip of the pipette as close as possible to thesurface of the bath.
It should be noted that dielectric noise will also contribute to the noise associated with theholder. For an Axopatch 200A with an open circuit noise of 0.06 pA rms in a 5 kHzbandwidth, total noise should not increase to more than about 0.07 pA rms in thisbandwidth when the Axon-supplied polycarbonate holder is attached. Part of this noiseincrement is due to the fact that the holder adds about 1 - 1.5 pF of capacitance to theheadstage input. The rest of the increment in noise associated with the holder is presumablydielectric noise, which can be estimated to account for roughly 0.03 pA rms in a 5 kHzbandwidth.
Noise Arising From Distributed Pipette Resistance and CapacitanceMost of the resistance of a patch pipette resides at or very near its tip. On the other hand,the capacitance of an uncoated pipette can be expected to vary linearly with its depth ofimmersion into the bath. Therefore, it has sometimes been assumed that current noisearising from the thermal voltage noise of the pipette resistance in conjunction with thepipette capacitance can be assumed to be negligible in comparison with other noise sources.However, significant resistance resides in regions of the pipette that are further removedfrom the tip. The thermal voltage noise of this resistance will greatly exceed the inputvoltage noise of the headstage itself, with which it is in series. The actual situation iscomplicated because both the pipette resistance and capacitance are distributed. In this

246 / Chapter twelve
section we will consider the pipette capacitance to be lossless, and initially the effects ofSylgard coating will not be considered. In order to estimate the noise arising from thedistributed pipette resistance and capacitance, we will consider rather idealized pipettegeometry.
The pipette has been modeled as a shank and a conical region approaching the tip; the angleof the cone is 11.4° and the tip opening is 1 µm in diameter. With this cone angle the ID ofthe pipette increases to 100 µm at a distance of 0.5 mm from the tip, 200 µm at a distanceof 1 mm from the tip, 300 µm at a distance 1.5 mm from the tip, etc. When filled with asolution with a resistivity of 50 Ωcm the pipette will have a total resistance of about3.2 MΩ. About 2.1 MΩ of this total resistance resides in the first 10 µm from the tip;slightly more than 3 MΩ occurs in the first 100 µm from the tip. However, about 80 kΩresides in the region from 100 - 200 µm from the tip, an additional 27 kΩ resides in theregion from 200 - 300 µm; and about 37 kΩ occurs in the region from 300 µm to 1 mm fromthe tip. The region from 1 - 4 mm from the tip adds another 12 kΩ. It has been assumedthat the capacitance is uniformly distributed along the pipette with a value of 1 pF/mm ofimmersion. An Ag/AgCl wire extends into the pipette coming to within 4 mm of the tip andit is assumed that the resistance of the pipette is negligible beyond the tip of the wire (due tothe shunting effect of the wire). A noise equivalent circuit of the pipette can be created bylumping the resistance and capacitance of each small segment (e.g., 20 - 50 µm) of pipette.The approximate circuit is then a ladder network formed of a series of resistors and theirequivalent thermal voltage noise sources with a capacitor to ground at each noderepresenting a portion of the pipette immersed in the bath. Rough calculations with such anequivalent circuit indicate that for a depth of immersion of 2 mm the noise arising from thismechanism will be about 0.13 pA rms in a 10 kHz bandwidth. For a 1 mm depth ofimmersion this value would fall to about 0.10 pA rms. For an idealized pipette identical tothe one described here but with a cone angle of 22.6° (total resistance is about 1.6 MΩ)these values fall to about 0.07 pA rms for a 2 mm depth of immersion and about0.05 pA rms for a 1 mm depth of immersion, both for a 10 kHz bandwidth. Over thefrequency range of interest to patch voltage clamping, the PSD (Amp2/Hz) of this noiseshould rise with increasing frequency as f2 .
These calculated values are highly approximate and the assumed geometry is obviously anover-simplification. A variety of factors could increase the noise arising from thismechanism. For example, the noise should increase if there is an extended region behindthe tip where the angle of taper is quite shallow, resulting in increased resistance in thisregion. Noise will also increase if the wire does not protrude as close to the tip as assumedabove. In addition, some glasses tend to thin near the pipette tip, resulting in increasedcapacitance in this region. It should also be noted that shallow depths of immersion wouldnot decrease this noise quite as much as might be expected since this would decrease thepipette capacitance, but not its resistance.
The noise from this mechanism can be reduced in several ways. From the above estimates itseems that noise arising from the distributed resistance and capacitance of the pipette shouldbe smaller than the dielectric noise of pipettes fabricated from even the best known glasses.Nevertheless, with better (lower loss) glasses, particularly quartz, this mechanism could bethe dominant source of noise from the pipette itself, and its reduction may becomeimportant. First, it is obvious that the geometry of the first few millimeters of the pipette
Noise in Electrophysiological Measurements / 247
A X O N G U I D E
will be an important determinant of the magnitude of this noise; therefore, when possible,pipettes should be pulled to minimize the resistance distal to the tip. Anything that reducesthe pipette capacitance per unit length will also reduce this noise. Thus, thick-walledpipettes and glasses with low dielectric constants should provide the best results in terms ofnoise. Perhaps of more practical importance, coating the pipette with Sylgard #184 cansignificantly reduce the pipette capacitance, and consequently reduce noise of the typeconsidered here. However, as already noted, it is more difficult to build up a thick coat ofSylgard in the region within the first few hundred micrometers from the tip than in moredistant regions. As was the case with dielectric noise, shallow depths of immersion willalso reduce the noise arising from pipette resistance and capacitance. Finally, it should alsobe possible to reduce this noise regardless of the immersion depth by using a fine wire(Ag/AgCl or platinized Ag/AgCl possibly sharpened at the tip) that protrudes as far aspossible toward the tip of the pipette. Such a wire will, in effect, short out (in a frequency-dependent fashion) the resistance of the pipette-filling solution in the region into which itextends; thus, while the pipette capacitance will be unaltered for any given depth ofimmersion, its resistance up to the end of the wire would be significantly reduced.
In 1992, Rae and Levis have introduced a technique that has been shown to minimizepipette noise arising from all of the mechanisms discussed above. In this technique, thesurface of the bathing solution was covered with a layer of Silicone oil (#200 Fluid fromDow Corning, Midland, MI). With excised patches it was then possible to raise the tip ofthe electrode to within a few micrometers of the saline-oil interface; a sharp line ofdemarcation could be observed along the pipette at this interface. The electricalcharacteristics of this oil are apparently quite good2, so that only the tip of the pipette thatremains in saline appears to contribute to total noise. If 10 µm of the pipette tip remain insaline, it would be expected that the capacitance associated with this length should beroughly 0.01 pF. Dielectric noise associated with the immersed portion of the pipetteshould be about one tenth of the values predicted for a 1 mm depth of immersion. It shouldbe reasonable to approximate distributed R-C noise in this situation by a lumped resistanceequal to the resistance of the pipette other than that arising from the tip itself is series withapproximately 0.01 pF. If this resistance is taken to be 2.5 MΩ, the expected noise is onlyabout 7 fA rms in a 10 kHz bandwidth; even for 10 MΩ it is less that 15 fA rms in thisbandwidth. The noise increment associated with the pipette capacitance and the headstageinput voltage noise is also minimized in this arrangement since the capacitance remainsessentially the same as that with the electrode in air. It should also be noted that even whenpatches cannot be excised, this approach can still be effective if the bath is designed so thatthe solution level can be lowered, thereby bringing the layer of silicone fluid very close tothe cell surface.
2 Although the dielectric characteristics of the specific Silicone fluid used in these experiments is not available, Table
2.5 of Electronics Designers' Handbook (1977, L. Giacoleto ed., McGraw-Hill) lists a dissipation factor (D) of8.5x10-5 at 1 kHz and 2x10⁻⁵ at 100 kHz for Silicone fluid (methyl- or ethyl-siloxane polymer); the dielectricconstant (ε) is 2.68.

248 / Chapter twelve
Using quartz pipettes with this technique has resulted in noise levels in actual recordingsituations as low as 0.08 pA rms in a 5 kHz bandwidth (4-pole Butterworth filter). For theseexperiments, the Axopatch 200A was used with an open-circuit headstage noise of 0.057 pArms in a 5 kHz bandwidth; with the holder and electrode attached, but with the electrode tipin air, noise typically increased to about 0.07 pA rms in this bandwidth. In severalexperiments it was shown that the total noise closely approximated the rms sum of the noiseof the headstage plus holder/electrode (electrode in air) and the thermal current noise of themeasured DC seal resistance. This implies that dielectric noise and "distributed R-C noise"of the pipette contributed only a negligible amount to total noise in this situation. Recently,Rae and Levis (1993) showed that quartz pipettes can be fabricated with the SutterInstrument P-200 laser-based puller to yield lower noise than they previously achieved,obviating the need for Silicone oil.
Preliminary tests have also been made using this technique with pipettes fabricated fromtwo other types of glass (Corning 7760, Kimble KG-12). Although the noise reduction wassignificant, results were never as good as those achieved with quartz. For example, the bestresults achieved with KG-12 were slightly more that 0.10 pA rms in a 5 kHz bandwidth,even when seal resistances in the range of 50 - 100 GΩ were obtained. For a total noise of0.105 pA rms, and assuming that the headstage plus holder/electrode in air produced0.075 pA rms and that a 50 GΩ seal produces 0.04 pA rms, all in a 5 kHz bandwidth, thepipette would be estimated to contribute about 0.06 pA rms in this bandwidth. On the basisof the above discussion, this is several times the amount of noise expected for a pipettefabricated from this glass with 10 µm of its tip in saline. One possible explanation of atleast part of this discrepancy would be to assume that the glass had thinned excessively nearthe tip. It is also possible that the noise attributed to the seal in arriving at this estimate istoo low. More work will be needed to clarify this issue.
Noise Properties of Quartz Patch PipettesIn Winter 1991-92 it became possible to routinely fabricate patch pipettes from quartz usingthe Model P-2000 puller from Sutter Instrument Company (Novato, CA). This puller uses alaser to overcome the extremely high melting temperatures needed to draw pipettes fromquartz tubing. Preliminary results using Amersil T-08 quartz pipettes are quite encouraging.For the preliminary results reported here, it was difficult to pull small-tipped blunt pipetteswith 1.65 mm OD 1.15 mm ID tubing. Pipettes fabricated from this tubing typically had arather long and relatively narrow shank. This geometry is not ideal for the lowest possiblenoise. Even so, these pipettes produced significantly less noise than pipettes fabricatedfrom the best glasses used previously (e.g., 7760, 8161). In actual recording situations withpipettes immersed about 3 mm into the bath and with seal resistances ≥ 50 GΩ, rms noise ina 5 kHz bandwidth was typically about 0.12 - 0.13 pA rms using an Axopatch 200A.Estimates of the contribution of the pipette to this noise were in the range of 0.075 - 0.09 pArms in this bandwidth. With the new technique described above (Rae & Levis, 1992),which allows the pipette tip to be positioned within a few micrometers of a layer of Siliconeoil covering the surface of the bath, background noise levels as low as 0.08 pA rms in a 5kHz bandwidth have been achieved in actual single-channel recording situations with quartzpipettes. In such cases the contribution of the dielectric noise and distributed R-C noise ofthe pipette appears to be negligible in comparison to other noise sources.

Noise in Electrophysiological Measurements / 249
A X O N G U I D E
More accurate estimates of the noise attributable to the pipette could be made by sealingquartz pipettes to Sylgard. A typical result for approximately a 3 mm depth of immersion is0.115 pA rms in a 5 kHz bandwidth for pipettes coated with a thin layer of Sylgard to withinabout 100 - 200 µm of the tip. The power spectral density (PSD) of this noise was alsomeasured. An estimate of the PSD attributable to the dielectric noise and distributed R-Cnoise of the pipette was obtained by subtracting from the total PSD the PSD of theheadstage with the electrode in air with a correction made for the effects of the additionalcapacitance of the immersed pipette (about 2.6 pF) in conjunction with the headstage inputvoltage noise. The thermal current noise level associated with the DC seal was alsosubtracted. The resulting PSD was taken to be the best estimate of the noise attributable tothe pipette per se. This PSD (Amp2/Hz) increased with frequency with a slope ofapproximately f 1.85 in the frequency range from 2 - 20 kHz. From the PSD it could beestimated that the pipette accounted for about 0.07 pA rms of noise in a 5 kHz bandwidthand about 0.17 pA rms in a 10 kHz bandwidth. If it is assumed that the slope of f 1.85 wascomposed of a component with a slope of f attributable to the dielectric noise of the pipetteand a component with a slope of f 2, attributed to distributed resistance-capacitance noise ofthe pipette, it can be estimated that dielectric noise would account for slightly less than0.06 pA rms in a 10 kHz bandwidth. Distributed R-C noise would then account for about0.16 pA rms at this bandwidth. The estimated value of dielectric noise is somewhat higherthan would be expected from the value of D listed for Amersil TO-8 quartz (0.0001 at1 MHz) and the measured value of CD (2.6 pF); with these values, equation 10 predicts≈ 0.04 pA rms of dielectric noise in a 10 kHz bandwidth. If the above parsing of the noisecomponents is correct, then it can be estimated that the actual value of D for the quartz usedwas closer to 0.00025. Even if this value is correct, the Dε product for this quartz is stillabout an order of magnitude lower than that of any other glass used to date for thefabrication of patch pipettes. At the time of this writing, neither different grades (i.e.,higher purity) of quartz from the same supplier nor quartz from other manufacturers havebeen investigated. It should also be noted that the noise component attributed to distributedR-C noise probably could have been reduced if the pipettes tested had a more favorablegeometry.
When the same procedure was used to estimate the pipette noise when the depth ofimmersion was decreased such that the increment in capacitance was about 0.7 pF abovethat measured with the pipette tip just above the solution, it was found that the noiseattributable to the pipette was roughly a factor of two lower than the figures reported above.In this case the estimated pipette noise PSD increased with increasing frequencyapproximately as f 1.9 in the range from 2 - 20 kHz. This is consistent with the prediction thatthe relative decrease in dielectric noise will be somewhat greater than that of distributed R-C noise as the depth of immersion decreases.
It should be noted that the results for quartz pipettes are qualitatively as well asquantitatively different from those that have been obtained previously from pipettesfabricated with other types of glass. Estimates of pipette noise based on procedures likethose described above have been performed for many types of glass (i.e., Figure 12-4).Even for the lowest Dε product glasses (e.g., 7760, 8161, 7740), the estimated pipette noisePSD rises with increasing frequency as f 1.1 - f 1.3 (frequency range 2 - 20 kHz, immersiondepth ≈ 2 mm). This indicates that dielectric noise dominates total pipette noise for theseglasses. However, for quartz not only is the pipette noise significantly less for a given depth

250 / Chapter twelve
of immersion, but the estimated pipette noise PSD rises much more steeply with increasingfrequency (f 1.8 - f 1.9 in the 2 - 20 kHz frequency range)3. This indicates that dielectric noise isno longer the dominant source of noise for patch pipettes fabricated from quartz. The datadescribed above are consistent with the interpretation that for quartz pipettes "distributed R-C noise" has become the dominant noise mechanism due to the greatly reduced contributionof dielectric noise. As more data from quartz pipettes becomes available these estimatesand conclusions will doubtlessly be refined.
Noise Arising From Pipette Resistance and Patch CapacitanceThe capacitance, Cp, of the patch is in series with the entire pipette resistance, Re. Thethermal voltage noise of Re will produce current noise in conjunction with the patchcapacitance. The PSD of this noise, S fp
2( ) , is given by:
S f e C fp e p2 2 2 2 24( ) = π (14)
where e kTRe e2 4= is the thermal voltage noise of the pipette. The rms noise arising from
this mechanism from DC to a bandwidth B is then ( )43
2 2 2 3π e C Be p1/2. In general, this noise
should be quite small, but it can become significant when the patch area is large; e.g., whena large "bleb" of membrane is sucked into the pipette tip. Sakmann and Neher (1983, inSingle-Channel Recording, Sakmann, B. and Neher E. eds. pp. 37-51) measured patchcapacitance for a large number of pipettes with resistances ranging from about 1 - 10 MΩ.They found that the value of Cp varied from as little as 0.01 pF to as much as 0.25 pF.Despite a very large amount of scatter, they found that Cp and Re were correlated, with Cpincreasing as Re decreases. The best fit to their data was Cp = 0.126 pF(1/R + 0.018), whereR is the pipette resistance in MΩ. Using this average relationship it can be predicted thatfor a "typical" 10 MΩ pipette (Cp = 0.015 pF) the noise in a 10 kHz bandwidth (8-poleBessel filter) arising from this mechanism will be about 0.03 pA rms, while for a 1 MΩpipette (typical Cp = 0.128 pF) this value will increase to 0.08 pA rms. Sakmann andNeher's results indicate that in the most favorable situations in terms of "Re-Cp" noise, therms noise from this mechanism can be as low as 0.01 pA rms in a 10 kHz bandwidth.However, in the least favorable situation (Re ≈ 2 MΩ, Cp ≈ 0.25 pF) the noise from thismechanism can be as large as 0.23 pA rms in a 10 kHz bandwidth (8-pole Bessel filter).
Seal Noise
The membrane-to-glass seal that is essential to the patch voltage-clamp technique is the finalsource of noise associated with the pipette that will be considered here. Seal noise is perhaps the
3 Note, however, that the PSD for quartz pipettes is lower than that of pipettes made from other glasses at all
frequencies measured. At sufficiently high frequencies distributed R-C noise should dominate the total noise forpipettes fabricated from any type of glass. However, for quartz pipettes the PSD of distributed R-C noise shouldexceed that of dielectric noise by 1 kHz; for pipettes made from 7760, distributed R-C noise should not exceeddielectric noise up to 10-20 kHz, and for soda lime (e.g., 0080) pipettes this frequency might be closer to 100 kHzor more. Distributed R-C noise depends on the pipette geometry and a variety of other factors already described;the only influence of the glass type itself accept in so far as it effects the geometry which can be pulled is itsdielectric constant.

Noise in Electrophysiological Measurements / 251
A X O N G U I D E
least understood source of noise in the patch clamp technique. The power spectral, S fsh2 ( ), of the
noise arising from the seal for zero applied voltage is given by:
S f kT Ysh sh2 4( ) Re = (15)
where ReYsh is the real part of the seal admittance Ysh. The minimum estimate of seal noiseresults from the assumption that ReYsh = 1/Rsh, where Rsh is the DC seal resistance. If thisassumption is correct, then for a 10 kHz bandwidth, seal resistances of 1, 10 and 100 GΩ wouldproduce noise of 0.4, 0.13 and 0.04 pA rms, respectively. Since values of Rsh in the range of100 - 200 GΩ are not uncommon, this would imply that the noise associated with a very tight sealwould be small in comparison with other sources of patch-clamp noise. However, it is possiblethat the PSD of seal noise may rise above the minimum level given by 4kT/Rsh as frequencyincreases (i.e., the real part of the seal admittance may increase with frequency) due to thecapacitance of the glass and the membrane which make up the wall of the seal. Unfortunately,we have no good theoretical basis upon which to estimate Ysh since the precise nature of themembrane-glass seal is not known.
It is also very difficult to empirically dissect out the noise associated with the seal from totalpatch clamp noise. We believe that previous attempts to do this have overestimated this noise.For example, as shown in Figure 1-11 of Sigworth (1983), data from F. Sachs and E. Neherindicate a frequency-dependent seal noise PSD (Rsh ≈ 20 GΩ) that would amount to at least0.13 pA rms in a bandwidth from DC to 5 kHz. However, with an integrating headstage (e.g., theCV 201A or 202A of the Axopatch 200A), total noise levels (i.e., including the noise of theheadstage, holder, pipette, seal, etc.) lower than this value have often been achieved in the same5 kHz bandwidth in actual recording situations.
Rae and Levis have reported in 1992 measurements using an Axopatch 200A with quartz pipettesand a novel technique involving placing a layer of Silicone oil on the surface of the bathingsolution containing the cells to be patched. This technique allows excised patches to be broughtwithin a few micrometers of the oil-water interface, thereby minimizing the noise contribution ofthe pipette. With this approach, total noise levels as low as ≈ 0.08 pA rms in a5 kHz bandwidth were achieved. In several experiments with excised patches, the DC sealresistance was measured (range 40 - 60 GΩ) and the noise was measured with the tip justbeneath the layer of oil and again with the tip withdrawn into the oil. The rms difference of thesetwo noise measurements should be dominated by the seal noise plus the small amount of noisearising from the pipette resistance in series with the patch capacitance. In all cases, it was foundthat this rms difference for a bandwidth of 5 kHz was close to the thermal current noise predictedfrom a measured seal resistance (i.e., (4kTB/Rsh)1/2). Nevertheless, it is well known to anyonewho has struggled to achieve the lowest possible noise in patch-clamp measurements that there isconsiderable variability in the total noise even among patches with very high seal resistances andwith all other conditions seemingly identical. Despite the conclusions drawn above, it seemsreasonable to guess that some of this variability arises from the seal. Noise associated with themembrane-glass seal represents one of the fundamental limitations of the patch clamp technique,but it now seems clear that under favorable conditions such noise can be as low as 0.03 pA rmsin a 5 kHz bandwidth. Recently, Rae and Levis (1993) achieved ultra low-noise recordingwithout silicone oil by improving the fabrication of the quartz pipettes.

252 / Chapter twelve
Noise in Whole-Cell Voltage Clamping
The noise associated with the whole-cell variant of the patch voltage-clamp technique atmoderate to high frequencies will almost always be dominated by current noise arising from theseries (pipette) resistance Rs, in conjunction with the membrane capacitance, Cm, of the cell. Itshould be noted that the measured value of Rs is often 2 or even 3 times higher than theresistance of the pipette prior to achieving a whole-cell recording. Due to the filtering effect ofthe access resistance and cell capacitance, series-resistance compensation is required to increasethe actual bandwidth of current measurement beyond 1/2πRsCm. The level of series-resistancecompensation is an important determinant of whole-cell voltage clamp noise as well as of thebandwidth and fidelity of recording (see more on series-resistance compensation in Chapter 3).The voltage noise PSD of Rs is approximated by 4kTRs (V2/Hz). It should be noted, however,that in addition to thermal noise a 1/f component is expected, particularly when relatively largecurrents are passed through the pipette. The PSD, S fwc
2 ( ) , of the current noise arising from Rs
and Cm is given by:
S ff e C
fwc
s m
sr
22 2 2 2
2 2 2
4
1 4( ) =
+π
π τ (units: Amp2/Hz) (16)
where e kTRs s2 4= and τsr = RsrCm and Rsr is the residual (i.e., uncompensated) series resistance,
e.g., if Rs = 10 MΩ then for series-resistance compensation levels of 50%, 70% and 90%, Rsrwill be 5 MΩ, 3 MΩ and 1 MΩ, respectively. It should be noted that for 100% series-resistancecompensation, equation (16) reduces to 4 2 2 2 2π f e Cs m. This emphasizes that series-resistancecompensation (if it is properly designed) only restores the noise to the level that would haveresulted from the thermal voltage noise of Rs in series with Cm in the absence of the filteringeffect of Rs mentioned above. The rms noise arising from Rs and Cm over a bandwidth fromDC to B Hz can be obtained by integrating equation (16) over f from 0 to B.
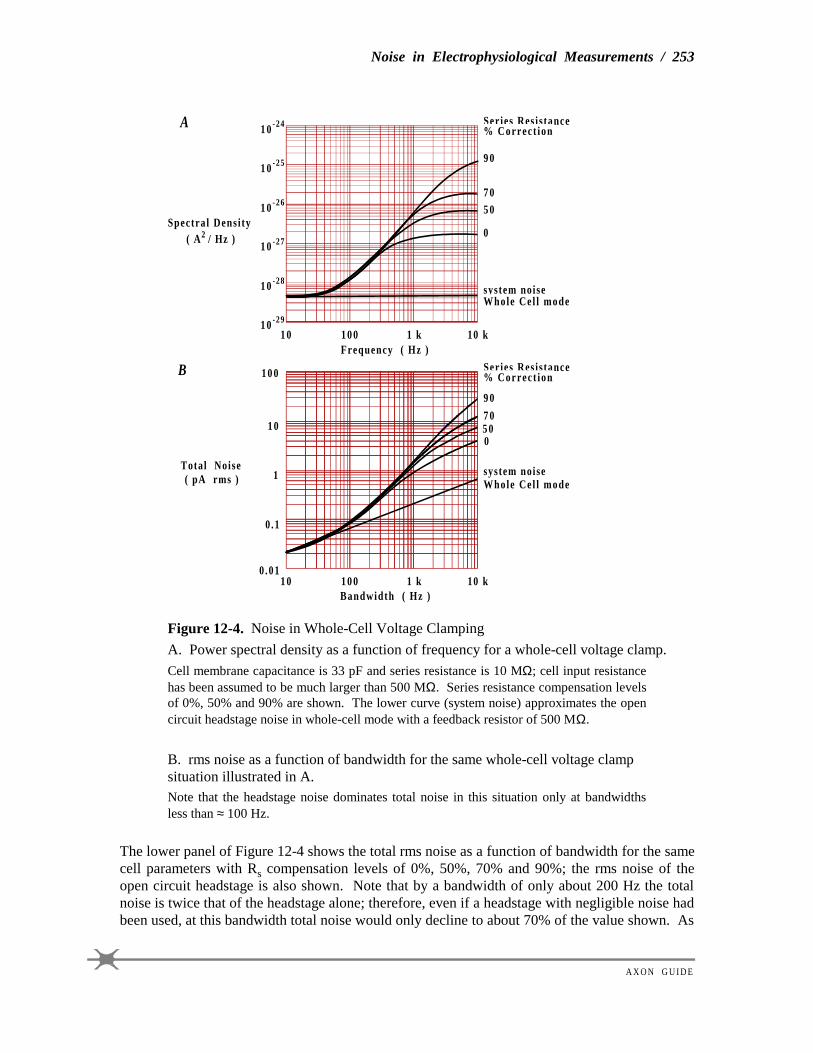
Patch clamps commonly use (switch in) a 500 MΩ feedback resistor for whole-cell voltageclamping. The noise of this resistor dominates open-circuit headstage noise up to bandwidths ofabout 10 kHz. However, for typical cells the noise arising from Rs and Cm will be larger thanthat of the headstage for all bandwidths above a few hundred Hz. Even for relatively idealsituations in terms of noise (e.g., a small cell with Cm = 5 pF voltage clamped throughRs = 5 MΩ), the noise of a 500 MΩ feedback resistor will not dominate total noise forbandwidths above about 1 kHz. Figure 12-4 shows the noise PSD and rms noise for a typicalwhole-cell voltage clamp situation with Rs = 10 MΩ and Cm = 33 pF (these are the values used inthe Model Cell provided with the Axopatch-1 and the Axopatch 200 series of patch clamps).The top panel shows the noise PSD (as computed from equation 16 plus headstage noise) forseries-resistance compensation levels of 0%, 50%, 70% and 90%; the noise PSD of an open-circuit headstage alone is shown for comparison. It is instructive to derive an expression for thehigh frequency plateau of these PSDs (from equation 16). If the fraction of series-resistancecompensation is defined as α and β = 1 - α (e.g., for 80% compensation β = 0.2; also note thatRsr = βRs), then as f → ∞, S fwc
2 ( ) → 4kT/(β2R). Even without series-resistance compensation(β = 1) the high frequency plateau is 4kT/Rs; i.e., 50 times larger than that of a 500 MΩ resistor.With 90% compensation (β = 0.1) the plateau level is 4kT/(0.01Rs), which, in this case, isequivalent to the thermal current noise of a 100 kΩ resistor.
Noise in Electrophysiological Measurements / 253
A X O N G U I D E
10-24
100 1 k 10 k10
0.01
0.1
10 10 k1 k100
1
10
100
Spectra l Densi ty( A / Hz )2
( pA rms )Total Noise
Frequency ( Hz )
Bandwidth ( Hz )
Ser ies Resistance% Correc t ion
system noiseWhole Cel l mode
Whole Cel l modesystem noise
Ser ies Resistance% Correc t ion
A
B
05070
90
0
5070
90-2510
10-26
-2710
-2810
-2910
Figure 12-4. Noise in Whole-Cell Voltage Clamping
A. Power spectral density as a function of frequency for a whole-cell voltage clamp.
Cell membrane capacitance is 33 pF and series resistance is 10 MΩ; cell input resistancehas been assumed to be much larger than 500 MΩ. Series resistance compensation levelsof 0%, 50% and 90% are shown. The lower curve (system noise) approximates the opencircuit headstage noise in whole-cell mode with a feedback resistor of 500 MΩ.
B. rms noise as a function of bandwidth for the same whole-cell voltage clampsituation illustrated in A.Note that the headstage noise dominates total noise in this situation only at bandwidthsless than ≈ 100 Hz.
The lower panel of Figure 12-4 shows the total rms noise as a function of bandwidth for the samecell parameters with Rs compensation levels of 0%, 50%, 70% and 90%; the rms noise of theopen circuit headstage is also shown. Note that by a bandwidth of only about 200 Hz the totalnoise is twice that of the headstage alone; therefore, even if a headstage with negligible noise hadbeen used, at this bandwidth total noise would only decline to about 70% of the value shown. As
254 / Chapter twelve
the bandwidth of current measurement increases, the noise of the headstage itself becomesprogressively more negligible; with 90% compensation at a bandwidth of 1 kHz, a headstagewith no noise would have reduced total noise by less than 1% (recall that the noise of theheadstage and the Rs-Cm noise considered here are not correlated and, therefore, add in an rmsfashion). It should also be pointed out that the bandwidths in this figure refer to the setting of anexternal filter (a perfect "brick-wall" filter has been assumed, see below). But it is important torealize that the actual bandwidth of current measurement is limited to 1/2πRsrCm (1 pole RCfilter). Without series-resistance compensation, in this example the bandwidth is only about480 Hz and the use of external filter bandwidths much above this will only add noise, not newsignal information. The effective bandwidth increases with increasing series-resistancecompensation, reaching nearly 5 kHz with 90% compensation.
External Noise Sources
Interference from external sources can be almost completely eliminated in a well-designedsystem, but can become the dominant source of noise if proper precautions are not taken. Themost familiar form of interference is line-frequency pickup (50 or 60 Hz and harmonics) frompower supplies, fluorescent lights, etc. Well-designed instruments will not introduce significantamounts of interference from their internal power supplies. However, a typical laboratoryenvironment is full of potential sources of interference from sources external to the electronicinstrumentation involved in a particular measurement. In addition to line-frequency pickup,other potential sources of interference include nearby motors, elevators, radio and televisionstations, and the video monitor of your computer (which produces an annoying timing signal at16 kHz or higher frequency). High impedance measurements, such as patch clamping or workwith intracellular microelectrodes, are particularly sensitive to such external interference.
In most cases such noise sources can be controlled by careful grounding, shielding and filtering.(For a detailed discussion of these techniques see Chapter 2). In some situations, however,shielding can actually increase noise. An example is metal shielding of the pipette holder used inthe patch clamp. Such shielding inevitably increases the capacitance at the input of the amplifier(Cg in equations (11) - (13) above) by several picofarads. Even if the mean voltage on the shieldis precisely the same as that of the negative input of the amplifier, the noise voltages will differand lead to increased high frequency noise. For this reason Axon Instruments does not offer orrecommend such shielded holders; it is our experience that grounding of nearby metal objects,such as the microscope, usually provides adequate shielding. Vibration, either transmittedthrough the floor or through the air, is another source of external interference and adequatevibration isolation is almost always required for sensitive electrophysiological measurements.
Digitization Noise
Noise arising from digitization is often ignored. Sometimes this is justified since such noise canbe negligible with respect to other sources of noise. However, in some situations this potentialsource of noise can become significant. In order to ensure that this noise remains negligible oneneeds to understand the types of noise that can arise from digitization and to use analog to digitalconverters, preamplifiers, filters, etc. that are appropriate for the measurement of the signal.

Noise in Electrophysiological Measurements / 255
A X O N G U I D E
Quantization is the approximation of each value of a signal by an integer multiple of anelementary quantity δ, which is the quantizing step. For a 12-bit analog-to-digital converter(ADC) with full-scale range (FSR) of ±10 V, δ = 20V/212 = 4.88 mV; for a 16-bit converterwith the same FSR, δ = 305 µV. This approximation leads to the addition of a noise signal,called quantizing noise, to the original signal. When the signal being digitized is reasonablylarge relative to the quantizing step δ, the power of the quantizing noise can usually beapproximated by:
δ2
12
and the rms value of the quantizing noise is therefore:
δ2
12
For a 12-bit ADC with a 20 V FSR this noise value is 1.41 mV rms or about 8.5 mV peak-to-peak.
In the process of analog-to-digital conversion, the signal is sampled as well as quantized. Thesampling frequency is denoted by fs; e.g., when converting at 1 point every 10 µs, fs is100 kHz. In this case all of the quantizing noise power in the ADC output will appear in thefrequency band from DC to fs/2. The PSD is usually white (i.e., constant over the frequencyband) and has a value of δ2/6fs.
It is obvious that the quantizing step δ should be small relative to the signal being measured.This is easily accomplished in most situations by the use of appropriate preamplification to scalethe desired signal such that it fills a reasonable portion of the dynamic range of the ADC.Difficulties can arise, however, if you need to measure small changes embedded in large signals.Analog instruments can often have a dynamic range that considerably exceeds that of ADCs.Again, using the capacitive-feedback patch clamp as an example, noise levels as low as 0.02 pArms can be achieved at a bandwidth of 1 kHz; moreover, such an instrument can achieve noisethis low even with a gain as low as 100 µV/pA. This would amount to an rms noise of only2 µV. In order to utilize the full dynamic range of such an instrument at this bandwidth, an ADCwith 22-bit resolution (and capable of sampling at 2 - 5 kHz) would be required. To the best ofour knowledge, this much dynamic range is not required for electrophysiological measurementsand 12- to 16-bit resolution in conjunction with a variable amount of preamplification is quiteadequate (see Chapter 9 for further discussion).
Aliasing
A signal can be determined completely by a set of regularly spaced samples at intervals T = 1/fsonly if it does not contain components with a frequency equal to or greater than fs/2. This isbasically a statement of the sampling theorem; fs is just the sampling frequency mentionedabove. The term fs/2 will be denoted by fn and is often called the Nyquist frequency or foldingfrequency for reasons that will be described below. Another way of putting this is that for
256 / Chapter twelve
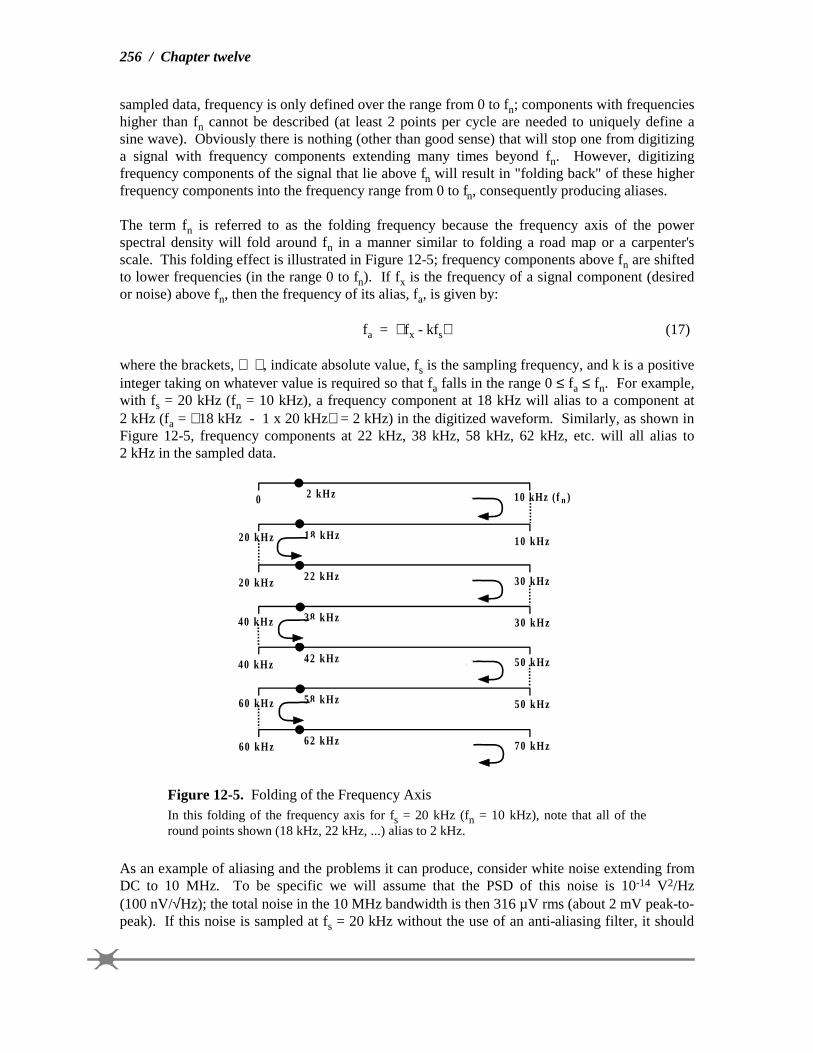
sampled data, frequency is only defined over the range from 0 to fn; components with frequencieshigher than fn cannot be described (at least 2 points per cycle are needed to uniquely define asine wave). Obviously there is nothing (other than good sense) that will stop one from digitizinga signal with frequency components extending many times beyond fn. However, digitizingfrequency components of the signal that lie above fn will result in "folding back" of these higherfrequency components into the frequency range from 0 to fn, consequently producing aliases.
The term fn is referred to as the folding frequency because the frequency axis of the powerspectral density will fold around fn in a manner similar to folding a road map or a carpenter'sscale. This folding effect is illustrated in Figure 12-5; frequency components above fn are shiftedto lower frequencies (in the range 0 to fn). If fx is the frequency of a signal component (desiredor noise) above fn, then the frequency of its alias, fa, is given by:
fa = fx - kfs (17)
where the brackets, , indicate absolute value, fs is the sampling frequency, and k is a positiveinteger taking on whatever value is required so that fa falls in the range 0 ≤ fa ≤ fn. For example,with fs = 20 kHz (fn = 10 kHz), a frequency component at 18 kHz will alias to a component at2 kHz (fa = 18 kHz - 1 x 20 kHz = 2 kHz) in the digitized waveform. Similarly, as shown inFigure 12-5, frequency components at 22 kHz, 38 kHz, 58 kHz, 62 kHz, etc. will all alias to2 kHz in the sampled data.
0 10 kHz ( f )n2 kHz
18 kHz 10 kHz20 kHz
22 kHz 30 kHz20 kHz
40 kHz 30 kHz38 kHz
40 kHz 50 kHz42 kHz
58 kHz 50 kHz60 kHz
62 kHz 70 kHz60 kHz
Figure 12-5. Folding of the Frequency AxisIn this folding of the frequency axis for fs = 20 kHz (fn = 10 kHz), note that all of theround points shown (18 kHz, 22 kHz, ...) alias to 2 kHz.
As an example of aliasing and the problems it can produce, consider white noise extending fromDC to 10 MHz. To be specific we will assume that the PSD of this noise is 10-14 V2/Hz(100 nV/√Hz); the total noise in the 10 MHz bandwidth is then 316 µV rms (about 2 mV peak-to-peak). If this noise is sampled at fs = 20 kHz without the use of an anti-aliasing filter, it should

Noise in Electrophysiological Measurements / 257
A X O N G U I D E
be obvious that the rms value of the sampled points will be the same as that of the original data,i.e., 316 µV. However, the sampled data cannot describe any frequency component greater thanfn, here 10 kHz. If a smooth curve is fitted through the sampled points (e.g., using a cubicspline), you will find that the noise appears to be bandlimited from DC to10 kHz and that its amplitude is the same as the original data; its power spectral density will be10-11 V2/Hz, i.e., 1,000 times higher than that of the original data because the sampling hasfolded over the original spectrum 1,000 times. The frequency components above 10 kHz have allbeen aliased into the frequency band extending from DC to fn. Clearly, aliasing has notincreased the total amount of noise, but it has shifted it from higher to lower frequencies. It isworth considering what will happen if the sampled data is subsequently digitally filtered with acutoff frequency of 1 kHz. This will result in reducing the noise from 316 µV rms to100 µV rms. However, if the original noise signal had been passed through an analog filter withthe same cutoff frequency (1 kHz), the noise amplitude would have been reduced to only3.16 µV rms. Once aliasing has occurred it cannot be undone by any digital operation. Thesolution here is either to sample much faster (> 20 MHz in this example) or, if a 20 kHz samplerate is required, to use an analog anti-aliasing filter to adequately reduce the amplitude of allfrequency components above 10 kHz.
If the PSD of the noise is not white but instead rises as f 2 with increasing frequency as is thecase for high frequency noise from a patch voltage clamp the consequences of aliasing can beeven more severe. As an extreme example, consider a voltage noise of 100 nV/√Hz in serieswith a 10 pF capacitor (see equation (13) and related discussion); in a 10 MHz bandwidth thiswould produce a current noise of 115 nA rms. Again, assuming a digitization rate of 20 kHzwith no anti-aliasing filter, all of this noise would be aliased into the frequency band from DC to10 kHz, even though the noise in a bandwidth of 10 kHz would have only been about 3.6 pA rms.Moreover, subsequent digital filtering of the digitized noise with a cut-off frequency of1 kHz, as in the previous example, would only reduce the noise amplitude to about 35 nA rms,whereas an analog filter set to a 1 kHz bandwidth would have reduced the noise to only0.115 pA rms 300,000 times less than achieved by digitally filtering the aliased noise. Ofcourse patch clamps do not have a bandwidth of 10 MHz; even with more realistic bandwidths,failure to use proper anti-aliasing filters can greatly increase noise beyond that existing in thebandwidth resolved by the digitization process (i.e., fn) and can reduce the effectiveness ofsubsequent digital filtering of the data.
It should be noted that in the above examples it has been assumed that the filter used had anabrupt cut-off at its -3 dB bandwidth. This will normally not be the case when measuring signalsin the time domain. Filters with Gaussian or Bessel characteristics (as are used most frequentlyfor electrophysiological measurements) roll off quite gradually beyond their -3 dB bandwidth (fc)and it is therefore not appropriate when using such filters to eliminate aliasing to set fc = fn.Recall that the requirement to avoid significant aliasing is that all frequency components above fnmust be adequately attenuated. When using a Bessel filter (typically 4- or 8-pole) for anti-aliasing, the choice of the cut-off frequency relative to fn depends on the characteristics of thenoise and how much aliasing can be tolerated. We advise the use of fc ≤ 0.4 - 0.5fn (0.2 - 0.25fs)as a useful and generally reasonable practice.

258 / Chapter twelve
Filtering
The above discussion naturally leads to a brief discussion of filtering. In general, the bandwidthof a filter is selected to reduce noise to acceptable levels so that the desired signal can beadequately observed. As described above, filtering prior to digitization is also necessary toprevent aliasing. If the signal to be measured is large in comparison with the background noise,then the filter bandwidth and the appropriate digitization rate can be chosen on the basis ofthe desired time resolution; wider bandwidths allow more rapid events to be resolved. However,in many electrophysiological measurements very wide bandwidths will result in backgroundnoise levels that will obscure the signals of interest. In such situations it is necessary to makecompromises between the amount of noise that can be tolerated vs. the time resolution that isachieved after filtering.
There is an interesting although perhaps unfortunate relationship between a function andits Fourier transform: as the function gets narrower its transform becomes wider. The impulseresponse of a filter (time domain; note that the integral of the impulse response is the stepresponse) and its transfer function (frequency domain) are a Fourier transform pair. There arelimits on the degree to which signals can be simultaneously "concentrated" in both the time andthe frequency domain (in fact, if stated formally, this is the uncertainty principle in the units weare using). In practical terms this means that a filter with a narrow impulse response, andtherefore a rapid risetime, will have a rather gradual roll-off in the frequency domain.Conversely, a filter with a sharp cut-off in the frequency domain will have a more spread-outimpulse response and slower risetime.
Among commonly used filters, those that provide the best resolution with little or no overshootand ringing of the step response are the Gaussian and Bessel filters (as the order of a Bessel filterincreases it more closely approximates a Gaussian filter). A true Gaussian filter is easy toimplement digitally, but is not often produced as an analog filter (although passive filters that area good approximation of this type can be constructed). Bessel filters are more commonly used inanalog applications. The basic characteristics of both filter types is quite similar. A Gaussianfilter has an impulse response with the shape of the Gaussian distribution; its step response hasno overshoot. The 10 - 90% risetime of the step response of a Gaussian filter is approximately0.34/fc, where fc is the -3 dB bandwidth in hertz. However, in the frequency domain the roll-offof this filter is quite gradual. Denoting the transfer function by H(f), H(fc) = 0.707 (-3 dB),H(2fc) = 0.25 (-12 dB), and H(3fc) = 0.044 (-27 dB). An 8th-order Bessel filter closelyapproximates this response in both the time domain and the frequency domain. Clearly, in termsof noise reduction, a filter whose transfer function rolls off much more quickly after it reaches fcwould appear to be desirable. Analog filters with such characteristics are readily available (e.g.,Elliptical and Chebyshev types); in fact, you can buy sharp cut-off filters with H(f) = 0.01(-40 dB) when f = 1.06fc. Digital filters can achieve even sharper cut-offs. Unfortunately,however, sharp cut-off filters are characterized by severe overshoot and prolonged ringing intheir step responses. Additionally, for a given value of fc, their risetimes can be nearly twice thatof a Gaussian or Bessel filter. Because of this, very sharp cut-off filters are desirable forfrequency domain measurements but quite undesirable for measurements in the time domain. Infact, in order to achieve the same time resolution with a sharp cut-off filter that is achieved with aGaussian or Bessel filter it is necessary to use a higher value of fc. In this case, the sharp cut-offfilter (with its higher fc) will pass as much or even more noise (depending on the spectralcharacteristics of the noise) as the more gradual roll-off Gaussian or Bessel filter when the two

Noise in Electrophysiological Measurements / 259
A X O N G U I D E
have been set to provide essentially equivalent time resolution (as judged by step responserisetime; see below). Some "exotic" filter types can produce the same risetime as the Gaussianfilter with minimal overshoot and reduce the noise by a small amount; however, unless the noisePSD rises very steeply with increasing frequency, the improvement is only a few percent.
It is instructive to quantitatively compare the performance of a Gaussian or Bessel filter with avery sharp cut-off filter for time-domain measurements. When the underlying signal to beresolved is a square pulse, as is the case with single-channel currents, it is reasonable to relate thetime resolutions of the filter to its 10-90% rise time. For single-channel measurements timeresolution is often thought of in terms of the minimum detectable event duration. To someextent, of course, such a minimum duration is dependent on the detection algorithm used. Evenso, it is reasonable to approximate the minimum detectable duration in terms of the filterbandwidth as 1/Tr4, where Tr is the 10-90% risetime of the filter. With such an operationaldefinition of time resolution or minimum detectable duration it is possible to compare theperformances of different filter types. As already noted, for a Gaussian or Bessel filter(8th order) Tr ≈ 0.34/fc, where fc is the -3 dB bandwidth in hertz. A 10th-order Chebyshev filter(0.1 dB pass-band ripple) is a reasonable selection to approximate the "brick wall" characteristicmentioned above; for this filter H(1.09fc) = 0.1 (-20 dB), H(1.22fc) = 0.01 (-40 dB), andH(2fc) = -95 dB. However, for this filter Tr ≈ 0.58/fc, i.e., approximately 1.7 times the risetimeof a Gaussian or Bessel filter with the same fc. Moreover the step response is characterized by apeak overshoot of about 20% and sustained ringing which is noticeable up to about 10/fc. Inorder to achieve the same 10-90% risetime with the 10th-order Chebyshev filter that is achievedwith a Gaussian or 8th-order Bessel filter, it is necessary to select the -3 dB bandwidth of theChebyshev filter to be about 1.7 times higher than the -3 dB bandwidth of the Gaussian or Besselfilter. For example, the risetime of a Chebyshev filter with fc = 17 kHz will be approximately thesame as that of a Gaussian or Bessel filter with fc = 10 kHz; it should be noted that the stepresponse of the Chebyshev filter will ring severely. Even if the ringing of its step and impulseresponse is ignored so that it is assumed that the 10th-order Chebyshev filter and the Gaussian orBessel filter have the same time resolution provided that fc (Chebyshev) ≈ 1.7fc (Gaussian), it isfound that the Gaussian or Bessel filter significantly out-performs the Chebyshev filter in termsof noise in the filtered signal. For white noise it would be found that the Chebyshev filter wouldpass approximately 1.3x the noise passed by the Gaussian or Bessel filter, provided, of course,that both filters had the same 10-90% rise time. For noise with a PSD that rises as f2, theChebyshev filter would actually pass about 1.5x the rms noise passed by the Gaussian or Besselfilter, again provided that the filters corner frequencies were set to produce the same risetime.Obviously, when time resolution is considered, extremely sharp cut-off filters are not the bestselection. Sharp cut-off filters should only be used when frequency domain data (e.g., powerspectral density) is being collected.
Finally, as an illustration of the distinction between the -3 dB bandwidth and the uppermostfrequency component of noise that can pass through a Gaussian or Bessel filter, consider a noiseprocess (e2(f)) whose PSD (V2/Hz) rises as f 2 with increasing frequency. On linear scales suchnoise is shown in Figure 12-6 along with the transfer function of a Gaussian filter (squared,
4 For a 50% threshold-crossing detection algorithm as is commonly used with single-channel data and a Gaussian or
Bessel filter, an event can be detected until its duration falls below about 0.54Tr. It is certainly true that it ispossible in principle to detect the occurrence of an isolated event of considerably shorter duration than Tr, but ourobjective here is to consider practical situations in which the event may not be isolated and must be characterized aswell as simply detected.

260 / Chapter twelve
H2(f)) and the noise PSD that will be observed at the filter output (i.e., H2(f)e2(f)). Note that thesquare root of the integral of the filtered noise PSD (i.e., the square root of the area under thecurve) will be the rms noise. The PSD of the filtered noise does not fall sharply at fc. In fact, thefiltered PSD reaches its peak at about 1.2 fc and does not fall to negligible levels until more than3 fc. This must be remembered when selecting a digitizing rate for any particular -3 dB filtersetting if aliasing is to be avoided. In comparison with a filter with a "brick wall" roll-off at thesame fc, the Gaussian filter will have somewhat more than 40% more noise at its output. Butrecall that the sharp cut-off filter will have a much poorer time-domain response. In fact, asdescribed above, if the -3 dB bandwidth of the sharp cut-off filter is selected to produceessentially the same time resolution as the Gaussian or Bessel filter, it will pass even more noisein this situation.
0.5
1.0
1.5
2.0
2.5
3.0
Tran
sfer
Fu
nctio
n
(Squ
ared
H
(f))
2
0 1 2 3 4
Pow
er
Spe
ctra
l D
ensi
ty
(V /
Hz
e (
f) a
nd e
(f
)H (
f))
0 .5
1.0
e ( f )2
H ( f )2
e ( f )H ( f )2 2
Normal ized Frequency ( f / f )c
22
22
3 .5
4.0
Figure 12-6. Squared Transfer Function of a Gaussian FilterIllustrated are squared transfer function of a Gaussian filter (H2(f)); noise process withPSD that arises as f 2 with increasing frequency (e2(f)); and the same noise process PSDafter passing through the Gaussian filter (e2(f)H2(f)). The scales are linear; frequency isnormalized to the -3 dB bandwidth (fc) of the filter; PSD scale is arbitrary. Note that dueto the gradual roll-off of the Gaussian filter, the filtered noise still has significant powerwell beyond fc.
A useful alternative to adjusting the analog filter bandwidth to attempt to achieve an optimumsignal-to-noise ratio is to digitize the data at a rapid rate through a Bessel filter with its -3 dBbandwidth set to prevent aliasing. The wideband digitized data may then be filtered digitally toachieve an acceptable signal to noise level. The digital filter should once again generally be ofthe Gaussian or Bessel type. In such situations more than one filter are used in series; if these areall of the Gaussian or Bessel type, then the final -3 dB bandwidth, fcF, is approximately given by:

Noise in Electrophysiological Measurements / 261
A X O N G U I D E
f
f f f
cF =+ + +
1
1 1 1
12
22
32 ...
where f1, f2, f3 ... are the -3 dB bandwidths of the individual filters in series. Of course, the sameexpression holds for a series combination of analog filters. The disadvantage to this generalapproach is that initial data storage will be increased due to the high digitization rate; once thedata has been digitally filtered it can also be decimated if desired.
Summary of Patch-Clamp Noise
HeadstageAt the time of publishing this Guide, the best capacitive-feedback headstages (the CV 201A andCV 202A of the Axopatch 200A) have an open-circuit noise of about 0.13 pA rms in a 10 kHzbandwidth (-3 dB, 8-pole Bessel filter). Resistive-feedback headstages have noise of about0.25 - 0.30 pA rms in this bandwidth. It is likely that developing capacitive-feedback technologyover the next few years will further yield improvements in noise. In fact, in theory, it should bepossible to produce a capacitive-feedback headstage with noise that is only about half of thatachieved presently.
HolderThe pipette holder contributes noise by increasing the capacitance at the headstage input; somedielectric noise must also be expected. The unshielded polycarbonate holders provided by AxonInstruments by themselves will only increase the headstage noise by about 10% above its opencircuit value even for the lowest noise capacitive-feedback devices. For example, for theAxopatch 200A with an open-circuit noise of 0.060 pA rms in a 5 kHz bandwidth (as shown onthe panel meter), the total noise with the holder attached should not increase beyond 0.070 pArms (note that larger noise increments probably mean that the holder needs to be cleaned), andwill often be as low as 0.065 pA rms. Inserting a saline-filled electrode into the holder willfurther increase noise even while the electrode tip is in air. With a saline-filled electrode, thenoise of the Axopatch 200A with an open-circuit noise of 0.060 pA in a 5 kHz bandwidth willgenerally increase to about 0.075 pA rms.
ElectrodeThe noise associated with the patch pipette is determined by the type of glass used, the wallthickness of the glass, the pipette geometry, the use of Sylgard coating, and the depth ofimmersion into the bath. At the present time, dielectric noise is probably the dominant source ofnoise associated with the electrode for all glasses except quartz. For glasses with lower Dεproducts most notably quartz it can be expected to become a much smaller component ofoverall noise. Additional noise will arise from the distributed resistance and capacitance of thepipette. For the best glasses presently in common use this source of noise is probably somewhatless than the dielectric noise of the glass; for very low-loss glasses, such as quartz, it could be thedominant source of pipette noise. A small amount of noise will also result from the thermal

262 / Chapter twelve
noise of the pipette resistance in series with the patch capacitance; only under certain situations(a large patch area) will this "Re-Cp" noise become significant.
Theoretical and experimental results indicate that a pipette fabricated from the lowest-noiseglasses (other than quartz) used to date (Corning #7760, #8161) with a moderate coating ofSylgard will produce noise of about 0.2 pA rms in a 10 kHz bandwidth (8-pole Bessel filter) foran immersion depth of about 2 mm. Under favorable circumstances this value can be cut at leastin half when the tip of the pipette is withdrawn to within 100 - 200 µm of the surface of the bath.For pipettes fabricated from quartz, preliminary results indicate that for a 1 mm depth ofimmersion, noise of somewhat less than 0.1 pA rms can be expected in a bandwidth of 10 kHz;with the very small immersion depth possible (10 µm or less) with the Silicone-fluid techniquedescribed above, it can be estimated that the noise contributed by a quartz pipette falls to lessthan half of this value. To date the only results obtained for quartz have involved pipettes withrelatively long narrow shanks and resistances of roughly 10 MΩ. Such a geometry is not idealfor achieving the lowest possible noise. As techniques for pulling quartz pipettes improve, andas other grades and suppliers of quartz are investigated, further improvements are likely.
SealThe noise associated with the seal is less easily predicted. Certainly a minimum estimate of thisnoise in a bandwidth B is given by (4kTB/Rsh)1/2, i.e., the thermal current noise of the DC sealresistance, Rsh. For excellent seals in the range of 50 - 200 GΩ this would mean that theminimum noise attributable to the seal is in the range of 0.03 - 0.06 pA rms in a 10 kHzbandwidth. Recent data suggests that under favorable circumstances seal noise may be as low asthese predicted values. However, experience indicates that there is a good deal of variability inthe noise of patches even when the seal resistances are very high and all other precautionsnecessary to minimize noise have been strictly observed. Some of this variability may well arisefrom the seal.
Limits of Patch-Clamp Noise Performance
With a capacitive-feedback headstage, such as the CV 201A or CV 202A of the Axopatch 200A,whose open circuit noise is less than 0.16 pA rms in a 10 kHz bandwidth, the best total noiseperformance obtained in an actual recording is ≈ 0.09 pA rms in a 5 kHz bandwidth and≈ 0.19 pA rms in a bandwidth of 10 kHz (all bandwidths are the -3 dB frequency of an 8-poleBessel filter). For both bandwidths the headstage by itself accounts for approximately 50% ofthe total noise and the holder, pipette and seal account for the other 50% of the total. Thus if theheadstage was somehow reduced to zero, the total noise for such a patch would fall to about 0.13- 0.14 pA rms in a 10 kHz bandwidth. It seems reasonable to expect that further improvements inthe noise associated with the holder and pipette can be expected in the future. Of course, thenoise associated with the seal is a fundamental limitation of the patch clamp technique. Anabsolute minimum estimate for seal noise in a 10 kHz bandwidth is about0.03 - 0.04 pA rms; this assumes a 100 - 200 GΩ seal producing only thermal noise. An estimateof the minimum noise associated with an improved holder, quartz pipette and seal in a 10 kHzbandwidth is then about 0.06 pA rms. These figures suggest that as holder and pipettetechnology continues to improve, it will be worthwhile to continue to seek methods to reduce thenoise of the headstage itself. It is reasonable to expect that total noise levels roughly half of the
Noise in Electrophysiological Measurements / 263
A X O N G U I D E
best values achieved to date will become possible. However, to achieve such noise levels,careful attention to every aspect of the patch-clamp technique will be important.
Further Reading
Rae, J.L., Levis, R.A. A method for exceptionally low noise single-channel recording. PflügersArch. 420, 618-620, 1992.
Rae, J.L., Levis, R.A. Quartz pipettes for single-channel recording. Biophys. 64, A201(P394), 1993.
Sakmann, B. and Neher, E., Eds. Single-Channel Recording. New York: Plenum Press, 1983.

264 / Chapter twelve