Changes in the heating and cooling energy use in buildings ...
110
Transcript of Changes in the heating and cooling energy use in buildings ...


Tnis report :'.'as prcpared as an accouii; of xc rk sponsErc:! hy an age-cy of ih:. Uii,tsd S?atcsQovernrnent Neiiiiei iitt;Ginited StatesGovei liiiyant nor ai?y agency therecf. nor any of ihi.ri c r n ; ! ~ : ~ % ? _ ~ , makes any :v'rranty, eYpiCL;S 3r iinplled or assbiiii-5 any leizal liability or respocnihility for the Icszracy. completoness. or usefulness of zn:! inforiiiaiion. znpaiatus, product or process disclose?, or represents ih6t i ts use,;;nuld no; ,r,f<inge priv ghts 5eicrencehz:oin to any spesific: comitibiilril product. prcjcess, redc i-iaiiie. t r idemxk. rnanu?asture:, or othnw!EL?, does not n nstitutn or inp ly ; ;s end o r s e x e ; , r ar ,,,.~~~la;ldation, t.- -- - or lawring hy t h e Uiit;sd Stai63!-~7-e^nn~,: or any a g ~ n c y therec!. The v i e w and opinions of authors expressed nccessarily stete cr re'!nii thssc ; t i h e Gnite:! States5cveinfiien! 3r any agency llltrec!. .L.
.______ __ . . ___ .. ..___ ~ ...... .
.

ORNL/TM- 10339
CHANGES IN THE HEATING AND COOLING ENERGY USE IN BUILDINGS DUE TO LOWERING THE SURFACE
SOLAR ABSORPTANCE OF ROOFS
Edwin I . Griggs
Tennessee Technological University Cookevi 11 e , TN
and
George E . Courville
Energy Division Oak Ridge National Laboratory
Oak Ridge, TN
Par t of The National Program f o r
Building Thermal Envelope Systems and Materials
Date Pub1 ished - February 1989
Report Prepared by Tennessee Technological University
f o r
Oak Ridge National Laboratory Energy Division Oak Ridge, TN operated by
MARTIN MARIETTA E N E R G Y SYSTEMS, f o r the
U. S. DEPARTMENT OF ENERGY under
Contract DE-AC05-84BR21400
INC.
MARTIN M A W I T A F M R G Y SYSTEEMSLWRARIES
3 4456 0 2 8 3 3 3 7 L


TABLE OF CONTENTS
Page
NOMENCLATURE ..................................................... V
LIST OF FIGURES .................................................. i x
LIST OF TABLES ................................................... x i FOREWORD .......................................................... xv BTESM BEPORTS. .................................................... x v i i EXECUTIVE SUMMARY. ................................................ x x i Sec t ion
ABSTRACT ................................................ 1
1. INTRODUCTION ............................................ 1
2. LITERATURE REVIEW ....................................... 2
................. 2.1. Reported S o l a r Absorptance Values 2
2.2. Surface Temperature ............................... 3
2.3. Energy Use Cons idera t ions ......................... 4
2.4. Summary ........................................... 6
3. RELATED CONCEPTS ......................................... 6
3.1. Thermal Rad ia t ion Cons idera t ions .................. 6
3.2. S o l - A i r Temperature ............................... 7
3.3. Discuss ion o f Changes i n B u i l d i n g Loads Due t o Change i n t h e S o l a r Absorptance o f t h e Roof ....... 8
3.3.1. D e f i n i t i o n and I l l u s t r a t i o n o f Terms ...... 8
3.3.2. Steady-State Ca lcb i la t ion o f Roof Heat T r a n s f e r Using S o l - A i r Temperature ........ 9
4. PRESENTATION AND DISCUSSION OF RESUtTS .................. 12
4.1. I n t r o d u c t i o n ...................................... 12
4.2. DOE 2.1B .......................................... 12
4.3. Specia l Cons idera t ions f o r t h i s Study ............. 13
iii

Sect ion Page
4.3.1. Weather Data .............................. 4.3.2. Values o f So la r Absorptance ............... 4.3.3. Overa l l Heat Trans fer Coe f f i c i en t .........
4.4. Resul ts o f Ca lcu la t ions Using Only the LOADS Program ...........................................
4.5. B u i l d i n g Simulat ions .............................. 4.5.1. B u i l d i n g A ................................ 4.5.2. B u i l d i n g B ................................ 4.5.3. B u i l d i n g C ................................ Comparisons o f B u i l d i n g P red ic t i ons t o Steady-State Estimates ......................................... 4.6.
4.7. Economic Considerat ions ........................... 5 . SUMMARY WITH CONCLUSIONS AND RECOMMENDATIONS ............
5.1. Summary ........................................... 5.2. Observations and L i m i t a t i o n s ...................... 5.3. Conclusions ....................................... 5.4. Recommendations ...................................
6 . REFERENCES .............................................. APPENDIX A: Publ ished Absorptance Values f o r Various B u i l d i n g
Ma te r ia l s and Surface Coatings ...................... APPENDIX B: ACES and AMEP Values Based on Reference 2 ........... APPENDIX C :
APPENDIX D:
Co r re la t i ons f o r ho Used i n DOE 2.18 ................ Pre l im inary Ca lcu la t ions o f ACES and AHEP Using Only DOE 2.1B LOADS Subprogram ...........................
APPENDIX E : B u i l d i n g Descr ip t ions ............................... APPENDIX F: Changes i n Annual B u i l d i n g Energy Requirements Com-
puted by DOE 2.1B f o r Bu i l d ings A & B Corresponding t o a Reduction i n Surface Absorptance from 0.8 t o 0.3 .................................................
13
13
13
16
16
17
21
27
31
31
33
33
35
36
36
37
39
49
55
59
65
7 3
i v

NOMENC LATU WE c
Symbol
A
A C E 1
ACE2
ACES
AHE 1
A H E 2
AHEP
(ACES + A H E P )
B
c
CDD
CEC
G
HDD
he
Description Units
Constant i n ho-wind speed Correlation (see Equation C . l in Appendix C )
Btu/hr-ft2-F
Annual cooling energy per uni t roof area Btu/ft2 f o r h i g h roof ~1
Annual cooling energy per u n i t roof area Btu/f t 2 for low roof 01
Reduction i n cooling energy per u n i t roof area following a d i scre te change i n CI
Btu/ft*
Annual heating energy per u n i t roof area Btu/ft2 for high roof CI
Annual heating energy p e r u n i t roof area B t u / f t 2 fo r low roof a
Increase i n heating energy per uni t roof area following a d iscre te change in cx
B t u / f t2
Sum of annual cooling energy savings and annual heating energy penalties per u n i t roof area (represents reduced heat gain as manifested by e f f e c t on loads due t o reducing roof ' s a)
B t u/ f t
Constant in ho-wind speed correlat ion (see Equation C. 1 in Appendix C )
- Btu-hr h r - f t 2- F-mi
Constant i n ho-wind speed correlat ion (see Equat ion C . l in Appendix C )
B t u - h r 2 hr-ft-F-mi
Designates cooling degree days
Cooling energy cost
Incident so la r radiation per u n i t roof area
Mean da i ly so la r radiation on a horizontal surface
Designates heating degree days
External f i lm heat t ransfer coef f ic ien t due so le ly t o convection
F
& / B t u
B t u hr-ft2
B t u day-ft2
F
B t u hr-f t 2 - F
V

Symbol
HEC
h i
h r
U '
"0
V
V -
Greek Symbol
0:
Descr ip t i on
Heat ing energy cos ts
Ins ide sur face f i l m heat t r a n s f e r coef f i c i e n t
Combined convect ive and r a d i a t i v e heat t r a n s f e r c o e f f i c i e n t (he I- h r )
Radiat ive heat t r a n s f e r c o e f f i c i e n t 3.5)
o f an investment
( see €qua t i on
Present wor th
Present wor th used f o r cool
Present worth used f o r heat
f a c t o r app l i cab le t o energy n!7
f a c t o r app l i cab le t o energy ng
Condit ioned space temperature
E x t e r i o r r o o f sur face temperature
Sol - a i r temperature
Outside a i r temperature
Overa l l heat t r a n s f e r c o e f f i c i e n t (ou ts ide a i r t o i n s i d e a i r )
Heat t r a n s f e r c o e f f i c i e n t (ou ts ide sur face t o i n s i d e a i r )
Overa l l heat t r a n s f e r c o e f f i c i e n t ( s o l - a i r t o i n s i d e a i r )
Wind speed
Annual mean wind speed
..I_ Descr ip t i on
Herni spher ica l sur face absorptance
Monachromatic absorptance
Cool ing system c o e f f i c i e n t o f performance
U n i t s
t / B t u
Btu h r - f t 2-F
Btu h r - f t 2 - F
Btu h r - f t 2- F
&/ft2
--e
-..-
O F
OF o r O R
"F
O F or O R
8 t u h r - f t 2- F
Btu k r - f t 2-F
Btu hr- f t 2 - F
mi /h r
rni/hr
U n i t s
--- --- ---
v i

Greek Symbol
A E
(5
T
‘A
Description Units
B t u Difference between the energy emitted by a blackbody a t T, and the longwave radiation h r - f t 2 incident on a surface
Infrared emittance --- Heating system ef f ic iency
Hemispherical surface reflectance
Monochromatic reflectance .....-
B t u hr-ft2-R4
Stefan-Bo1 tzmann Constant (0.1714 x 1P8)
Hemispherical transmittance
Monochromatic transmittance
v i i


LIST OF FIGURES
Figure Page
3.1.
3.2.
4.1.
4.2.
4.3.
4.4.
4.5.
4.6.
4.7.
4.8.
4.9.
I l l u s t r a t i o n o f Load Change Due t o D isc re te Change i n Roo f ' s a ................................................. I l l u s t r a t i o n o f Poss ib le S o l - A i r Temperature V a r i a t i o n i n Re la t i onsh ip t o I n s i d e Temperature ....................... Cool ing Degree Day and Heat ing Degree Day Data f o r Ovet- Two Hundred Weather Repor t ing S t a t i o n s i n the Un i ted States ................................................... Comparison o f HVAC C o i l toad Changes (ACES and AHEP) Predic ted by DOE 2. lB Systems f o r B u i l d i n g A Due t o a Lowering o f the Roof 's So la r Absorptance from 0.8 t o 0.3 I
I l l u s t r a t i o n o f V a r i a t i o n o f (ACES f AHEP) w i t h the D a i l y Mean Solar Radiat ion on a Hor i zon ta l Surface ( B u i l d i n g A; U' = 0.2 B tu /h r - f t 2 -F ) ...................... I l l u s t r a t i o n o f the E f f e c t o f Thermal Resistance on Computed (ACES + AHEP) and the D i f f e rence (ACES - AHEP) f o r B u i l d i n g A ........................................... Comparison o f HVAC C o i l Load Changes (AHEP and ACES) Predic ted by DOE 2.18 Systems f o r B u i l d i n g B (Case B l ) Due t o a Lowering o f Roof's So la r Absorptance from 0.8 t o 0.3 ............................................... I l l u s t r a t i o n o f V a r i a t i o n o f (ACES + AHEP) w i th the D a i l y Mean So la r Radiat ion on a Hor i zon ta l Surface (Case R 1 f o r
I l l u s t r a t i o n o f the E f f e c t o f Thermal Resistance on Computed (ACES + AHEP) and the D i f f e rence (ACES - AHEP) f o r Case B 1 o f B u i l d i n g B ................................
B u i l d i n g B w i t h U ' = 0.2 B t u / h r - f t 2 - F ) ...................
HVAC C o i l Load Changes (ACES and AHEP) Predic ted by DOE 2.15 f o r Cases B l and 82 o f B u i l d i n g B R e s u l t i n g from Lowering the Roo f ' s So la r Absorptance from 0.8 t o 0.3 ...................................................... HVAC C o i l Load Changes (AHEP and ACES) Predic ted by DOE 2.13 Systems f o r Cases B3 and 82 o f B u i l d i n g 13 Resu l t i ng from Lowering the Roof 's So la r Absorptance from 0.8 t o 0.3 ..........................................
8
11
14
18
19
20
22
23
24
25
27
i x

Figure Page
4.10. HVAC Coil Load Changes ( A H E P and ACES) Predicted by DOE 2.18 Systems f o r Cases B4 and 53 o f Building B Resulting from Lowering the Roof's Solar Absorptance from 0.8 t o 0 .3 .......................................... 28
4.11. Comparisons o f Annual Cooling Energy Savings ( A C E S ) and Annual Heating Energy Penalty ( A H E P ) f o r Buildings A , 8, and C. Results Based on SYSTEMS O u t p u t .................. 29
B.l. Weather Zones i n the Ten U.S. Federal Regions (From Reference 2 ) ............................................. 50
C . 1 . Representation of Correlations fo r ho w i t h Wind Speed Incorporated i n DOE 2.15 f o r Different Surface Rough- nesses ................................................... 57
E . l . Schematic o f Bui'Oding A .................................. 67
E.2. Schematic o f Building B .................................. 68
E.3. Schematic of Building C .................................. 69
X

LIST OF TABLES
Tab1 e
4.1.
4.2.
4.3.
4.4.
A. 1.
A. 2.
A. 3.
A. 4.
A. 5.
A. 6.
A. 7.
A. 8.
A. 9.
Climate-Related Data f o r Twenty Locations Used i n th i s Study (Sources: References 14 and 15) .................... Annual Cooling Energy Savings (ACES) and Annual Heating Energy Penalties Predicted f o r a Roof Having a U ' Value o f 0.2 B t u / h r - f t 2 - F when I t s Solar Absorptance is Reduced from 0.8 t o 0 . 3 (ACES and A H E P i n k B t u / f t Z of Roof Area) . . Comparison of (ACES + AHEP) f o r Certain Building R u n s by DOE 2.1B and the Steady-State Estimate o f (ACES + AHEP) by Equation (3.11) (ACES and AHEP i n k B t u / f t 2 of Roof Area) ..................................................... Comparative Annual Cost Savings Resulting from Lowering a Roof's Absorptance from 0.8 t o 0.3. $ / f t 2 and a re Based on Elec t r ica l Energy Cost o f 6.226$/kw-hr and Heating w i t h Natwal Gas Costing 5.58$/106 B t u a t an Efficiency of 70%*.
Solar Absorptance Values Given i n Table 2 of Reference 3 . . Solar Absorptance Values Recommended i n Reference 4 (Table 5.5 i n Reference 4 ) ................................ Solar Reflectance and Absorptance f o r Walls Made of
Solar Reflectance and Absorptance f o r Walls Made of Bricks (From Table 2 of Reference 5 ) ......................
Ualues a re Given i n
All Cases a re f o r a Roof Having a U ' Value of 0 .2 B t u / h r - f t 2 - F ..........
Concrete and Adobe Blocks (From Table 1 o f Reference 5 ) ...
Solar Reflectance and Absorptance o f Painted and Coated Malls (From Table 3 of Reference 5) ....................... Solar Reflectance and Absorptance o f Shingled Roofs (From Table 4 of Reference 5 ) ............................. Solar Reflectance and Absorptance of Coated and Built-up
Color Classif icat ion f o r Opaque Building Materials (From
Values o f Solar Reflectance, Solar Absorptance and Thermal Emittance f o r Several Samples o f Materials Used on Roofs
Roofs (From Table 5 o f Reference 5 )
Table 7 of Reference 5)
.......................
...................................
(From Table 1 o f Reference 6 ) ............................. x i
Page
15
30
32
34
40
40
41
42
43
44
45
46
47
Table
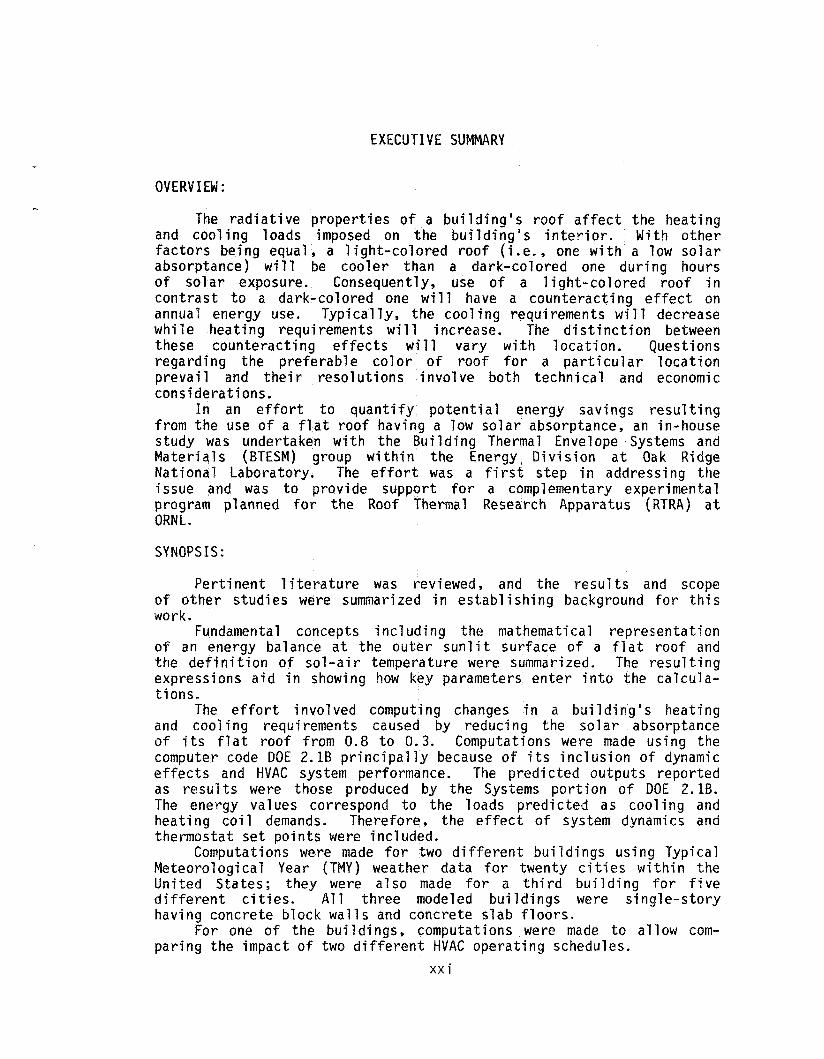
A. 10.
6.1.
G. 1.
D, 1.
D. 2.
D. 3.
D. 4.
F. 1.
F. 2.
F. 3.
F. 4.
F. 5.
Page
So lar Absorptance Values f o r Various E x t e r i o r Surfaces (From Chapter I11 o f Reference 7 ) ......................... Annual Cool ing Energy Savings (ACES) and Annual Heat ing Energy Pena l t ies (AWEP) Based on the Report by Ghang and Busching [23 (All Annual Energy Values Are pe r f t2 o f Roof Area.) ............................................... Constants f o r Equation ( C . l ) .............................. Pre l im inary AGES and AHEP Values from DOE 2.1B LOADS Subprogram Using Steady-State Ca lcu la t ions . L i s t e d i n Table D.4 (ACES and AHEP i n Btu pe r f t2 o f
I n p u t Data
Roof Area) ................................................ Pre l im ina ry ACES and AHEP Values from DOE 2.1B LOADS Subprogram Using Roof Thermal Response Factors (Roof I n s u l a t i o n : Fiberboard, Other I n p u t Data Given i n Table D-4) (ACES and AHEP Are i n Btu pe r f t2 o f Roof Area. ) .................................................... Pre l im ina ry ACES and AHEP Values fram DOE 2.1B LOADS Subprogram Using Roof Thermal Response Factors (Roof Insu la t i on : (ACES and AHEP Are i n Btu per f t2 o f Roof Area.) .......... EPS, Other I n p u t Data Given i n Table D.4)
Data Used i n Making the Trans ien t LOADS Ca lcu la t i ons ...... Pred ic ted Changes -in Annual Energy Requirements f o r B u i l d i n g A (U' = 0.2 B tu /h r - f t2 -F ; Roof 's ~1 Reduced from 0.8 t o 0.3) .......................................... Pred ic ted Changes i n Annual Energy Requirements f o r B u i l d i n g A (U' = 0.1 B tu /h r - f t2 -F ; Roof 's 0: Reduced from 0.8 t o 0.3) .......................................... Pred ic ted Changes i n Annual Energy Requirements f o r B u i l d i n g A (U' = 0.04 B tu /h r - f t 2 -F ; Roof 's ~1 Reduced from 0.8 t o 0.3) .......................................... Pred ic ted Changes i n Annual Energy Requirements f o r B u i l d i n g B, Case B 1 (U' = 0.2 Btu /hr - f tZ -F ; Roof 's a '
Reduced from 0.8 t o 0.3) .................................. Predic ted Changes i n Annual Energy Requirements f o r B u i l d i n g B, Case B 1 (Ut = 0 .1 B tu /h r - f t 2 -F ; Roof 's a Reduced from 0.8 t o 0 . 3 ) ..................................
48
51
56
61
62
63
64
7 5
76
7 7
78
79
x i i

Table Page
F.6. Predicted Changes i n Annual Energy Requirements f o r Building B , Case B 1 (Ul = 0.04 B t u / h r - f t Z - F ; Roof's a Reduced from 0.8 t o 0.3) .................................. 80
F.7. Predicted Changes i n Annual Energy Requirements f o r Building 3, Case B2 (U l = 0.2 B t u / h r - f t 2 - F ; Roof's O!
Reduced from 0.8 t o 0 . 3 ) .................................. 81
F.8. Predicted Changes i n Annua l Energy Requirements f o r Building B, Case B3 (U' = 0 .2 B t u / h r - f t 2 - F ; Roof 's O!
Reduced from 0.8 t o 0.3) .................................. 82
F.9. Predicted Changes i n Annual Energy Requirements f o r Building B, Case B4 ( U l = 0.2 B t u / h r - f t 2 - F ; Roof 's a Reduced from 0.8 t o 0 . 3 ) .................................. 83
x i i i


FOREWORD
Th is i s one o f a s e r i e s o f r e p o r t s t o be pub l i shed d e s c r i b i n g research, development, and demonstrat ion a c t i v i t i e s i n support o f t he Na t iona l Program f o r B u i l d i n g Thermal Envelope Systems and Ma te r ia l s . The Na t iona l Program invo lves several f ede ra l agencies and many o the r o rgan iza t i ons i n t h e p u b l i c and p r i v a t e sectors who a r e addressing t h e n a t i o n a l o b j e c t i v e o f decreasing energy wastes i n t h e . hea t ing and c o o l i n g o f b u i l d i n g s . Na t iona l Program through de lega t ion o f management r e s p o n s i b i l i t i e s f o r t he DOE lead r o l e t o the Oak Ridge Nat ional Laboratory.
Resu l t s descr ibed i n t h i s r e p o r t a r e p a r t o f t h e
George E. C o u r v i l l e Program Manager B u i l d i n g Thermal Envelope
Systems and M a t e r i a l s Oak Ridge Na t iona l Laboratory
J. A. Smith Ptogram Manager, D i r e c t o r o f B u i l d i n g
Systems O f f i c e o f B u i l d i n g s and Cornuni ty Systems Department o f Energy


BTESW REPORTS
C. SYSTEMS
1.
2.
3.
4.
5.
6.
7.
8.
9.
10.
11.
12.
13,
14.
15.
16.
17.
LBL-8822: A New Measurment Strategy f o r I n -S i tu Testing o f Wal l Thetmal Performance (March 1979).
LBL-9821: Measurement o f I n - s i t u Dynamic ThennaI Performance o f Bu i l d ing Envelopes Using Heat Flow Meter Arrays (December 1979).
NBS/BS Ser ies 123: The E f f e c t of Moisture on the Thermal Conductance o f Roofing Systms (Apri 1 1980).
ORNL/Sub-78/97726/1: A F i e l d Study o f Moisture Damage in Wal Is Insulated Without a Vapor B a r r i e r (May 1980).
ORNLICON-46: An Appraisal o f the M Factor and the Role of Bui ld ing Thermal Mass i n Energy Conservation [July 1980).
NBSIR 80-2100: Thermal Resistance Measurements o f a Bu i l t -up Roof System (October 1980).
QRNL/TR-4679:
ORNL/TM-7629: Roofing Research - A Bib7iography (April 1981).
ORNLITM-7640: The Assessment o f Roofing Research. An I n t e r i m Report ( Ju ly 1981).
Southwest Thermal Mass Study, Tesuque Pueblo, New Mexico: Construct ion and I n s t r m e n t a t i o n Phase (October 1981).
LBL-13436: The Envelope Thermal Test U n i t (ETTU): F i e l d Measurment o f Wal l Performance (October 1981).
LBL-13510: Wa 17s (November 1981).
LBL-13503: Simpl i f ied Thermal Parameters: A Model o f the Dynamic Performance o f Wal l (December 1981).
N B S I R 81-2443:
CERL TRIM-308: (February 1982) e
CQNF-811179: Modeling o f Roofs, November 3-4, 1981, At lanta, Georgia (April 1982).
ORNL/Sub-42539/1: Heat T rans fe r C h a r a c t e r i s t i c s o f a S t r u c t u r a l Normal Weight Concrete Wall (February 1983).
x v i i
Roofing F e l t on Polystyrene (December 1980).
The Determination o f the Dynamic Performance o f
Plan f o r A Round Robin o f H o t Boxes (February 1982).
I nsu la t i on Retraf i t Under Low-Slope Roofs
Proceedings DOE-ORNL Workshop on Mathematical

18. ORNLJSub-95006J1: Thermal Roof Systems Performance Study (March 1983) 0
19.
20 *
21.
22.
23.
24
25 e
26 ,,
27 I
28 e
29.
30"
31.
32 e
33.
34 a
OWNL/TM-8571: Thema1 Envelope f i e l d Measurements i n an Energy-Ef f i c ien t O f f i ce and Dormitory ( A p r l l 1983).
OWML/Sub-42539/2: Heat Transfer Charac te r i s t i cs o f a S t ruc tu ra l L ightweight Concrete Mal l (June 1983).
CONF-8266130: (August 1983).
Proceedings of the B u i l d i n g Thermal Mass Seminar 1982
QRNL/Sub-42539/3: Heat Transfer Charac ter is t ics o f a Low Densi ty Concrete Ma 1 1 (August 1983) . ORNL/CON-97: Thermal Mass Assessment (September 1983).
ORNL/Sub-81-22293/1: Energy Savings Po ten t i a l o f Roofing Research (December 1983).
ORNL/Sub-7948/1: Southwest Thermal H a s Study: The E f f e c t o f Envelope Themal Mass OR the Heating Energy Use o f E igh t Test Bu i ld ings I n a High Desert Cl imate ( A p r i l 1984).
ORNLfTM-9004: Econmic Analyses o f I n s u l a t i o n Ma te r ia l s Used in Low-Slope, Buj 1 t-Up Roof Systems (June 1984)
ORNLfCON-151: O f f i ce /Domi to ry Bu i l d ing i n Oak Ridge, Tennessee (July 1984).
Cool ing Season Performance o f an Ear th Shel tered
OANL/Sub-7948/2: Thermal Mass E f f e c t f o r E igh t Test Bu i ld ings W i t h and Without Windows (September 1984).
Observation and Pred ic t i on of the Heat ing Season
QRNL/Sub-42539/4: Cal ib ra ted Hot 3ox Test Resul ts Data Manual
ORNL/Sub-82-22293/2: Capab i l i t y (March 1985).
Roofing Indus t ry Perspect ive and Research
ORML/Sub-00240/6: B u i l d i n g Foundation Research (Jh?nuary 1985)
Assessment o f the Energy Savings Po ten t i a l o f
ORNL-6171: I n s u l a t i o n S y s t m Basics fur Bui l t -Up Roof (June 1985)
ORNL-6172: Decision Guide for Roof I n s u l a t i o n R-value (June 1985)
ORNL/Sub-70376/1: o f Thermal Break Ma te r ia l s f o r Anmaby Cor rec t ion , Volume I - Survey and Assessment (July 1985) -
A Survey o f B u i l d i n g Anmal ies and Assessment
xviii

35 .
36.
37 *
3%.
39.
40.
41.
42.
43.
44.
45 *
46.
47.
48.
49.
50.
51.
ORNLlSub-7037612: A Survey o f Bu i l d ing Anmal ies and Assessment o f Thema 1 Break Uater i a 1s f o r Anma ly Correct ion, Vo lime 11 - Proceedings of the Federa 1 Workshop on Bui Id ing fnve lope Thema 1 Anomalies (July 1985).
ORNL-Sub-4253915: Volme I1 (August 1985).
ORNLICON-186: Effect iveness o f Earth Sheltered Construction: A Case Study (September 1985).
Gal ibrated Hot Box Test Results Data Manual,
Detai led Thermal Performance Measurments and Cost
KICSDITM-56: Concrete Wal ls (September 1985) e
Analysis o f Cal ibrated Hot Box Data for Three
KICSDITM-58: Necessary Conditions f o r l oca t i ng Wet l n s u l a t ion w i t h In f ra red Thermography (November 1985).
The Use o f Roof Temperature Modeling t u Predic t
ORNLICON-188: Roof Test Center - A PreI iminary Concept Paper (November 1985).
ORNL/Sub-4312211: Mathematical Modeling of Whole Roof S y s t m Performance (January 1986).
ORNLISub-4312212: (January 1986).
ORNLISub-43122/3:
Thema 1 and Hygr ic Roof (THR) Mode? Program
User 's Manual f o r Program ROOF (January 1986).
KICSDITM-59: Ca l ib ra t i on of Heat Flux Through a Mal 1 Containing a Cavi ty - Comparison o f Several Models (February 1986).
NBSIR 86-3328: The Assessment o f Accuracy o f I n - S i t u Methods f o r Measuring Bu i l d ing Envelope Thermal Resistance (February 1986).
NBSIR 85-3264: A Methodology f o r Assessing the Thennal Perfomance of Low-Sloped Roofing Systms (May 1986).
ORNL/Sub-42539/7: Cal ibrated Hot Test Box Specimen (June 1986).
Surface Tmperature Measurment Techniques For a
ORNL/Sub-42539/6: Heat Transfer Character is t ics o f Wal ls Wi th S im i la r Thermal Resistance Values (June 1986).
ORNL/Sub/85-27497/1: Bu i ld ing Foundat ions Research, Smary Report (November 1986).
ORNLjCON-222:
ORNL/Sub/ 83-703731 1 : Simulations (January 1987).
Assessment o f the Energy Savings Po ten t i a l o f
Bu i l d ing Foundations Research Agenda (December 1986).
Thenna J Mass: BLAST Res ident ia 7 Parametric
x i x

52
53
54 e
5% e
56 "
57.
58 rn
59 c
60.
61
62.
63 0
ORNLISubf83-7637312: Thema 1 Mass: A Cmparison of Measurments and BlAST Pre i c t i o n s f o r S i x Test C e l l s i n Two Climates (January 1987).
ORNL/Sub-21006/1: F e a s i b i l i t y Study (March 1987)
The Roof Research Center - A Nat iona l User F a c i l i t y f o r Thermal Perfomance and D u r a b i l i t y of Roofing Systems ( A p r i l 1987).
Sfructusa 7 Thema? Break Systems f o r Bu i l d ings -
ORNL/Sub/85-%9453/ 1: Systems (July 1987).
U 1 t r a v i o d e t Radiat ion Tes t ing o f Roofing
ORNL/M-340: Roofing Research Needs: An URN1 D r a f t Assessment (August 1987).
CON-221: Model (September 1987).
Simula t ion of the SMTMS Test C e l l s Using the DQE-2.1A
ORNLISub/79-42539/8: Heat Transfer Charac te r i s t i cs o f Insu la ted Concrete San ich Panel Ma175 (September 1987).
ORNh/$~-OO2946 1 : (December 1987).
Bu i Id ing Envelope Thema 1 Anma ly Ana lys i s
ORNLKON-245: Founda b: ions Thema 1 Performance (December 1987 1 . Impact o f CFC R e s t r i c t i o n s on U.S. B u i l d i n g
ORNL/Sub/86-72143/1: Handbook (May 1988).
Energy-Eff i c i e n t B u i l d i n g Foundat ion Design
ORNLIM-339: Marketing Plan and S t ra teg ies - Roof Research Center (June 1988) .
ORNL/Sub/84-21006/2: Bu i ld ings - Developnent and Proper t ies o f Concrete S y s t m s (December 1988).
S t r u c t u r a l Thermal Break S y s t m s f o r
xx
EXECUTIVE SUMMARY
OVERV I EN :
The radiat ive properties of a bui lding 's roof a f f ec t the heating and cooling loads imposed on the bui lding 's i n t e r io r . With other fac tors being equal, a l ight-colored roof ( i - e . , one with a low so lar absorptance) will be cooler than a dark-colored one during hours o f so lar exposure. Consequently, use of a light-colored roof i n contrast t o a dark-colored one will have a counteracting e f f e c t on annual energy use. Typically, the cooling requirements will decrease while heating requirements will increase. The d is t inc t ion between these counteracting e f f ec t s will vary w i t h location. Questions regarding the preferable color of roof f o r a par t icu lar location prevail and t h e i r resolutions involve both technical and economic considerations.
In an e f f o r t t o quantify potential energy savings resu l t ing from the use of a f l a t roof having a low so lar absorptance, an in-house study was undertaken w i t h the Building Thermal Envelope Systems and Materials (BTESM) group w i t h i n the Energy Division a t Oak Ridge National laboratory. The e f f o r t was a f i r s t s tep i n addressing the issue and was t o provide support f o r a complementary experimental program planned f o r the Roof Thermal Research Apparatus (RTRA) a t O R N L .
SYNOPSIS :
Pertinent l i t e r a t u r e was reviewed, and the r e su l t s and scope of other s tudies were summarized in es tabl ishing background for t h i s work.
Fundamental concepts including the mathematical representation o f an energy balance a t the outer sunl i t surface of a f l a t roof and the def ini t ion o f so l - a i r temperature were summarized. The resu l t ing expressions aid i n showing how key parameters en ter in to the calcula- t i ons .
The e f f o r t involved computing changes in a bui lding 's heating and cool ing requirements caused by reducing the so la r absorptance of i t s f l a t r o o f from 0.8 t o 0 . 3 . Computations were made using the computer code DOE 2.18 pr incipal ly because of i t s inclusion of dynamic e f f e c t s and HVAC system performance. The predicted outputs reported as r e su l t s were those produced by the Systems portion of DOE 2.1B. The energy values correspond t o the loads predicted as cooling and heating coi l demands. Therefore, the e f f e c t o f system dynamics and thermostat s e t points were included.
Computations were made f o r two d i f f e ren t buildings using Typical Meteorological Year ( T W ) weather data f o r twenty c i t i e s w i t h i n the United S ta t e s ; they were a l so made f o r a t h i r d b u i l d i n g f o r f i ve d i f f e ren t c i t i e s . All three modeled b u i l d i n g s were s ingle-s tory hav ing concrete block walls and concrete s lab f loors .
For one o f the buildings, computations were made to allow com- paring the impact of two d i f f e ren t HVAC operating schedules.
xx i
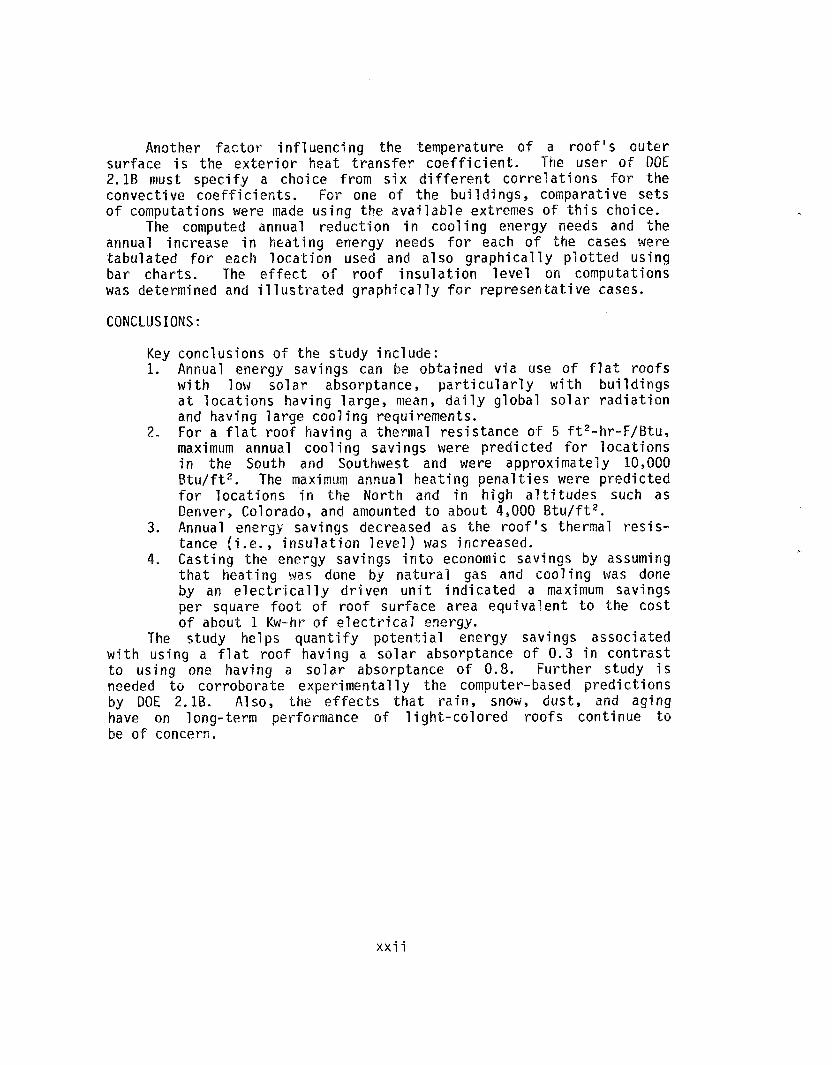
Another f ac to r influencing the temperature o f a r o o f ' s outer surface i s the ex ter ior heat t r ans fe r coeff ic ient . The user o f DOE 2.1B must specify a choice from six d i f f e ren t correlat ions fo r the convective coeff ic ients . For one o f the buildings, comparative sets o f computations were made using the avai lable extremes o f this choice.
The computed annual reduction i n cooling energy needs and the annual increase i n heating energy needs f o r each of the cases were tabulated f o r each location used and a l so graphically plot ted u s i n g bar char ts . The e f f ec t of roof insulat ion level on computations was determined and i l l u s t r a t e d graphical ly f o r representative cases.
CONCLUSIONS:
Key conclusions of the study include: 1. Annual energy savings can be obtained via use of f l a t roofs
w i t h low so lar absorptance, par t icu lar ly w i t h buildings a t locations having large, niean, da i ly global so l a r radiation and having large coaling requirements. For a f l a t roof having a thermal res is tance o f 5 ft2-hr-F/Btu, maximum annual cooling savings were predicted f o r locations i n the South and Southwest and were approximately 10,000 Btu/ft2. The maximum annual heating penal t ies were predicted f o r locations i n the North and i n h i g h a l t i t u d e s such as Denver, Colorado, and amounted t o about 4,OQO B t u / f t 2 .
3. Annual energy savings decreased as the roof ' s thermal resis- tance ( i . e . , insulation leve l ) was increased.
4. Casting the energy savings in to economic savings by assuming t h a t heating was done by natural gas and cooling was done by an e l e c t r i c a l l y driven u n i t indicated a maximurn savings per square foot of roof surface area equivalent t o the cos t of about 1 Kw-hr of e l e c t r i c a l energy.
The study helps quantify potential energy savings associated w i t h u s i n g a f l a t roof having a so l a r absorptance of 0 . 3 i n contrast t o u s i n g one h a v i n g a so la r absorptance of 0.8. Further study i s needed t o corroborate experimentally the computer-based predictions by DOE 2.1B. Also, the e f f e c t s t h a t ra in , snow, dus t , and aging have on long-term performance of l ight-colored roofs continue t o be of concern.
2.
x x i i

CHANGES IN THE HEATING AND COOLING ENERGY USE IN BUILDINGS DUE TO LOMERING THE SURFACE
SOLAR ABSORPTANCE OF ROOFS
E. I. Griggs and G. E. Courville
ABSTRACT
This report addresses how changing a f l a t r o o f ' s so l a r absorptance a l t e r s the energy required to heat and cool a building. The increase i n a roo f ' s surface temperature due t o insolation increases the bui lding 's heat gain d u r i n g the summer and reduces i t s heat loss d u r i n g the winter. This study examines this counteracting influence on annual HVAC energy use.
The report reviews per t inent background and presents computed changes i n heating and cooling needs obtained us ing the computer code, DOE 2.1B. All computations were made corresponding t o a reduc- t ion i n a f l a t roo f ' s so la r absorptance from 0.8 t o 0 . 3 . They were made f o r two d i f f e ren t buildings using TMY weather data f o r twenty c i t i e s w i t h i n the United S ta tes ; they were a l so made f o r a t h i r d building using weather d a t a f o r f ive U.S. c i t i e s .
Computed annual changes i n building heating and cooling energy use a re presented i n the form o f bar char ts f o r each location. Calculations were made fo r three d i f f e ren t roof insulat ion levels . The change i n annual energy use caused by the reduction i n so l a r absorptance decreases w i t h increased roof insulat ion. This e f f e c t i s depicted graphically f o r representative cases.
Incorporating r e a l i s t i c HVAC system performance and using a par t icu lar energy cost scenario based on use o f na tu ra l gas fo r heating and cooling via an e l e c t r i c a l l y driven u n i t , the best cost sav ings occurred f o r locations i n the Southwest and were equivalent t o approxi- mately the costs o f I Kw-hr o f e l e c t r i c a l energy per square foot o f f l a t roof surface.
INTRODUCTION
S u n l i t b u i l d i n g surfaces experience higher temperatures than do similar ex ter ior surfaces not exposed to the sun. Surface temperature during s u n l i t hours i s affected by the so la r in tens i ty , radiat ive charac te r i s t ics o f the surface, wind speed, ambient temperature, surrounding objects , and the thermal properties o f the building envelope component.
Generally, so la r radiation incident on the ex te r io r surface of a b u i l d i n g influences the loads imposed on the bui lding 's HVAC system. An increase i n surface temperature due to insolat ion may increase the air-conditioning load d u r i n g the summer o r reduce the heating load d u r i n g the winter. Since these a re counteracting

influences, questions a r i s e as t o how annual HVAC energy requirements are changed when a sur face ' s radiat ive properties are a l te red . If the so la r absorptance of a s u n l i t surface i s lowered, the cooling load and h e a t i n g load, associated w i t h so la r incidence, will be lowered and ra ised, respectively. Should changing the so la r absorptance r e su l t a l so in a change in the infrared emittance, loads will a lso be affected by the al tered infrared radiat ive exchange with the surroundings.
This study focused spec i f ica l ly on haw reducing the so la r absorptance of a roo f ' s surface a f f ec t s annual heating and cooling loads. The e f f o r t was undertaken in conjunction with a program on roofing research being conducted a t the Oak Ridge National Laboratory (ORNL). The energy-saving potential associated with roof construction and the need fo r fur ther research has been established and reported elsewhere [ l , 21. The poss ib i l i t y of conserving energy by using re f lec t ive materials f o r the outermost roof layer represents one area of i n t e re s t . The computer code, DOE 2.18, was used t o calculate HVAC l oad changes resul t ing from a change in the so la r absorptance o f a rouf's surface. Prior t o presentation and discussion of r e su l t s , same relevant background i s outlined in Sections 2 and 3.
2, L I T E R A T U R E REVIEW
Attention i s given in t h i s chapter t o l i t e r a t u r e t h a t deals with how so la r absorptance a f f ec t s roof surface temperature and the net energy t ransfer through a roof. In pract ice , quant i f icat ion o f these e f f ec t s i s dependent on r e l i ab le so la r absorptance values f o r the materials o f i n t e re s t . Reported s o l a r absorptance values for building materials are discussed f i r s t .
2.1 REPORTED SOLAR ABSORPTANCE VALUES
In discussing roof design with respect t o energy conservation, Probert and Thirst [3] noted tha t summer heat gain can be reduced by judicious selection of roof color. Solar absorptances values given in t h e i r paper are l i s t e d i n Table A . l o f Appendix A. Values range from 0.45 fo r a "whits" surface t o 0.95 fo r a "b lack4 ' surface. Table A.2 l i s t s some so lar absorptances which a re given by Baker [4]. 7het-e i s good agreement between the values in Table A . l and Table A.2.
Reagan and Acklam [f;] have also reported so la r reflectances of several types of building mater ia ls , They s ta ted t h a t so la r absorptance and reflectance d a t a f o r common building materials were rattier sparse; consequently, they developed a probe f o r measuring so lar reflectance in t h e i r study. The e f fec t ive spectral range of t h e i r probe was s ta ted t o be 0.44 to 0.96 microns. Noting t h a t t h i s range did n o t encompass the to t a l so la r spectrum, they reasoned t h a t the so la r reflectance o f coatings commonly used in buildings does not deviate s ign i f icant ly in the 0.96 t o 2.0 micron range from t h a t

3
exhibited i n the v is ib le wavelength range. Reflectance measurements were made on a var ie ty o f wall and roofing mater ia ls . Reflectance values given i n t h i s paper a re l isted in Tables A.3 through A.7. O f par t icu lar i n t e r e s t i n t h i s work are the values given i n Table A . 7 f o r coated and b u i l t - u p roofs. For l i s t e d mater ia ls the absorptance ranges from 0.25 and 0.88. Based on t h e i r measurements, they proposed a color c l a s s i f i ca t ion scheme f o r calculat ing building heat gains and losses. The c l a s s i f i ca t ion scheme with the corresponding values f o r ref1 ectance and absorptance i s given i n Table A.8.
In a document re la ted to energy savings, Talbert [6] reports values of so la r reflectance and thermal emittance fo r several types of roof surfaces. These were reported as being measured by the DSET Laboratories of Phoenix, Arizona. Listed i n Table A.9 are t h e i r reported reflectance values along w i t h absorptance values calculated for an opaque surface.
The user of DOE 2 has the option of specifying the so la r absorptance of ex ter ior surfaces f o r the building being modeled. A l i s t of so l a r absorptance values i s given in the DOE 2.1B Reference Manual [7]. This l i s t i s included i n Table A.10 f o r reference.
2.2 SURFACE TEMPERATURE
Exposure of a roof membrane to large temperature swlngs may lead t o a reduction in i t s useful l i f e as a consequence o f numerous problems resu l t ing from the cycling s t ress ing such a s cracking. Surface color and the amount o f insulat ion between the membrane and the deck a f f ec t membrane temperature, Rossiter and Mathey [S) calculated steady-state surface temperatures of black ( a = 0.9),
= 0.7) and white (a = 0.5) roofs fo r various thicknesses ~~~~o '70 f ive inches) of insulat ion located between the membrane and roof deck. While focusing pr incipal ly on the influence o f added insulat ion, t h e i r r e su l t s a l so i l l u s t r a t e the influence of the roo f ' s so la r absorptance. Their r e su l t s indicated tha t the f i r s t increment, about one inch, of insulation causes a s ign i f i can t r i s e i n the roof surface temperature due to so la r radiat ion, b u t additional increases i n thickness above t h i s f i r s t increment does n o t appreciably increase the roof surface temperature. The color d i s t inc t ion had a more marked e f f e c t on predicted roof temperature than d i d the amount o f insulation placed beneath the roof membrane.
In a s t u d y of two contiguous buildings, Shuman [SI made comparisons of heat flow through wet and dry insulated roof constructions and a l so made measurements f o r some thermal e f f e c t s associated w i t h three d i f f e ren t roofing granules. Roof coverings included s lag , w h i t e marble containing dark const i tuents of a b o u t 15 percent and slag coated w i t h an experimental water-paint of white portland cement w i t h p las t ic izer . Shuman concluded tha t roof reflectance should be considered in design. He emphasized need f o r re1 iable reflectance data and the importance of an acceptable service l i f e .

4
Baker [4] s ta ted tha t temperatures which roofing materials experience d u r i n g t h e i r service l i f e may well determine the success o r f a i l u r e of a roof system. He reports t h a t the surface temperature of a roof may reach 88°C (190°F) f o r a f l a t roof h a v i n g an unobstructed view o f the sky. Some simple formulae f o r estimating roof temperature d u r i n g both day and n i g h t operation a re given i n his book.
Keetsn and Alumbaugh [ lo] experimentally investigated the e f f ec t s o f insulation upon temperatures w i t h i n built-up roofs. Three temperaturecontrol led b u i ldings were bui 1 t t o accommodate t e s t ing o f 8-ft-by-8-ft built-up rcofs. Their t e s t s incorporated surfacings c l a s s i f i ed a s white, white gravel, gray gravel, aluiiiinum gray and black. One of t h e i r recommendations was t h a t serious consideration should be given to changing the surfacing of a roof t a a l i g h t e r color as an a l te rna t ive t o mare expensive reroofing when i t i s necessary t o improve thermal res is tance of an ex is t ing roof to lower energy consumption.
The pub1 icat ions just reviewed imply tha t r e f l ec t ive roofs operate cooler than comparable ones having a la rger so la r absorptance. Improved roof-membrane 1 i f e and energy conservation may both be desirable consequences of reduced surface temperature,
2.3 ENERGY USE CONSIDERATIONS
Since the heat t ransfer through a building envelope component, such as a roof, depends on surface temperatures, the influence of so la r absorptance on s u n l i t surface temperatures may a l t e r heat t ransfer ra tes . I n contemporary methods f o r estimating air-conditioning cooling loads, such as the procedure outlined i n the 1981 ASHRAE Handbook of Fundamentals [ll], calculat ions of loads depends on specification of the color o f ex te r io r wall and roof surfaces. Color consideration i s typ ica l ly discussed only i n connection w i t h cooling loads since t rad i t iona l load calculation schemes are t o determine the maximum f o r purposes o f sizing equipment.. The maximum cooling load will include so lar contribution; however,
heating load will occur i n the absence of so l a r exposure. As a t ten t ion i s directed more spec i f ica l?y t o energy u t i l i za t ion , the impact of so la r influences on both heating and cooling energy use needs t o be evaluated.
The simplest approach t o estimating energy requirements i s t o use steady-state calculat ions and t o r e l a t e requirements t o net instantaneaus r a t e s o f heat t ransfer . T h i s scheme, however, f a i l s t o incorporate many important factors . Such features as s t ruc tura l energy storage, thermostat s e t points, HVAC equipment operating charac te r i s t ics , the d is t inc t ion between instantaneous heat t r ans fe r r a t e s and c o i ? loads, the coupling between internal loads and external loads and other in te r re la ted e f f ec t s serve t o make the calculation o f actual energy requirements a more formidable problem than t h a t o f making simple steady-state calculat ions.
Recent a t ten t ion has been given t o the ro le t h a t roof "color" has i n a l t e r ing energy requirements f o r the heating and cooling o f

bu i l d ings . I n an extens ive t r e a t i s e on energy conservat ion, Dubin [12] presented nomographs f o r t he heat gains and losses f o r r o o f s . These nomographs f a c i l i t a t e e s t i m a t i o n o f the e f f e c t o f changing the s o l a r absorptance from 0.8 t o 0.3 on b o t h heat g a i n and beat lioss.
In an assessment o f t h e energy-saving p o t e n t i a l o f r o o f i n g research w i t h i n the Uni ted States, Chang and Busching [ Z ] used Dubin 's nomographs t o est imate heat gains and losses f o r numerous l oca t i ons . They noted t h a t the annual heat loss through a r o o f w i t h a surface absorptance o f 0.8 i s approximately 12 t o 25 percent l e s s than the annual heat loss through a s i m i l a r r o o f w i t h a sur face absorptance of 0.3 and t h a t t he annual heat ga in f o r CL = 0.8 i s approximately two t o f o u r t imes t h a t f o r a = 0.3. Surface s o l a r absorptance o f a low-slope r o o f was concluded t o be an impor tant f a c t o r a f f e c t i n g heat loss and gain.
The i n f l u e n c e of surface s o l a r absorptance on heat t r a n s f e r through opaque b u i l d i n g elements was a1 so addressed by Reagan and Acklam [SI. They discussed r e s u l t s o f heat ga in / l oss c a l c u l a t i o n s made f o r several residences i n Tucson, Arizona. Comparative r e s u l t s f o r d a i l y average heat ga in were given f o r one residence; values of CL f o r t he r o o f of 0.75 and 0.35 were used. One case corresponded t o a p o o r l y i n s u l a t e d home; the o t h e r case was f o r a more modern, b e t t e r i n s u l a t e d home. They concluded t h a t changing t h e r o o f c o l o r from dark t o l i g h t does g r e a t l y reduce the r o o f heat ga in o f a t y p i c a l southwestern house d u r i n g the summer, b u t such a reduc t i on ha5 l i t t l e e f f e c t on the summer to ta l -house heat ga in because the r o o f ' s c o n t r i b u t i o n i s o n l y a small p a r t of the t o t a l .
G r i f f i n C131 o u t l i n e d a scheme f o r e s t i m a t i n g cool ing-energy cos t savings w i t h the use of h e a t - r e f l e c t i v e , aluminum asbes tos - f i b ra ted coat ings, i ns tead o f convent ional b lack asbes tos - f i b ra ted coat ings, on smooth-surfaced b u i l t - u p bi tuminous membranes. His es t ima t ion scheme was based on use o f the t o t a l equ iva len t Cool ing Load Temperature D i f f e r e n c e (CLTD) as descr ibed i n the 1981 ASHRAE Handbook o f Fundamentals [ll]. Tabulated CLTD values were co r rec ted by a c o l o r adjustment f a c t o r . For c l ima tes w i t h l ong c o o l i n g seasons, G r i f f i n repor ted t h a t a savings o f $0 .25 / f t 2 i n present wor th can be achieved over 20 years; i t was, however, noted t h a t o t h e r c l i m a t i c cond i t i ons tend t o compl icate the impact o f changing a on hea t ing energy consumption.
T a l b e r t [SI summarized a b r i e f s tudy t h a t focused on p o t e n t i a l energy savings w i t h b u i l d i n g s whose r o o f s a r e coated w i t h aluminum f l a k e s e x h i b i t i n g h i g h s o l a r r e f l e c t a n c e and low thermal emnttance. The r e p o r t inc ludes est imated c o o l i n g energy savings t h a t might be r e a l i z e d i n Phoenix, Arizona, by use o f the aluminum f l akes . Estimates were made by two methods. The f i r s t was based on the scheme repor ted by G r i f f i n [13]. The second was based on use o f an average d a i l y s o l - a i r temperature and s teady-state c a l c u l a t i o n . No t ing t h a t t he methods were developed t o determine design loads f o r equipment s i z i n g , T a l b e r t caut ioned t h a t p r e d i c t e d energy savings may n o t be very accurate. He suggested t h a t a b e t t e r method would be t o u t i l i z e one o f the more soph is t i ca ted computer models. S p e c i f i c re ference was made t o DOE 2.

2.4 SUMMARY
The preceding l i t e r a t u r e review reveals current i n t e r e s t in studying the thermal e f f ec t s related t o so la r re f lec t ive and absorptive charac te r i s t ics o f roof surfaces. Lower roof absorptance r e su l t s in lower surface temperatures during s u n 1 i t hours. Lower surface temperature can a l t e r b o t h cooling and heating energy requirements. T h e net e f f e c t i s dependent upon several weather-re1 ated fac tors . Allusion t o the need f o r use of sophisticated computer programs t o more accurately estimate energy savings has been made and seemed t o be a logical next step.
3. RELATED CONCEPTS
Certain concepts fundamental t o t h i s study are discussed i n t h i s section. Thermal radiat ion, concept of so l -a i r temperature and the apparent e f f e c t on building energy loads caused by changing the so la r absorptance of the roo f ' s surface are b r i e f ly outlined.,
3.1 THERMAL RADIATION CONSIDERATIONS
This work focused on how changing the so la r absorptance of a f l a t roof ' s ex te r ior surface a f f ec t s heat t ransfer t h r o u g h the roof.
Often the radiat ive charac te r i s t ic o f a surface i s discussed in terms of color. Generally color r e l a t e s t o the v is ib le portion (0.35-0.7 v) o f the electromagnetic spectrum; hence, color may n o t always convey an accurate description fo r the complete thermal-radiation band. Radiative heat t ransfer between objects a t low temperatures involves long-wavelength (> 8p) radiat ion. The energy transmitted a s so lar radiation i s concentrated i n a band of shorter wavelengths. For example, modeling the sun as a blackbody emitter a t 6000 K , 99.5 percent of the emitted energy l i e s between 0.1 and 5 microns and 43.2 percent l i e s in the v is ib le spectrum (0.35 t o 0.7 v).
When a material layer i s exposed t o r a d i a n t energy, a portion i s ref lected, a portion may be transmitted and the remainder i s absorbed. An energy accounting for radiant energy o f any wavelength leads t o
I n general , radiat ive properties of materials are direct ional and spec t ra l ly dependent; however, many engineering analyses are made using hemispherical values. Also, fo r most engineering appl icat ions, material layers are opaque which means t h a t none o f the incident r a d i a n t energy i s transmitted t h r o u g h the layer ( i . e . , T = 0 ) . The absorption and ref lect ion processes are t reated as surface phenomena.

7
In terms of hemispherical propert ies , the accounting of r a d i a n t energy impinging upon an opaque layer i s given by
According t o Kirchhoff ' s law, absorptance equals emittance under conditions of thermal equilibrium, b u t t h i s equal i ty i s often assumed in engineering analyses of non-equilibrium s i tua t ions . When t h i s is done, = E and Equation (3.2) becomes
E = 1 - p ( 3 . 3 )
Kirchhoff's law i s not necessar i ly t rue f o r a l l real s i tua t ions . For example, one area of research on improving so lar co l lec tor performance has focused on materials having an CL/E r a t i o greater than unity. For common roofing mater ia ls , data re la t ing ~1 and E seem t o be lacking.
3.2 SOL-AIR TEMPERATURE
The net heat t r ans fe r from the sun and other ex te r io r surroundings t o a roof ' s surface involves absorption of so la r energy, convective exchange w i t h the environment and an infrared radiat ive exchange w i t h low-temperature surroundings. The so l - a i r temperature is defined as the "hypothetical" a i r temperature tha t would r e su l t i n the same net heat t ransfer t o the surface u s i n g a combined radiat.ive and convective heat t ransfer coeff ic ient . Using the def in i t ion , the so l - a i r temperature can be wri t ten a s
In Equation ( 3 . 4 ) 1, denotes the outside a i r temperature, a denotes the sur face ' s so l a r absorptance, G denotes the incident so l a r f l u x , E denotes the sur face ' s infrared emittance, A E denotes the difference between the energy emitted by a blackbody a t T, and the longwave radiation incident on the surface, and ho denotes the combined convective and radiat ive coeff ic ient . The combined coef f ic ien t h0 i s expressed by
where

8
B o t h he and hr are temperature dependent, and he depends on the a i r flow pattern near the surface. While so l - a i r temperature i s useful fo r i l l u s t r a t i n g the e f f ec t o f so lar loading, i t i s n o t an independent property of the climate because of i t s dependence on the parameters a, E, ho, and A E . The def ini t ion o f so l - a i r temperature i s used in the discussion which follows.
3 , 3 DISCUSSION OF CHANGES IN BUILDING LOADS D U E TO CHANGE I N THE SOLAR ABSORPTANCE OF THE ROOF
This discussion focuses on how a d iscre te change in a roof ' s so la r absorptance (a) a l t e r s heating and cooling loads.
3.3.1 Definition and I l l u s t r a t ion of Terms
I f a o f a roo f ' s surface i s lowered, the energy required fo r cooling the contiguous building will most l i ke ly be reduced because the ccoling loads will be smaller fallowing the reduction i n surface temperature during sun l i t hours. High roof surface temperatures during the winter may tend t o impede heat loss through the roaf. Hence, using a reduced surface a during the winter may l ike ly r e su l t i n an increase i n the energy requirements fo r heating.
H i g h a Reduced CL
C O O L I N G MODE HEATING MODE
(a) ( b )
Figure 3 . 1 I l l u s t r a t ion of Load Change Due t o Discrete Change in Roof's a

9
F igu re 3 . l ( a ) i l l u s t r a t e s the p o s s i b i l i t y o f reducing annual c o o l i n g energy pe r u n i t r o o f area (ACE) by l ower ing the r o o f ' s a. S i m i l a r l y , F igure 3 . 1 ( b ) shows the converse for t he p o s s i b i l i t y o f i nc reas ing annual hea t ing energy pe r u n i t r o o f area (AHE) by l ower ing 01 o f the roo f . A p r i n c i p a l goal o f t h i s s tudy was t o assess changes i n ACE and AHE due t o a d i s c r e t e reduc t i on i n a. For t h i s purpose ACES denotes the magnitude o f annual c o o l i n g energy saving, and AHEP denotes the magnitude o f annual hea t ing energy penal ty , bo th based on u n i t r o o f area. With re ference t o F igu re 3.1, ACES and AHEP are expressed bY
AHEP = AHE2 - AHEl (3 .8 )
Both ACES and AHEP represent changes i n annual energy requirements due t o a lower ing o f a r o o f ' s a. Both a re de f i ned i n the p o s i t i v e sense.
3 . 3 . 2 Steady-State C a l c u l a t i o n o f Roof Heat Transfer Using S o l - A i r Temperature
A steady-state c a l c u l a t i o n o f r o o f heat t r a n s f e r may a f f o r d i n s i g h t i n t o how changing ~1 a f f e c t s energy use. Consider a u n i t area o f r o o f over a condi t ioned space, which f o r t he purpose o f t h i s evaluat ion, i s t o be maintained a t a constant temperature T i . Using s o l - a i r temperature, the n e t annual heat ga in through the r o o f per u n i t area i s g iven by
Net Annual Gain pe r U n i t Roof Area = JUo(Tsa - T i ) d t ( 3 . 9 )
where UQ represents the o v e r a l l heat t r a n s f e r c o e f f i c i e n t f o r heat t r a n s f e r between a i r a t the s o l - a i r temperature and t h a t i n s i d e a t T i . The i n t e g r a l i s t o be evaluated over one year. S p e c i f i c separat ion o f the n e t ga in i n t o ACE and AHE r e q u i r e s more d e t a i l e d i n s i g h t i n t o hour by hour b u i l d i n g operat ion. Far example, heat ga in through the r o o f may c o n t r i b u t e t o a c o o l i n g l oad o r may reduce a hea t ing load, depending on which mode p r e v a i l s w i t h i n the space a t t h a t t ime.
The d e f i n i t i o n o f s o l - a i r temperature given i n Equation (3.4) can be used i n Equation (3.9). The n e t g a i n can then be evaluated f o r a l a r g e value o f a and a l s o f o r a lower value o f 01 . The d i f f e r e n c e obta ined by s u b t r a c t i n g the n e t ga in f o r the lower a from t h a t corresponding t o the h ighe r o?, assuming t h a t E , ho and AE are unaf fected by the changed a , i s g iven by

10
Aa u, G
h0 Net Annual Reduction i n Heat Gain = d t (3.10)
Since the net reduction i n energy gain i s p a r t i a l l y a saving i n cooling energy (ACES) and p a r t i a l l y a penalty i n heating energy ( A H E P ) , the l e f t s ide of Equation (3.10) ac tua l ly represents the sum ACES -t AHEP. I f a par t icu lar location i s characterized by e s s e n t i a l l y no annual heating requirement, such a s southern Florida, then the net reduction i n heat gain i s almost t o t a l l y ACES. Conversely, should a par t icu lar location be characterized by e s sen t i a l ly no cooling requirements, then the net reduction i n heat gain would be almost t o t a l l y AHEP.
I f Uo and h are assumed constant, the s teady-state value given by Equation (3.307 f o r a f l a t roof i s
A d o
h 0 ACES f AHEP = (--) (365 G$ (3.11)
where Gs,, represents the average da i ly so l a r f l u x on a horizontal surface. Subject t o the l imi ta t ions i n going from Equation (3.10) t o Equation ( 3 n 1 1 ) 9 i t can be no ted t h a t the net reduction i n energy gain (ACES -t- A H E P ) , due t o a reduction i n a r o o f ' s so l a r absorptance by the amount la, varies l i nea r ly w i t 1 1 Fs A1 so, w i t h o ther parameters unchanged, an increase i n f0* causes a decrease i n the sum ( A C E S + A H E P ) , an observation tha t i l l u s t r a t e s the important ro le of the fac tors which control ko such as wind velocity. Equation (3.11) was used i n t h i s study t o determine steady-state estimates f o r (ACES + AHEP) against which nonsteady-state ( A C E S + AHEP) values obtained using DOE 2.1B f o r actua? buildings were compared.
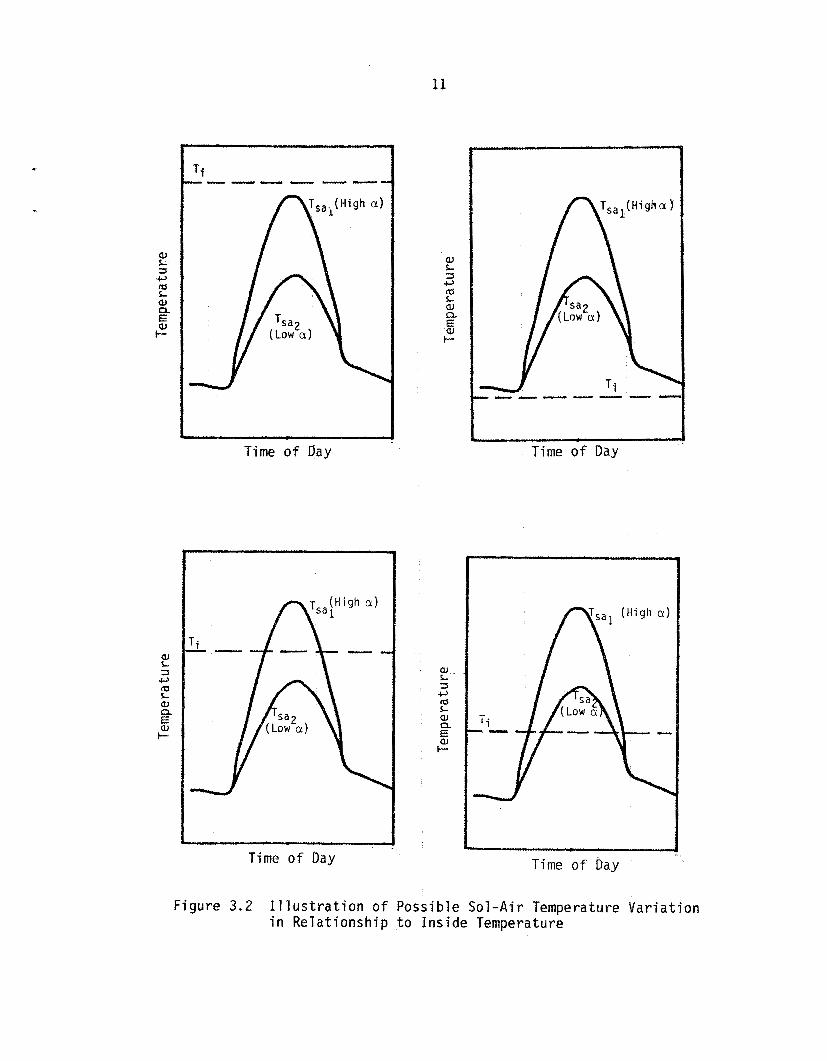
Division o f the net reduction in to separate values fo r ACES and A H E P f o r a real b u i l d i n g operating i n a location having both s igni f icant heating and cooling loads i s dependent on local climate, b u i l d i n g type and HVAG operation. Figure 3.2 portrays four s i t ua t ions t o i l l u s t r a t e qua? i ta t ive ly the possible re la t ionships between inside temperature T i and so l -a i r temperature for two d i f f e ren t a values. The so l - a i r curves were drawn using so l - a i r temperatures given i n the 1981 ASHRAE Handbook o f Fundamentals [ll] f o r a par t icu lar location. Here, however, the curves a re i n t e n d e d only f o r qua l i t a t ive comparison. For some days, sol - a i r temperatures f o r both val ues o f c1 may t o t a l l y l i e below T i . Conversely, f o r some days, they may be t o t a l l y above T i . B o t h may cross T i f o r some days and fo r some only the curve f o r h i g h CI may cross T i . The point here i s t h a t the temperature difference between so l - a i r temperature and inside temperature and how t h i s difference i s a l te red by changing c1 i s de f in i t e ly dependent on the local climate since the so l - a i r temperature i s affected by cl imat ic var iables a s shown by Equation (3 .4 ) .
Results f o r ACES and AHEP which were determined f o r several cases u s i n g DOE 2.1B are presented and discussed i n the next section.
11
cy L- 3 c, 5 L aJ n. E cy I-
Time o f Oay
W L J c, 5 L W
a, t- E"
Time o f Day
cy L 3 c, a L cy a E QJ t-
Time o f Day
cy L 3 u 5 L aJ Q E aJ
t-
Time o f bay
Figure 3 .2 I l l u s t r a t ion o f Possible Sol-Air Temperature Variation i n Relationship t o Inside Temperature

12
4. PRESENTATION A N D DISCUSSION OF RESULTS
4.1. INTRODUCTION
The object of t h i s t h i s work was t o ca lcu la te changes in heating and cooling energy requirements fo r a b u i l d i n g when the so l a r absorptance (a) of i t s roo f ' s surface i s changed. All computations correspond t o a reduction i n ~1 from 0.8 t o 0.3. The study focused on two s ingle-s tory buildings having concrete block walls and concrete s lab f loors ; a few computations were a l so made f o r a t h i r d b u i l d i n g s imi la r t o the other two except f o r more zoning used w i t h the HVAC system. Twenty locations were used fo r many of the calculat ions; however, some calculat ions were ade f o r only f i f t e e n locations. Pr ior t o presentation of Calculated results i n t h i s sect ion, the u t i l i zed computer code, DOE 2. lB, i s b r i e f ly discussed. Also discussed a re some special considerations per t inent t o the work.
4.2 DOE 2.18
DOE 2.18 i s a computer code widely used f o r modeling buildings and their associated heating and cooling systems. I t i s a ve r sa t i l e code which can simulate hour-by-hour performance of a building throughout a year.
DOE 2.18 consis ts o f numerous subprograms, two o f which are the LOADS program and the SYSTEMS program. I n the LOADS program, hourly heat gains and losses through the b u i l d i n g envelope components a re f i r s t calculated separately. Weighting f ac to r s a re then used t o convert gains in to loads. In the calculat ion of heat gains and losses through ex ter ior walls and r o o f s , the e f f ec t of therm1 storage can be taken in to account through the use of thermal response fac tors . All computations in LOADS a re made on the basis o f a f ixed temperature f o r conditioned spaces, The SYSTEMS program uses the output of the LOADS program, HVAC system cha rac t e r i s t i c s , and room a i r weighting fac tors t o determine the hourly energy requirements imposed on the HVAC system. In t h i s process, the SYSTEMS program modifies t h e loads t o account f o r variable temperatures i n each conditioned zone.
The f l e x i b i l i t y o f DOE 2.1B affords opportunity f o r comparing computed energy values corresponding t o a ra ther wide range o f options i n the modeling. For example, the output of LOADS corresponds only t o a fixed space temperature. On the other hand, the output of SYSTEMS (e.g. , coi l loads) takes in to account d i f f e ren t thermostat setpoints f o r heating and cooling, scheduling of HVAC operation , scheduling o f various internal loading and HVAC equipment specif icat ions. I f the HVAC system capacity i s not specif ied, DOE 2.18 s i zes the equipment automatically from loads determined in the LOADS program. T h u s , i f a building-envelope parameter i s changed between two runs, the change i n computed loads may lead t o a d i f f e ren t s i ze INAC system f o r the second case than was determined f o r the f i r s t case. The user, however, has the option o f i n p u t i n g HVAC equipment capacity. Comparisons o f b u i l d i n g energy use between two runs where the HVAC equipment has been sized automatically would seem more appropriate

13
f o r examining the e f f e c t o f changing a bu i ld ing-envelope parameter i n design considerat ions o f new b u i l d i n g s . Conversely, t he e f f e c t o f changing the bui ld ing-envelope parameter f o r an e x i s t i n g b u i l d i n g f o r which t h e same HVAC equipment i s t o be used before and a f t e r the change would seem best determined by s p e c i f y i n g the same equipment c a p a c i t i e s f o r bo th runs.
Some p r e l i m i n a r y computer runs were made us ing o n l y the LOADS subprogram. Output o f LOADS corresponds t o a f i xed space temperature being maintained around the c lock. The p r i n c i p a l focus o f the study, however, was d i r e c t e d toward t o t a l b u i l d i n g s i m u l a t i o n which inc luded e f f e c t s o f schedul ing and HVAC system operat ion. A t t e n t i o n was focused on the c a l c u l a t e d changes i n annual hea t ing c o i l l oad and annual c o o l i n g c o i l l o a d which was ou tpu t by the SYSTEMS subprogram.
4.3 SPECIAL CONSIDERATIONS FOR THIS STUDY
4.3.1 Weather Data
DOE 2.1B i s designed t o rece ive c l imate-re la ted v a r i a b l e s from weather tapes. For t h i s study Typica l Meteoro log ica l Year (TMY) weather tapes were used. T h i r t y l o c a t i o n s were used f o r most o f t he p r e l i m i n a r y (LOADS) computer runs. Twenty o f these l o c a t i o n s were used f o r several computer runs where a t t e n t i o n was focused on the output o f the SYSTEMS subprogram; however, some cases were examined f o r o n l y f i f t e e n loca t i ons . Al though se lected p a r t i a l l y on the bas i s o f a v a i l a b l e TMY weather tapes which had been con f igu red f o r DOE 2.18 input , the l o c a t i o n s were chosen t o represent the range o f heat ing and c o o l i n g requirements w i t h i n the Un i ted States. F igu re 4.1 shows cool ing-degree days versus heating-degree days f o r over two hundred weather- repor t ing s t a t i o n s w i th in the Un i ted States. Data f o r t he p l o t was taken from Reference 14. The twenty se lected l oca t i ons , i n d i c a t e d by the heavier darkened c i r c l e s , are dispersed throughout the range o f cond i t i ons represented by the data o f Reference 14. Table 4.1 l i s t s these twenty l o c a t i o n s toge the r w i t h values f o r t he cool ing-degree days, heating-degree days, average d a i l y s o l a r f l u x , and average wind speed. The average wind speed was obta ined from Reference 15.
4 . 3 . 2 Values o f So la r Absorptance
Values o f 0.8 and 0.3 were used f o r the r o o f ’ s s o l a r absorptance. These values represent p r a c t i c a l bounds o f absorptance. This can be seen by i n s p e c t i o n o f the repo r ted values l i s t e d i n Appendix A. These two values were a l s o used i n the work o f Dubin and Long [12] and t h a t o f Chang and Busching [2].
4.3.3 Overa l l Heat Transfer C o e f f i c i e n t
With l o a d - c a l c u l a t i n g methods such as those o u t l i n e d i n the ASHRAE Handbook [ll], a i r - f i l m c o e f f i c i e n t s on the i n s i d e and ou ts ide o f a r o o f , h i and he r e s p e c t i v e l y , a r e inc luded w i t h the r o o f

1 4
5000
4000
v, > q:
W W L z
a LLJ 0
a ;L
0 0 0
3000
2000
1000
e
0
* Reported i n Reference 1 4 8 Locations Used i n t h i s Study
C a o
a
a
HEATING DEGREE D A Y S
t 10000
Figure 4 . 1 Caaling Degree Day and Heating Degree Day Data fo r Over Two Hundred Weather Reporting Stat ions i n the United States

15
f
Table 4.1 Climate-Related Data f o r Twenty Locations Used i n t h i s Study (Sources: References 14 and 15)
I - Location C DD HDD GSD V
(Btu/day- f t 2 ) (mph 1
Phoenix, AZ Bakers f ie ld , CA El Paso$ TX A1 buquerque, NM Miami , FL San Antonio, TX Tampa, FL Augusta, GA Lake Charles, LA Hemphis, TN Denver, CO St. Louis, #O Washington, DC Chicago, IL Ind ianapol is , I N Minneapolis, MN blinot, ND Syracuse, NY Portland, OR S e a t t l e , WA
3506 2178 2097 1316 40 37 2993 3366 1994 17 38 2029
625 1474 9 40 923 974 585 369 551 299 128
1552 2 183 2677 429 1
20 5 1570 7 16
2547 1498 3226 60 16 47 48 5009 6125 5576 8158 9407 6678 4792 5 184
1869.4 1749.2 1899.7 1827.5 1472.9 1499.0 1492.1 1361.6 1364.6 1365.9 1568.4 132%. 6 1208.4 1215.1 1165.0 1170.2 1178.3 1034.5 1066.8 1052.7
5.1 6.9 8.1 9.4 9.4 9.4 8.3 6.7 8.7 8.9
11.2 9.6 7.8
10.7 8.9
10.1 10.3 10.1 8.3 8.7
16
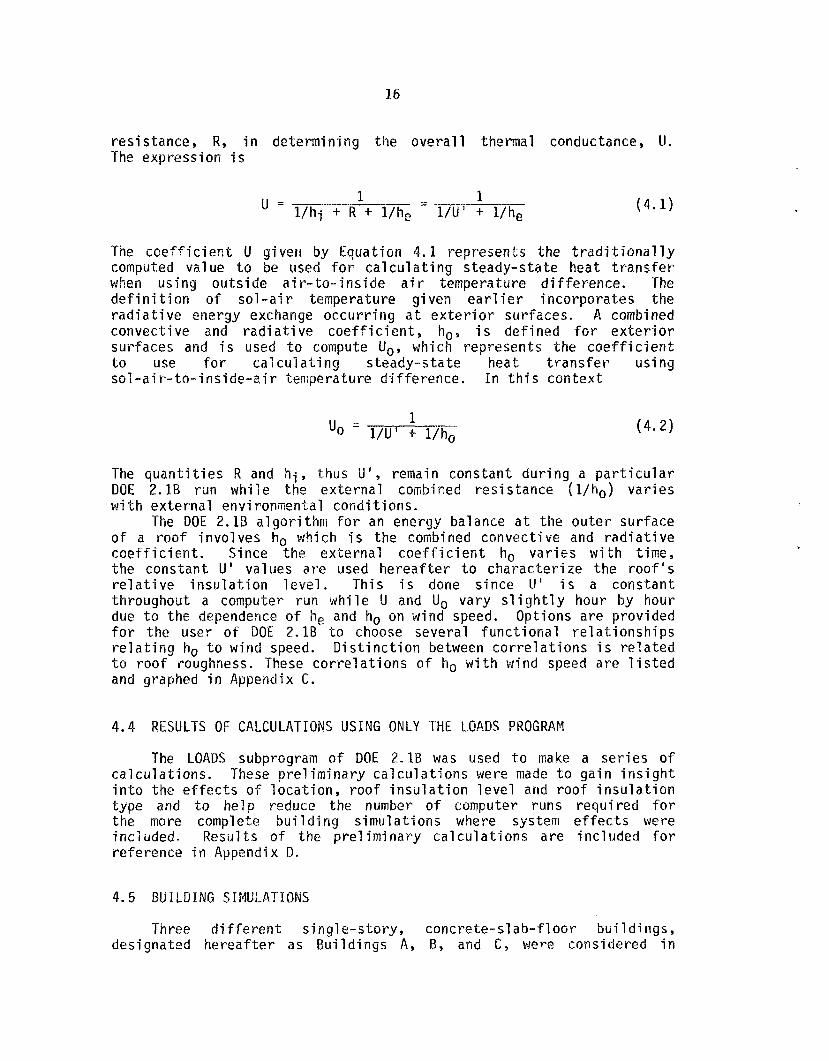
resis tance, R, in determining the overall thermal conductance, U. The expression i s
(4.1)
The coeff ic ient U givers by Equation 4.1 represents the t r ad i t i ona l ly computed val ue t o be used f o r calculat ing steady-state heat t ransfer when using outside a i r - to- ins ide a i r temperature difference. The def ini t ion o f sol -ai r temperature given ear l i e r incorporates the radiat ive energy exchange occurring a t ex t e r io r surfaces. A combined convective and radiat ive coef f ic ien t , ho, i s defined f o r ex ter ior surfaces and i s used t o compute U,, which represents the coef f ic ien t t o use f o r calculating s teady-state heat t ransfer using sol - a i r-to-i nside-ai r temperature difference. In t h i s context
1 uo = l/U' -+ l/G (4.2)
The quant i t ies R and h i , thus U', remain cons t an t during a par t icu lar DOE 2.1B r u n while the external combined resis tance ( l / h o ) varies w i t h external environmental conditions.
The DOE 2.11s algorithm f o r an energy balance a t the outer surface of a roof involves h, which i s the combined convective and radiat ive coeff ic ient . Since the external coeff ic ient ho varies with time, the constant U ' values are used hereaf ter t o characterize the roo f ' s relatlive insulation level . This i s done since U ' i s a constant t h r o u g h o u t a computer r u n while U and Uo vary s l i g h t l y hour by hour due t o the dependence of he and ho on wind speed. Options are provided fo r the user o f DOE 2.18 t o choose several functional re la t ionships re la t ing ho t o wind speed. Distinction between correlat ions i s re la ted t o roof roughness. These correlat ions of ho w i t h Hind speed are l i s t e d and graphed in Appendix C.
4 .4 RESULTS OF CALCULATIONS USING ONLY THE LOADS PROGRAM
The LOADS subprogram of DOE 2.18 was used t o make a s e r i e s of calculations. These preliminary calculat ions were made t o gain insight in to the e f f ec t s of location, roof insulation level and roof insulation type and t o help reduce the number of computer runs required f a r the mare complete building simulations where system e f fec t s were inclirded, Results of t h e preliminary calculat ions are included fo r reference in Appendix D.
4.5 BUILDING SIMULATIONS
Three d i f fe ren t s i n g 1 e-story, concrete-sl ab-floor b u i 1 d i n g s , designated hereafter a s Buildings A, B , and C, were considered in
17
t h i s study. The f l a t - r o o f c o n s t r u c t i o n was s p e c i f i e d t o be the same f o r a l l t h ree b u i l d i n g s . Bu i l d ings A and B i nvo l ved o n l y one i n t e r i o r zone, and B u i l d i n g C i nvo l ved f i v e i n t e r i o r zones. B u i l d i n g A had a suspended c e i l i n g between t h e roof and the cond i t i oned space, and the r e t u r n a i r was d i r e c t e d through the uncondi t ioned space between t h e c e i l i n g and r o o f . The i n n e r surface o f t he r o o f f o r B u i l d i n g B and B u i l d i n g C was d i r e c t l y contiguous t o t h e cond i t i oned space. B u i l d i n g A was descr ibed t o model a t y p i c a l i n t e r i o r o f f i c e module w i t h a s t r i p o f contiguous i d e n t i c a l u n i t s . B u i l d i n g B was s p e c i f i e d t o model an open-area r e p a i r shop o r l i g h t manufactur ing f a c i l i t y . B u i l d i n g C represented a mul t izone o f f i c e b u i l d i n g . More complete d e s c r i p t i o n s o f the th ree b u i l d i n g s are g iven i n Appendix E.
4 .5 .1 B u i l d i n g A
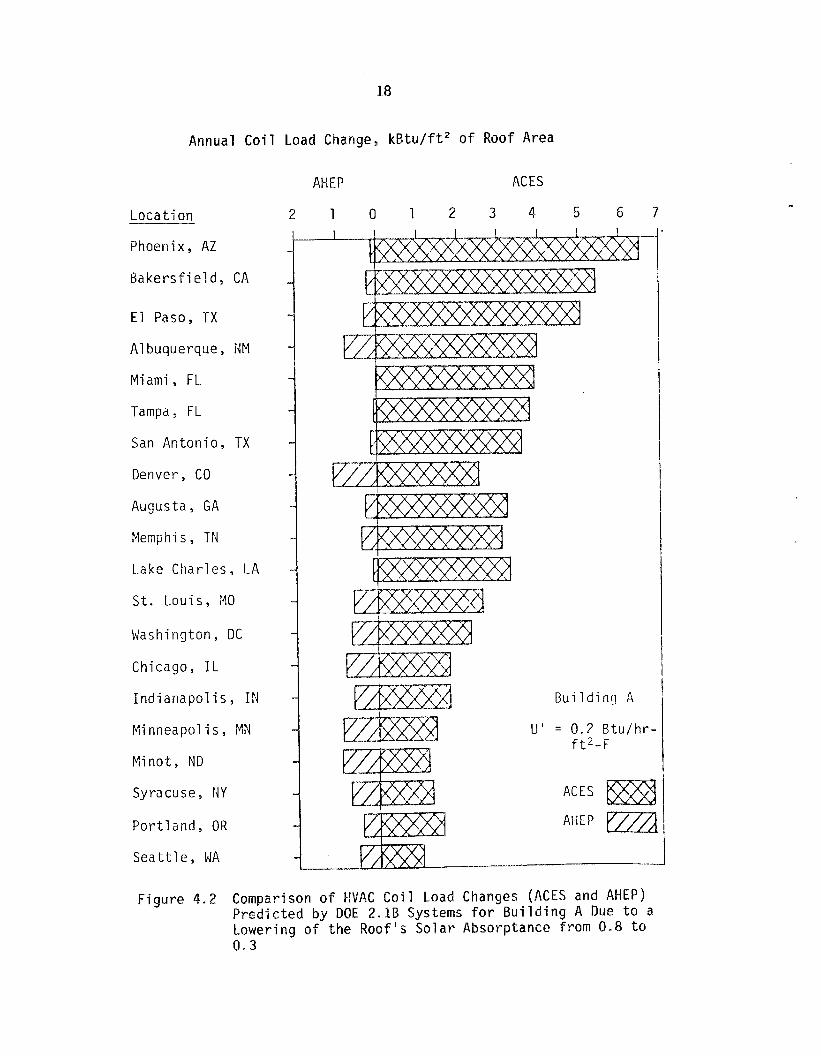
Using Typica l Meteoro log ica l Year (TMY) weather data f o r twenty l o c a t i o n s , B u i l d i n g A was f i r s t examined f o r the case o f a r o o f U ' value o f 0.2 Btu/hr - f t2-F. As discussed e a r l i e r , U ' i s based on the combined res i s tance o f the r o o f m a t e r i a l s and the i n s i d e convect ive a i r - f i l m res is tance. For the r o o f c o n s t r u c t i o n considered, a U ' value o f 0.2 B tu /h r - f t 2 -F corresponds t o an i n s u l a t i o n th ickness y i e l d i n g an R value o f 3.74 h r - f tZ -F /B tu . The remainder o f the res is tance, 1.26 hr- f t2-F/Btu, i s due t o the aggregate, b u i l t - u p r o o f membrane, s t e e l deck and i n t e r i o r a i r - f i l m . For o t h e r U t values, the c o n t r i b u t i o n due t o aggregate, b u i l t - u p r o o f membrane, s t e e l deck and i n t e r i o r a i r - f i l m remained constant. The quoted U ' value was obtained by changing o n l y the th ickness o f i n s u l a t i o n . For two l a r g e r th icknesses o f i n s u l a t i o n , runs were made f o r f i f t e e n o f the se lected l oca t i ons . DOE 2.1B was al lowed t o s i z e the equipment a u t o m a t i c a l l y f o r a l l B u i l d i n g A runs. Changes i n p r e d i c t e d c o o l i n g c o i l load, hea t ing c o i l load, e l e c t r i c a l energy requ i red by the system fan and the e l e c t r i c a l energy requ i red by the c o o l i n g system are tabu la ted i n Appendix F, Tables F . l through F.3. For the lowest l e v e l o f i n s u l a t i o n considered ( U ' = 0.2 B t u / h r - f t 2 - F ) , changes i n p red ic ted HVAC c o i l loads are depic ted by the bar graph o f Figure 4.2. The r e s u l t s have been arranged by descending values o f the n e t e f f e c t (ACES + AHEP). N o t i n g values l i s t e d i n Table 4.31 o f the d a i l y mean g lobal s o l a r r a d i a t i o n Cis on a h o r i z o n t a l surface f o r each o f t he l oca t i ons , i t i s noped t h a t (ACES -+ AHEP) g e n e r a l l y increases w i t h an increase i n Gs See Figure 4.3. For the 3 u i l d i n g A cases examined, each p r e d i g e d ACES value i s l a r g e r than the corresponding AHEP value i n d i c a t i n g t h a t p r e d i c t e d energy savings d u r i n g cool i n g exceeds the energy-use p e n a l t y d u r i n g heat ing. Economic savings depend, however, on t h e type o f c o o l i n g and hea t ing systems used and on the r e l a t i v e cos ts o f hea t ing and c o o l i n g energy. This p r a c t i c a l concern i s discussed l a t e r i n more d e t a i l .
The sum (ACES f AHEP) decreases w i t h an increase i n the R-value s f r o o f i n s u l a t i o n . This i s shown i n F igure 4.4 f o r f o u r l o c a t i o n s se lected t o show the range o f computed values. F igure 4.4(a) shows t h a t t h e n e t r e d u c t i o n i n energy gain, as r e a l i z e d a t t h e c o i l s , due t o changing the r o o f ' s sur face s o l a r absorptance decreases w i t h an increase i n the thermal res is tance. F igure 4.4(b) shows the excess
18
Annual Coil Load Change, kBtu/ft2 o f Roof Area
Location
AHEP ACES
2 1 0 1 2 3 4 5 6 7
Phoenix, AZ
Ba kersf i el d, CA
E l Paso, TX
A1 buquerque , i4M
Miami, FL
Tampa, FL
San Antonio, TX
Denver, CO
Augusta, G A
Memphis, TN
Lake Charles, LA
S t . Louis, 1110
Washington, DC
Chicago, IL
Indianapolis, Ird
M i nneapol is , M N
Minot, ND
Syracuse, IdY
Portland, OR
S e a t t l e , WA
B u i l d i n g A
U ' = 0.2 B t u / h r - f t ' -F
ACES
AHEP v A
Figure 4.2 Comparison o f HVAC Coil Load Changes (ACES and AHEP) Predicted by DOE 2.1B Systems for Building A Due to a Lowering of the Roof ' s Solar Absorptance from 0.8 to 0.3

19
1
1 I I I 8
% b)s
Q
6
8 Q
Building A U ' = 0.2 B t u / h r - f t 2 - F
I
I f 1 I 1 1.2 1 . 4 1.6 1 .a
D a i l y Mean So lar Rad ia t ion on a Hor i zon ta l Surface, GsD, kBtu / f t -
2.0
F igure 4.3 I l l u s t r a t i o n o f V a r i a t i o n o f (ACES + AHEP) w i t h the D a i l y Mean So lar Rad ia t ion on a Hor i zon ta l Surface ( B u i l d i n g A; U' = 0.2 B tu /h r - f t 2 -F )

20
h
r, N
3
N
u7 il
Q 4
Lo
I I
I I
1 1
-t F: 0
21
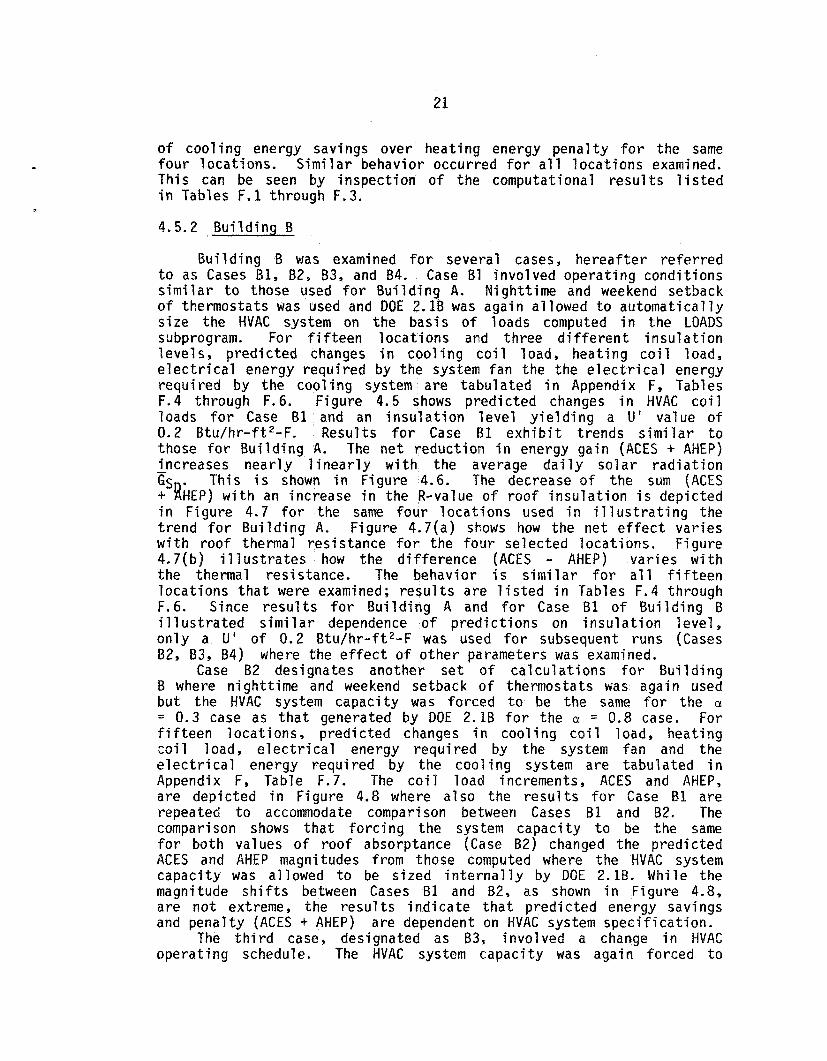
of c o o l i n g energy savings over hea t ing energy p e n a l t y f o r the same four l oca t i ons . S i m i l a r behavior occurred f o r a l l l o c a t i o n s examined. This can be seen by i nspec t i on o f t he computational r e s u l t s l i s t e d i n Tables F . l through F.3.
4.5.2 B u i l d i n g B
B u i l d i n g B was examined f o r several cases, h e r e a f t e r r e f e r r e d t o as Cases 81, 82, 83, and 84. Case B1 invo lved opera t i ng cond i t i ons s i m i l a r t o those used f o r B u i l d i n g A. N igh t t ime and weekend setback of thermostats was used and DOE 2. lB was again al lowed t o a u t o m a t i c a l l y s i z e the HVAC system on t h e bas i s of loads computed i n the LOADS subprogram. For f i f t e e n l o c a t i o n s and th ree d i f f e r e n t i n s u l a t i o n l e v e l s , p r e d i c t e d changes i n c o o l i n g c o i l load, hea t ing c o i l load, e l e c t r i c a l energy requ i red by the system fan the the e l e c t r i c a l energy requ i red by the c o o l i n g system a re tabu la ted i n Appendix F, Tables F.4 through F.6. F igure 4.5 shows p r e d i c t e d changes i n HVAC c o i l loads f o r Case B 1 and an i n s u l a t i o n l e v e l y i e l d i n g a U ' value o f 0.2 B tu /h r - f t 2 -F . Resul ts f o r Case B1 e x h i b i t t rends s i m i l a r t o those f o r B u i l d i n g A. The n e t reduc t i on i n energy gain (ACES + AHEP) - increases n e a r l y l i n e a r l y w i t h the average d a i l y s o l a r r a d i a t i o n
This i s shown i n F igure 4.6. The decrease o f t he sum (ACES fsfl iEP) w i t h an increase i n the R-value o f r o o f i n s u l a t i o n i s depic ted i n F igure 4.7 f o r the same f o u r l o c a t i o n s used i n i l l u s t r a t i n g the t r e n d f o r B u i l d i n g A. F igure 4.7(a) shows how the ne t e f f e c t v a r i e s w i t h r o o f thermal res i s tance f o r the f o u r se lected l oca t i ons . F igure 4.7(b) i l l u s t r a t e s how t h e d i f f e r e n c e (ACES - AHEP) v a r i e s w i t h the thermal res is tance. The behavior i s s i m i l a r for a l l f i f t e e n l o c a t i o n s t h a t were examined; r e s u l t s a re l i s t e d i n Tables F.4 through F.6. Since r e s u l t s f o r B u i l d i n g A and f o r Case B 1 o f B u i l d i n g B i l l u s t r a t e d s i m i l a r dependence o f p r e d i c t i o n s on i n s u l a t i o n l e v e l , o n l y a U' o f 0.2 B t u / h r - f t 2 - F was used f o r subsequent runs (Cases B2, 83, 134) where the e f f e c t o f o t h e r parameters was examined.
Case B2 designates another s e t o f c a l c u l a t i o n s f o r B u i l d i n g B where n i g h t t i m e and weekend setback o f thermostats was again used b u t the HVAC system capac i t y was f o rced t o be the same f o r t he a = 0.3 case as t h a t generated by DOE 2.18 f o r t he 01 = 0.8 case. For f i f t e e n loca t i ons , p r e d i c t e d changes i n c o o l i n g c o i l load, hea t ing c o i l load, e l e c t r i c a l energy requ i red by the system fan and the e l e c t r i c a l energy requ i red by the c o o l i n g system are tabu la ted i n Appendix F, Table F.7. The c o i l l oad increments, ACES and AHEP, are depic ted i n F igure 4.8 where a l s o the r e s u l t s f o r Case €31 are repeated t o accommodate comparison between Cases B 1 and 82. The comparison shows t h a t f o r c i n g the system c a p a c i t y t o be the same f o r both values o f r o o f absorptance (Case B2) changed the p red ic ted ACES and AHEP magnitudes from those computed where the HVAC system capac i t y was al lowed t o be s i zed i n t e r n a l l y by DOE 2.1B. While the magnitude s h i f t s between Cases B 1 and B2, as shown i n F igure 4.8, a re n o t extreme, the r e s u l t s i n d i c a t e t h a t p r e d i c t e d energy savings and pena l t y (ACES + AHEP)
The t h i r d case, designated as B3, i nvo l ved a change i n WVAC ope ra t i ng schedule. The HVAC system c a p a c i t y was again fo rced t o
are dependent on HVAC system s p e c i f i c a t i o n .

22
Annual C o i l Load Change, k B t u / f t 2 o f Roof Area
Locat ion
Phoenix, A Z
E l Paso, TX
Memphi s , TN
Bakers f i e ld , CA
A I buquerque, NM
Miami, FL
Lake Charles, LA
Tampa, FL
San Antonio, TX
August, GA
Washington, DC
Chicago, I L
I nd ianapo l i s , I N
Syracuse, NY
Minot , ND
l___l__
AHEP ACES
2 1 0 1 2 3 4 5 6 7
B U I L D I N G B
U ' = 0.2 Btu/hr -
AHEP
, f t 2 - ' F
F igu re 4.5 Comparison o f HV.AC C o i l Load Changes (AHEP and ACES) P red ic ted by DOE 2.1B Systems f o r B u i l d i n g 6 (Case 61) Due t o a Lowering o f Roof's So la r Absorptance f rom 0.8 t o 0 .3

23
1 1
7
6
5 N c, % \ J c,
Y m
L*
e i 4 I
+ Ln w 0
3
2
I I I I I
1.2 1 . 4 1.6 1.8 2.0
F i
. I I I I
e
c)
e 8
Building B Case B 1 l

24
a
-c -P

25
Annual Coil t o a d Change, kBtu/ft2 o f Roof Area
AHEP ACES
Loca t i on 2 1 0 1 2 3 4 5 6 7
Phoenix, AZ
E l Paso, TX
Memphis, TN
B a k e r s f i e l d , CA
A 1 buquerque, N M
Miami, FL
Lake Char l e s , LA
Tampa, FL
San Antonio, TX , I
Augusta, GA
Washington , DC
Chicago, IL - - - - - - - _ _
I n d i a n a p o l i s , IN B1 A C E S
Syracuse, NY
Minot, N5
F i g u r e 4.8 HVAC Coil Load Changes (ACES and AHEP) P r e d i c t e d by DOE 2.1B for Cases B 1 and 82 o f B u i l d i n g B Resulting from Lowering the Roof's S o l a r Absorp tance from 0 .8 t o 0 . 3

26
be the same f o r the 01 = 0.3 case as t h a t generated by DOE 2.1B f o r the a := 0.8 case. Internal loads (people, l i g h t s , and equipment) were scheduled only d u r i n g the day f o r weekdays, b u t the HVAC system was scheduled t o operate continuously. Nighttime and weekend setback was not employed. For twenty locat ions, predicted changes i n cooling coi l load, heating coil load, e l ec t r i ca l energy required by the system fan and the e l ec t r i ca l energy required by the cooling system a re tabulated i n Appendix F, Table F.8. The change i n fan requirements are zero because the fan was scheduled t o operate continuously i n Case B3. The predicted coi l load increments ( A C E S and A H E P ) are depicted i n Figure 4.9 where the r e su l t s f o r Case B 2 are repeated f o r comparison. Comparing r e su l t s f o r Cases 82 and 83 shows the e f f e c t of changing the HVAC operating schedule. The r e su l t s show tha t m a i n t a i n i n g the space condi ts'oned continuously causes an increase i n both predicted ACES and AHEP values. The increase can probably be explained by the f a c t t ha t weekend operation i s included and t h a t the space was conditioned a t n i g h t where some time-delayed energy t ransfer may a l so be included d u r i n g a regular work day.
The e f f e c t o f so lar loading on a roof's surface temperature i s influenced by the ex ter ior hea t t r ans fe r coef f ic ien t . All of the previously discussed computations were made using the DOE 2.1B incorporated correlat ion of ho w i t h w i n d speed tha t corresponds t o a rough surface ( r e f e r t o Appendix 6 ) . An additional s e t of calculat ions were made f o r Building 5 w i t h conditions being the same a s those used fo r Case B3 except f o r the ho correlat ion. The code was changed t o make use of the ho correlat ion designated f o r a very smooth surface, This s e t of computer runs i s designated a s Case B4. For twenty locations, predicted changes i n cooling coi l load, heating coi l load, e l ec t r i ca l energy required by the system fan and the e l ec t r i ca l energy required by the cooling system are tabulated in Appendix F, Table F.9. The coil load changes, ACES and AHEP, a re shown i n Figure 4.10 where the resu l t s f o r Case 83 a re repeated f o r comparison. The comparison shows tha t using lower ho values markedly increased both ACES and AHEQ. This contrast indicates the i m p o r t a n t ro le t h a t the surface heat t r ans fe r coef f ic ien t plays i n the surface energy balance. This a l so indicates t ha t the e f f e c t of so la r loading on a roof can be s igni f icant ly affected by wind speed since w i n d speed i s known to e f f e c t h,.
4.5.3 B u i l d i n g C
Calculations for the multizone o f f i ce building, Building C , were made f o r f ive locations. Continuous space conditioning, involving the sanae scheduling a s t h a t used f o r Case B3, and system capacity matching were used. Predicted ACES and A H E P values f o r Building C are shown i n Figure 4 .11 together w i t h those f o r Building A and Cases B 1 and 8 2 , and B3 f o r B u i l d i n g B. All cases shown i n Figure 4.11 are for the common U ' value of 0 . 2 S t u / h r - f t 2 - F and the same ho correlat ion, t ha t being the one f o r a rough surface. ACES and AHEP values o f Figure 4.11 are l i s t e d i n Table 4 .2 together w i t h estimates based on the report o f Chang a n d Busching [2]. There a r e two observations which comparisons o f data i n Figure 4 .11 and Table

27
Annual Coil Load Change, k B t u / f t 2 o f Roof Area
AHEP ACES
-_I Loca t i on 3 2 1 0 1 2 3 4 5 6 7 8
Phoenix , AZ
Miami , FL
E l Paso , TX
Lake C h a r l e s , LA
A1 buquerque , N M
B a k e r s f i e l d , CA
Memphis, TN
Tampa, FL
Augus ta , GA
Denver, CO
San Antonio , TX
Washington, DC S t . Lou i s , MO
Ind ianapo l i s , I N Chicago, IL
Minneapol i s ,
S y r a c u s e , NY
P o r t l a n d , OR
Minot , ND S e a t t l e , WA
F i g u r e 4.9
MN
I111111
B u i l d i n a E3
Cases 03 & B2
U ' = 0 . 2 B t u / h r - f t 2 - F
83 ACES w7J B3 AIHEP
82 ACES BTTTp B2 AHEP [z]
HVAC Co i l Load Changes (AHEP and A C E S ) P r e d i c t e d by DOE 2.18 Systems f o r Cases B3 and B2 o f B u i l d i n g B R e s u l t i n g from Lowering the Roof 's S o l a r Absorp tance from 0.8 t o 0 .3

28
Annual Coil Load Change, k 8 t u / f t 2 o f Roof Area
AHEP ACES
....-lll~ Location 4 3 2 1 0 1 2 3 4 5 6 7 8 9 1 0 1 1
Phoenix, AZ
Miami, FL
E l Paso, TX
Lake Charles, LA
San Antonio, TX
A 1 buquerque, NM
Tampa, FL
Memphis, TN
Bakers f i e ld , CP,
A u g u s t d , GA
Denver, CO
S t,. Loi.r i s MO
Washington, DC
Indianapol i s IN
Chicago, IL
M i nneapol i s MN
Minot , ND
Syracuse, NY
Por t land, OR
Sea t t l e , W A
Figure 4.10
____ B u i l d i n g .._.-._._ ._.._I B Cases B4 & B3
J ' = 0.2 Btu/hr - f t 2 - F
B4 ACES B 4 AHEP
B3 ACES B3 AHEP
HVAC Coi l Load Changes (AHEP and ACES) Pred ic ted by DOE 2.1B Systems f o r Cases B4 and B3 o f B u i l d i n g B Resu l t ing from Lowering t h e Roof's Solar Absorptance from 0.8 t o 0.3
c

29
Annual Coil Load Change, k B t u / f t 2 o f Roof Area
e A H E P -$-ACES - 3 4 5 6 7 LOCATION 3 2 1 0 1 2
Phoenix, AZ
Albuquerque, N M
San Antonio , TX
Ind ianapo l i s , IN
B1 B2
B3 Typ. C A
B1 ildings A, B, & C
ACES
AHEP P T A u’= 0.2 Btu/hr-ft2-F
Figure 4.11 Comparisons of Annual Cooling Energy Savings (ACES) and Annual Heating Energy Penalty (AHEP) for Buildings A, B , and C. Results Based on SYSTEMS Output

Table 4 . 2 Annual Cooling Energy Savings (ACES) and A n n u a l Heating Energy Penalties Predicted for- a Roof Having a U ' Value o f 0 . 2 Btu/hr-ft2-F when I t s So la r Absorptance i s Reduced f r om 0.8 t o 0.3 (ACES and A H E P i n k B t u / f t 2 o f Roof Area 1
Energy Chang and Bui 1 ding A 3 B B c --- Location Change Busching t2-j a n d Case --- E31 32 53
Phoenix, A Z A H E P ACES
A I buquerque, NM A H E P ACES
San Antonio, TX A H E P ACES
Indianapol i s a IN f iHEP A C E S
Minot, ND A H E P ACES
1312 10681
1918 8245
931 988 5 2745 5437 3636 5112
117 6 520
783 3977
157 3581
607 1778 916
1232
417 5581 1903 3116
426 3692 1176 1681 1212 800
331 5181 1645 2992
348 3260 864
1557 1217 852
497 6078 227 1 3544
594 3869 1152 248 1
1617 1170
484 7000 1834 4834
28 3 3956
656 2315 100 a 1676
31
4.2 f a c i l i t a t e . F i r s t , t he ACES and AHEP values computed by DOE 2.1B f o r t he b u i l d i n g s examined i n t h i s study a re g e n e r a l l y lower than values est imated by the data g iven by Chang and Busching. Second, computed magnitudes o f ACES and AHEP f o r a p a r t i c u l a r l o c a t i o n and f o r b u i l d i n g s having i d e n t i c a l r o o f s a re dependent upon b u i l d i n g type and upon HVAC system operat ion. General ly, p r e d i c t i o n s f o l l o w expected t rends and reveal t h a t r e d u c t i o n o f a r o o f a s absorptance can be an energy conservat ion measure f o r l o c a l i t i e s o f h i g h c o o l i n g loads and h i g h s o l a r energy a v a i l a b i l i t y .
4.6 COMPARISONS OF BUILDING PREDICTIONS TO STEADY-STATE ESTIMATES
An i n t e r e s t i n g comparison can be made between steady-state est imates of(ACES + AHEP) by Equation (3.11) and DOE 2.1B p r e d i c t i o n s o f (ACES + AHEP) f o r t he b u i l d i n g s imu la t i ons considered here. The c o r r e l a t i o n o f h, versus wind speed f o r a rough sur face l i s t e d i n Appendix C was used w i t h the mean wind speeds l i s t e d i n Table 4.1 t o determine ho f o r t he twenty l oca t i ons . This ho was used w i t h a U ' value o f 0.2 B t u / h r - f t 2 - F t o c a l c u l a t e Uo. g iven i n Table 4.1 were used. The r e s u l t s o f c a l c u l a t i n g the ste8dy-state est imate o f (ACES + AHEP) by Equation (3.11) are tabu la ted i n Table 4.3. Resul ts f rom DOE 2.1B f o r B u i l d i n g A and Cases B1, B2 and B3 f o r B u i l d i n g B are l i s t e d a lso. The percentage d i f f e r e n c e , based on the steady-state est imate, i s a lso given. For the range o f cases considered, a1 1 steady-state est imates were s i g n i f i c a n t l y h ighe r than the corresponding r e s u l t s obta ined w i t h DOE 2.1B.
Values f o r &j
4.7 ECONOMIC CONSIDERATIONS
For investment considerat ions, ACES and AHEP values must be considered w i t h respect t o t h e i r u l t i m a t e impact on purchased energy. The ACES and AHEP values computed i n t h i s study represent changes i n annual c o o l i n g and hea t ing c o i l requirements. U t i l i z a t i o n e f f i c i e n c y f rom source t o c o i l must be used t o determine the r e s u l t a n t change i n energy demand a t t he source. The change i n c o o l i n g energy a t t he source i s given by ACES/B where 8 denotes the e f f e c t i v e annual c o e f f i c i e n t of performance f o r the c o o l i n g system. Likewmse, the change i n hea t ing energy a t t he source i s given AHEP/q where I-I denotes the e f f e c t i v e annual hea t ing system e f f i c i e n c y . For example, i f $ = 2.5 and rl = 0.7, ACES/AHEP would have t o exceed 3.57 f o r a r e s u l t a n t savings i n energy a t the source. The d i s t i n c t i o n i n energy cos t f o r hea t ing and c o o l i n g must be used t o determine the economic impact. For economic considerat ions, savings associated w i t h an investment t h a t occur over an extended t ime and which i n v o l v e the t ime-value o f money can be c a s t i n t o present worth, i n d i c a t e s what the p r e d i c t e d savings represent i n today ' s money. The present worth o f an investment represents the maximum expendi ture today which can be made w i t h o u t the investment rep resen t ing a loss. The present wor th o f a p a r t i c u l a r ACES and AHEP combination i s g iven by

32
'G-
%-
<a
*E--
. .
.I
. .
I
I aom
I IO
N
I 1
wb
3w
L
ow
cu
NN
c
ud
. .
.I
. .
I
dc
uh
I h
a I
mm
m
-31
0

33
.-
ACES) (CEC) (PW)c (AHEP) (HEC) (PWF)h ... B rl
PW = (4.3)
where CEC and HEC represent c u r r e n t c o o l i n g energy c o s t and c u r r e n t hea t ing energy cost, respec t i ve l y . Also, (PWF), and (PWf)h represent present-worth fac to rs f o r c o o l i n g and heat ing, respec t i ve l y . These present-worth f a c t o r s depend on the l i f e o f the energy-saving m o d i f i c a t i o n ( reduc t i on o f ~1 here), t h e a p p l i c a b l e d i scoun t r a t e and the e s c a l a t i o n r a t e f o r the respec t i ve energy cost .
Determinat ion o f the present wor th o f an investment by Equation 4.3 requ i res good i n s i g h t o r good speculat ion as t a the l i f e o f t he investment, the d iscount r a t e and f u e l e s c a l a t i o n rates. Est imat ions can be made w i t h the a i d o f publ ished est imates f a r some o f these. For example, un i form present-worth f a c t o r s f o r t en DOE reg ions and averages f o r t he Uni ted States a re tabu la ted i n Reference 16, a DOE l i f e - c y c l e c o s t manual.
Without t a k i n g the f u l l s tep o f e s t i m a t i n g present wor th fac to rs , an i n t e r e s t i n g comparison o f est imated savings can be made by c a s t i n g the computed r e s u l t s i n t o c u r r e n t cos t savings. For t h i s comparison, n a t u r a l gas was considered t o be the hea t ing f u e l , and the c o o l i n g systems were considered t o be e l e c t r i c a l l y dr iven. Use was made o f mid-1983 n a t i o n a l average cos ts o f e l e c t r i c a l energy and natura? gas as l i s t e d i n Reference 16 f o r the commercial sector . E l e c t r i c a l savings were taken as the computed savings i n e l e c t r i c a l c o o l i n g energy p l u s the savings i n HVAC fan energy. I n do ing t h i s , t he DOE 2.1 generated HVAC system c o e f f i c i e n t o f performance was a u t o m a t i c a l l y taken i n t o account. DOE 2.1B inco rpo ra tes a system performance curve which i s a f f e c t e d by l o c a l c l i m a t i c va r iab les . An e l e c t r i c a l energy c o s t of 6.226 t/Kw-hr was used. Heat ing by n a t u r a l gas was assumed w i t h an e f f i c i e n c y o f 70 percent and a f u e l c o s t o f 5.58 $/lo6 Btu. Resul ts o f t h i s c o s t eva lua t i on are tabu la ted i n Table 4.4. Largest savings occur f o r l o c a t i o n s w i t h l a r g e average d a i l y s o l a r r a d i a t i o n and cha rac te r i zed by l a r g e c o o l i n g requirements. A l l cases presented f o r comparison i n Table 4.4 correspond t o a r o o f U'-value o f 0.2 B tu /h r - f t 2 -F . Use o f l a r g e r U' values w i l l r e s u l t i n smal ler savings and v i c e versa. For the range o f cases compared here, i t i s noted t h a t t he upper bound on c a l c u l a t e d c u r r e n t annual savings pe r square foot o f r o o f area i s of t he order o f t h e cos t o f 1 kw-hr o f e l e c t r i c a l energy. Th is magnitude i s based on a hea t ing system e f f i c i e n c y o f 70 percent, and a r a t i o o f e l e c t r i c a l energy cos t t o hea t ing energy c o s t o f 3.27:l.
Also inc luded a re mid-1983 energy costs.
5. SUMMARY WITH CONCLUSIONS AND RECOMMENDATIONS
5.1 SUMMARY
The computer code, DOE 2.1B, was used t o c a l c u l a t e changes i n a b u i l d i n g ' s c o o l i n g and hea t ing energy requirements o c c u r r i n g w i t h a reduc t i on i n the r o o f ' s s o l a r absorptance f rom 0.8 Lo 0.3. With

34
la
cn
cn
m
1
IL
ZS
IN
I I
I I
I .
I I
.I
.
I I
I I
I m
d
N
-3- I
I l
m
Il
l.
a
74
Im
I I
I I
.I
ll
e2
I L
0)
E
E 0
u
co 0
4--.
00- M
ma
, -
am
r-tu
006)
mm
M
m
-3- a
CQ
hN
W
OOOO
.... m
o
me
"
00
I
1
1m
-I I
I I
..
I1
ml-4
a
mc
l Im
cu
I
I I
. .
I I
OQ
I
I-
W
r-4
a, u c
6,
L
a, Q- aJ lx
la
I
a, L
a, 3
or
+
0
oa
c
r: v)

35
r
the same f l a t roof construction f o r comparable thermal res is tances , three d i f f e ren t buildings were examined. In two cases, three leve ls of roof thermal res is tance were considered. Computations were made fo r up t o twenty d i f f e ren t locations w i t h i n the United States . Reported changes i n energy use a re based on the output of the SYSTEMS subprogram of DOE 2.1B. Predicted cooling-energy savings and heating-energy penal t ies are included in tabular form and are comparatively presented fo r representative cases by bar char ts . For the lowest level of roof thermal res is tance considered, the r e s u l t s have been cas t in to estimated annual cost savings u s i n g one combination o f cooling and heating energy costs.
A brief l i t e r a t u r e review i s a l sa outlined noting the work of others where a t ten t ion has been given t o claimed advantages of u s i n g roofs w i t h low so lar absorptance; the advantages a re reported to be reduced surface temperature swings and s a v i n g s i n the energy required f o r cooling. T h i s work focused on the energy savings .
5.2 OBSERVATIONS AND LIMITATIONS
Exact magnitudes o f changes in hea t ing and cooling energy which occur when a roof ' s so la r absorptance i s lowered are affected by building construction, HVAC system scheduling and operation, thermal res is tance of the roof and local c l imat ic conditions. The majority of ACES and AHEP comparisons depicted i n t h i s work correspond t o a roof U ' value of 0.2 Btu/hr-ftZ-F. Suf f ic ien t calculat ions were made, however, t o show t h a t energy savings a re reduced a s the thermal res is tance of the roof increases. The savings follow the general trend of varying inversely w i t h thermal res is tance.
The sunlit-surface energy balance algorithm incorporated w i t h i n DOE 2.1B accommodates user modification o f the sur face ' s so la r absorp- tance¶ b u t the option for simultaneously a1 te r ing the infrared emittance is not available. When a roof ' s so la r absorptance i s lowered, i t is l i k e l y tha t i t s infrared emittance will a l so be lowered. A reduced infrared emittance will a f f ec t long wavelength radiat ive t ransfer t o the sky. This e f f e c t has not been quantified i n t h i s study.
Calculations were made fo r a spec i f ic reduction of CI from 0.8 to 0.3. This seems t o represent an upper l imi t on the change, par t icu lar ly from a pract ical viewpoint. However, no information is avai lable on the e f fec t ive l i f e of re f lec t ive materials and coatings. Dirt and other environmental influences can cause a reduction in the re f lec t ive properties. Also, the influence of such fac tors as water ponding, snow, and roof-mounted equipment has n o t been considered.
The calculated resu l t s were shown t o be strongly dependent on the value used fo r the surface convective heat t r ans fe r coeff ic ient . The rather s impl i s t ic models t h a t a r e used i n the computational algorithms need to be evaluated f o r real building s i tua t ions . For a roof t ha t i s well insulated, the external f i lm heat t r ans fe r coeff ic ient does n o t a f f ec t the to t a l energy t ransfer s ign i f icant ly . Far surface temperature prediction and f o r accurate determination

36
o f the change i n heat t r a n s f e r a f f e c t e d by the energy balance a t t he surface, t he need f o r an accurate ex te rna l heat t r a n s f e r c o e f f i c i e n t i s much more essen t ia l .
5 " 3 CONCLUSIONS
Conclusions o f f e r e d here are based on the l i m i t a t i o n s o f t h i s out1 i tied above. Annual energy savings can be rea l i zed , p a r t i c u l a r l y f o r l o c a t i o n s charac ter ized by l a r g e mean d a i l y gliobal s o l a r r a d i a t i o n and l a r g e b u i l d i n g c o o l i n g requirements. Annual energy savings f o r a r e a l b u i l d i n g are l e s s than s teadys ta te estimates. For a f l a t r o o f having a thermal res i s tance o f about 5 f t2 -hr -F /Btu , the o rde r o f magnitude o f t he maximum poss ib le annual savings i s equ iva len t t o t he cas t o f one kw-hr o f e l e c t r i c a l energy pe r square f o o t o f exposed r o o f area when heat ing i s done w i t h gas and c o o l i n g i s done w i t h an e l e c t r i c a l l y d r i v e n system. Annual energy savings vary i n v e r s e l y w i t h the magnitude o f t he r o o f ' s thermal res is tance. Annual energy savings may be almost tw ice as l a r g e f o r a r o o f where the e x t e r i o r heat t r a n s f e r c o e f f i c i e n t i s governed by smooth-surface c o r r e l a t i o n s as f o r one governed by t he rough-surface c o r r e l a t i o n . Exact magnitudes o f savings f o r t he same b u i l d i n g vary w i t h HVAC s i z i n g and opera t i ona l schedule.
5.4 RECOMMENDATIONS
This study has shown t h a t use o f r e f l e c t i v e r o o f s can r e s u l t i n energy savings, bu t t he exac t magnitudes o f t he savings appear t o depend s u f f i c i e n t l y on opera t i ng cond i t i ons such t h a t more work i s needed t o q u a n t i f y the r e l a t i v e c o n t r i b u t i o n o f t he d i f f e r e n t in f luences . Considerat ion o f how changing a r o o f I s absorptance a f f e c t s the i n f r a r e d emit tance and how t h i s i n t u r n a f f e c t s the energy use needs more study. A t t e n t i o n should be g iven t o the use fu l l i f e o f r e f l e c t i v e coat ings. The e f f e c t of reduced sur face temperature swings on membrane l i f e i s worthy o f f u r t h e r study. With these concerns i n mind, the f o l l o w i n g s p e c i f i c recommendations are given.
(1) Examine the e f f e c t o f a reduced i n f r a r e d emit tance simultaneously w i t h a reduced s o l a r absorptance on c a l c u l a t e d ACES and AHEP values.
( 2 ) Study how t h e r a d i a t i v e p r o p e r t i e s o f a r o o f ' s surface change w i t h environmental exposure.
( 3 ) I n v e s t i g a t e i n more d e t a i l how t h e convect ive heat t r a n s f e r c o e f f i c i e n t on r o o f s va r ies w i t h environmental parameters.

37
( 4 ) Study the e f f e c t s on the performance of roof coverings caused by reduction i n surface temperature swing t h a t occur when re f lec t ive roofs a re used.
6. REFERENCES
I. J. N. Robinson, "The Assessment o f Roofing Research--An Interim Report ,'I ORNL/TM-7460, Oak Ridge National Laboratory, July 1981,
2. T. Chang, and H. W . Busching, "Energy Savings Potential of Roofing Research," ORNL/Sub/82-22293/1, report prepared under Purchase Order No. 19X22293V f o r ORNL by Clemson University, December 1983.
3. S . 0. Probert, and T. J. Thirst, "Design and Performance of Roofs," Applied Energy, 6, 1980, pp. 79-97.
4. M. C. Baker, ROOF--Design, Application, and Maintenance, sponsored by the National Research Counci 1 of Canada, Mu1 t i science Publications- Limited, 1980.
5. J. A. Reagan, and D. M. Acklam, "Solar Reflect ivi ty o f Common Buildinq Materials and I t s Influence on the Roof Heat Gain o f Typical Soithwestern USA Residences," Energy and Buildings, 2, 1979, pp. 237-248.
6. S. G . Talbert , "Energy Savings o f Buildings Using Aluminum Roof Flakes," Energy Savings Report, prepared by Bat te l le Columbus Laboratories, Columbus, Ohio, fo r Transmet Corporation, Columbus, Ohio.
7. DOE-2 Reference Manual--Parts 1 and 2, prepared fo r the U. S. Department of Energy under Contract W-7405-ENG-8, Lawrence Berkely Laboratory and Los A1 amos National Laboratory LA-7689-M Ver. 2.1, LBL-8706, Rev. 1, May 1980.
8. W. J. Rossiter, Jr., and R. G. Mathey, "Effect of Insulation on the Surface Temperature of Roof Membranes," National Bureau o f Standards, NBSIR 76-987, February 1976.
9. E. C. Shurnan, " F i e l d Measurements of Heat Flow through a Roof with Saturated Thermal Insulation and Covered with Black and White Granules," Thermal Insulation Performance, ASTM STP 718, D. L. McElroy and R. P. Tye, Eds., American Society f o r Testing and Materials, 1980, pp. 519-539.
10. J. R. Keeton, and R. L. Alurnbaugh, "Energy Factors and Temperature Distribution i n Insulated Built-up Roafs," TN N-1600,
38
Civil Engineering Laboratory, Naval Construction Battalion Center, Port Hvenenee, California, February 1981.
11. ASHRAE Handbook--1981 Fundamentals, American Society of Heating, Refrigerating and Air-Conditioning Engineers, Inc., Atlanta, Georgia, 1981.
12. F. S. D u b i n , and C. G . Long, J r . , Energy Conservation S tan - d a r d s fo r Building Design Construction and Operation, McGraw-Hill Book Company, 1978.
13. C. W . Griff in , "Cost Savings with Heat-Reflective Roof
14. C. L. Knapp, T. L. Stof fe l , and S. D. Wkitaker, "Insulation
Coatings," Plant", July 10, 1980, pp. 98-102.
Data Manual ,I' SERI/SP-755-789, October 198Q.
15. "klind Energy Resource Atlas," PNL-3195-WERA 1 t h r o u g h 9, Volumes I through 9 , 1980-1983.
16, Federal Energy Management Program Life Cycle Cost Manual (NBS 135) Update, DOE/CE-0076, March 1984, U. S. Department o f Energy, Washington, D.C.

39
A P P E N D I X A
P U B L I S H E D ABSORPTANCE VALUES
FOR VARIOUS B U I L D I N G
MATERIALS AND SURFACE COATINGS

APPENDIX A
PUBLISHED ABSORPTANCE VALUES FOR VARIOUS B MATERIALS AND SURFACE COATINGS
Inc luded i n Tables A . l through A.10 o f t h i s appendix a re values o f re f l ec tance and absorptance f o r b u i l d i n g m a t e r i a l s found i n t h e l i t e r a t u r e . Table A.9 a l s o l i s t s repor ted thermal emi t tance values.
Table A , 1 So la r Absorptance Values Given i n Table 2 o f Reference 3
Surface c o l o r Absorptance
Black Dark grey L i g h t grey White Copper-tarn i shed
Mea thered Copper-oxidi zed Metals A1 umi n u m
Galvanized i r o n
0.95 0.85 0.65 0.45 0.80 0.65 0.60 0.90
Table A.2 S o l a r Absorptance Values Recommended i n Reference 4 (Table 5.5 i n Reference 4)
I tern Absorptance
Surface Calor Black Dark grey L i g h t Grey White
Mea the red Roof i ng Copper A1 umi num Galvanized Iron
Smsoth-surface Asphal t Grey Gravel White Gravel Concrete P a v i ny
ASbeStQS-Cement
0.95 0.. 80 0.65 0.45
0.65 0.60 0.90 0.80 0.93 0.75 0.50 0.65

41
Table A.3 Solar Reflectance and Absorptance f o r Walls Hade o f Concrete and Adobe Blocks (From T a b l e 1 of Reference 5)
Desc r i p t i on Reflectance Absorptance
B u r n t adobe block, r u n n i n g bond,
Same w i t h raked j o i n t tooled l i g h t grey mortar j o in t
Colored slump block, r u n n i n g bond, concave low contrast mortar j o i n t Tan (San Xavier SX-15) Plain (San Xavier SX-16) Buff (Columbia Block) Santa Rosa (Col umbi a B1 ock) Palo Verde (San Xavier SX-17) Coral (San Xavier SX-14) Adobe Red (Calumbia Block)
w i t h raked j o i n t
Colored CMU (concrete masonry u n i t ) r u n n i n g bond, concave low contrast mor t a r j o i n t Coral (San Xavier SX-14) Adobe Red (San Xavier SX-26) B u f f (Columbia Block) Plain o r grey Same w i t h plain j o i n t
0.36 0.34
0.43 0.44 0.39 0.36 0.33 0.38
0.21
0.34 0.32 0.31 0.39 0.45
0.64 0.66
0.57 0.56 0.61 0.64 0.67 0.62
0.79
0.66 0.68 0.69 0.61 0.55

42
Table A.4 Solar Reflectance and Absorptance f o r Walls Made o f Bricks (From Table 2 o f Reference 5 )
Descri p t i on Reflectance Absorptance
Brown (PBY* color #19) scratch brick common bond, concave medium grey mortar j o i n t
Same color ruff led brick, basket weave bond, same color and type j o i n t
Same w i t h herringbone bond L i g h t red (PBY C O T O P # l 6 ) scratch
brick, common b s n d , concave medium grey mortar j a i n t
Orange (PBY color #06) ruff led brick, plain medium grey mortar j o i n t
Buff (PSV color #94) plain brick, stack bond s t re tchers , raked medium grey mortar j o i n t
Same color ruff led brick, English cross bond, concave medium grey mortar j o i n t
Same color scratch brick, r u n n i n g bond, plain medium grey mortar j o i n t
Red (Pets color #04> ruff led brick, th i rd bond oversize brick, raked medium grey mortar j o i n t
Same color and type brick, English cross bsnd, concave medium grey mortar j o i n t
0.28
0.36 0.33
0.38
0.41
0.51
0.43
0 .41
0.35
0.34
0.72
0.64 0.67
0.62
0.59
0.49
0.57
0.59
0.65
0.66

43
Table A.5 So la r Ref lectance and Absorptance o f Painted and Coated Wal ls (From Table 3 o f Reference 5)
D e s c r i p t i o n Ref lectance Absorptance
Painted slump block, running bond, concave j o i n t Pear l White (Pioneer Pa in ts ) Navaho White (Pioneer Pa in ts ) White (Pioneer Pa in ts ) Spanish White (Pioneer Pa in ts ) Egg She l l White (Pioneer Pa in ts )
on slump block, same bond and j o i n t
Painted CMU (concrete masonry u n i t ) , same bond and j o i n t Bone White (Southwestern P a i n t s ) Navaho White (Pioneer P a i n t s ) Sea She l l Beige (Pioneer Pa in ts ) Pear l White (Pioneer Pa in ts ) Desert Sand (Sears Roebuck & Co.)
Bone White (Southwestern P a i n t s )
Avocado Green (Pioneer Pa in ts ) Sand Dune (Pioneer Pa in ts ) Beige (brand unknown)
Weathered Brown (2310 South-
Dark Brown (2302 Southwestern's
Mor tar washed, s o l i d grey coverage
Painted stucco,
Pa i n t e d wood panel i ng
Stained wood panel ing
western 's wood s t a i n )
wood s t a i n )
0.74 0.70 0.71 0.68 0.65
0.49
0.72 0.55 0.69 0.42
0.65
0.15 0.26 0.40
0.10
0.13
0.26 0.30 0.29 0.32 0.35
0.51
0.28 0.45 0.31 0.58
0.35
0.85 0.74 0.60
0.90
0.87

44
Table A.6 Solar Reflectance and Absorptance o f Shingled Roofs (From Table 4 o f Reference 5 )
De scri p t i on Ref 1 ectance Value ( X )
Asphalt t a b shingles, common lay Woodblend (GAF) Russet Blend (GAF) A u t u m n (FS in tkote) Frosted Red (F l in tkote) Canyon Red (F l in tkote) Snow White (F1 in tkote) Dark Mahogany ( G A F ) Paste? Green ( G A F ) Ear th tone Brown (GAF) B1 i zrard ( Fi re Ki ny White (JM) Red (JM) Clover Green (F7 intkote)
Shake cedar wood shingles, new, unoiled
Same b u t oiled
Red clay mission t i l e
17 9
10 20 13 24 8
16 9
34 33 14 11
32
28
26

45
Table A.7 Solar Reflectance and Absorptance o f Coated and B u i l t - u p Roofs (From Table 5 of Reference 5)
Descri p t i on Ref 1 ectance Absorptance
Pea gravel covered Dark blend Medium blend L igh t blend White coated
Crushed used brick, red, covered
White marble chips covered
Flexstone o r mineral chip roof
Polyurethane foam, white coated
Same w i t h tan coating
Silver, aluminum painted t a r paper
White coated, smooth, Kool Kote (Corbett Roofing Co. /Tucson)
Tarpaper, "weathered"
type, white
0.12 0.24 0.34 0.65 0.34 0.49
0.26 0.70 0.41 0.51
0.75 0.41
0.88 0.76 0.66 0.35 0.66 0.51
0.74 0.30 0.54 0.49
0.25 0.59

46
Table A.8 Color Classif icat ion f o r Opaque B u i l d i n g Materials (From Table 7 o f Reference 5 )
Color code Sal a r Sal a r
Reflectance Absorptance
Very l i g h t L i g h t Medi urn Dark Very dark
0.75 0.65 0.45 0.25 0.10
0.25 0.35 0.55 0.75 0,90
Very l i gh t :
L i g h t :
Medi urn:
Dark:
Very dark:
Smooth b u i l d i n g material surfaces covered w i t h a f resh o r clean s ta rk white paint o r coating
Masonry, textured, rough wood, o r gravel ( roof ) surfaces covered w i t h a white paint o r coating
Off-white, cream, b u f f o r o ther l i g h t colored brick, concrete block, or painted surfaces and white-chip marble covered roofs
Brown, red o r other dark colored brick, concrete block, p a i n t e d o r natural wood walls and roofs w i t h gravel, red t i l e , stone, o r tan-to-brown shingles
Dark brown, dark green or other very dark colored painted, coated, o r shingled surfaces

47
Table A.9 Values o f Sola r Reflectance, Solar Absorptance and Thermal Emittance f o r Several Samples o f Materials Used on Roofs (From Table 1 o f Reference 6)
Sampl e Sample Solar So la r The rma 1 Number Description Reflectance Absorptance Emittance
1 Trocal SMA (PVC base) 0.285 0.715 0.84
2 Derbigum HPS (Modified Bi tumen 1 0.58 0.942 0.83
3 Aluminum Membrane (KMM) 0.715 0.285 0.31 4 Sure Sea l , Design A (EPDM) 0.124 0.876 0.86
5 SPM System (EPDM) 0. loa 0. a92 0.87
6 Awaplan Regular (Flodified
7 Awaplan Welding (Pfodified B i tumen) 0.244 0.756 0.88
8 SPM 60 (EPDN) 0.076 0.924 0.84
Bitumen) 0.067 0.933 0.89
15 16 17 18 19
20
21 22
Aluminum Fiber Coating, 1.5# 0.53
A l u m i n u m Fiber Coating, 3.0# 0.364
Roll ed A1 umi num Flake 0.695
Unrolled A l u m i n u m Flake 0.584
Rolled Coated Aluminum Flake 0.542
Unrol led Coated A1 uminum F1 a ke 0.536
Plain Steep Asphalt 0.156
Gravel Coated Asphalt 0.234
0.47 0.636 0.305 0.416
0.458
0.464
0.844 0.766
0.51 0.61 0.23 0.28
0.32
0.31
0.77
0.74

48
Table A.10 Solar Absorptance Values f o r Various Exterior Surfaces (From Chapter I I I o f Reference 7 )
Mate ri a 1 Absorptance Paint Absorptance
B1 ack concrete S t a f f o r d b lue brick Red brick Bituminous f e l t Blue gray s l a t e Roofing green Brown concrete Asphalt pavement, weathered Wood, smooth Uncolored asbestos cement Uncolored concrete Asbestos cement, white White marble L i g h t buff brick Bui 1 t - u p roof, white Bituminous f e l t , aluminized A1 umi n u m p a i n t Gravel White on galvanized iron White g l a z e d brick Polished aluminum re f l ec to r
Aluminized mylar fi lm Tinned surface
sheet
0.91 0.89 0.88 0.88 0.87 0.86 0. 85 0.82 0.78 0.75 0.65 0.61 0.58 0.55 0.50 0.40 0.40 0.29 0.26 0.25
0.12 0.10 0.05
Optical f l a t black paint Flat black p a i n t B1 a s k 1 acquer Dark gray p a i n t Dark blue lacquer Black o i l paint Dark a l ive drab paint Dark brown p a i n t Dark hlue-gray p a i n t Azure blue or dark green
Medium brown paint Medium l igh t brown paint Brown o r green lacquer Medium rust p a i n t L i g h t gray o i l paint Red a i l paint Medium d u l l green p a i n t Medium orange p a i n t Med i um ye 1 1 ow pa i n t Medium blue paint Medium kelly green paint L i g h t green p a i n t White semi-gloss paint White gloss paint S i lver paint White 'lacquer Laboratory vapor deposited
coatings
lacquer
0.98 0.95 0.92 0.91 0.91 0.9Q 0.89 0.88 0. 88
0.88 0.84 0.80 0.79 0 -78 0.75 0.74 0. 59 0.58 0.57 0.51 0.51 0.47 0.30 0.25 0.25 0.21
0.02

49
A
APPENDIX B
ACES AND AHEP VALUES BASED
ON REFERENCE 2

50
APPENDIX B
ACES AND MEP VALUES BASED ON REFERENCE 2
In t h e i r assessment o f the energy-saving potential of roofing research, Chang a n d Busching [2] estimated t h e roof area f o r the zones depicted in Figure B . l . They used Dubin's [12] nomographs, which accommodated making estimates fo r ~1 of 6.8 and 0.3, t o calculate the total heat ga ins and losses f o r each zone fo r roof U values o f 0.2, 0.16, 0.12, 0.08 and 0.04 Btu/hr-ft2-F. The gains and losses reported by Chang and Busching were used t o determine ACES and AHEP values f o r each of the zones indicated in Figure 13.1. The r e su l t s are tabulated fo r reference in Table B.1 f o r the U values o f 0.2 and 0.04 B t u / h r - f t 2 - F .
._. I
Figure 8.1 Weather Zones in the Ten U.S. Federal Regions (From Reference 2 )
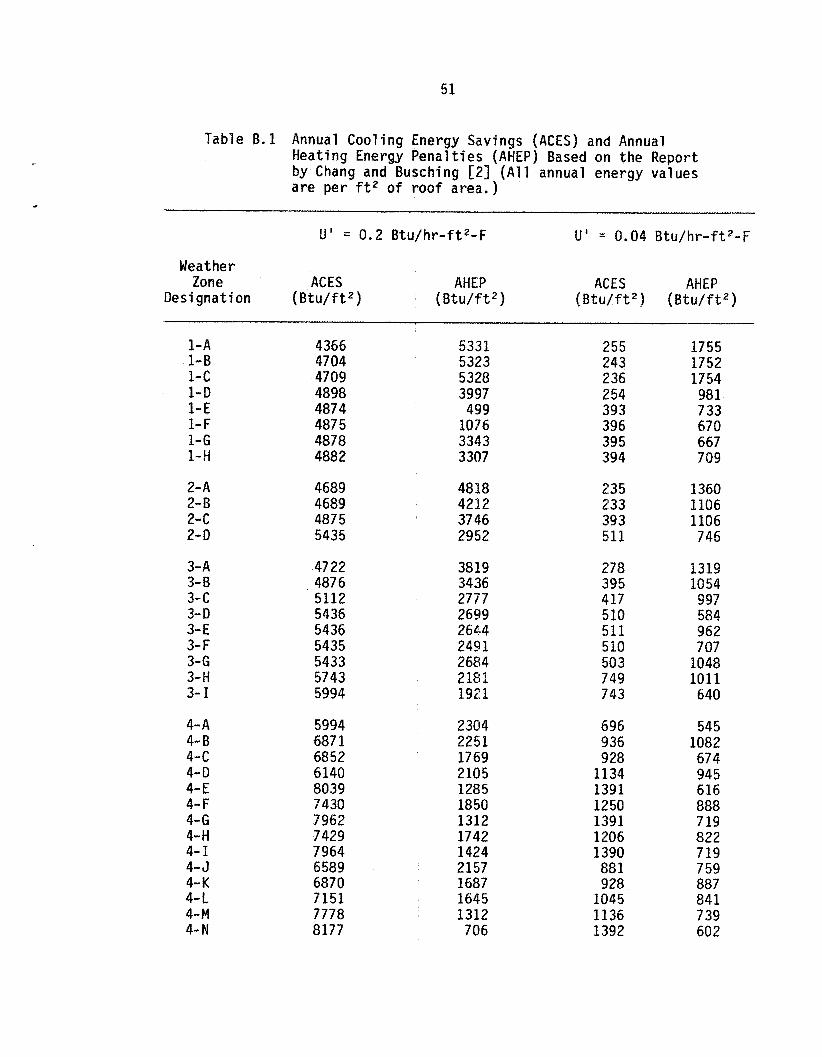
51
Table B . l Annual Cooling Energy Savings (AGES) and Annual Heating Energy P e n a l t i e s (AHEP) Based on the Report by Chang and Busching [2] (All annual energy values a r e per f t 2 of roof a r e a . )
U ' = 0.2 B t u / h r - f t 2 - F U ' = 0.04 B t u / h r - f t 2 - F
Weather
De si gnat i on Zone ACES AHEP ACES AHEP
( Btu / f t2 ) ( Btu / f t2 ) (B tu / f t2 ) (B tu / f t2 )
l - A 1- 8 l - C l - D 1- E 1- F 1 - G l - H
2- A 2- B 2- c 2- D
3-A 3- B 3- c 3- D 3- E 3- F 3- G 3- H 3- I
4- A 4- B 4- c 4- D 4- E 4- F 4- G 4- H 4- I 4- J 4- K 4- L 4-M 4- N
4366 4704 4709 4898 4874 487 5 4878 488 2
4689 4689 487 5 5435
47 22 487 6 5112 5436 5436 5435 5433 57 43 5994
5994 687 1 6852 6140 8039 7430 7962 7 429 7964 6 589 6870 7151 7778 8177
5331 5323 5328 3997 499
1076 3343 3307
4818 4212 37 46 2952
3819 3436 2777 2699 2644 249 1 2684 2181 1921
2304 2251 1769 2105 1285 1850 1312 1742 1424 2157 1687 1645 1312 706
255 243 2 36 254 393 396 39 5 394
235 233 393 511
278 395 417 510 511 5 10 503 749 743
696 936 9 28
1134 1391 1250 1391 1206 1390 88 1 9 28
1045 1136 1392
1755 1752 1754 98 1 733 670 667 709
1360 1106 1106 7 46
1319 1054 997 584 962 707
1048 1011 640
545 1082 674 945 616 888 7 19 822 7 19 7 59 887 841 7 39 60 2

52
'Table B. 1 (cont inued)
U ' = 0.2 B tu /h r - f t 2 -F U' 0.04 B t u / h r - f t ' - F
Weather Zone ACES AHEP ACES AHEP
Designation ( B t L l / f t Z ) ( B t U J f t 2 ) ( B t U / W ) ( B t u / f t 2 )
5- A 5-B 5-c 5- D 5- E 5- F 5- G 5- H 5- I 5-J
6-A Q- B 6- c 6- D 6 - E
7-A 7- B 7-c 7-D 7-E
8-A 8- B R- c 8- D 8- E 8- F 8- G
9-A 9- B 9- c 9- D 9- E 9- F 9- G 9- H 9- I 9- J 9- K
4874 4689 5436 6272 5437 5813 4687 487 5 5112 5437
654% 8245 7091 7 987 988 5
5548 5434 6157 7033 7 143
5112 5490 5000 467 4 6077 87 10 5855
6250 6685 6027 8239 8127 6317 7944
127 19 6620
10681 8602
4564 4162 1173
16174 2745 2925 4316 37 34 3358 2799
1977 1918 1682 1703 931
3161 3500 2855 2563 2908
3636 3529 3600 3913 242 1 1613 27 47
3000 1889 2443 2453 1216 1607 1481 395
1486 1312 1326
394 233 5 10 7 64 510 559 235 393 418 511
1159 1391 909
1276 1924
645 5 10 812 907 982
417 588
1000 217 7 28
1613 7 16
7 58 930 41 1
1447 1419 812
1412 3176
9 50 2267 1505
231 1 1276 1084 526 1 1131 77 5
1285 1054 1002 746
989 7 18 500 6 56 400
1355 1356 978
1011 7 59
1387 980
2000 1087 97 5 968 1351
1500 694 913
1006 695 412 616 569 615 7 17 7 17

53
Table B. 1 (continued)
U' = 0 . 2 Btu/hr- f t2-F U ' = 0 . 0 4 B t u / h r - f t 2 - F
Weather Zone ACES AHEP ACES AHEP
Desi gnat i on ( Btu/f t * ) ( Btu/f t ) (B tU / f t2 ) ( B t U / f t Z )
10-A 4707 10- B 4686 10-c 4865 10-D 5113 10- E 5079 10- F 5106
2721 4136 2962 3540 4074 4206
162 966 231 1343 404 1288 417 933 423 1323 397 1270


55
APPENDIX C
CORRELATIONS FOR h, USED IN DOE 2.13

56
APPENDIX C
CORRELATIONS FQR ho USED I N DOE 2.1B
S i x d i f f e r e n t . c o r r e l a t i o n s of h, w i t h wind speed are i ncorpora ted i n DOE 2.1B. They are coded by numerals 1 though 6 w i t h 1 corresponding t o a rough sur face and 6 t o a smooth surface. For re ference the c o r r e l a t i o n s a re l i s t e d below and are shown p l o t t e d i n F igure C . 1 .
The c o e f f i c i e n t h, i s i n B t u / h r - f t 2 - F when V i s i n mph and values o f A, €3 and C given i n Table C.l are used.
Table C . 1 Constants f o r Equat ion (C.1)
A DOE 2.1B Roughness Code a C
2.84 0.465 2.20 0.321 1.90 0.330 1.45 0.315 1.80 0.244 1.45 0.262
0 0.001
0 -0.002
0 -0.001254

7
cp
E
-5 m r,
-1.
CI
C
v, U
ID
ID
L1
0
h
s
a
J
I- P
C
v,
-0 m
t- 0
h
P
Y
1-
<
.e 3
7J 3
+ 6
I- W
h,
0
h,
N
N
A
N
rn 1
I I
I I
I 1
I I
I I
t I
t t


59
APPENDIX D
PRELIMINARY CALCULATIONS OF ACES AND AHEP
USING ONLY DOE 2.1B LOADS SUBPROGRAM
so
APPENDIX 0
PRELIMINARY CALCULATIONS OF ACES AND AWEP USING ONLY DOE 2.18 LOADS SUBPROGRAM
Several preliminary runs were made u s i n g only the LOADS portion of DOE 2.1B. These were made f o r several reasons: (1) computer runs where on ly output from t h e LOADS program i s specif ied r u n considerably f a s t e r than runs incorporating the SYSTEMS program; ( 2 ) i t was desired to examine the order-of-magnitude of changes i n heating and cooling loads resul t ing from decreasing the roof ' s s o l a r absorptance f o r several locations as an aid i n se lec t ing locations f o r more extensive simulations; ( 3 ) i t was reasoned tha t LOADS' output would serve t o indicate the r e l a t ive e f f e c t of the type and amount o f roof insulat ion; ( 4 ) i t was a l so reasoned tha t ins ight as t o the r o l e o f thermal capacitance could be gained from the output o f LOADS. The f i r s t se t of runs was made u s i n g steady-state calculat ions w i t h heat t r ans fe r occurring o n l y through the roof. The second s e t of runs involved use of t rans ien t calculat ions in which the thermal response fac tors of the roof and space weighting fac tors were included. I n an attempt, however, t o otherwise focus so le ly on the e f f e c t o f the roof, no internal loads were included and the walls and f loo r were specified t o be adiabat ic . T h u s , net heat t r ans fe r with the outside was forced t u occur only through the roof. I n a l l of the calculat ions involving only the LOADS subprogram, the inside temperature was specif ied t o be 74°F.
Table D . l shows the changes in cooling and heating l o a d s determined f o r U values o f 0 . 2 , 0 .1 and 0.04 B t u / h r - f t 2 - F using steady-state calculat ions. As expected, reduction o f the r o o f ' s so la r absorptance (0.8 t o 0 .3 ) resulted i n a decrease i n the cooling load and an increase i n the heating load f o r a l l t h i r t y locations examined. The r e su l t s i n Table 0 . 1 have been ordered i n accordance w i t h decreasing values o f the sum (ACES I- A H E P ) . Annual coaling energy savings ( A C E S ) i s la rges t for locations characterized by large caoling requirements. For two locations characterized by comparable cooling requirements, ACES i s l a rger fo r the one having the grea te r so la r a v a i l a b i l i t y d u r i n g the cooling season. Conversely, annual heating energy penal t ies (AHEP) due t o the reduction i n the r o o f ' s so la r absorptance are la rger f o r locations having large heating loads. Also as expected, the smaller U values resulted i n at tenuation o f b o t h ACES and A K E P . For a U v a l u e o f 0.1, A C E S and A H E P were lower than f o r U = 8 .2 by a fac tor t h a t ranged from 0.486 t o 0.493. Far U = 0.04 the fac tor ranged from 0.792 t o 0.796. The reason t h a t the fac tor was not exact ly 0 .5 and 9.8 i s due t o the variable rad ia t ive and convective surface resis tance tha t i s taken in to account w i t h i n t he code.
Using LOADS, a se r i e s of runs was made i n which the thermal capacitance o f the r o o f was taken i n t o account, A space was defined t o be encompassed by the roof, walls and a f loo r . The wal ls and f loo r weye forced to be adiabat ic so tha t heat t r ans fe r occurred only through t he roof. R u n s were made fo r the same t h i r t y locations

Table D . 1 . Preliminary ACES and AHEP Values from DOE 2,16 LOADS Subprogram Using Steady-State Calculations. Inpu t Data L i s t e d in Table 0.4
U = 0.2 B tu /h r - f t * -F U = 0.1 B tu /h r - f t 2 -F U - 0.04 Btu /hr - f t2 -F ACES AHEP ACES+AHEP ACES AHEP ACES+AHEP ACES AHEP ACEStAHEP
Locat ion ( B t u / f t 2 ) { B t u / f t 2 ) ( B t u / f t 2 ) ( B t u / f t 2 ) ( B t u / f t P ) ( B t u / f t 2 ) ( 3 t u / f t 2 ) ( B t u l f t 2 ) ( B t u / f t 2 )
Bakersf ie ld , CA 7899 Phoenix, AZ 7736 A1 buquerque, Nbf 6220 E l Paso, TX . 7245
Knoxvi 11 e, TN 4153 San Francisco, CA 1923 Augusta, GA 4197 Bangor, ME 2574 At lanta, GA 4060 Orlando, FL 5062 San Antonio, TX 467 2 Memphis, TN 4032 Nashvi I IP, TN 3704 Miami , FL 5413 Tampa, FL 4677 Lake Charles, LA 4298 S t . Louis, t10 3426 Washington, DC 298 1 Charleston, SC 3513 Port land, OR 2392 Houston, TX 3786 Chicago, IL 2348 Madison, MI 1960 Ind ianapo l is , IN 2473 Seat t le , WA 1520 Minneapol i s , #N 1994 Minot, ND 1753 Syracuse, NY 1779
Denver, CO 3998
New York, NY 1768
3429 2375
32 10 4539 2795 4837 3503 4065 2501 1385 1754 2306 2528
747 1434 1689 2453 2757 2172 3064 1515 2724 2909 2317 3220 2706 2843 2521 2267
480 1
11328 11222 11021 10455 8537
6760 6700 6639 656 1 6447 6426 6338 6232 6160 6111 5987 5879 57 38 5690 5456 530 1 507 2
4790 4740 4700 4596 4300 4035
6948
4869
4046 4509 3180 3695 2040 2125 977
2139 1321 207 2 257 3 237 1 2054 1890 2746 2373 2188 1744 1519 1788 1220 1923 1194 995
1257 774
1012 892 905 898
1758 5804 1215 5625 2452 5632 1635 5330 2311 435 1 1428 3553 2459 3436 1275 3414 2088 3409 1272 3344
891 3262 1174 3228 1288 3178 380 3126 729 3102 8 59 3047
1246 2990 1404 2923 1104 2892 1566 2786 768 2691
1384 257% 148 1 2476 1177 2434 1642 2416 1375 2387 1443 2335 1284 2189 1149 2047
705 3278
1644 1726 1289 1497 826 862 39 5
537 839
1041 958 8 30 765
1111 9 58 885 705 614 722 494 777 48 2 40 1 509 313 40 9 36 1 366 363
865
715 48 4 993 662 933 579 99 2 516 848 5 14
36 1 474 521 154 295 348 50 3 566 447 633 311 5 58 598 47 4 66 3 555 58 2 519 462
285
2359 2321 2282 2159 1759 1441 1387 1381 1385
1326 c.L
1319 1304 1286 1265
1353 OI
1253 1233 1208 1180 1169 1127
1040 999 982 976 964 943 885 825
1088
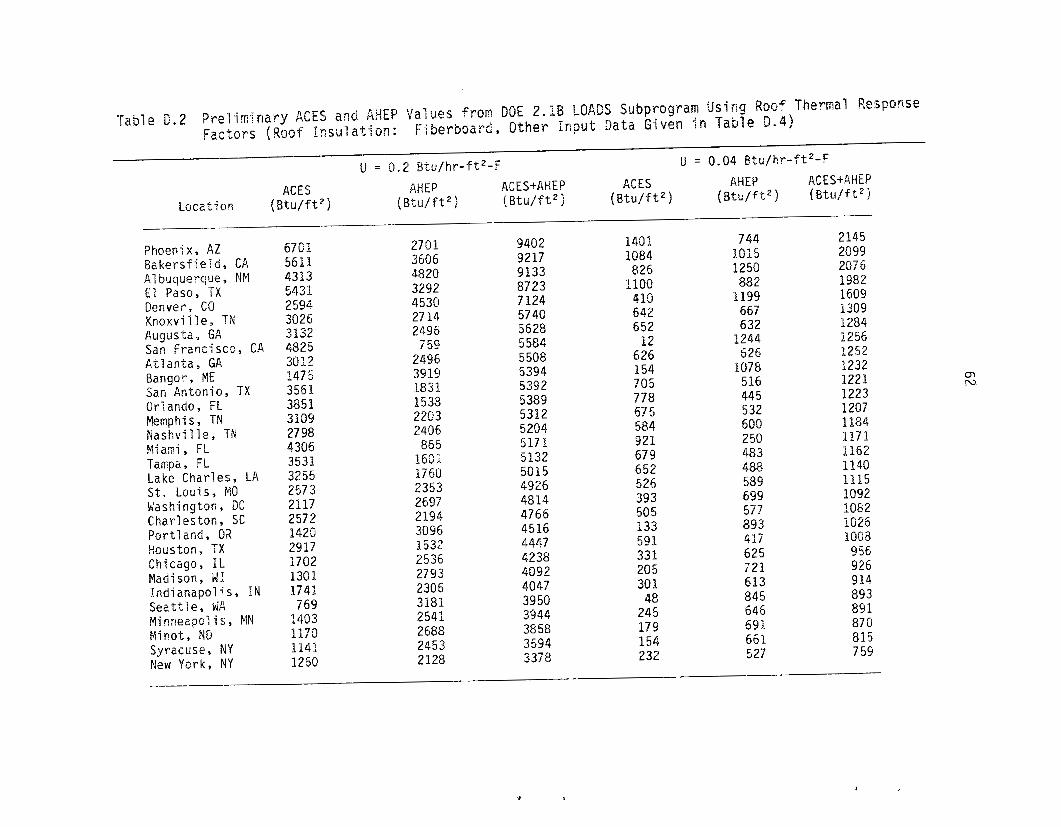
62

Table D.3 Pre l im inary ACES and AHEP Values from DOE 2.18 LOADS Subprogram Using Roof Thermal Response Factors (Roof Insu la t i on : EPS, Other Inpu t Data Given i n Table D.4)
U = 0.2 Btu /h r - f t * -F U = 0.04 Btu /h r - f t * -F ACES AHEP ACESAHEP ACES AHEP ACESAHE P
Loca t i on ( B t u / f t 2 ) ( B t u / f t 2 ) (B tu /F t2) ( B t u / f t 2 ) ( B t u / f t 2 ) ( B t u / f t 2 )
Phoenix, AZ Bakersf ie ld , CA A1 buquerque, NM E l Paso, TX Augusta, GA San Antonio, TX Memphis, TN Miami, FL Tampa, FL Lake Charles, LA Washf ngton, DC
Ind ianapol is , IN Minot, ND Syracuse, NY
Chicago, IL
6450 567 7 4364 5470 3149 3584 3124 4321 3556 3276 2136 17 17 1758 1185 1160
2664 3577 4793 3269 248 5 1815 2194 855 1582 1745 2684 2524 229 1 2678 2440
9414 9254 9157 87 39 5634 5399 5318 5176 5138 502 1 4820 4241 4049 3863 3600
1531 1284 98 1 1239 713 807 709 98 1 7 98 740 478 384 39 1 26 1 253
639 855 1129 772 58 2 429 512 20 4 377 413 6 28 584 534 622 57 1
2170 2139 2110 2011 1295 1236 1221
os 1185 1175 #
1153 1106 968 925 88 3 824
64
listed in Table B e l with the properties o f fiber% aird used far the roof insulation. The results are tabulated in Table D.2. Runs were de f o r fifteen locations w i t h the properties o f EPS instead o f
those for fiberboard used for the roof insulation, These results are listed in Table D.3. Table 5.4 gives conditions and insulation properties used in snaking t h e transient calculations.
Table D.4 Data Used in Making the Transient LOADS Calculations
Roof Dimensions Ins i de Tempera tu re
Wall Construction
Fiberboard Insulation
EPS Insulation
Roof Absorptance Change
258 ft x 250 ft 74°F 4-inch face brick; air-gap; &inch concrete block &inch concrete slab on grade 0.5- inch layer o f stones; 0.375-inch BUR; insulation; and Q.860-inch steel deck k = 8.03 5tu/hp-ft2-F; o = 17.5 ibmjft3;
D = 11.0 ibmjft3;
Cp = 0.33 Btu/lbm-F k T 0.8217 Btu/hr-ft*-F;
Cp = (9.29 Btu/lbm-F (0.8 - 8.3) = 0.5
Comparisons o f the results for steady-state calculations with those for transient calculations followed expected trends. The net effect (ACES + AHEP) for the transient calculations was lower in all cases than for the corresponding steady-state calculation. For U = 0.2, the ratio o f (ACES + AHEP) for steady-state calculations t o t h a t for transient calculations was appraximately 1.2 for all cases whereas the ratio f o r U = 0.04 was approximately 1.08. The differences between ACES values as well as between AHEP values resulting from a change in insulation from fiberboard to EPS were insignificant.

65
APPENDIX E
BUILDING DESCRIPTIOWS

66
APPENDIX E
BUILDING DESCRIPTIONS
Three d i f f e r e n t b u i l d i n g desc r ip t i ons were used as i n p u t t o DOE 2.18 dur ing the course o f t h i s study. Choices f o r two o f the desc r ip t i ons were made i n con junc t ion w i t h some o ther work i n v o l v i n g DOE 2.1B s imulat ions. A l l th ree bu i l d ings were s i n g l e s t o r y having f l a t b u i l t - u p roo fs and concrete s lab f l o o r s .
Bu i l d ing A, having a r o o f area o f 1500 ft2, i s schemat ica l ly shown i n F igure E . l . I t represents an i n t e r i o r o f f i c e space loca ted w i t h i n a s t r i p o f i d e n t i c a l contiguous u n i t s . The sides adjacent t o o ther condi t ioned spaces were t r e a t e d as having no heat t r a n s f e r across them.
Bu i l d ing B y having a r o o f area o f 10,242 ft2, i s schemat ica l ly shown i n F igure E.2. B u i l d i n g B represents an open maintenance b u i l d i n g o r l i g h t manufactur ing f a c i l i t y .
Bu i l d ing C y having a r o o f area o f 50,000 ft2, i s schemat ica l ly shown i n Figure E.3. Bu i l d ing C i s a mult izone b u i l d i n g having four per imeter zones and a l a r g e open zone i n the middle o f the b u i l d i n g as shown i n F igure E.3.
The i n s i d e surface o f the r o o f deck f o r Bu i ld ings B and C was next t o the condi t ioned space. There was a dropped c e i l i n g i n B u i l d i n g A which provided an uncondi t ioned space between the r o o f and the condi t ioned space.
I n t h i s work, r o o f desc r ip t i ons were i d e n t i c a l f o r a l l th ree bu i ld ings ; however, d i f f e rences were i n p u t f o r c e r t a i n o the r parameters. More s p e c i f i c i n p u t d e t a i l s are given i n the remainder o f t h i s appendix.

67
s
Figure E . l Schematic o f Building A

68
Figure E.2 Schematic o f B u i l d i n g B
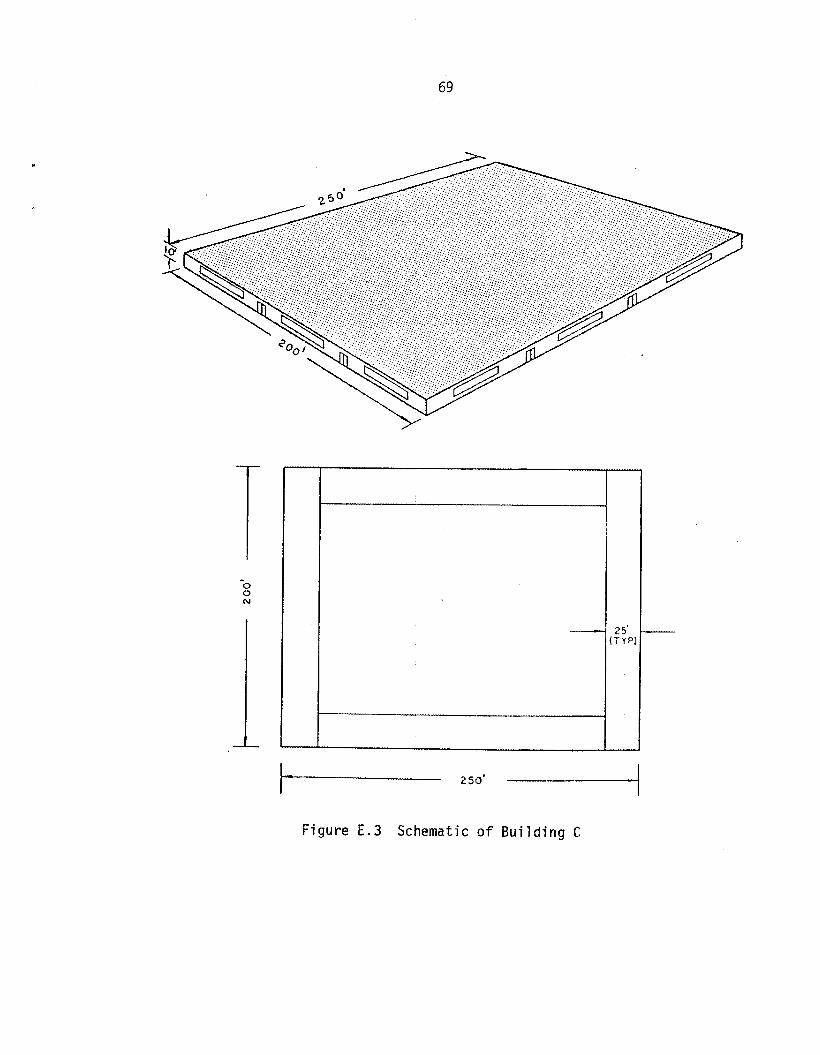
69
0 0 N
1 I
2 5 0 '
Figure E.3 Schematic o f Building C

70
ROOF DESCRIPTION (All Three B u i l d i n g s )
The rma 1 Layer L k D C Resis tance
f t B t u / h r - f t 2 - F 1 b m / f t 3 B t u / l bmF f t 2 - h r - F / B t u
Aggregate 0.0417 0.83 55 0.40 0.050 Me mb r a n e 0.0313 0.11 70 0.40 0.283 I n s u l a t i o n * 0.03 17.5 0.33 S tee l Deck 0.005 26 480 o. 10 I-
I n s i d e F i l m -- -- -- -- 0.192
**
Resis tance
* 0,1124, 0.2624 and 6:7124 t o y i e l d U' values o f 0.2, O , - - l and 0.04 B t u / h r - f t 2 - F , r e s p e c t i v e l y .
** 3,745, 8.745, and 23.745 corresponding t o above th i cknesses .
FLOOR DESCRIPTION
The rma 1
f t Btu/ 1 bm/ $ t u / f t 2 - h r - f / h r - f t 2 - F f t3 lbmF B t u
Layer L k D C Resis tance B u i l d i n g
E a r t h 1.67 0.5 130 0.3 3.33 A, B y C Concrete S l a b 0.33 1.0 140 0.22 0.33 A, C Concrete S1 ab 0.5 1.0 140 0.22 0.50 B I n s i d e F i l m -- -- -- -- 0.61 A, $ 9 C
Resistance

EXTERIOR WALL DESCRIPTION*
Therma 1 Layer L k D C Resistance Building
f t B t u / 1 am/ B t u / f t 2 - h r - F / hr-ftz-F f t 3 lbmF B t u
Brick 0.333 0.4167 120 0.2 0.80 A , 8, C -- 0.89 A , B , C Air Gap -- -- -" 8" Concrete 0.667 0.3876 53 0.20 1.72 A , B, C
Insulation 0.0833 0.02 1.8 0.29 4.17 A, B Insulation 0.1667 0.02 1.8 0.29 8.33 C Gypsum Board .0521 0.0926 50 0.26 0.56 A , B , C
0.68 A , B , C Inside Film -I -- -- --
Block
Resistance
* Solar Absorptance = 0.75 f o r A, B, and C. B and C and 5 for A (See Appendix C).
Roughness Code of 2 fo r
SPACE CONDITIONS
Condition Bui 1 d i n g
A B C
Temperature f o r LOADS, O F
Number o f People
People Heat Gain ( B t u/person ) Lighting toad ( W / f t 1 Equipment Load (W/ft2 1 Inf i 1 t ra t ion (Air Changes/hr)
F u r n i ture Wei g h t per square foot
75
10
450
2.5
1.0
0.5
25
75
20
500
2.5
1.0
1.a
10
74
252
450
2.5
1.0
0.35
8

72
HVAC EQUIPMENT
Bui 1 d i ng A B C
Thermostat Set Po in t Cooling, O F
78
72 Thermostat Set Po in t Heating, O F
7%
72
78
72
V e n t i l a t i o n A i r (CFM/Person) Equipment
5 7 5
Packaged Packaged Mu1 t i zone Roof top Roof top w i t h Reheat
A l l windows were s i n g l e pane.
I n f i l t r a t i o n i n Bu i l d ings A and i3 occurred throughout the year; f o r B u i l d i n g C, i n f i l t r a t i o n occurred from November through March 31.

73
APPENDIX F
CHANGES IN ANNUAL BUILDING ENERGY
REQUIREMENTS COMPUTED BY DOE 2.118
FOR BUILDINGS A & B CORRESPONDING
TO A REDUCTION IN SURFACE ABSORPTANCE
FROM 0.8 t o 0.3
7 4
APPENDIX F
CHANGES I N ANNUAL BUILDING ENERGY REQUIREMENTS COMPUTED BY DOE 2 . 1 B FOR BUILDINGS A & B CORRESPONOING TO A REDUCTION I N SURFACE
ABSORPTANCE FROM 0.8 t o 0.3
Tabulated i n this appendix for reference purposes a re the values ppedicted for changes in building energy requirements for Buildings A and B. Building descriptions are given in Appendix E . In each table, the r e s u l t s have been ordered in accordance with descending values o f the sum (ACES f AHEP).
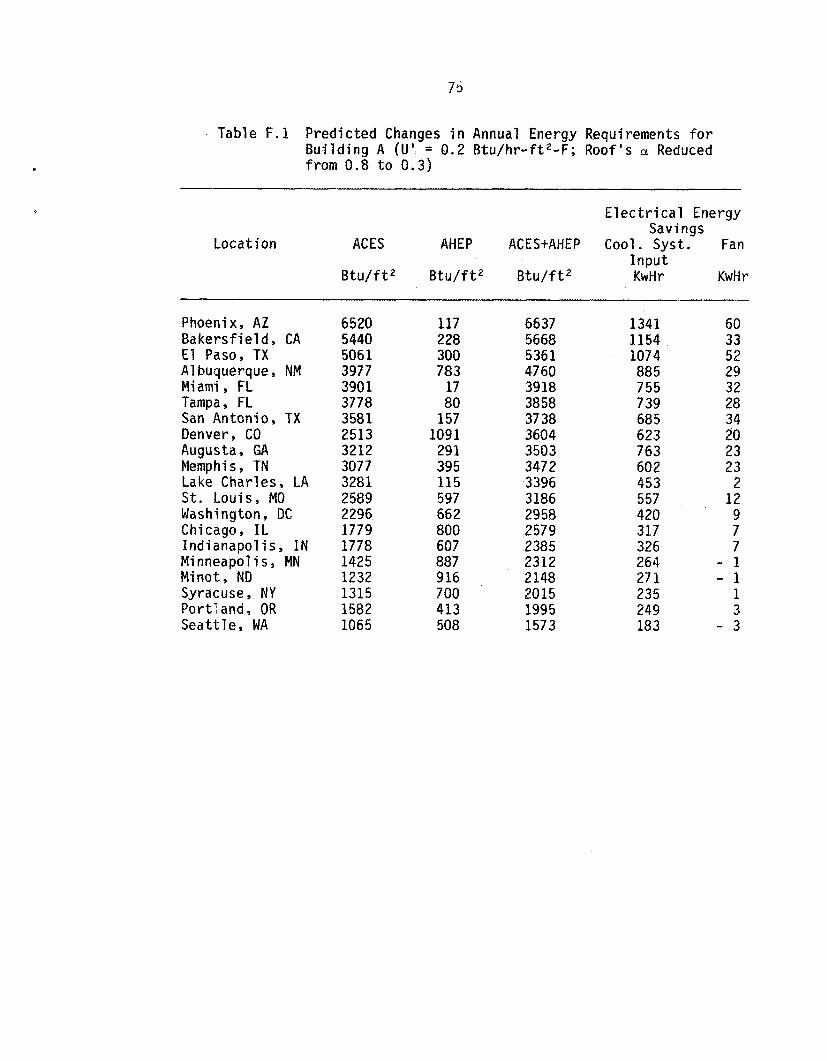
75
Table F.l Predicted Changes in Annual Energy Requirements for Building A ( U ' = 0.2 Rtu/hr-ft2-F; Roof's ~ r . Reduced from 0.8 to 0.3)
€ 1 ec t r i ca 1 €ne rgy
Location ACES AHEP ACES+AHEP Coo?. Syst. Fan
Btu/ft2 Btu/ft2 Btu/ft2 KwHr KwHr
Savings
Input
Phoenix, AZ Bakersfield, CA E7 Paso, TX A 1 buquerque, NM Miami, FL Tampa, FL San Antonio, TX Denver, CO Augusta, GA Memphis, TN Lake Charles, LA St. Louis, MO Washington, DC Chicago, IL Indianapolis, I N Minneapolis, MN Minot, ND Syracuse, NY Portland, OR Seattle, WA
6520 5440 506 1 3977 390 1 3778 3581 2513 3212 307 7 3281 2589 2296 1779 1778 1425 1232 1315 1582 1065
117 228 300 783 17 80 157 1091 29 1 395 115 597 662 800 607 887 916 700 413 508
66 37 5668 5361 4760 39 18 3858 37 38 3604 3503 347 2 3396 3 186 2958 2579 2385 2312 2148 2015 1995 1573
1341 1154 1074 88 5 755 739 68 5 623 7 63 602 453 557 420 317 326 264 27 1 235 249 183
60 33 52 29 32 28 34 20 23 23 2
12 9 7 7
- 1 - 1
1 3
- 3

76
Table F.2 P r e d i c t e d Changes i n Energy Requirements f o r B u i l d i n g A ( U l = 0.2 B t u / h r - f t 2 - F ; Roof's CL Reduced f rom 0.3 t o 0.3)
-
E l e c t r i c a l Energy Savings
Locat ion ACES AHEQ ACES+AHEP Cool. Syst . Fan
B t u / f t 2 B t u / f t 2 B t u / f t 2 KwH r KwHr I n p u t
Phoenix, AZ B a k e r s f i e l d , CA E l Paso, TX A1 buquerque, NM Miami, FL Tampa, Fl San Antonio, TX Augusta, GA Lake Charles, LA Memphis, TN Washington, DC Chicago, I L I n d i a n a p o l i s , I N Minot, ND Syracuse, NY
366 5 2979 2778 2089 2253 2140 1961 1827 1889 1761 1237 966 968
7 Q8 620
10 1 180 182 48 3
17 51
122 176 104 212 252 432 320 542 39 1
37 66 3159 2960 2572 2270 2191 2083 200 3 1993 197 3 1589 1398 1288 1162 1099
795 416 416 398 36 1 592 566 224 168 388 19 1 433 342 129 114
59 23 25 23 21 32 43
6 3
28 6
22 23
- 2 - 2

77
Table F.3 Predicted Changes i n Energy Requirements f o r Building A ( U ' = 0.04 Btu/hr-ft2-F; Roof's a Reduced from 0.8 t o 0.3)
E J e c t r i cal Energy Savings
Location ACES AHEP ACES+AHEP Cool. Syst. Fan
Btu / f t2 B t u / f t 2 B t u / f t 2 KwH r KwHr Input
Phoenix, A Z Bakersf ie ld , CA E l Paso, TX Miami, FL A1 buquerque, NM Tampa, FL San Antonio, TX Augusta, GA Lake Charles, LA Memphis, TN Washington, DC Chicago, IL Indianapol is , IN Minot, ND Syracuse, NY
1533 1190 1161 107 1 824 930 886 853 86 1 789 532 406 419 249 263
55 83 103 4
246 23 58 90 42 108 165 185 151 26 1 186
1588 1273 1264 107 5 1070 953 944 943 903 897 697 59 1 570 5 10 449
270 199 18 1 156 120 134 123 139 140 128 75 54 58 30 31
33 23 20 20 15 15 12 16 17 15
5 2 4
- 1 - 2

78
Table F.4 P r e d i c t e d Changes i n Energy Requirements f o r B u i l d i n g B, Case B 1 ( U ' = 0.2 B t u / h r - f t 2 F ; Roof's ~1 Reduced f rom 0.8 t o 0.3)
E l e c t r i c a l Energy Savings
Locat ion ACES AHEP ACEStAHEP Coal. Syst. Fan
B t u / f t 2 B t u / f t 2 B t u / f t 2 KwHr KwHr I n p u t
Phoenix, A Z E l Paso3 TX Memphis, TN B a k e r s f i e l d , CA A 1 buquerque, NM Miami , FL Lake Charles, LA Tampa, FL San Antonio, TX Augusta, GA Washington, DC Chicago, I L I n d i a n a p o l i s , I N Syracuse, NY Minot, NO
5581 47 14 4298 4546 3116 4851 4054 4094 3692 2705 2227 1725 1681 1255 800
417 1086 955 685
1903 34
37 2 174 426 787
1188 1216 1176
97 1 1212
5998 5800 5253 5231 50 19 488 5 4426 4268 41 18 3492 3415 2941 2857 2226 2012
8385 6242 4696 6277 3654 5493 5058 4666 4646 3503 2619 1735 1855 1170 809 -
3261 4332 2025 3113 17 16 1398 187 3 1328 1680 1275 1434 87 2
1604 456
' 132

79
Table F.5 Predic ted Changes i n Energy Requirements f o r B u i l d i n g B, Case B1 (U ' = 0.1 Btu/hr-ft2-F; Roof's ~1 Reduced from 0.8 t o 0.3)
E l e c t r i c a l Energy Savings
Locat ion ACES AHEP ACESAHEP Cool. Syst. Fan
B t u / f t 2 B t u / f t 2 B t u / f t 2 KwHr KwHr Input
Phoenix, A Z E l Paso, TX Bakersf ie ld , CA Miami, FL Lake Charles, LA A1 buquerque, NM San Antonio, TX Tampa, FL Washington, DC Ind ianapol is , I N Memphis, TN Augusta, GA Syracuse, M Y Chicago, I L Minot, ND
2859 2427 2347 2464 2286 1598 2033 2021 1214 1216 1232 1187 721 480 411
152 395 254
10 149 808 178 64
5 58 487 40 1 3 30 447 596 57 1
3011 2822 260 1 247 3 2435 2406 2211 208 5 1772 1703 1633 1517 1168 1076
982
3715 3297 3319 27 56 288 5 1785 2485 227 1 1296 1134 1924 1705 645 621 398
1388 1968 1825 67 9
1033 753 80 4 6 29 643 57 3 973 640 68
496 - 126

80
Table F.6 P r e d i c t e d Changes i n Energy Requirements f o r Bui ld ing B y Case 81 (U' = 0.04 B t u / h r - f t 2 - F ; Roof's CY Reduced from 0.8 t 0-3)
E l e c t r i c a l Energy Sav ings
Locat ion AGES AHEP ACEStAWEP Cool. Sys t . Fan I n p u t
B t u / f t 2 B t u / f t 2 B t u / f t 2 KwM r KWH r
Memphis, TIV Phoenix, A Z M i a m i , FL E l Paso, TX B a k e r s f i e l d , CA San Antonio, TX A1 buquerque I) N M Lake C h a r l e s , LA Chicago, IL Tampa, FL Washington , DC Minot, ND I n d i a n a p o l i s , IN Augusta, GA Syracuse , NY
1406 1209 1079 907 966 819 535 780 569 7 40 415 176 238 122 50
142 51 3
141 71 90 30 5 47 2 14 22 193 239 160 99 154
1548 1260 1082 1048 1037 889 8 40 827 783 762 608 415 398 22 1 20 4
1173 1538 1184 1180 1257 996 596 893 435 7 49 38 5 167 225 38 5 88
242 865 269 564 669 30 3 236 2 56 I30 1 7 1 143
- 47 83 148
- 30

81
Table F.7 Predicted Changes in Energy Requirements for Building 5, Case B2 { U ' = 0.2 Btu/hr-ft2-F; Roof 's CI Reduced f r o m 0.8 to 0.3)
E 1 ec t r i c a 1 Ene rgy
Locat i on ACES AHEP ACES+AHEP Cool. Syst. Fan Input
Btu/ft2 Btu/ft2 Btu/ft2 KwHr KwHr
Savings
Phoenix, AZ El Paso, TX Bakersfield, CA AI buquerque, NM Miami, FL Memphis, TN Augusta, GA Tampa, FL Lake Charles, LA San Antonio, TX Washington, DC Chicago, It Indi anapol i s , IN Minot, ND Syracuse, NY
5181 427 2 4224 2992 4136 3241 3096 3623 3403 3260 2051 1393 1557 852 1009
33 1 745 539 1645 29 7 20 67 9 144 277
945 1037 864 1217 868
348
5512 50 17 4763 4637 4165 396 1 3775 3767 3680
2996 2430 242 1 2069 1877
3608
5746 4625
3124 3955 3290 327 1 3577 3453 3517 202 1 1357 1481 844 960
4a io
9 18 923 843 80 457 342 341 3 57 388 445
59 16 39
-113 - 51
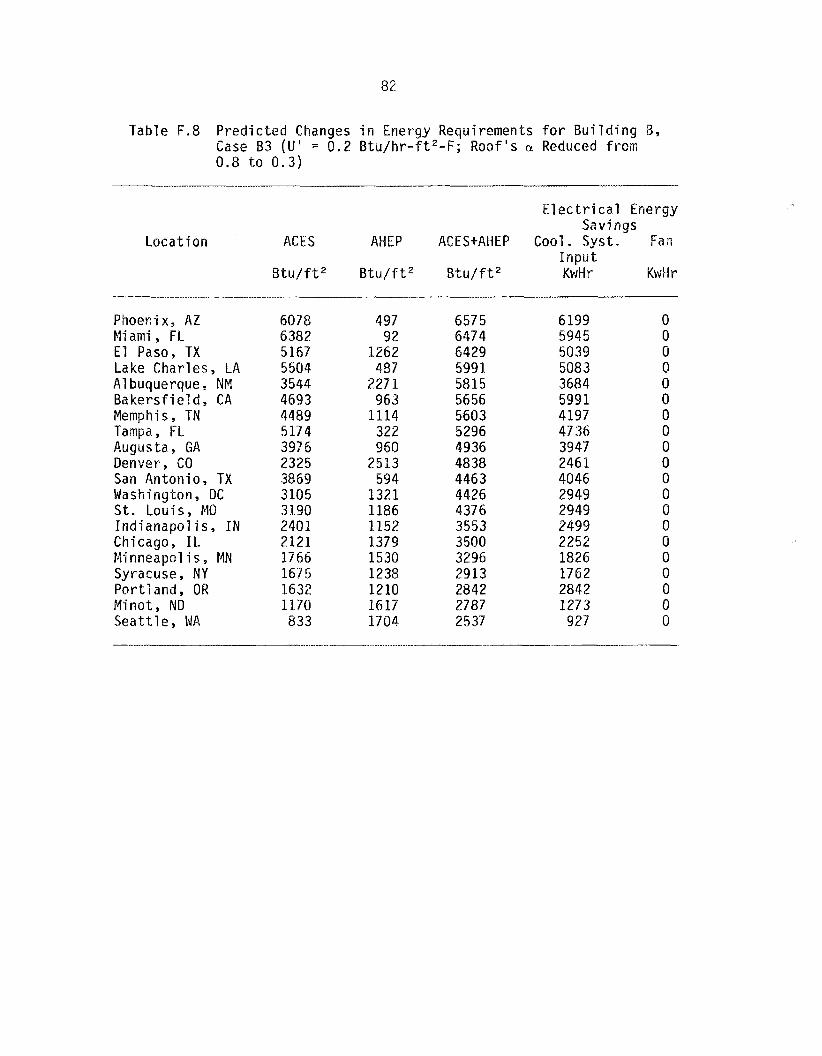
Table F.8 P r e d i c t e d Changes i n Energy Requirements f o r S u i l d i n g B, Case 53 ( U ' = 0 . 2 B t u / h r - f t 2 - F ; R o o f ' s ~1 Reduced f r o m 0 . 8 t o 0 . 3 )
E l e c t r i c a l Energy Savings
L o c a t i o n ACES AMEP ACES+AIiEP Cool. Syst. Fa ~ i l
B t u / f t 2 B t u / f t 2 B t u / f t 2 KwH r KWH r I n p u t
Phoenix, A Z Miami, FL E l Paso, TX Lake Charles, LA A 1 buquerque NM B a k e r s f i e l d , CA Memphis, TN Tampa, FL Augusta, GA Denver, CO San Antonio, TX Washington, DC S t . Louis , MCB I n d i a n a p o l i s , IN Chicago, IL Mi nneapol i s , MN Syracuse, NY Por t l and , OR Minot, ND S e a t t l e , WA
6078 6382 5167 5504 3544 4693 4489 5174 397 6 2325 3869 3105 3190 240 1 2121 1766 167 5 1632 1170 833
497 92
1262 437
227 1 963
1114 322 960
2513 594
1321 1186 1152 1379 1530 1238 1210 1617 1704
657 5 6474 6429 5991 5815 5656 5603 5296 4936
4463 4426 4376 3553 3500 3296 2913 2842 2787 2537
48 38
6199 5945 5839 5883 3684 599 1 4197 47 36 3947 246 1 4046 2949 2949 2499 2252 1826 1762 2842 1273
9 27
0 0 0 0 0 0 0 0 0 0 0 0 0 0 0 0 0 0 0 0

83
Table F.9 Predicted Changes in Energy Requirements for Building B, Case 84 (U' = 0.2 Btu/hr-ft2-F; R o o f ' s ~1 Reduced from 0.8 t o 0.3)
Loca t i on ACES
Btu/ft2
AHEP
Btu/ft2
Electrical Energy Savings
ACES+AHEP Cool. Syst. Fan
Btu/f t * KwHr KwHr Input
Phoenix, AZ M i a m i , FL El Paso, TX Lake Charles, LA San Antonio, TX A1 buquerque, NM Tampa, FL Memphis, TN Bakersfield, CA Augusta, GA Denver, CO St. Louis, MO Washington, DC Indianapolis, IN Chicago, I L Minneapolis, MN Minot, ND Syracuse, NY Portland, OR Seattle, WA
9777 10322 8191 8709 8404 5816 8438 7035 7421 6775 3809 5498 4913 3906 3435 2976 2196 267 1 2664 1352
888 149
1835 7 66 929
3313 514
177 2 1309 1522 3708 1868 2 100 1382 222b 2429 2642 1937 1761 242 1
10665 1047 1 10026 947 5 9333 9129 8952 8807 87 30 8297 7517 7 366 7013 57 38 5661 5204 48 38 4608 4425 3773
10003 9218 7862 7926 7770 5777 7 178 6587 7887 6913 3955 5133 4560 3927 3513 3033 2209 27 57 2791 1463
0 0 0 0 0 0 0 0 0 0 0 0 0 0 0 0 0 0 0 0


85
TM-10339
INTERNAL DISTRIBUTION
1. 2. 3. 4 . 5 . 6 . 7. 8. 9.
10. 11.
12-26. 27.
29-31. 32. 33. 34. 35 36.
28.
37. 38. 39. 40. 41. 42. 43. 44. 45. 46. 47. 48. 49. 50. 51. 52. 53. 54. 55 *
R. S. Car lsmi th J. E. C h r i s t i a n G. E. C o u r v i l l e F. A. Creswick W. Fulkerson M. A. Kul iasha D. L. McElroy H. McLain W. R. Mixon D. E. Re ich le E. Rogers S. D. Samples J. P. Sanders R. B. Shel ton Laboratory Records Laboratory Records (RC) ORNL Patent O f f i c e Y-12 Technical L i b r a r y Cent ra l Research L i b r a r y Document Reference Sect ion
EXTERNAL DISTRIBUTION
R. L. Alumbaugh, Naval C i v i l Engineer ing Lab., P o r t Hueneme, CA E. L. Bales, New Jersey I n s t i t u t e of Technology, Newark, NJ J. V. Beck, Michigan S ta te U n i v e r s i t y , E. Lansing, M I J. J. Boul in , DOUCE, Washington, DC J. H. Cable, Cable Associates, Inc., A lexandr ia , YA W . C a r r o l l , Lawrence Berkeley Laboratory, Berkeley, CA J. J. Cut t i ca , Gas Research I n s t i t u t e , Chicago, I L 3. G. Driggans, TVA, Chattanooga, TN W. P. E l l i s , Standards Consul tant, H a r l e y s v i l l e , PA D. M. Evans, Jr., Steven Winter Associates, Inc., New York, NY P. W. Fai rey , 111, F l o r i d a Solar Energy Center, Cape Canaveral, FL H. A. Fine, 949 Wishbone C i r c l e , Lexington, KY W. R. French, Mois ture Systems, Incorporated, HOuStQn, TX C. f . Gi lbo , Journal of Thermal I n s u l a t i o n , Lancaster, PA W. P. Goss, U n i v e r s i t y of Massachusetts, Amherst, MA E. I . Griggs, Tennessee Technological U n i v e r s i t y , Cookev i l le , TN D. A. H a r r i s , NIBS, Washington, DC R. Hauser, Hauser Laborator ies, P.O. Box G, Boulder, CO E. Johannes, EFCG, U.S. Department of Energy, Bonnev i l l e Power Admin is t ra t ion , Por t land, OR

56. 57. 58. 59. 6Q. 61. 62. 63. 64. 65. 66. 67. 68. 69. 70. 71. 72. 73" 74 e
7 5 . 75. 7 7 . 98. 79 * 80. $1. 82. 83.
84. 85 e 86. 87. 88 89. 90 II 91.
92 93 e
94 0
95. 96"
97-106.
J. P. K a ? t , Harvard U n i v e r s i t y , Cambridge, MA W. M. Kroner, Wensselaer P o l y t e c h n i c I n s t i t u t e , Troy, NY R. A. LaCosse, N a t i o n a l Roof ing C o n t r a c t o r s A s s f l . , Rosernont, I L E. Leger, P. 0. SOX 549, New Boston, NH R. A. Lucas, Tremco, Lex ington, MA R. Mack, Daw Chemical, F reepor t , TX P. C. M a r t i n , M a n v i l l e Sales Corpo ra t i on , Denver, CO J. McCorkle, 6728 S . Stee le S t r e e t , L i t t l e t a n , CO D. HcGuire, Regal I n d u s t r i e s , C s s t h e r s v i l l e , I N G. M i l l e r , Jini Wa l te r Research Corp., S t . Petersburg, Fb M. M i l l spaugh , R e f l e c t i x s , Inc , , M a r k l e v i l l e , I N D. E. Mor r i son , Mich igan S t a t e U n i v e r s i t y , E. Lansing, MI
J. R. Mumawp Bwens-Corning F l b e r g l a s , G r a n v i l l e , OH E. Noman, F i - F o i l Company, Inc . , Auburndale, FL R. E. O l i v e r , DOE/CE, Washington, DC R. L. P e r r i n e , U n i v e r s i t y o f C a l i f o r n i a , Los Angeles, CA F. J. Powell, 9919 M a y f i e l d D r i v e , Bethesda, MD D. E. Richards, Owens-Corning F i b e r g l a s , Toledo, OH W. J . Rossiter, N I S T , Gai thersburg, MD J . Sarnos, NASA - Langley, Hampton, VA E. Schaf fe r , U.S. F o r e s t Products Lab, Madison, !+/I W. W. Seaton, ASHRAE, A t l a n t a , GA S . Se lkow i t z , Lawrence Berke ley Labora to ry , lilerkeley, CA W. Shaw, Harcourt Brace Jovanovich P u b l i c a t i o n s , Cleveland, OH M. Sherman, Jim Wa l te r Corpo ra t i on , S t . Petersburg, FL P . W . Shipp, IJSG C o r p o r a t i o n , L i b e r t y v i l l e , I L 6. J I S h i r t l i f f e , N a t i o n a l Research Caunc i l , Ottawa, O n t a r i o , Canada D. R. Smith, N I S T , Boulder , 60 H. S. Smith, C e l l i n Manu fac tb r ing Inc. , Lo r ton , VA S. E. S m i t h , Holometr ix , I n c . , Cambridge, MA L. G. Spielvoyel, Wyncote House, Wyncote, PA I?. S t e r l i n g , U n i v e r s i t y o f Minnesota, Minneapal i s , MN G , A. Tsongas, P o r t l a n d S t a t e U n i v e r s i t y , P o r t l a n d , OR A. Tuluca, Steven Win te r Associates, Norwalk, CT M. G. Van Geern, C o n s t r u c t i o n Technology L a b o r a t o r i e s , Inc. , Skokie, I L C. R . Vander Linden, Vander L inden & Associates, L i t t l e t o n , CQ J . R. Warner, ACEC Research and Management Foundat ion, Washington, DC D. Whi taker , Lescker and Mahaney, Inc. , Phoenix, AZ 0. W. Yarbrough, Penn. Tech. Unlv., C a a k e v i l l e , TN O f f i c e , A s s i s t a n t Manager, Energy Research and Development, DOE/ORO, Oak Ridge, TN O f f i c e o f S c i e n t i f i c and Technica l I n f o r m a t i o n , U,S. Department o f Energy, Oak Ridge, PN
wlroney, 4557 K ing Edward Cour t , Annandale, VA