Changes in Nigeria Recent Trends and Future Projection in ...
16
Page 1/16 Recent Trends and Future Projection in Precipitation and Temperature Changes in Nigeria Julius A. Akinyoola ( [email protected] ) Ondo State Polytechnic: Rufus Giwa Polytechnic https://orcid.org/0000-0002-7945-4560 Bimpe O. Imoukhuede Ondo State Polytechnic: Rufus Giwa Polytechnic Johnson A. Oloruntade Ondo State Polytechnic: Rufus Giwa Polytechnic Research Article Keywords: Nigerians, change-point detection, RCP4.5 and RCP8.5. Posted Date: September 22nd, 2021 DOI: https://doi.org/10.21203/rs.3.rs-792227/v1 License: This work is licensed under a Creative Commons Attribution 4.0 International License. Read Full License
Transcript of Changes in Nigeria Recent Trends and Future Projection in ...
Page 1/16
Recent Trends and Future Projection in Precipitation and TemperatureChanges in NigeriaJulius A. Akinyoola ( [email protected] )
Ondo State Polytechnic: Rufus Giwa Polytechnic https://orcid.org/0000-0002-7945-4560Bimpe O. Imoukhuede
Ondo State Polytechnic: Rufus Giwa PolytechnicJohnson A. Oloruntade
Ondo State Polytechnic: Rufus Giwa Polytechnic
Research Article
Keywords: Nigerians, change-point detection, RCP4.5 and RCP8.5.
Posted Date: September 22nd, 2021
DOI: https://doi.org/10.21203/rs.3.rs-792227/v1
License: This work is licensed under a Creative Commons Attribution 4.0 International License. Read Full License

Page 2/16
AbstractExtreme precipitation and temperature events have profound impacts on lives and properties of Nigerians. This paper examined and adopted threestatistical change point detection techniques to identify changes in precipitation and temperature trends at 5% signi�cant level. The ensemble mean werecorrelated with the observation datasets and with little or no bias when evaluated. There were indications of far and near-future precipitation anomalies withchange-point detection. Signi�cant change in temperature is expected to occur for all zones under RCP4.5 and RCP8.5 for future period 2020–2099 withincrease in mean annual temperature trend 0.026–0.38℃. Projected relative change in seasonal cycle of precipitation shows that winter months maywitness increase in precipitation amounts under RCP4.5 but signi�cant decrease in magnitude under RCP8.5 in near and far-future. The results of this studyshow and a�rm that climate change intensity and its magnitude may likely intensify in Nigeria in the near and far future.
1. IntroductionNatural processes and most especially human-induced forces have been responsible for the modi�cation of climate pattern in Africa and in particularNigeria (IPCC 2007). This is as a result of increase in Green House Gases (GHGs) emission through bush burning, refuse burning, open grazing, automobileexhaust fumes and as well as burning of fossil fuel. All these human activities have climate feedback that induces extreme weather and climate events suchas increase in air temperature above average of 1.5oC (Akinsanola and Zhou 2018; Gbode et al. 2019, IPCC, 2013). It also impacts spatio-temporal pattern ofrainfall and temperature (Sylla et al. 2016) and sea level rise (IPCC, 2013). It was also reported in the �fth assessment report of the Intergovernmental Panelon Climate Change that average air temperature over Africa could exceed the twentieth-century range of variability by 2047 and 2069 under RepresentativeConcentration Pathways (RCPs) RCP8.5 and RCP4.5, respectively (IPCC, 2013, Niang et al. 2015). In the same vein, the risk of deadly heat stress is likely toincrease over West Africa, while heat waves are likely to be more frequent and longer under the effects of global warming (Diedhiou et al. 2018; Sylla et al.2018).
From the food security point of view, Food and Agriculture Organization (FAO, 2001) also reported that dependent crops on minimum temperature thresholdhave been reduced by 15–35% in Nigeria. In addition to variation in temperature and rainfall, Ravindran et al. (2000) and Sivakumar et al. (2012) furthershows that wind speed, evapotranspiration, solar radiation and relative humidity play major roles in agriculture and other sectors. More so, Collins (2011)reported that in Africa and Nigeria in particular, temperature has been increasing at about 0.15°C per decade. It is important to point out that the extent ofchange in temperature, precipitation, and all other climatic variables are not spatially and temporally uniform across the world (IPCC 2014; Yue and Hashino2003). The regional variation is as a result of the differences in surface albedo, types of land surfaces, evapotranspiration and Green House Gas (GHGs)emission rate among many other factors affects climate in many forms (Meissner et al. 2003; Synder et al. 2004). Scienti�c evidences have also shown thatthe duration and intensity of rainfall have increased in some parts of the country, producing large runoffs and �ood in many places in Nigeria. Most climaticregions for instance have continued to experience precipitation anomaly p which is quite noticeable during extreme precipitation (Nicholson, 2013). It is notalso surprising that different degree of drought occurs at different seasonal transition thereby prolong cessation of precipitation in many places. It is verynecessary to assess climate projection under different RCPs to ascertain the nature and magnitude of precipitation and temperature change in Nigeria. Thisinformation helps the policymakers in choosing relevant action that could militate against socio-economic impacts of climate change in Nigeria. However,only very few studies had examined changes in climate variables with statistical change detection technique. For example, (Akinsanola and Ogunjobi 2015;Oguntunde et al. 2011; Fasona et al. 2011; Ati et al. 2002) used an observation dataset to observed chnages in climate variables while Emmauel et al.(2019) made use of one RCM under RCP4.5 and RCP8.5 with projection from 2020–2050 over West Africa. However, change detection and trend test areknown as non-parametric tests which includes Pettit’s test (Mauget 2003; Yu et al. 2006), Standard Normal Homogeneity (Gonzalez Rouco et al. 2001;Stepanek et al. 2009) test, Buishand’s range test (Buishand 1982; Jaiswal and Lohani 2015) and Mann–Kendall trend test (Kendall 1975; Wang et al. 2005;Karmeshu 2012). These tests have capability to identify an abrupt change and gradual trend superimposed on a climate variables. These tests have beenwidely used to detect change point and examined the trend in series of hydro-climatic variables like temperature, rainfall, wind speed, humidity and sunshinehour (Salarijazi et al. 2012; Sivakumar et al. 2012; Jaiswal and Lohani 2015; Emmanuel et al. 2019). The Pettit’s test, SNHT, Buishand’s range test, and MKtrend test were used and performed over the three homogeneous agro-climatic zones of Nigeria. However, this study aimed at evaluating the performance ofdifferent selected RCMs adopted from Co-Ordinated Regional Climate Downscaling Experiment (CORDEX; Giorgi et al. 2009) through ensemble mean and aswell as to assess trends and change in precipitation and temperature over Nigeria from 1961 to 2099.
2. Data And Methodology2.1 Study Area
Nigeria is geographically located between 4–14oN and 3–1oE (Fig. 1). The country covers an approximate area of about 923,770 km2 and is bordered to thenorth by the Republic of Niger, to the South by the Atlantic Ocean, to the West by the Republic of Benin and to the east by Cameroon. The country is dividedinto three different climatic zones (Fig. 1); Guinea Coast (4–8oN), Savannah (8–11oN) and Sahel (11–14oN) based on similarities in land-use/land-cover,climate and ecosystems (Iloeje, 1981; Omotosho and Abiodun, 2007; Abiodun et al., 2013). These zones are strongly in�uenced by the West Africanmonsoon which provides precipitation for agricultural practices and other sectors of the economy. The Guinea coast zone is located in the Southern part ofthe country (4–8oN) and is characterized by a sub-humid climate with average annual rainfall ranging from 1,575mm to 2,533 mm (Oguntunde et al., 2011).The Savannah zone is a semi-arid region with average annual rainfall of about 897–1,535 mm. Reduction in rainfall in this zone is linked to the monsoonjump which is observed abrupt latitudinal shift of maximum precipitation from the Guinea coast into the Sahel region around June (Sultan and Janicot,2000; Le Barbe et al., 2002; Lebel et al., 2003; Hagos and Cook, 2007).
2.2.Data
Page 3/16
An ensemble mean of seven Regional Climate Models (RCMs) were computed. The selected RCMs were driven by different coupled Modeling Inter-comparison Project (CMIP5) Global Circulation Model in the CORDEX framework (Nikulin et al. 2018). The observations from the performance evaluation ofthe RCMs over Nigeria shows that the selected RCMs performed better in replicating the pattern and seasonal variation of temperature and precipitation(Nikulin et al. 2012; Gbobaniyi et al. 2014; Akinsanola et al. 2015; Ajayi and Ilori 2020). The datasets covered the period 1961 to 2000 for the historicalframework and the time scale slice for near-future from 2020 to 2059 and far-future from 2060 to 2099. The selected RCMs dynamically downscaled sevenGCM simulations at a horizontal resolution of 0.44° × 0.44° (Dieterich et al. 2013; Panitz et al. 2014). Also, the daily temperature and precipitation datasetsfrom CORDEX were converted to monthly data format and were utilized over the three climatic zones of Nigeria. A statistical evaluation of all seven CORDEXdataset was performed based on ensemble mean with the gridded dataset of Climate Research Unit (CRU: Harris et al. 2014) version v4.03 to simulateseasonal cycle of temperature and precipitation, trend and change point detection. Table 1 highlight all the RCMs used and their driven GCMs.
2.4. Methodology
Performance evaluations of the ensemble mean were used with different parameters to ascertain how well the simulation data replicate the precipitationand temperature over the country Nigeria. The parameter observed includes Mean Bias Error (MBE), Mean Gross Error (MGE), correlation coe�cient (r), andNash-Sutcliffe E�ciency (NSE). Change point detection test was also performed using the Pettit’s test, Standard Normal Homogeneity Test (SNHT),Buishand’s range test over the three homogeneous climatic zones at 5% signi�cant level while Mann-Kendall trend test was used to examine trend intemperature and precipitation spatially at 5% signi�cant level over the agro-climatic zones of Nigeria. The standardized Rainfall Anomaly Index (SRAI) wasalso adopted to examine the degree of dryness and wetness of each year in the reference, near-future and far-future periods while Standardized TemperatureAnomaly Index (STAI) was used to access the extent of warmth and cold relative to the near-future and far-future changes.
3. Results And Discussion3.1 Evaluation of CORDEX ensemble dataset with Change Detection Test and Trend Analysis
Performance evaluation of the ensemble mean CORDEX datasets over the three agro-climatic zones of Nigeria was performed and summarized in Table2&3. The simulation datasets covers the historical period 1961–2000 and the evaluation was performed with CRU observation datasets. The performanceevaluation help us to have better understanding of the capability of ensemble mean of RCMs in replicating seasonal distribution of temperature andprecipitation. The ensemble mean of the models captured temperature and precipitation very well over the three climatic zones when compared to CRUobservation datasets. Nigeria was divided into three agro-climatic zones the Guinea coast, Savannah and Sahel. Evaluation of precipitation through Nash-Sutcliffe E�ciency (NSE) parameter shows very close estimated value for all the three agro-climatic zones with the least value of 0.84 in the Guinea coastand the highest value of 0.89 in the Sahel. The Mean Bias Error and Mean Gross Error shows the same precipitation trend with the highest estimated valueof 23.9 and 31.73 in the Guinea coast respectively while the least values varies between Guinea coast and the Sahel region. The ensemble mean showshighest precipitation disparity in the Guinea coat when compared to observation. However, the correlation coe�cient shows an overall signi�cant value forthe three agro-climatic zones but with the least value of 0.89 in the Guinea coast. Thus, ensemble mean of the seven selected simulated datasets performedrelatively well in all the three regions when compared to observation. In the same vein, Table 3 presents statistical performance evaluation of ensemblemean temperature over the three agro-climatic zones of Nigeria. The NSE shows similar values for all the three zones with the least value of 0.79 inSavannah. The ensemble mean reproduced precipitation and temperature pattern over the three climatic zones but overestimates in some parts of theregion. The reason for overestimation of the ensemble mean can be associated to different parameterization schemes used in the various RCMs that madeup the ensemble mean (A�esimama et al. 2006; Diallo et al. 2012).
However, change detection analysis was applied on the annual mean temperature and precipitation average over the Guinea Coast, Savannah, and the Sahelwith historical datasets period of 1961 to 2000 at 5% signi�cant level. Three statistical tests with null homogenous (H0) hypothesis are presented in Tables4&5 for rainfall and temperature. Figure 4, 5, and 6 represents the graphical form of ensemble-mean temperature with a change point over Nigeria. Foridenti�cation of change point in rainfall and temperature the following three conditions have to be met which was earlier used and proven by Winingaard etal. (2003) and Jaiswal et al. (2015) for chamge point detection.
i. The �rst condition is when the change-point is homogeneous (HGN) or not occur. This is an indication that temperature and precipitation may be regardedas homogeneous when one or none of the test rejected the null (Ho) hypothesis at a signi�cant level of 5%.
ii. The second condition is when the change-point occurs or heterogeneous (CPO).This is an indication that precipitation and temperature may have shiftedor heterogeneous when two or the three tests reject the null (Ho) hypothesis at a signi�cant level of 5%.iii. The third condition is when the change point is Doubtful (DBF). This is an indication that the precipitation and temperature is regarded doubtful if at asigni�cant level of 5%. It can also be a�rmed if further evaluation of the three tests failed to agree on when the change point occurred.
However, Table 4 shows statistical test for Centre for Research (CRU) observation datasets and ensemble mean. The test revealed homogeneity nature ofprecipitation over Guinea Coast, Savannah and Sahel with a signi�cant change point as both the Petite’s, SNHT and Buishand’s test agreed that precipitationover the three climatic zones are homogeneous except for ensemble mean which shows inhomogeneity change point for the climatic zones. Over the GuineaCoast, the change point occurred in 1984 while the Savannah and Sahel is 1983. Although, the precipitation in the Sahel is known to be homogeneous innature but the three test were able to record the inhomogeneity of the precipitation for the change point in 1983 and 1984.
Likewise it is observed from the ensemble mean that there were no signi�cant change point occurred in precipitation for all the three climatic zones exceptfor the Buishand's test which shows signi�cant change for the three climatic zones while precipitation in Sahel region also demonstrates homogeneous

Page 4/16
characteristic. The nature of the precipitation in the Savanna is doubtful as the three statistical tests could not agree on the change point. The reason for allthese could be linked to Buishand’s and Pettitt’s test which are very sensitive to identify changes on the trends whereas SNHT is well known to locate changepoint at the beginning and end of a datasets as a�rmed by (Winingaard et al. 2003; Jaiswal and Lohani 2015). The change point noticed from the CRU andensemble mean agreed to have occurred in the early 1980s, a decade that is characterized with drought in Nigeria (Le Barbé et al. 2002; Lebel and Ali 2009;Nicholson 2013) A condition that resulted into signi�cant low precipitation amount which has become a source of water stress in the region. The decadewould likely been characterized with frequent sand storm and buildup of atmospheric dust (Ekpoh and Nsa 2011) which in turn might have contributed toprecipitation anomaly (Adeniyi and Oladiran 2000) and as well weakened circulation of global monsoon (Pant 2003). These re�ected in the change pointobserved over the rainfall over the three zones. Table 5 also presents change point detection in temperature over the three climatic zones of Nigeria. It showsa signi�cant shift in the mean temperature which is in relation with the change point that occurred between 1976 and 1983 on different climatic zones withvarying period but within the same decades of 1970 and 1980s. This was a period well known for prevailing droughts in the zone. The primary causes of thedrought is associated with human activities that leads to increase in emission of Green House Gases (Charney et al. 1977; Sylla et al. 2016), The results ofexternal forcing of GHGs due to change point in temperature could be responsible for global climate shift identi�ed by Baines (2006).
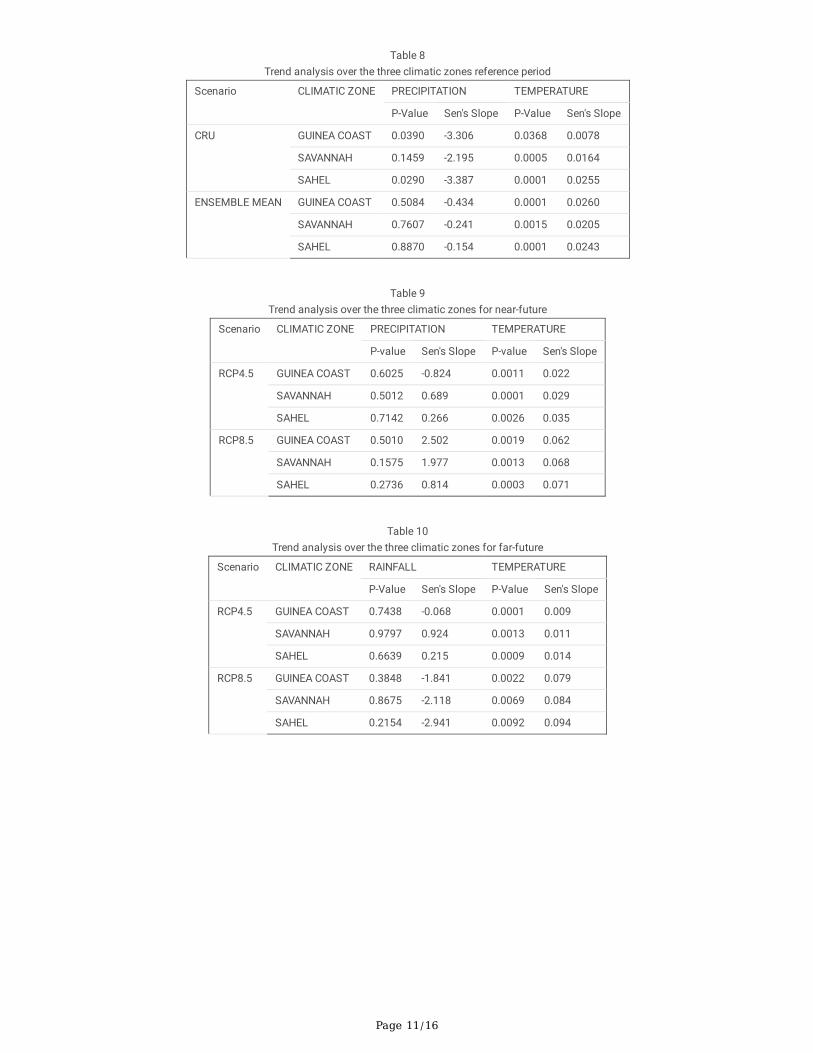
Table 8 presents Mann–Kendall trend test at 5% signi�cant level performed over the three climatic zones of Nigeria for precipitation and temperature. CRUdatasets precipitation trend analysis over Guinea Coast and the Sahel indicated a signi�cant decrease in total annual precipitation at 5% signi�cant leveland a non-signi�cant decreasing trend over the Savannah. An insigni�cant decrease in rainfall trend from the ensemble-mean was observed over the threeclimatic zones of Nigeria which shows a critical point in precipitation variability. This is also noted by Nicholson (2013) and Emmanuel et al. (2019).However ensemble mean and CRU temperature shows a signi�cant increase in temperature trend at a signi�cant level of 5% with a Sen.’s slope 0.0078 to bethe lowest in the Guinea Coast and 0.0255 to be the highest in the Sahel region under RCP4.5 while there is a signi�cant trend 0.057 and 0.063 underRCP8.5 over the three climatic zones of Nigeria. High frequency in precipitation and temperature variabilities have been linked to global warming due tohuman activities such as burning of fossil fuel which plays a major role in decreasing and increasing trend of rainfall over Nigeria (IPCC 2013; Sylla et al.2016). These results are also similar to the �ndings of Nelson et al. (2010), N’Tcha M’Po et al. (2017) and Lawin et al. (2018) but with a projected increase inannual mean temperature between 0.59 ℃ and 1.30 ℃. This further con�rms that West Africaregion includong Nigeria will continue to be warmer thanbefore.
Tables 9 and 10 shows a similar result for trend test at 5% signi�cant level performed over the three climatic zones of Nigeria with respect to precipitationand temperature variability for the near and far future cases. It was deduced that precipitation in the near future replicates the same pattern with thereference period with insigni�cant change in precipitation trend but with decrease precipitation trend in the Sahel and with improvement in the Savannah forboth CRU and ensemble mean datasets. The precipitation was more pronounced in the ensemble mean than the CRU datasets. There are also possibilitiesof increase in air temperature in the near future with the highest in the Sahel and Savannah. Far future for both CRU and ensemble mean shows insigni�cantchange in precipitation and temperature in both RCP4.5 and RCP8.5 scenario. All these could be linked to the present variability in climate variables andchanges in climatic trends while there could be limitation of global warming bellow 1.5 in far future.
Table 4 Results of temperature change point detection from the three tests for the historical period (1961–2000) at 5% signi�cant level
3.2 Near‐Future Rainfall and Temperature Pattern in Nigeria
3.2.1 Change Detection and Trend Analysis
Table 6 presents the results of change-point detection performed using SNHT, Pettitt’s, and Buishand’s test for the ensemble mean of precipitation and airtemperature and as well as for Mann–Kendall test under RCP4.5 and RCP8.5 for the near-future (2020–2059). The change-point detection (HGN) isobserved for both RCP4.5 and 8.5. HGN is an indication that no change occur in the precipitation time serie for all the three climatic zones as observed inTable 6. However, for the temperature series under RCP4.5, a change point expected to occur over the Guinea Coast and the Sahel by the year 2038 and 2036and this may be as a result of the projected increase in the annual mean of temperature within the range of 0.56–0.91 ℃ in the near future as observed inTable 6. There is posibility of positive shift in the mean annual temperature which is likely to take place in Guinea coast and Savannah climatic zones by theyear 2044 within the range of 1.26℃ and 1.16℃ in the near-future under RCP8.5 emission scenario. Table 7 presents far future point change detection forboth precipitation and temperature respectivelly. Precipitation time series remain homogenous in all the three climatic zones and in both RCP4.5 &8.5 whilethe temperature shows a drastic increase in temperature and changes for the year 2081with temperature of 27.91o C to 31.84 o C in Guinea coast and Sahelrespectively and with difference of 1.15-1.58oC in RCP 8.5 scenario.
Figure 2 presents projected temperature anomaly with sgni�cant values of change detection in �ve years interval and with decadal scale variation. Inaddition Fig. 2a shows a projected increase in temperature meas\ value 25.87oC before and 26.48 after change detection occurs for Pettitt’s test on �veyears interval. Similarly Fig. 6b shows the mean temperature values before change detection is 25.87 and 26.43 after change detection occurred for theSNHT test. In the same vein, Buishand’s test shows a similar change detection values in the same years interval. In all, the tests performed showed a similarchange detection values for the near future projected years. Figure 3 shows annual mean rainfall trend analysis result over Nigeria from 2020–2059. Thenear-future precipitation trends under RCP4.5 indicate that there are indication of signi�cant precipitation trends nearly in all three climatic zones of Nigeriaexcepts for the Guinea coast where there are insigni�cant trends of precipitation and this is due to homogeneity of precipitation pattern in the region but forthe projected precipitation under RCP8.5 there are indication of more insigni�cant precipitation trends seen especially in the Savannah and Sahel region ofthe country. This means there is likely more drought events in the near future in the Savannah and Sahel region of Nigeria in relation to (IPCC, 2013)hypothesis that some regions will become warmer in sub-Sahara Africa. More so, far-future precipitation trends under RCP4.5 shows more than 40% of
Page 5/16
signi�cant precipitation trends in the Savannah and Sahel while others under RCP 8.5 show a greater percentage of insigni�cant precipitation trends acrossall the three climatic zones. The stipple on the plot also indicates grid points with a statistically signi�cant trend at 95% con�dence interval.
However, mean temperature under RCP4.5 shows very signi�cant trends in the Savannah and Sahel region of Nigeria than the Guinea coast region with anannual average temperature change 0.034oC but less varying degree in the Coastal region while the mean temperature under RCP8.5 shows highersigni�cant change from Coastal area to the Sahel with varying degree 0.038oC in the Sahel region. This means that mean temperature will still be under thebase line of 1.5oC under RCP4.5 in the near future and it is likely to exceed the target of 1.5oC in far future under RCP8.5 scenario.
3.3. Standardized Precipitation and Temperature Anomaly Index near-future under RCP4.5 and RCP8.5
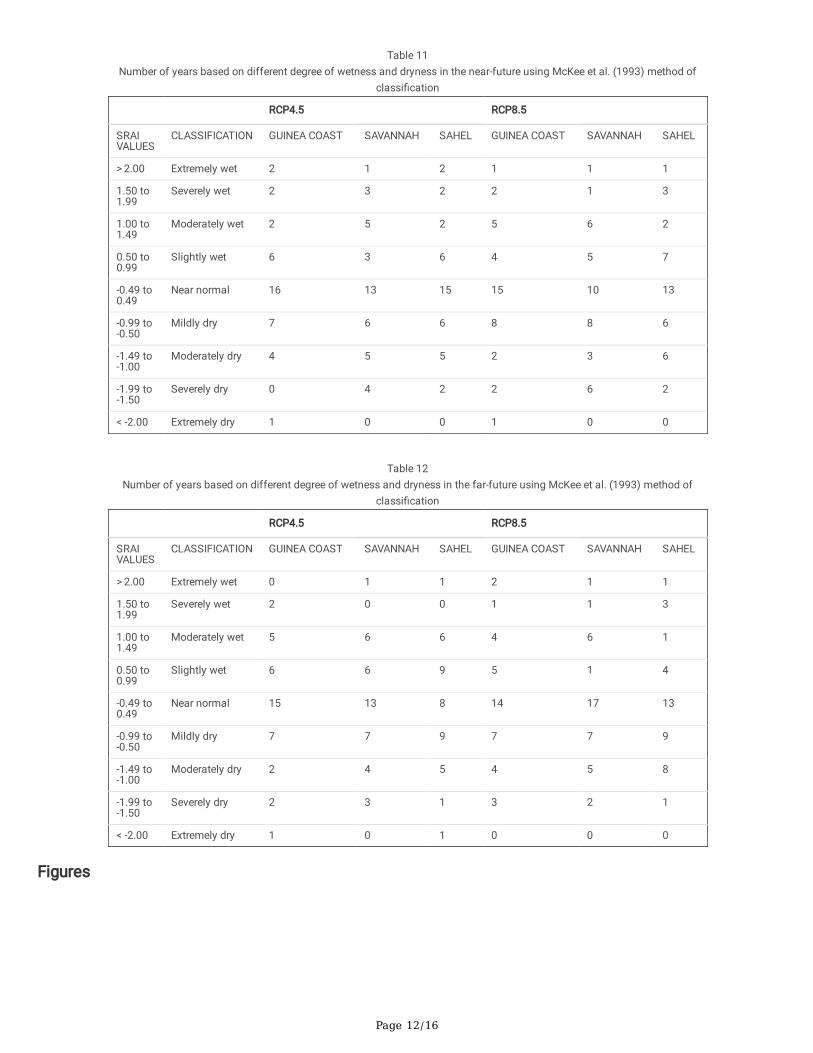
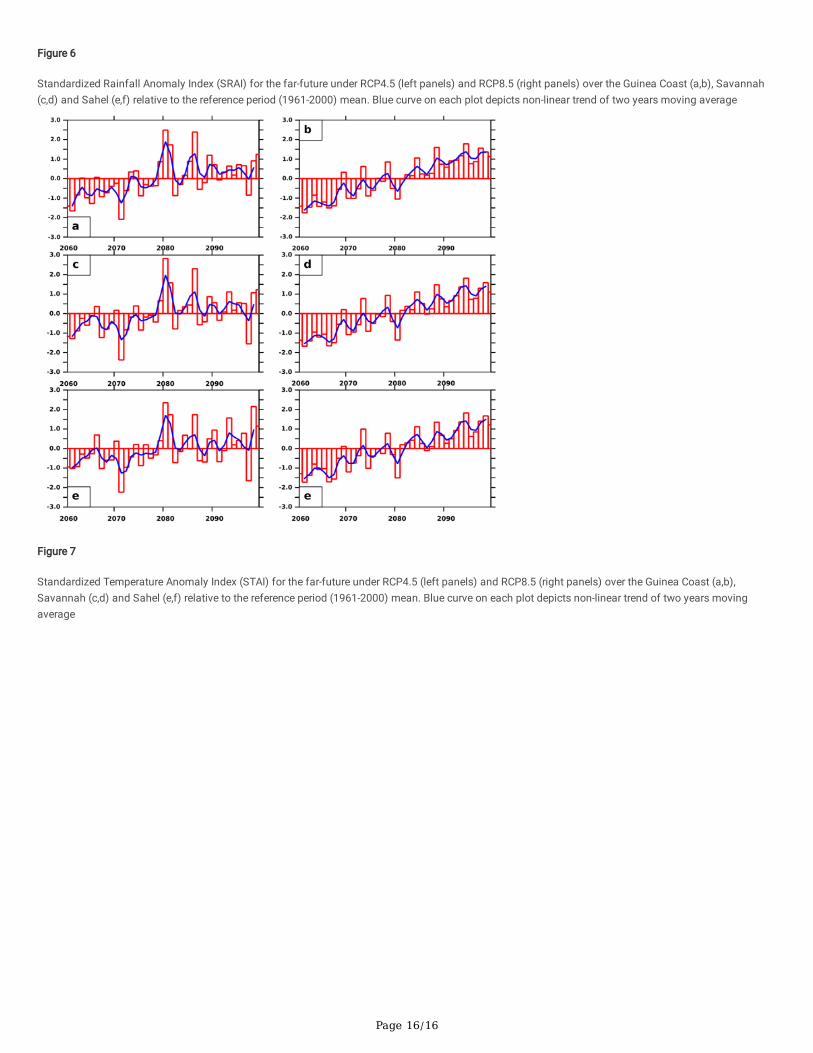
Figure 5 and table 11 shows an average number of years of precipitation based on different degree of wetness and dryness in the near-future. The relativechange in decadal rainfall in Guinea coast under RCP4.5 in Fig. 5a projects moderately wet and dry years in the �rst decade 2020–2030 and as well asmoderate wet years with no signi�cant dry years in the second decades 2030–2040. There are projected extreme wet and dry years in 2040–2050 and milddry years in 2050–2060 decade. In Savannah however, 2030–2040 decades projects moderately wet years while the last two decades 2040 − 260 projectsmild and severe dry years. The Sahel region projects decadal moderately wet years with extreme dry years in 2020–2060. However, Standardized RainfallAnomaly Index (SRAI) under RCP8.5 for the near-future projects moderate decadal dry years 2030 − 250 in the Guinea coast and with extreme wet years inthe �rst and last decade 2050–2060. In the same vein, there are projected dry years for two decades 2030–2050 in the Savannah (Fig. 5b) with moderateand with severe drought in the year 2020–2030 and 2050–2060. The decadal precipitation pattern in the Sahel region are similar to the Savannah exceptthe high intensity of dryness in the year 2030–2050 with moderate precipitation in the �rst and the middle of last decade. In all, there are projected dry yearsin the near future with high degree of decadal precipitation variation across the three climatic zones of Nigeria. Figure 6a and table 12 shows extreme dryyears and Standardized Rainfall Anomaly Index (SRAI) in the �rst decades 2060–2070 and as well as 2090–2100. Also from mild to moderate dry years inthe second and third decade 2070–2090 with moderately wet years from 2070–2100. Extreme wet years are projected toward the end of the third decade2080–2090 and as well as severe dry years in the �rst decade of 2060–2070 in the Savannah under RCP 4.5 for the far future (Fig. 6c). However, Sahel inFig. 6e also shows similar trends of precipitation anomaly with extreme wet years toward the end of the third decade 2080–22090. For precipitationanomaly index under RCP8.5 was projected in Guinea coast with extreme wet years in the last decade 2090–2100 (Fig. 6b) and as well as moderate dryyears in the middle of 2080–2090 and 2090–2100. Figure 6d shows Savannah precipitation anomaly index with extreme wet year in the fourth decade2090–2100 and with moderate dry years in the third decade 2080–2090 while Fig. 6f shows precipitation anomaly index for Sahel under RCP8.5 withextreme wet years in the �rst decade of 2060–2070 and also with moderate wet years from 2080–2100 and also with moderate dry years in the thirddecade 2080–2090. In all, precipitation anomaly index shows more dry decades with few extreme years of precipitation in the near future and as well aswith extreme wet years in the far future in all the three agro-climatic zones of Nigeria. The reasons for this is linked to continuous burning of fossil fuel andcutting of trees as an important factors in bio-geophysical feedback mechanism which have been suspected together with a shift in global climate system(Farmer and Wigley 1985; Charney et al. 1977; Baines 2006) to be responsible for the projected anomalies in rainfall and temperature.
Figure 7 shows projection of higher temperature values when compare to historical period under RCP4.5 and RCP8.5. Also, the rate of increase intemperature relative to historical mean was noticed to be higher under RCP8.5 when compared to lower emission scenarios (RCP4.5). Since the warmeratmosphere can hold larger moisture, the projected increase in precipitation relative to the historical mean over the Guinea Coast and Savannah may beassociated with the expected increase in temperature (Lenderink and Meijgaard 2010)
4. Summary And ConclusionWe used ensemble mean of seven RCMs driven by GCMs obtained from the archive of CORDEX in this study over the historical (1961–2000) and projected(2020–2099) periods over three climatic regions of Nigeria. The projected period was further divided into near-future (2020–2059) and far-future (2060–2099) as most of the RCMs agreed that warming level above 1.5℃ would have been achieved by the year 2060. Change-point detection and trend analysismethod were performed using a non-parametric statistical test which includes Standard normal homogeneity test, Buishand’s range test, and Pettitt’s testhave been used to detect change point while the Mann–Kendall test was also used to examine precipitation trends and temperature changes at the annualscale. An assessment through performance evaluation was carried out on the ensemble mean while comparing its results to that of CRU datasets for thehistorical period with a view to observing change point in seasonal cycle of precipitation and temperature changes. The projected change in seasonal cycleof precipitation and temperature variability relative to historical mean was also investigated to examine near and far-future precipitation and temperaturedeviates from the historical period and the difference changes observed are summarized as follows:
The ensemble mean reproduced the observed seasonal variation and precipitation pattern and temperature variability when compared to CRU datasetsover the three agro-climatic zones of Nigeria. There were little differences in the magnitude of precipitation and temperature and zonal variations inprecipitation amount and temperature values.
Precipitation is expected to be homogeneous in the near-future over the three climatic zones of Nigeria under RCP4.5 while Savannah region will likelybe heterogeneous under RCP8.5 with a shift in precipitation amount 105.18 mm by 2044.
Projected change in seasonal cycle of rainfall relative to the historical period for the near-future shows the winter months will have more precipitationamount under RCP4.5 while the temperature will likely increase in all the months under both pathways with more warming under RCP8.5.
Annual precipitation anomaly relative to historical long-term mean projects Guinea Coast and Savannah to have increased rainfall amount underRCP4.5. The rainfall in the Sahel will be reduced under the two emission scenarios as temperature expected to increase than the historical period underRCP4.5 and RCP8.5.

Page 6/16
A signi�cant change point in temperature over the three climatic zones is also expected by the year 2040–2050 under RCP8.5 with an average increase0.17–0.30 ℃ in the temperature mean.
5. DeclarationsWe declare that the manuscript is the original idea of the authors and that it has not been published elsewhere
Funding
There is no funding associated with this work or under obligation of any organization
Con�icts of interest/Competing interests:
All authors have participated in (a) conception and design, or analysis and interpretation of the data; (b) drafting the article or revising it critically forimportant intellectual content; and (c) approval of the �nal version and this manuscript has not been submitted to, nor is under review at, another journal orother publishing venue.
Availability of data and material
The datasets used for this work will be made available on request
Code availability
There was no special software used or applied except the ones adopted for the data analysis
Consent to participate
I have read and I understand the provided information regarding the publishing guideline. I understand that submitting manuscripts has to follow prescribedformat.
Acknowledgements The authors acknowledged the Climate Research Unit (CRU), University of East Anglia, for the observational dataset used in this studyand also appreciate Coordinated Regional Climate Downscaling Experiment (CORDEX) for making the simulation dataset used in this study available to thegeneral public.
Author’s Contribution
All listed authors participated in all phases of the manuscripts development
1. Conception of ideas of the work Akinyoola J. Adekola
2. Data collection Imoukhoude O. Bimpe
3. Data Analysis Akinyoola J. Adekola
4. Drafting the article Akinyoola J. Adekola
5. Critical revision of the article Olorubtade A. Johnson
�. Final approval of the work to the publish Oloruntade A. Johnson
Ethic’s approval
All procedures performed in this work involving human participants were in accordance with the ethical standards of the institutional and national researchcommittee and with the 1964 Helsinki declaration and its later amendments or comparable ethical standards.
Consent for publication
I, the lead author give my consent for the publication of recent trends and future projection in precipitation and temperature changes in Nigeria to bepublished in theoretical and applied climatology journal Article.
6. References1. Abiodun BJ, Pal JS, A�esimama EA, Gutowski WJ, Adedoyin A. 2008. Simulation of West African monsoon using RegCM3 Part II: impacts of
deforestation and deserti�cation. Theor. Appl. Climatol. 93: 245–261.
2. Adeniyi MO, Oladiran EO (2000) Air sea interaction: ENSO phenomenon as it afects periodicity of fooding in Nigeria. J Sci Res 6(1):30–35
3. A�esimama EA, Pal JS, Abiodun BJ, Gutowski WJ, Adedoyin A. 2006. Simulation of West African Monsoon using the RegCM3. Part I: model validationand interannual variability. Theor. Appl. Climatol. 86: 23–37.
4. Ajayi VO, Ilori OW (2020) Projected drought events over west africa using RCA4 regional climate model. Earth Syst Environ. https://doi.org/10.1007/s4174 8-020-00153 –x
Page 7/16
5. Akinsanola AA, Ogunjobi KO (2015) Recent homogeneity analysis and long-term spatiotemporal rainfall trends in Nigeria. Theor Appl Climatol. https://doi.org/10.1007/s0070 4-015-1701-x
�. Akinsanola AA, Ogunjobi KO (2015) Recent homogeneity analysis and long-term spatiotemporal rainfall trends in Nigeria. Theor Appl Climatol. https://doi.org/10.1007/s0070 4-015-1701-x
7. Akinsanola AA, Ogunjobi KO, Gbode IE, Ajayi VO (2015) Assessing the capabilities of three regional climate models over CORDEX Africa in simulatingWest African summer monsoon precipitation. Adv Meteorol 2015:1–13. https://doi. org/10.1155/2015/935431
�. Akinsanola AA, Zhou W (2018) Projections of West African summer monsoon rainfall extremes from two CORDEX models. Clim Dyn.https://doi.org/10.1007/s00382-018-4238-8
9. Ati OF, Stitger CJ, Oladipo EO (2002) A comparison of methods to determine the onset of the growing season in northern Nigeria. Int J Climatol 22:731–742
10. Baines PG (2006) The late 1960s global climate shift and its in�uence on the southern hemisphere. In: Proceedings of 8th ICSHMO. Brazil, INPE, pp1477–1482
11. Buishand TA (1982) Some methods for testing the homogeneity of rainfall records. J Hydrol 58(1–2):11– 27
12. Charney J, QuirkWJ CSH, Korn�eld J (1977) A comparative study of the effects of albedo change on drought in semi-arid regions. J Atmos Sci34:1366–1385. https ://doi.org/10.1175/1520-0469
13. Collins J.M (2011) Temperature variability over Africa. J Clim 24:3649–3666. https://doi.org/10.1175/2011JCLI3753.1
14. Collins JM (2011) Temperature variability over Africa. J Clim 24:3649–3666. https ://doi.org/10.1175/2011JCLI3753.1
15. Diedhiou A et al (2018) Changes in climate extremes over West and Central Africa at 1.5°C and 2°C global warming. Submitted. https://doi.org/10.1088/1748-9326/aac3e 5
1�. Dieterich C, Schimanke S, Wang S, Väli G, Liu Y et al (2013) Evaluation of the SMHI coupled atmosphere–ice–ocean model RCA4NEMO. pp 1–80
17. Emmanuel LA, Hounguè NR, Biaou CA, Badou DF (2019) Statistical analysis of recent and future rainfall and temperature variability in the mono riverwatershed (Benin, Togo). Climate 7:8. https :// doi.org/10.3390/cli70 10008
1�. Farmer G, Wigley TML (1985) Climatic trends for tropical Africa. Research Report for Overseas Development Administration. SMHI ReportOceanography No. 47, SMHI, Norrköping. Climatic Research Unit, University of East Anglia, Norwich, England, p 136
19. Fasona M, Tadros M, Abiodun B, Omojola A (2011) Local climate forcing and eco-climatic complexes in the wooded savannah of western Nigeria. NatRes 2:155–166. https ://doi.org/10.4236/ nr.2011.23021
20. Food and Agricultural Organization (2001) Global forest resources assessment 2000. Main Report Forestry Paper 140, Rome
21. Gbobaniyi E, Sarr A, Sylla MB, Diallo I, Lennard C, Dosio A et al (2014) Climatology, annual cycle and interannual variability of precipitation andtemperature in CORDEX simulations over West Africa. Int J Climatol 34:2241–2257
22. Gbode IE, Adeyeri OE, Menang KP, Intsiful JDK, Ajayi VO, Omo- tosho JA, Akinsanola AA (2019) Observed changes in climate extremes in Nigeria.Meteorol Appl. https ://doi.org/10.1002/ met.1791
23. Giorgi F, Jones C, Asrar GR (2009) Addressing climate information needs at the regional level: the CORDEX framework. World Meteorol Org WMO Bull58(3):175
24. Gonzalez-Rouco JF, Jimenez JL, Quesada V, Valero F (2001) Quality control and homogeneity of precipitation data in the southwest of Europe. Int JClimatol 14:964–978
25. Hagos, S.M. and Cook, K.H. (2007) Dynamics of the west African monsoon jump. Journal of Climate, 20(21), 5264–5284. https://doi.org/10.1175/2007JCLI1533.1.
2�. IPCC (2013) Impacts, adaptation, and vulnerability. Part A: global and sectoral aspects. Contribution of working group II to the �fth assessment report ofthe intergovernmental panel on climate change. Cambridge University Press, Cambridge
27. IPCC (2013) Working Group I contribution to the IPCC �fth assessment report, climate change 2013: The Physical Science Basis, IPCC
2�. IPCC (2014) Impacts, adaptation, and vulnerability. Part A: global and sectorial aspects. Contribution of working group II to the ffth assessment reportof the intergovernmental panel on climate change. Cambridge University Press, Cambridge
29. Jaiswal RK, Lohani AK (2015) Tiwari HL (2019) Statistical analysis for change detection and trend assessment in climatological parameters. EnvironProcess 2:729–749. https://doi.org/10.1007/ s4071 0-015-0105-3
30. Jones A, Haywood JM, Boucher O. 2007. Aerosol forcing, climate response and climate sensitivity in the Hadley Centre climate model. J. Geophys. Res.112: D20211.
31. Karmeshu N (2012) Trend detection in annual temperature and precipitation using the Mann Kendall Test—a case study to assess climate change onselect states in the Northeastern United States. Master of Environment Studies Capstone project, University of Pennsylvania USA.https://repository.upenn.edu/mes_capst ones/47
32. Kendall MG (1975) Rank correlation methods. Charles Griin book series. E. Arnold, London
33. Kim J, Waliser DE, Mattmann CA (2014) Evaluation of the CORDEX-Africa multi-RCM hindcast: systematic model errors. Clim Dynam 42(5–6):1189–1202
34. Lambert SJ, Boer GJ (2001) CMIP1 evaluation and intercomparison of coupled climate models. Clim Dyn 17:83–106. https ://doi. org/10.1007/PL00013736

Page 8/16
35. Le Barbe, L., Lebel, T. and Tapsoba, D. (2002) Rainfall variability in West Africa during the years 1950–90. Journal of Climate, 15, 187–202.
3�. Lebel T, Ali A (2009) Recent trends in the Central and Western Sahel rainfall regime (1990– 2007). J Hydrol 375(1–2):52–64
37. Mauget SA (2003) Intra to multi-decadal climate variability over the continental United States. Int J Climatol 16:2215–2231. https ://doi.org/10.1175/2751.1
3�. Meissner K, Weaver A, Matthews H, Cox P (2003) The role of land surface dynamics in glacial inception: a study with the Uvic earth system model.Clim Dyn 21:515–537
39. Niang I et al (2015) ‘Africa’, Climate change 2014: Impacts, adaptation and vulnerability: Part B: regional aspects: working group II contribution to the�fth assessment report of the intergovernmental panel on climate change. pp 1199–1266. https ://doi.org/10.1017/ cbo97 81107 41538 6.002
40. Nicholson SE. (2013). The West African Sahel: a review of recent studies on the rainfall regime and its interannual variability. ISRN Meteorol. 2013:453521.
41. Nicholson, S.E. (2013) The West African Sahel: a review of recent studies on the rainfall regime and its interannual variability. ISRN Meteorolog, 2013(32 pages), 453521. https://doi.org/10.1155/2013/453521.
42. Nikulin G, Jones C, Giorgi F, Asrar G, Büchner M, Cerezo-Mota R, Christensen OB, Déqué M, Fernandez J, Hänsler A, van Meijgaard E (2012) Precipitationclimatology in an ensemble of CORDEX-Africa regional climate simulations. J Clim 25(18):6057–6078
43. Nikulin G, Lennard C, Dosio A, Kjellstrom E, Chen Y, Hansler A, Kupiainen M, Laprise R, Mariotti L, Maule CF, van Meijgaard E, Panitz HJ, Scinocca JF,Somot S (2018) The effects of 1.5 and 2 degrees of global warming on Africa in the CORDEX ensemble. Environ Res Lett 13(6):065003
44. Oguntunde PG, Abiodun BJ, Lischeid G (2011) Rainfall trends in Nigeria, 1901–2000. J Hydrol 411:207–218. https ://doi.org/10.1016/j. jhydrol.2011.09.037
45. Oguntunde, P.G., Abiodun, B.J. and Lischeid, G. (2011) Rainfall trends in Nige- ria, 1901–2000. Journal of Hydrology, 411, 207–218. https://doi.org/10.1016/j.jhydrol.2011.09.037.
4�. Omotosho J, Bayo H. 1985. The separate contributions of squall lines thunderstorms and the monsoon to the total rainfall in Nigeria. J. Climatol. 5:543–552.
47. Panitz HJ, Dosio A, Büchner M, Lïthi D, Keuler K (2014) COSMOCLM (CCLM) climate simulations over CORDEX-Africa domain: analysis of the ERA-Interim driven simulations at 0.44 and 0.22 resolution. Clim Dyn 42:3015. https ://doi.org/10.1007/ s0038 2-013-1834-5
4�. Ravindran PN, Nirmal Babu K, Sasikumar B, Krishnamurthy KS (2000) Botany and crop improvement of black pepper. In: Ravindran PN (ed) Blackpepper. Harwood Academic Publish- ers, Reading, pp 23–142
49. Salarijazi M, Ali Mohammad AA, Adib A, Daneshkhan A (2012) Trend and change-point detection for the annual stream-fow series of the Karun River atthe Ahvaz hydrometric station. Afr J Agric Reserv 7(32):4540–4552
50. Sivakumar T, Thennarasu A, Rajkumar JSI (2012) Effect of season on the incidence of infectious diseases of bovine in Tamilnadu. Elixir Meteorol47:8874–8875
51. Snyder PK, Delire C, Foley JA (2004) Evaluating the in�uence of different vegetation biomes on the global climate. Clim Dyn 23:279–302
52. Stepanek P, Zahradnek P, Skalak P (2009) Data quality control and homogenization of air temperature and precipitation series in the area of CzechRepublic in the period of 1961– 2007. Int J Glob Energy. https ://doi.org/10.1504/IJGGI .2009.03065 7
53. Sultan B, Janicot S. 2000. Abrupt shift of the ITCZ over West Africa and intra-seasonal variability. Geophys. Res. Lett. 27: 3353–3356.
54. Sultan, B. and Janicot, S. (2000) Abrupt shift of the ITCZ over West Africa and intra-seasonal variability. Geophysical Research Letters, 27, 3353–3356.
55. Sylla M. B, Nikiema PM, Gibba P, Kebe I, Klutse NAB (2016) Climate change over West Africa: recent trends and future projections. Springer, New York.https://doi.org/10.1007/978-3-319-3149903
5�. Sylla M. B et al (2018) Projected heat stress under 1.5 °C and 2 °C global warming scenarios creates unprecedented discomfort for humans in WestAfrica. Earth’s Future. https ://doi.org/10.1029/2018e f0008 73
57. Tetzlaff G, Peter M. (1988). The structure of West African squall lines and their environmental moisture budget. Meteorol. Atmos. Phys. 39: 74–84.
5�. Vezzoli R, Pecora S, Zenoni E, Tonneli F (2012) Inhomogeneity, change points, trends in observations: an application to Po river discharge extremes.Centre Euro-Mediterraneo Sui Combiamenti Climatici (CMCC) Research Paper RP0138, pp 1–15
59. Wang W, Van Gelder PHAJM, Vrijling JK (2005) Trend and stationarity analysis for streamlow processes of rivers in Western Europe in the 20th century.In: Proceedings of the IWA international conference on water economics, statistics, and inance, Rethymno, Greece, 8–10, p 810
�0. Yu PS, Yang TC, Kuo CC (2006) Evaluating long-term trends in annual and seasonal precipitation in Taiwan. Water Resour Manag 20:1007–1023. https://doi.org/10.1007/s1126 9-006-9020-8
�1. Yue S, Hashino M (2003) Long term trends of annual and monthly precipitation in Japan. J Am Water Resour 39(3):587–596.
7. Tables

Page 9/16
Table 1List of seven Regional Climate Models employed in the study
S/N INSTITUTE GCMs DownscalingRCMs
1 Norwegian Climate Centre (Norway) NCC-NorESM1-M HIRHAM5
2 NOAA Geophysical Fluid Dynamics Laboratory, USA NOAA-GFDL-GFDL-ESM2G
REMO
3 National Institute for Environmental Studies, And Japan Agency For Marine-Earth Science andTechnology (MIROC), Japan
MIROC-MIROC5 RCA4
4 Consortium of European Research Institution and Researchers ICHEC-EC-EARTH RACMO
5 Max Planck Institute for Meteorology (Germany) MPI-M-MPI-ESM-LR CCLM4
6 Canadian Centre For Climate Modeling and Analysis (Canada) CCCma-CanESM2 CRCM5
7 Institute Pierre-Simon Laplace, France IPSL-IPSL-CM5A-MR RCA4
Table 2Results of the statistical evaluation between the
observation and ensemble mean precipitation overthe three agro-climatic zones of Nigeria
CLIMATIC ZONE NSE MBE MGE r
GUINEA COAST 0.84 23.9 31.73 0.89
SAVANNAH 0.85 14.04 24.14 0.93
SAHEL 0.89 11.67 26.25 0.95
Table 3Results of the statistical evaluation between the
observation and ensemble mean temperature over thethree agro-climatic zones of Nigeria
CLIMATIC ZONE NSE MBE MGE r
GUINEA COAST 0.84 12.57 16.09 0.92
SAVANNAH 0.79 14.86 13.25 0.89
SAHEL 0.80 -14.01 15.37 0.88
Table 4Precipitation change point detection from the three tests for the historical period (1961–2000) at 5% signi�cant levelChange detection over Nigeria with
reference period (1961–2000)
ClimaticZone
Datasets Pettitt's Test SNHT Buishand's Test Final Results
Statistics Change Year ofChange
Statistics Change Year ofChange
Statistics Change Year ofChange
Nature Year ofChange
CRU GUINEACOAST
227 yes 1984 16.581 yes 1984 11.321 yes 1984 Shift 1984
SAVANNAH 223 yes 1983 16.211 yes 1983 10.998 no nill Shift 1983
SAHEL 251 yes 1984 19.517 yes 1983 12.203 yes 1983 HGN 1983
ENSEMBLEMEAN
GUINEACOAST
119 no nill 8.554 yes 1983 8.441 yes 1983 Shift 1983
SAVANNAH 93 no nill 7.1 yes 1983 8.391 yes 1987 DBF -
SAHEL 81 no nill 1.913 no nill 7.021 yes 1984 HGN -

Page 10/16
Table 5Temperature change point detection from the three tests for the historical period (1961–2000) at 5% signi�cant level
Climatic
Zone
Datasets Pettitt's Test SNHT Buishand's Test Final Results
Statistics Change Year ofChange
Statistics Change Year ofChange
Statistics Change Year ofChange
Nature Year ofChange
CRU GUINEACOAST
205 yes 1982 10.55 yes 1982 10.031 yes 1982 Shift 1982
SAVANNAH 297 yes 1979 16.119 yes 1979 12.158 yes 1979 Shift 1979
SAHEL 241 yes 1978 16 yes 1978 12.122 yes 1978 Shift 1978
ENSEMBLEMEAN
GUINEACOAST
358 yes 1983 22.238 yes 1983 12.782 yes 1983 Shift 1983
SAVANNAH 337 yes 1976 20.687 yes 1976 12.354 yes 1976 Shift 1976
SAHEL 322 yes 1976 21.301 yes 1976 12.011 yes 1976 Shift 1976
Table 6NEAR- FUTURE (2020–2059) mu1 and mu2 depicts the mean before and after change point has occurred
PRECIPITATION TEMPERATURE
Scenario CLIMATICZONE
Nature of theseries
Year ofchange
mu1 mu2 diff Nature of theseries
Year ofchange
mu1 mu2 diff
RCP4.5 GUINEACOAST
HGN - 1871.3 - CPO 2038 25.87 26.43 0.56
SAVANNAH HGN - 1196.82 - DBF 2036 26.11 26.80 0.69
SAHEL HGN - 624.44 - CPO 2037 27.21 28.12 0.91
RCP8.5 GUINEACOAST
HGN - 1878.67 - CPO 2044 28.61 29.87 1.26
SAVANNAH HGN - 1187.11 - - CPO 2044 29.76 30.92 1.16
SAHEL HGN - 613.19 - CPO 2043 30.02 31.41 1.39
Table 7FAR-FUTURE (2060–2099) mu1 and mu2 depicts the mean before and after change point has occurred
Scenario CLIMATICZONE
PRECIPITATION TEMPERATURE
Nature of theseries
Year ofshift
mu1 mu2 diff Nature of theseries
Year ofshift
mu1 mu2 diff
RCP4.5 GUINEACOAST
HGN - 1878.67 - - CPO 2077 26.89 27.11 0.22
SAVANNAH HGN - 1187.1 - - CPO 2077 26.91 27.51 0.60
SAHEL HGN - 613.18 - - CPO 2076 28.01 29.32 1.31
RCP8.5 GUINEACOAST
HGN - 1630.63 - CPO 2081 27.97 29.12 1.15
SAVANNAH HGN - 1261.89 - - CPO 2081 29.20 30.51 1.31
SAHEL HGN - 403.77 - - CPO 2081 31.84 33.42 1.58
Page 11/16
Table 8Trend analysis over the three climatic zones reference period
Scenario CLIMATIC ZONE PRECIPITATION TEMPERATURE
P-Value Sen's Slope P-Value Sen's Slope
CRU GUINEA COAST 0.0390 -3.306 0.0368 0.0078
SAVANNAH 0.1459 -2.195 0.0005 0.0164
SAHEL 0.0290 -3.387 0.0001 0.0255
ENSEMBLE MEAN GUINEA COAST 0.5084 -0.434 0.0001 0.0260
SAVANNAH 0.7607 -0.241 0.0015 0.0205
SAHEL 0.8870 -0.154 0.0001 0.0243
Table 9Trend analysis over the three climatic zones for near-future
Scenario CLIMATIC ZONE PRECIPITATION TEMPERATURE
P-value Sen's Slope P-value Sen's Slope
RCP4.5 GUINEA COAST 0.6025 -0.824 0.0011 0.022
SAVANNAH 0.5012 0.689 0.0001 0.029
SAHEL 0.7142 0.266 0.0026 0.035
RCP8.5 GUINEA COAST 0.5010 2.502 0.0019 0.062
SAVANNAH 0.1575 1.977 0.0013 0.068
SAHEL 0.2736 0.814 0.0003 0.071
Table 10Trend analysis over the three climatic zones for far-future
Scenario CLIMATIC ZONE RAINFALL TEMPERATURE
P-Value Sen's Slope P-Value Sen's Slope
RCP4.5 GUINEA COAST 0.7438 -0.068 0.0001 0.009
SAVANNAH 0.9797 0.924 0.0013 0.011
SAHEL 0.6639 0.215 0.0009 0.014
RCP8.5 GUINEA COAST 0.3848 -1.841 0.0022 0.079
SAVANNAH 0.8675 -2.118 0.0069 0.084
SAHEL 0.2154 -2.941 0.0092 0.094
Page 12/16
Table 11Number of years based on different degree of wetness and dryness in the near-future using McKee et al. (1993) method of
classi�cation
RCP4.5 RCP8.5
SRAIVALUES
CLASSIFICATION GUINEA COAST SAVANNAH SAHEL GUINEA COAST SAVANNAH SAHEL
> 2.00 Extremely wet 2 1 2 1 1 1
1.50 to1.99
Severely wet 2 3 2 2 1 3
1.00 to1.49
Moderately wet 2 5 2 5 6 2
0.50 to0.99
Slightly wet 6 3 6 4 5 7
-0.49 to0.49
Near normal 16 13 15 15 10 13
-0.99 to-0.50
Mildly dry 7 6 6 8 8 6
-1.49 to-1.00
Moderately dry 4 5 5 2 3 6
-1.99 to-1.50
Severely dry 0 4 2 2 6 2
< -2.00 Extremely dry 1 0 0 1 0 0
Table 12Number of years based on different degree of wetness and dryness in the far-future using McKee et al. (1993) method of
classi�cation
RCP4.5 RCP8.5
SRAIVALUES
CLASSIFICATION GUINEA COAST SAVANNAH SAHEL GUINEA COAST SAVANNAH SAHEL
> 2.00 Extremely wet 0 1 1 2 1 1
1.50 to1.99
Severely wet 2 0 0 1 1 3
1.00 to1.49
Moderately wet 5 6 6 4 6 1
0.50 to0.99
Slightly wet 6 6 9 5 1 4
-0.49 to0.49
Near normal 15 13 8 14 17 13
-0.99 to-0.50
Mildly dry 7 7 9 7 7 9
-1.49 to-1.00
Moderately dry 2 4 5 4 5 8
-1.99 to-1.50
Severely dry 2 3 1 3 2 1
< -2.00 Extremely dry 1 0 1 0 0 0
Figures

Page 13/16
Figure 1
Geographical location of stations in Nigeria, source (Akinyoola et al., 2018)
Figure 2
Graphical illustration of detection of change point in the annual mean series of temperature average over the Guinea Coast as shown by (a) Pettitt’s test, (b)SNHT, and (c) Buishand’s test where mu1 and mu2 depicts the mean before and after change point has occurred in temperature series, respectively.

Page 14/16
Figure 3
Annual mean precipitation trend analysis result over Nigeria for near and far-future . Stipples on the plot represent grid points with a statistically signi�canttrend at a 95% con�dence interval.
Figure 4

Page 15/16
Mean annual temperature trend analysis result over Nigeria for near and far future. Stipples on the plot represent grid points with a statistically signi�canttrend at a 95% con�dence interval
Figure 5
Standardized Rainfall Anomaly Index (SRAI) for the near-future under RCP4.5 (left panels) and RCP8.5 (right panels) over the Guinea Coast (a,b), Savannah(c,d) and Sahel (e,f) relative to the reference period (1961-2000) mean. Blue curve on each plot depicts non-linear trend of two years moving average
Page 16/16
Figure 6
Standardized Rainfall Anomaly Index (SRAI) for the far-future under RCP4.5 (left panels) and RCP8.5 (right panels) over the Guinea Coast (a,b), Savannah(c,d) and Sahel (e,f) relative to the reference period (1961-2000) mean. Blue curve on each plot depicts non-linear trend of two years moving average
Figure 7
Standardized Temperature Anomaly Index (STAI) for the far-future under RCP4.5 (left panels) and RCP8.5 (right panels) over the Guinea Coast (a,b),Savannah (c,d) and Sahel (e,f) relative to the reference period (1961-2000) mean. Blue curve on each plot depicts non-linear trend of two years movingaverage