Captive Power in Nigeria agri-food sector) or the amount of self-generated captive power in Nigeria....
153
Captive Power in Nigeria A Comprehensive Guide to Project Development
Transcript of Captive Power in Nigeria agri-food sector) or the amount of self-generated captive power in Nigeria....

Captive Power in NigeriaA Comprehensive Guide to Project Development


Captive Power in NigeriaA Comprehensive Guide to Project Development

Published by:European Union Energy Initiative
Partnership Dialogue Facility (EUEI PDF)
c/o Deutsche Gesellschaft für
Internationale Zusammenarbeit (GIZ) GmbH
Dag-Hammarskjöld-Weg 1–5
65760 Eschborn, Germany
www.euei-pdf.org
www.africa-eu-renewables.org
Place and date of publication:Eschborn, November 2016
Editor:Ina de Visser
Authors:Partners for Innovation B.V.:
Thessa Bagu, Thomas Dietz, Emiel Hanekamp,
Aniche Phil-Ebosie and Bolade A. Soremekun
Design & Layout:Schumacher. Design und digitale Medien
www.schumacher-visuell.de
Photos:© EUEI PDF / Partners for Innovation
Production:Printed on 100% recycled paper
The Partnership Dialogue Facility (EUEI PDF) is an instrument of
the EU Energy Initiative (EUEI). It currently receives contributions
from the European Commission, Austria, Finland, Germany, Italy,
the Netherlands and Sweden. EUEI PDF is responsible for the
implementation of the Africa-EU Renewable Energy Cooperation
Programme (RECP).
The RECP is a programme of the Africa-EU Energy Partnership
(AEEP)
Imprint
2
Market Study and Project Scouting Nigeria
3
Market Study and Project Scouting Nigeria
ACKNOWLEDGEMENTAs part of this study, the researchers have conducted interviews and communicated with over 70 persons
from different government agencies, non-governmental organisations and the private sector (GenCos,
DisCos, financiers, relevant experts, power project developers and agri-food sector companies). More than
40 companies active in the agri-food sector have been visited, often multiple times. We would like to
express our gratitude to all those that have cooperated in this study as their input has been very important
to the outcome of this report.
Special thanks goes to Godwin Eni Aigbokhan, Renewable Energy Market Adviser of the National
Competitiveness Council of Nigeria and focal point for the RECP. Godwin was involved in many interviews
and field visits. The researchers also would like to thank the RECP team for their flexibility and providing
their suggestions on how to improve the outcome of this study.
NOTES FROM THE AUTHORSThe information in this report is based on interviews, site visits and desk- and literature research. Finding
recent and reliable data in Nigeria is challenging. The researchers therefore had to use many different data
sources with often different time frames and units. Combining these sources provided new insights but
also raised new questions, especially in relation to reliability of the gathered data.
Some data was not available, e.g. energy demand for the different manufacturing sectors (especially
the agri-food sector) or the amount of self-generated captive power in Nigeria. The researchers had to
use combinations of old and recent, direct and indirect data and extrapolations to be able to provide an
estimate for these figures.
The information in chapter six of this report is based on quality sources and is accurate at the time of
writing (2016). However, the Nigerian energy sector is still in development and processes, procedures,
timelines, fees and the likes are subject to change. Moreover, more than one respondent indicated that
there are hidden obstacles and processes. Therefore, for any entity intending to set up a power project
in Nigeria it would be wise to liaise with relevant experts who can use their insider knowledge and
relationships to ensure all necessary steps at that point of time are indeed taken.

4
Market Study and Project Scouting Nigeria
AFD Agence Française de Développement
AfDB African Development Bank
APC All Progressive Congress
BMZ German Federal Ministry for Economic
Cooperation and Development
BOOT Build-Own-Operate-Transfer
CAC Corporate Affairs Commission
CBN Central Bank of Nigeria
CCI Certificate of Capital Importation
CNG Compressed Natural Gas
CP Condition Precedent
CPS Country Partnership Strategy
CREN Council for Renewable Energy
DBOM Design-Build-Operate-Maintain
DCS Detail Commercial Solicitors
DFID Department for International
Development
DisCo Distribution Company
DMB Deposit Money Bank
ECN Energy Commission of Nigeria
ECOWAS Economic Community of West
African States
EFB Empty Fruit Bunch
EIA Environmental Impact Assessment
EOI Expression of Interest
EPC Engineering, Procurement &
Construction
EPSRA Electric Power Sector Reform Act
EPZ Export Processing Zones
FCO Foreign and Commonwealth Office
FCT Federal Capital Territory
FDI Foreign Direct Investment
FEC Federal Executive Council
FFB Fresh Fruit Bunch
FGN Federal Government of Nigeria
FME Federal Ministry of Environment
FMP Federal Ministry of Power
FTZ Free Trade Zone
GACN Gas Aggregation Company Nigeria
Limited
GDP Gross Domestic Product
GenCo Generation Company
GIZ Deutsche Gesellschaft für Internationale
Zusammenarbeit (GIZ) GmbH
GNI Gross National Income
GSA Gas Supply Agreement
GTA Gas Transportation Agreement
HYPPADEC Hydro Electric Power Producing Areas
Development Commission
IEDN Independent Electricity Distribution
Networks
IFC International Finance Corporation
IPP Independent Power Producer
JICA Japan International Cooperation
Agency
LTSA Long term Service Agreement
MAN Manufacturers Association of Nigeria
MEND Movement for the Emancipation of the
Niger-Delta
MFB Micro Finance Bank
MFI Microfinance Institutions
MIGA Multilateral Investment Guarantee
Agency
MoF Ministry of Finance
MoP Ministry of Power, Works and Housing
MoPR Ministry of Petroleum Resources
MSMEs Micro, Small and Medium sized
Enterprises
MYTO Multi-Year Tariff Order
NAE Nigeria Alternative Energy
NAPTIN National Power Training Institute of
Nigeria
NASENI National Agency for Science and
Engineering Infrastructure
NBET Nigerian Bulk Electricity Trading Plc
NBS Nigeria Bureau of Statistics
NCAPMA National Cassava Processors and
Marketers Association
NCERD National Centre for Energy Research
and Development
NCHRD National Centre for Hydropower
Research and Development
NCP National Council on Privatisation
NDPHC Niger Delta Power Holding Company
NEEDS National Economic Empowerment and
Development Strategy
NEITI Nigeria Extractive Industries
Transparency Initiative
NEMSA Nigerian Electricity Management
Services Authority
NEMSF Nigeria Electricity Market Stabilization
Facility
NEP National Energy Policy
ABBREVIATIONS AND DEFINITIONS

5
NEPA National Electric Power Authority
NEPP National Electric Power Policy
NERC National Electricity Regulatory
Commission
NESI Nigerian Electricity Supply Industry
NESP Nigerian Energy Support Programme
NGC Nigerian Gas Company
NGN Nigerian Naira
NIAF Nigerian Infrastructure Advisory Facility
NIFOR Nigerian Institute for Palm Oil Research
NIPC Nigerian Investment Promotion
Commission
NIPP National Integrated Power Projects
NNPC Nigerian National Petroleum
Corporation
NOTAP National Office for Technology
Acquisition & Promotion
NPC National Population Commission
NPDC Nigerian Petroleum Development
Company
NREEEP National Renewable Energy and Energy
Efficiency Policy
O&M Operation & Maintenance
ONEM Operator of the Nigerian Electricity
Market
OPC Odua People’s Congress
PAPs Project Affected Persons
PCOA Put Call Option Agreement
PDP People's Democratic Party
PHCN Power Holding Company of Nigeria
PKO Palm Kernel Oil
PPAs Power Project Agreements
PV Photovoltaic
REA Rural Electrification Agency
REAP Renewable Electricity Action
Programme
RECP Renewable Energy Cooperation
Programme
REMP Renewable Energy Master Plan
REPG Renewable Electricity Policy Guidelines
RFP Request for Proposal
ROW Right of Way
SCPZs Staple-Crop Processing Zones
SERC Sokoto Energy Research Centre
SHP Small Hydro Power
SHS Solar Home Systems
SPO Special Palm Oil
TCN Transmission Company of Nigeria
TEM Transitional Electricity Market
TPA Transmission Project Agreement
TPO Technical Palm Oil
TUOS Transmission Use of System Agreement
UNDP United Nations Development
Programme
UNIDO United Nations Industrial Development
Organisation
USAID United States Agency for International
Development
Important definitionsAgri-food
sector
The agri-food sector includes those
enterprises engaged in agriculture
(and life stock) and the processing
of food and drink.
Grid-
connected
power
Power plant where the electricity
generated is evacuated on the
national (TCN) grid
Embedded
power
Electricity directly connected to and
evacuated through a distribution
system which is connected to a
transmission network operated by a
System Operations Licensee
Captive
power
The generation of off-grid electricity
that is entirely consumed by the
generator itself and has an installed
capacity exceeding 1 MW (no upper
limit)
Off-grid
power
Small scale (0–1 MW) electricity
generation to a single or limited
number of customers, including the
use of mini-grids
This report uses the European notation of numbers.
Exchange rates used of 2nd of May 2016:
€ 1 = 228 Naira and $ 1 = € 0,851
1) The Naira is highly volatile with inflation rates in 2016 above
11%, therefore, prices converted from Naira to Euro in this report
may not be accurate at the time of reading.
Abbreviations and definitions

6
Market Study and Project Scouting Nigeria
The energy situation in Nigeria is critical and a key
constraint for economic development. About 55%
of the population has no access to electricity and
out of the total energy consumption, traditional
biomass (firewood and charcoal) accounts for 86%.
Population growth and economic development
contribute to an increased need for electricity. The
gap between production capacity and demand in
combination with poorly maintained generation
installations and a poor national and regional
electricity grid, results in unstable and unreliable
electricity supply for both households and
companies.
As a consequence, many companies and
households rely on diesel generators for their
electricity supply. Of the total energy consumed by
Nigerian industries only 4% is from grid-connected
electricity. 96% is self-produced, using either natural
gas, oil products (usually diesel) or biomass and
waste (usually wood products and agri-waste).
Privatisation of the energy landscapeIn recent years, the energy landscape in Nigeria
has undergone drastic changes due to the ongoing
privatisation of the sector. In 2013 the government
privatised the electricity sector with the aim to
improve the reliability of electricity supply. However,
the restructuring of the sector has not yet led to the
anticipated improvements. In recent decades the
electricity market has changed from a vertically-
integrated organisation under the state-owned
National Electric Power Authority (NEPA), to a multi-
stakeholder privatised market.
Within the Nigerian electrical power landscape,
four basic power generation options are to be
differentiated. These are:
I. Grid-connected: a power plant where the elec-
tricity generated is evacuated on the national grid.
II. Embedded: electricity that is directly connected
to and evacuated through a distribution system
which is connected to a transmission network
operated by a System Operations Licensee.
III. Captive: the generation of off-grid electricity that
is entirely consumed by the generating entity itself
and has an installed capacity exceeding 1 MW, with
no upper limit.
IV. Off-grid (including mini-grids): small scale
(0–1 MW) electricity generation to a single or
limited number of customers.
Use of generators in the manufacturing industryNigeria’s manufacturing sector is one of the major
driving forces behind the country’s economic
growth. The manufacturing sector accounted for 9%
of GDP (€ 40 billion) in 2013. Growth in the sector
has been rapid at a pace of almost 18% per annum
in the period 2011–2013, although it is hampered
by supply bottlenecks, including disruptions in
electricity supply.
Due to irregular power supply and the need for
manufacturing industries to sustain production,
Nigerian manufacturers have resorted to the use
of diesel and gas for their energy needs. Estimates
suggest that between 8 and 14 GW of decentralised
diesel generator capacity is currently installed in
the country. About 86% of the companies in Nigeria
own or share a generator and about 48% of their
total electricity demand is covered by these private
generators. With several millions of privately
installed diesel generators, Nigeria leads Africa
as a generator importer and is one of the highest
importers worldwide.
EXECUTIVE SUMMARY

7
For manufacturing companies, access to, reliability
of and cost of energy are both important. The
inadequate supply of grid-connected electricity is
the main reason for industry to generate power
themselves. The price (Total Cost of Ownership)
of electricity from renewable technologies is
comparable and often even below the price of diesel
generated electricity.
Renewable energy potential Nigeria’s abundant renewable energy resources
are largely untapped. Nigeria’s estimated installed
renewable capacity is currently only 1.979 MW.
Of this installed capacity, 1.900 MW is from three
large hydro power plants, and 64,2 MW derives from
small hydropower plants. Finally, it is estimated that
about 15 MW of dispersed solar PV installations are
installed.
Nigeria’s bio-energy is high due to the availability
of agricultural, forestry and food waste residues.
Research suggests a total technical potential of
2.300 PJ annually. With 1.700 PJ from energy crops
and 600 PJ from agricultural crop residues.
Captive energy potential in the agri-food sectorFor the substitution of diesel and gas generators,
especially the primary and secondary processing
steps in the agri-food sector have a relatively
high potential for the use of renewable energy,
especially bioenergy. This is because in primary and
secondary processing large amounts of energy are
used and feedstock and agricultural residues are
often available at the processing location. Especially
in the processing of rice, cassava, and palm oil
there seems to be a good potential of substituting
diesel and gas generators with renewable captive
bioenergy technologies.
Developing captive power projects in NigeriaDoing business in Nigeria is far from easy, and for a
project developer working in the rapidly changing
energy sector it can be even more challenging. The
experienced industry stakeholders that have been
interviewed for this report suggested the following
strategies to overcome these challenges:
Be flexible and willing to adjustA developer needs to be flexible and be willing
to adjust with time. Essentially, investors need to
understand that the rules and road map are not
very clear, and should be able to accommodate for
that.
Work with a local partnerIn nearly every sector in Nigeria, market entry and
development is greatly facilitated when working
with a local partner.
Secure financial viability of your projectEstablish power projects where you can directly
sell to clients who you can negotiate a proper price
with. This is often not possible in practice due to
regulatory constraints. For non-captive projects it
would only be possible in an embedded structure,
with a financially strong and committed DisCo.
Be as self-reliant as possibleThe developer’s independence should stretch
to ensuring control over the entire value chain,
starting with owning the land on which you base
the power plant as well as having ownership and
maintenance of power lines under own control. The
thought is by ‘controlling’ or having a stake in the
entire value chain you can avoid challenges that
might otherwise arise.
Executive summary

8
Market Study and Project Scouting Nigeria
CONTENT
1. Nigeria Country Profile .......................................................................................................................11
Geography and Climate ...................................................................................................................................12
Demography ........................................................................................................................................................14
Political Situation ...............................................................................................................................................15
Safety and Security Situation in Nigeria ...................................................................................................16
The Nigerian Economy .....................................................................................................................................16
Wealth and Poverty Distribution ..................................................................................................................18
Business Climate ................................................................................................................................................18
The Legal System ................................................................................................................................................25
2. Energy Situation in Nigeria ................................................................................................................27
Energy Consumption ........................................................................................................................................29
Electricity and Power Generation .................................................................................................................30
Electricity Transmission ...................................................................................................................................38
Electricity Distribution .....................................................................................................................................39
Stakeholders ........................................................................................................................................................41
Policies and Regulations ..................................................................................................................................42
Licences for Market Participants ...................................................................................................................45
3. Renewable Energy in Nigeria ............................................................................................................47
Resources and Potential ...................................................................................................................................47
Installed and Planned Renewable Capacity ..............................................................................................55
Key Renewable Energy Stakeholders ...........................................................................................................58
Policies and Regulations ..................................................................................................................................60
Challenges for Renewable Energy Solutions in Nigeria ........................................................................63
4. Nigerian Manufacturing Industry.....................................................................................................65
Energy Consumption in the Manufacturing Sectors .............................................................................66
Self-Generation Capacity .................................................................................................................................67
Energy Costs and Security of Supply ...........................................................................................................69
5. Captive Power ......................................................................................................................................73
Agri-food Sectors Suited to Captive Renewable Energy .......................................................................75
6. Project Developer Information ..........................................................................................................87
The Role of the Government ..........................................................................................................................87
The Role of, and Relation between, GenCos and DisCos.......................................................................92
TCN and the Changing Roles of Industry Players ....................................................................................94
DisCos and GenCos in Relation to Project Developers ..........................................................................95
Power Generation Regulations and Procedures ......................................................................................96
Other Relevant Regulations ......................................................................................................................... 107
The Business Environment .......................................................................................................................... 111
Strategies Proposed by Stakeholders to Overcome Key Challenges .............................................. 112

9
Annex A. References ............................................................................................................................. 116
Annex B. List of Free Trade Zones in Nigeria ..................................................................................... 122
Annex C. Overview and Analysis of NERC Licenses and Permits ................................................... 123
Annex D. Planned Renewable Energy Projects ................................................................................. 127
Annex E. Identified Investment Opportunities on the LAKAJI Agricultural Growth Corridor .. 130
Annex F. Large Rice Mills in Nigeria ................................................................................................... 132
Annex G. Opportunities for Embedded Power Generation in Lagos State ................................... 134
Annex H. Amended MYTO 2015 Tariffs .............................................................................................. 135
Annex I. Glossary of Terms Used ....................................................................................................... 136
Annex J. NERC Fees to Set Up a Power Project ................................................................................ 139
Annex K. Key Development Cooperation Organisations ................................................................ 141
Annex L. Example of a Captive Power Project in Oil Palm Processing .......................................... 146
Reading guide
This Guide has been drafted for the Africa-EU Renewable Energy Cooperation Programme (RECP).
The research for this market study has been conducted in the period November 2015 until
September 2016.
This report specifically addresses captive power (both electricity and other types of energy) in
Nigeria, with a focus on the agri-food sector.
Chapter one provides an introduction of Nigeria, detailing all aspects of the country relevant for
the energy sector. Chapter two ‘the energy sector’ describes energy demand, production and
distribution, including key-stakeholders and policies. In chapter three the focus is on renewable
energy; resources, potential, plans, stakeholders and policies and regulations. Chapter four
describes the Nigerian manufacturing sector in more detail, providing figures for consumption,
self-generation capacity and energy costs. Chapter five is focussed on captive power, detailing
major crop value chains and providing provisional lists of important market actors. Chapter
six is specifically meant for renewable energy project developers, providing information on the
steps to take to implement on- and off-grid electricity projects in Nigeria, including captive and
embedded power projects.
Please note that the Naira is highly volatile with inflation rates in 2016 above 11% Therefore,
prices converted from Naira to Euro in this report may not be accurate at the time of reading.
Content

10
Market Study and Project Scouting Nigeria

11
Nigeria is a federal constitutional republic that lies
between latitudes 4°N and 14°N and longitudes 2°E
and 15°E. Nigeria gained independence from Britain
in 1960. Its 923.768 km2 land mass is politically
divided into 36 states and a Federal Capital Territory
(FCT), Abuja. Nigeria shares borders with the
Republic of Benin to its west, Cameroon and Chad
in the east, and Niger in the north whilst to its
south is the Atlantic Ocean which runs along the
Gulf of Guinea.
Abuja, which is located in the centre, has been
Nigeria’s administrative capital since 1991 and a
separate Federal Capital Territory. The capital was
once Lagos, a port city located on Nigeria’s South-
West coast with the Atlantic Ocean. This change
was mainly initiated in order to symbolise equal
access to political power for the largely Islamic
north and the largely Christian south.
Nigeria is a member of the Economic Community
of West African States (ECOWAS), the West African
Power Pool (WAPP), and a member of the African
Union.
The main characteristics for Nigeria are:
» Population (2015 estimate): 182.202.000
» Total area: 923.768 km2
» Land coverage: 910.835 km2
» Water coverage: 12.933 km2
» Perimeter: 4.047 km
» Coastline: 853 km
» Arable land: 38,97%
» Permanent crops: 3,46%
» Total renewable water resources: 286,2 m3
CHAPTER 1 NIGERIA COUNTRY PROFILE
Figure 1.1 Geographical
map of Nigeria with the
36 states and the Federal
Capital Territory. (Source:
www.nyenet.com)
12
Market Study and Project Scouting Nigeria
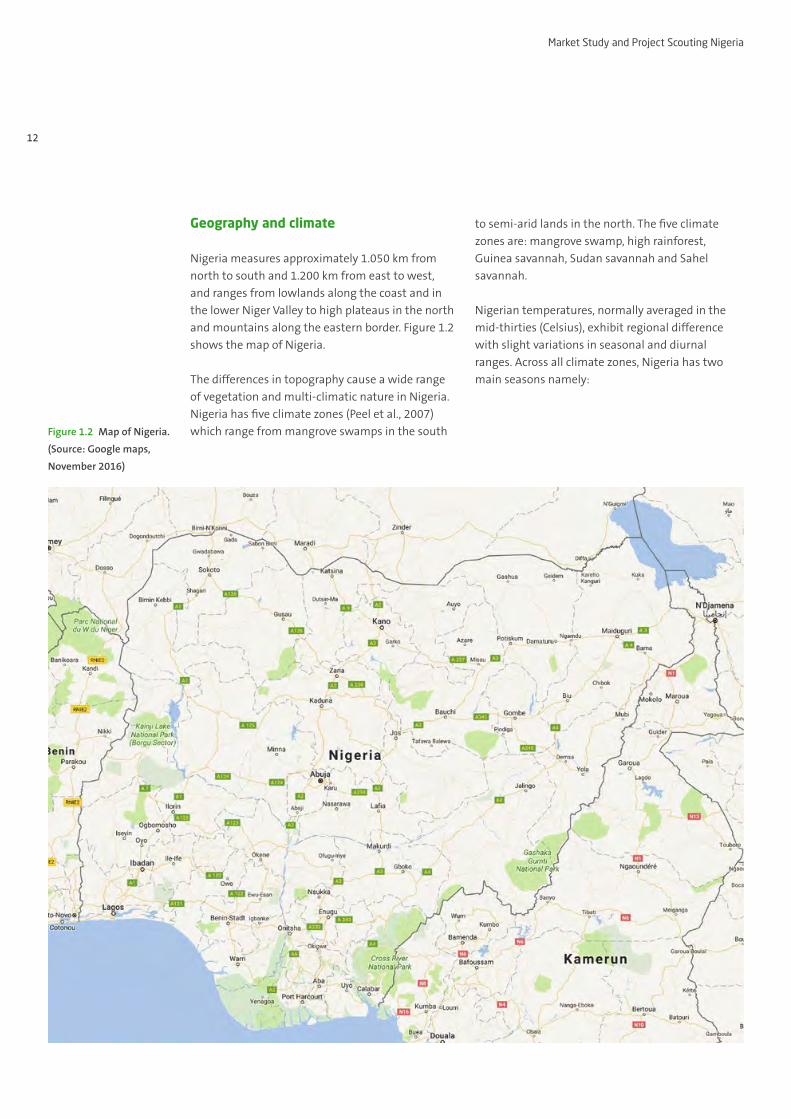
Geography and climate
Nigeria measures approximately 1.050 km from
north to south and 1.200 km from east to west,
and ranges from lowlands along the coast and in
the lower Niger Valley to high plateaus in the north
and mountains along the eastern border. Figure 1.2
shows the map of Nigeria.
The differences in topography cause a wide range
of vegetation and multi-climatic nature in Nigeria.
Nigeria has five climate zones (Peel et al., 2007)
which range from mangrove swamps in the south
to semi-arid lands in the north. The five climate
zones are: mangrove swamp, high rainforest,
Guinea savannah, Sudan savannah and Sahel
savannah.
Nigerian temperatures, normally averaged in the
mid-thirties (Celsius), exhibit regional difference
with slight variations in seasonal and diurnal
ranges. Across all climate zones, Nigeria has two
main seasons namely:
Figure 1.2 Map of Nigeria.
(Source: Google maps,
November 2016)

13
Chapter 1 Nigeria country profile
» Wet (rainy) season which begins in April and lasts
till late October.
» Dry (Harmattan) which begins in early November
and lasts till late March.
The dry season starts with dry chill spells of
wind (referred to as Harmattan in Nigeria), that
run till February and normally come with lower
temperatures and dust. The dust is carried by the
North-East trade winds from the Arabian Peninsula
across the Sahara Desert. February to March is
usually the hottest part of the year, as average
temperatures ranges between 33 – 38°C. During
this period, temperatures in the semi-arid north
sometimes reach highs of mid-forties.
Nigeria records a mean annual rainfall of 4.000
millimetres (NESP; 2015). The absolute values of
rainfall vary greatly as you move from one climatic
zone to the other with the highest amounts of rain
falling in the southernmost regions of the country.
Figures 1.3 to 1.5 illustrate examples of climate
charts for three different locations across Nigeria;
Lagos (south-west), Kano (north) and Minna
(central).
There are numerous rivers in Nigeria, but the two
major rivers are the Niger and the Benue. The
Niger originates from the Guinea highlands and
is 4.180 km long whilst the Benue originates from
the Adamawa Plateau in Northern Cameroun and
measures 1.400 km. The territorial waters to the
Figure 1.3 Climate chart
for Lagos. (Source: http://
www.lagos.climatemps.
com/)
Precipitation (mm)Max Temp (°C)Wet Days (>0,1mm)Average Wind Speed (Beaufort)Daylegth (Hours)
Min Temp (°C)Average Temp (°C)Average Sunlight Hours / DayDays with FrostRealtive Humidity (%)
35
30
25
20
15
10
5
0
Jan May SepFeb Jun OctMar Jul NovApr Aug Dec
350
300
250
200
150
100
50
0 Rela
tive
Hu
mid
ity
/ Pr
ecip
itat
ion
Tem
pera
ture
s /
Wet
Day
s /
Sun
light
Day
light
/ W
ind
Spee
d /
Fros
t
13.240.6
84.3
146.3
202.4
315.5
243.0
121.7 125.1
39.714.8
160.0
23
0 0 0 0 00 00 00 0 0
3 3 3 3 3 3 3 3 32
7
1516
11
1514
981 83
6.66.4
4.9
3.03.03.9
5.66.06.46.15.9
3.0
8183
11.8
22.4
27.3
23.7
28.45
24.1
28.5
23.7
28.7
23.2
27.1
21.9
25.6
22.3
22.3
21.8
25.05
22.1
25.5
22.4
26.427.2
31.831.4
30.3
28.928.328.2
29.3
30.9
32.232.933.2
32.2
2322.5
27.15
11.9 12.1 12.3 12.4 12.5 12.5 12.3 12.2 12.0 11.8 11.7
85 858688 88 88 8880
20
4 4
Lagos, Nigeria Climate Graph (Altitude: 39m)

14
Market Study and Project Scouting Nigeria
south of Nigeria measure twelve nautical miles
out to the sea with an exclusive economic zone
measuring 200 nautical miles offshore.
Demography
With a population, which is currently estimated
at 182 million people, Nigeria is home to over 250
different ethnic groups, speaking more than 500
different distinct dialects and languages. Nigeria
is Africa’s most populous country (one in every six
Africans is a Nigerian), the eight most populous
country in the world and its population is growing
with an annual rate of 2,55% (CIA, 2012). The 182
million Nigerians are spread across the states in an
uneven manner with the states recording varying
population densities. Population is less dense in
the semi-arid North Eastern and North Western
states while in the southern states, population
densities are usually high. Nigeria’s population is
estimated to grow over the next 20 years to reach a
population size of 310 million by 2035.
Being the commercial capital of Nigeria, Lagos is
the biggest and most densely populated city in
Nigeria, containing 7.000 inhabitants per square
kilometre. Lagos is estimated to have a population
of approximately 25 million people.
The Nigerian population consists of Muslims (50%),
Christians (40%), and traditional religions (10%)
(CIA, 2015).
Figure 1.4 Climate chart
for Kano (Source: http://
www.lagos.climatemps.
com/)
Precipitation (mm)Max Temp (°C)Wet Days (>0,1mm)Average Wind Speed (Beaufort)Daylegth (Hours)
Min Temp (°C)Average Temp (°C)Average Sunlight Hours / DayDays with FrostRealtive Humidity (%)
Kano, Nigeria Climate Graph (Altitude: 473m)
40
35
30
25
20
15
10
5
0
-5
350
300
250
200
150
100
50
0 Rela
tive
Hu
mid
ity
/ Pr
ecip
itat
ion
Tem
pera
ture
s /
Wet
Day
s /
Sun
light
/ D
aylig
ht /
Win
d Sp
eed
/ Fr
ost
Jan May SepFeb Jun OctMar Jul NovApr Aug Dec
173.8
228.0
103.1
10.2
30
21.2
24.4
28.7
31.3 30.9
28.2
26.225.5
26.627.3
24.6
13.9
16.6
20.321.421.4
23.1
24.824.1
20.4
15.3
13.2
11.5 11.7 12.0 12.4 12.7 12.7 12.5 12.2 11.8 11.6 11.4
9.29.59.5
7.6
6.0
7.58.48.8
8.18.68.38.9
0
0.0 0.0 0.00.3 1.6 11.6
49.6
118.2
0 0 0 00 0 00 0 0 0
2
8
11
17
14
20.5
1416
32
57
68
59
43
33
14111313
1
12.8
21.2 21.60
33
37 37
34
31
29
31
3433
31
38
21

15
Chapter 1 Nigeria country profile
Political situation
After experiencing several military coups and a
very bloody civil war in which an estimated two
million Nigerians were killed, Nigeria returned to
democratic governance in 1999. Nigeria maintains a
presidential democratic style of governance, which
is akin to the American system with a bicameral
legislature.
The political party system has gone through various
phases, with the last 16 years being dominated by
the People’s Democratic Party (PDP). At the 2015
general elections, the All Progressives Congress
(APC), a fusion of four main opposition parties,
contested against and defeated the governing party
in what was deemed the most free and fair election
in Nigeria’s history. The 2015 general elections
saw the emergence of former military ruler,
Muhammadu Buhari of the APC as the president of
Nigeria, making him the first opposition candidate
to win a presidential election in Nigeria. Buhari
had previously led Nigeria (from January 1984 to
August 1985) as head of a military Junta which
successfully staged a coup against a democratically
elected government. The incumbent during the
2015 general elections, Goodluck Jonathan of the
PDP was president of Nigeria since 2010, following
the death of then President Umar Yar’ Adua, whom
he was Vice President to.
Since the return of democratic rule, Nigeria has
witnessed the formation of several degrees of
armed groups, mostly based along ethnic or
Figure 1.5 Climate chart
for Minna (Source: http://
www.lagos.climatemps.
com/)
Minna, Nigeria Climate Graph (Altitude: 256m)
40
35
30
25
20
15
10
5
0
300
250
200
150
100
50
0 Rela
tive
Hu
mid
ity
/ Pr
ecip
itat
ion
Tem
pera
ture
s /
Wet
Day
s /
Sun
light
/ D
aylig
ht /
Win
d Sp
eed
/ Fr
ost
Jan May SepFeb Jun OctMar Jul NovApr Aug Dec
239.9
100.0
0.51.2
271.9
206.6
174.5135.9
60.9
11.9
0.5 5.4
34.7
36.8 37.1
35.7
32.8
30.7
29.1 28.830
32
34.4
26.926.3
24.925.225.126.0
27.3
28.9
30.229.3
27.6
20.4
22.3
24.5 24.823.7
22.3 22.1 21.8 21.62121
17
1213
12.712.612.312.111.811.6
8.4 8.37.8 7.4 7.76.8
4.63.6
5.4
8.9
39
70737266
5
1
44
58
30
1
2124
0 0 00 0 00 0 00 0 01.4
28
0.12
9.0
12.6 12.4 12.2 11.9 11.7 11.6
21.5
19.4 19.3
34.7
26.70
Precipitation (mm)Max Temp (°C)Wet Days (>0,1mm)Days with FrostRealtive Humidity (%)
Min Temp (°C)Average Temp (°C)Average Sunlight Hours / DayDaylegth (Hours)
63
98.2

16
Market Study and Project Scouting Nigeria
religious sentiments or a combination of both.
Groups such as the Odua Peoples’ Congress (OPC)
in the south west and the Bakassi Boys in the
south east are ethnicity focused vigilante groups
who have granted themselves a right to bear arms
over the last 16 years. Other armed and more
militant groups that have sprung up in Nigeria
during the last 16 years are the Movement for the
Emancipation of the Niger-Delta (MEND) in the
far-south and the infamous Boko Haram mainly
in the north east. Furthermore, pockets of civil
unrest spring up from time to time, such as in the
Northern part of the country in which southerners
and Christians are targeted, often due to religious
differences, or in the south-east states with
increasing sentiments of perceived marginalisation
by the federal government.
Safety and security situation in Nigeria
The safety and security situation for foreigners in
Nigeria continues to be risky and for certain areas
dangerous. The Foreign and Commonwealth Office
(FCO) of the UK government2 advises against all
travel to: Borno State, Yobe State, Adamawa State,
Bauchi State, Gombe State, Kano city, riverine areas
of Delta, Bayelsa, Rivers, Akwa Ibom and Cross River
States and within 20 km of the border with Niger in
Zamfara State.
The FCO advise against all but essential travel
to: Kano State, Kaduna State, Jigawa State, Katsina
State, Kogi State, Abia State, Jos City in Plateau
State, within 20 km of the border with Niger in
Sokoto and Kebbi States, Riyom and Barkin Ladi
Local Government Areas of Plateau State and Non-
riverine areas of Delta, Bayelsa and Rivers State.
Before traveling to Nigeria one should consult the
FCO or other websites on travel restrictions.
2) https://www.gov.uk/foreign-travel-advice/nigeria, 1 May 2016
The Nigerian economy
Nigeria is a well-endowed country. The country has
a healthy GDP despite the poor infrastructural base
in all key sectors (power, transportation, housing
etc.). According to Trading Economics3:
“The Nigerian economy grew by 2,84 percent year-
on-year in the third quarter of 2015, following a 2,35
percent expansion reported in the previous period.
The oil sector, accounting for nearly 11 percent of
total production rebounded while services sector
growth slowed. Quarter-on-quarter, GDP increased
by 9,19 percent, following a 2,57 percent growth
in the previous period. GDP Annual Growth Rate
in Nigeria averaged 5,91 percent from 2005 until
2015, reaching an all-time high of 8,60 percent in
the fourth quarter of 2010 and a record low of 2,35
percent in the second quarter of 2015. GDP Annual
Growth Rate in Nigeria as reported by CBN“.
In 2013, the Nigerian GDP was revised by the
government. To re-base the Nigerian economy, the
National Bureau of Statistics used 2010 as the base
year. These new figures gave weighted importance
to rapid growing sectors such as telecom and
film-making that have emerged since 1990. Data
collection has improved since the 1990’s, leading
to more accurate statistics. As an example the old
GDP figures were calculated based on outputs only,
while the new figures were calculated based on
surveys carried out on spending and income.
The estimate for Nigeria’s GDP in 2013 was
reviewed upward from 42,4 trillion Naira to
80,2 trillion Naira (€ 351 billion); (NESP; 2015)
an increase of 89%. The World Bank, following
different estimations, estimated the Nigerian GDP
in 2014 at 111,9 trillion Naira (€ 491 billion)4. The
annual growth rate of the GDP was estimated at
6,3%. Projections from the World Bank for GDP
growth show that Nigeria’s economy is expected
3) http://www.tradingeconomics.com/nigeria/gdp-growth-annual
4) http://databank.worldbank.org/data/reports.aspx?source=2&-
country=NGA&series=&period=
17
Chapter 1 Nigeria country profile
to decelerate from the 6,3% growth in 2014. The
estimated GDP growth in 2015 decreased to 3,3%,
after which the GDP is projected to grow at an
estimate growth rate of approximately 5% from
2015 to 2018 annually.
The deceleration of the economy is experienced
throughout sub-Saharan Africa, but most
pronounced among oil exporting countries. Nigeria
is among the countries hit hard by the recent crash
of oil prices. The slowdown of economic growth
is associated with fiscal deficits and devaluating
currency. The Naira has lost over 75% of its value
since mid-2014. The current fall in the price of crude
oil forced the new government to announce budget
cuts, amongst them, removal of a fuel subsidy.
Simultaneously, the government is faced with a
looming unemployment crisis.
Nevertheless, the non-oil industry has driven
the Nigerian economy, with average growth
of about 10% in 2012, compared to the -0,35%
for the oil and gas industry (IMF, Oct 2013). The
growth of the non-oil industry was mainly driven
by high consumer demand. The top five drivers
of the economy, accounting for over 70% of total
GDP, are agriculture, mining, information and
communications, and manufacturing.
From these figures it shows that the Nigeria
economy has grown to be one of the largest
economies in Africa. The Nigerian economy
contributes about 55% of the GDP of West Africa,
making it a regional economic power house. As an
example, the GDP of Lagos is bigger than that of
Ghana.
Nigeria has a huge potential in various sectors, not
least the agricultural sector. The complete value
chain, ‘from farm to food’ is largely untapped. For
instance, less than 50% of the arable land in Nigeria
is cultivated. The low agricultural productivity is
caused by a lack of modernisation in the sector,
therefore the agricultural sector has a huge
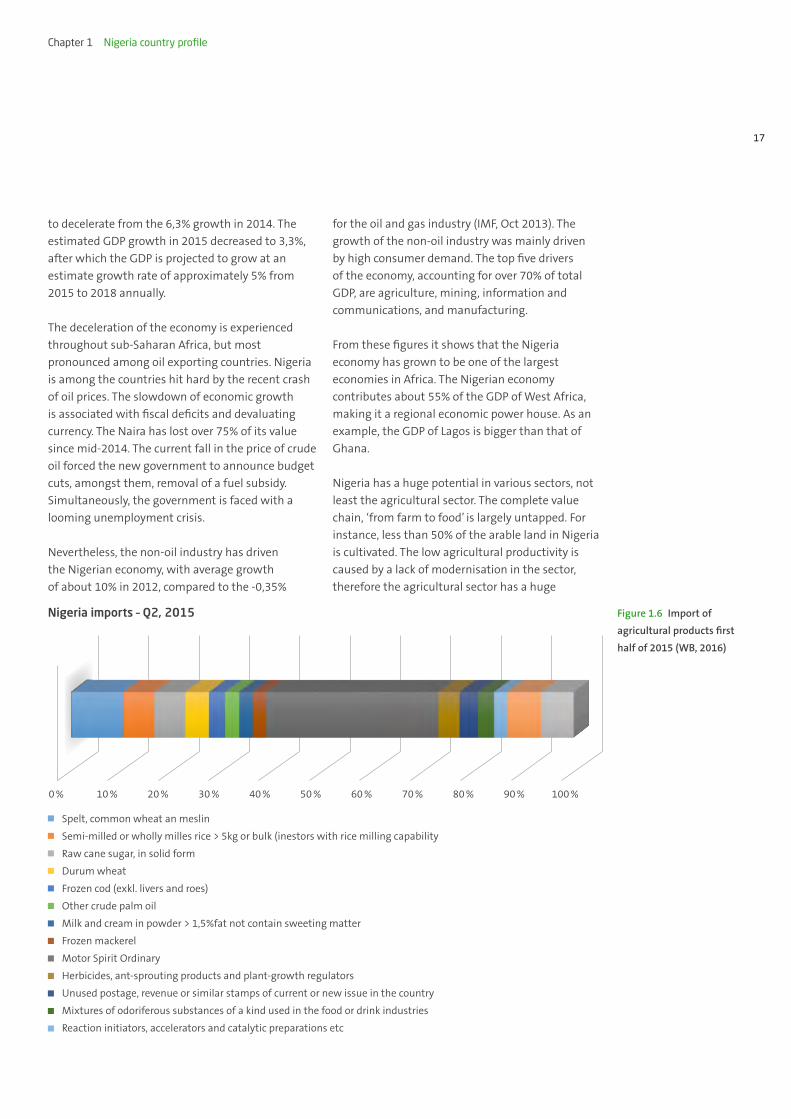
Figure 1.6 Import of
agricultural products first
half of 2015 (WB, 2016)
Nigeria imports – Q2, 2015
0 % 100 %90 %80 %70 %60 %50 %40 %30 %20 %10 %
Spelt, common wheat an meslin
Semi-milled or wholly milles rice > 5kg or bulk (inestors with rice milling capability
Raw cane sugar, in solid form
Durum wheat
Frozen cod (exkl. livers and roes)
Other crude palm oil
Milk and cream in powder > 1,5%fat not contain sweeting matter
Frozen mackerel
Motor Spirit Ordinary
Herbicides, ant-sprouting products and plant-growth regulators
Unused postage, revenue or similar stamps of current or new issue in the country
Mixtures of odoriferous substances of a kind used in the food or drink industries
Reaction initiators, accelerators and catalytic preparations etc

18
Market Study and Project Scouting Nigeria
potential for upscaling its volume of annually
produced goods. The country has approximately
70 million hectares of farmland mostly located in
the Middle Belt. The areas in the sub-Sahel zone are
currently largely uncultivated mainly due to lack of
irrigation capacity. Other opportunities in the value
chain of the agricultural sector are found in the
food processing sub-sector. For example, Nigeria
spends an estimated NGN 1 trillion (approximately
€ 4,39 billion) per annum for the importation of
rice, wheat, sugar and fish. The agricultural sector
accounts for about 20% of GDP and employs
about 70% of the work force in Nigeria. Figure 1.6
shows Nigeria’s total imports for Q2 of 2015 which
was valued at 400,9 billion Naira (€ 1,75 billion).
Agricultural products, process inputs and final
products constitute 31% at a total of 124,28 billion
Naira (approximately € 545 million) (NBS, 2015) of
the total amount of imports for that period.
Although the economy of Nigeria is growing
according to the new statistics, the economy still
suffers from the lack of diversity. The Nigerian
economy has been largely built on crude oil since
the first discovery of commercial quantities in
1958. In the mid 1980’s, the manufacturing
industry began its collapse, leading to the halt of
car assembly and tyre industry. The manufacturing
industry has not recovered properly yet, partly due
to inadequate electricity supply. The inadequate
electricity supply causes manufacturers having to
rely on diesel generators for their electricity needs.
According to the World Bank report ”Doing Business
in Nigeria 2015” the biggest hindrance to business
in Nigeria is electricity constraints.
Wealth and poverty distribution
Nigeria has been variously described as a country
with strong growth potential. Reports indicate
that the Nigerian economy has been growing at
an average of 6% per year consistently for over
seven years. Yet despite this growth in the gross
domestic product (GDP), unemployment, poverty
and inequality have continued to expand (UNDP,
2010; FGN, 2010). The National Bureau of Statistics
(NBS) reported that the percentage of people living
in poverty increased from 27,2% in 1980 to 46,3% in
1985, dropped to 42,7% in 1992 and then increased
to 65% in 1996. By 2010, the poverty level was at
69%, indicating that about 112,47 million Nigerians
are living below the poverty line (ActionAid Nigeria,
2015). Nigeria is therefore aptly described as a
paradox of poverty in the midst of plenty.5
Poverty in Nigeria also has a regional dimension.
Statistics show that people living in the northern
part of the country are more likely to live in poverty
than those living in the rest of the country. More
specifically, NBS reports that in 2004 the poverty
incidence was highest in the North-East zone
(67,3%) and lowest in the South-East zone (34,2%),
with similar figures for 2010. The three geo-political
zones in the North consistently showed higher
levels of poverty than those in the South. Similarly,
both the 2004 as well as the 2010 figures show that
the three northern zones also have higher absolute
poverty rates. This disparity may be attributed
to high levels of illiteracy, low productivity, poor
infrastructure, and unemployment. Poverty in the
South-South zone resulted from several factors,
including social instability, poor local governance,
competition for economic resources and
environmental degradation (NBS, 2010). 4
The Gross National Income (GNI) per capita in
Nigeria is about $ 3.000, meaning less than $ 10
per day. However, a staggering 54% of the Nigerians
live beneath the international poverty line of
$ 1,25 a day.6
Business climate
Nigeria has committed itself to become an
investment friendly country. In order to invest
in Nigeria, there are specific ownership licences
and restrictions which are required in sectors like
Mining, Telecommunications, Aviation, Oil and
5) ActionAid Nigeria, “Corruption and Poverty in Nigeria”, 2015
6) World DataBank: http://databank.worldbank.org/data/reports.
aspx?source=2&country=NGA&series=&period
19
Chapter 1 Nigeria country profile
Gas, Banking, Insurance, Energy, etc. Full or partial
ownership of businesses by foreign investors is
allowed in Nigeria. Foreign investors can import
capital and are allowed to freely repatriate both
the returns and capital once exchange control
requirements have been met.
Nevertheless, doing business in Nigeria is often
a tricky affair. Nigeria has suffered from severe
political unrest, persistent ethnic tensions and an
opaque legal and regulatory environment. The low
oil prices undermine Nigeria’s economic resilience,
reducing fiscal space and putting downward
pressure on the Naira value, although overall debt
levels are minimal. The new government received
a sizeable mandate in the 2015 elections, but has
a difficult set of tasks and very limited financial
resources. Capital outflows have increased foreign
exchange risks. As a lower middle income country,
with a Gross National Income per capita of $ 2.950
(WB, 2016), Nigeria is ranked 169th out of 188
countries surveyed by the World Bank in its annual
business report for 2016 in terms of ease of doing
business. The report which measures indicators
important to local entrepreneurs indicates that
whilst regulatory reforms are progressing, Nigeria’s
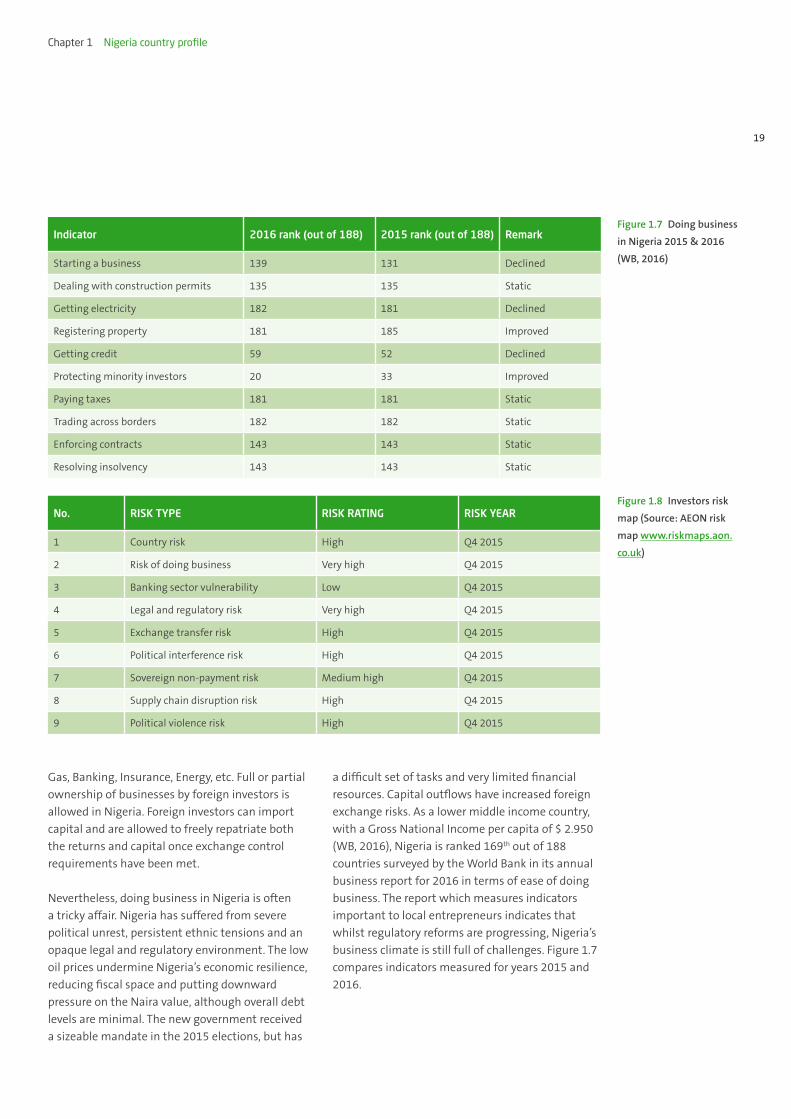
business climate is still full of challenges. Figure 1.7
compares indicators measured for years 2015 and
2016.
Figure 1.7 Doing business
in Nigeria 2015 & 2016
(WB, 2016)
Figure 1.8 Investors risk
map (Source: AEON risk
map www.riskmaps.aon.
co.uk)
Indicator 2016 rank (out of 188) 2015 rank (out of 188) Remark
Starting a business 139 131 Declined
Dealing with construction permits 135 135 Static
Getting electricity 182 181 Declined
Registering property 181 185 Improved
Getting credit 59 52 Declined
Protecting minority investors 20 33 Improved
Paying taxes 181 181 Static
Trading across borders 182 182 Static
Enforcing contracts 143 143 Static
Resolving insolvency 143 143 Static
No. RISK TYPE RISK RATING RISK YEAR
1 Country risk High Q4 2015
2 Risk of doing business Very high Q4 2015
3 Banking sector vulnerability Low Q4 2015
4 Legal and regulatory risk Very high Q4 2015
5 Exchange transfer risk High Q4 2015
6 Political interference risk High Q4 2015
7 Sovereign non-payment risk Medium high Q4 2015
8 Supply chain disruption risk High Q4 2015
9 Political violence risk High Q4 2015
20
Market Study and Project Scouting Nigeria
While there have been improvements in two
aspects which are critical for new businesses
and investors namely registering property, and
protecting minority investors, the conditions for
expanding or starting a new business in Nigeria
have deteriorated when compared to the other
188 countries surveyed in the report. In addition,
getting access to reliable and affordable electricity
supply and obtaining credit is challenging. This can
be attributed to the fact that Nigeria’s electricity
sector is still going through a reform process and
the shortage in electricity generation capacity in
combination with the bad state of transmission and
distribution infrastructure has not been solved. The
record low oil prices are severely undermining the
state budget.
Endemic corruption makes private-sector activities
challenging and security concerns leave several
geographic areas off limits to foreign investors.
The government is fighting an Islamist militant
insurgency in the north-east (Boko Haram) and
terrorist attacks have increased in severity and
frequency, undermining the security situation
domestically and in neighbouring countries.
Although much of Nigeria’s territory is unaffected
by these attacks, the government’s focus on these
developments and greater defence spending have
inevitably weakened its policy effectiveness in other
areas. The poor infrastructure, particularly in the
power sector, and sporadic fuel shortages are a
particular constraint on businesses and heighten
the risk of supply chain disruptions in all sectors.
Currently (2016) interest rates of the Central Bank
of Nigeria (CBN), stand at 11% per annum whilst
commercial banks offer loans in the range of
23–29%. It must be noted that the business climate
throughout Nigeria is by no means consistent.
According to the World Bank sub-national report on
doing business in Nigeria 2014, there are various
state-specific regulatory hurdles to doing business
in Nigeria. These variations can be attributed
to differences in state laws as well as irregular
implementation of federal legislation nationwide.
Figure 1.8 shows the most important risks for
investors in Nigeria.
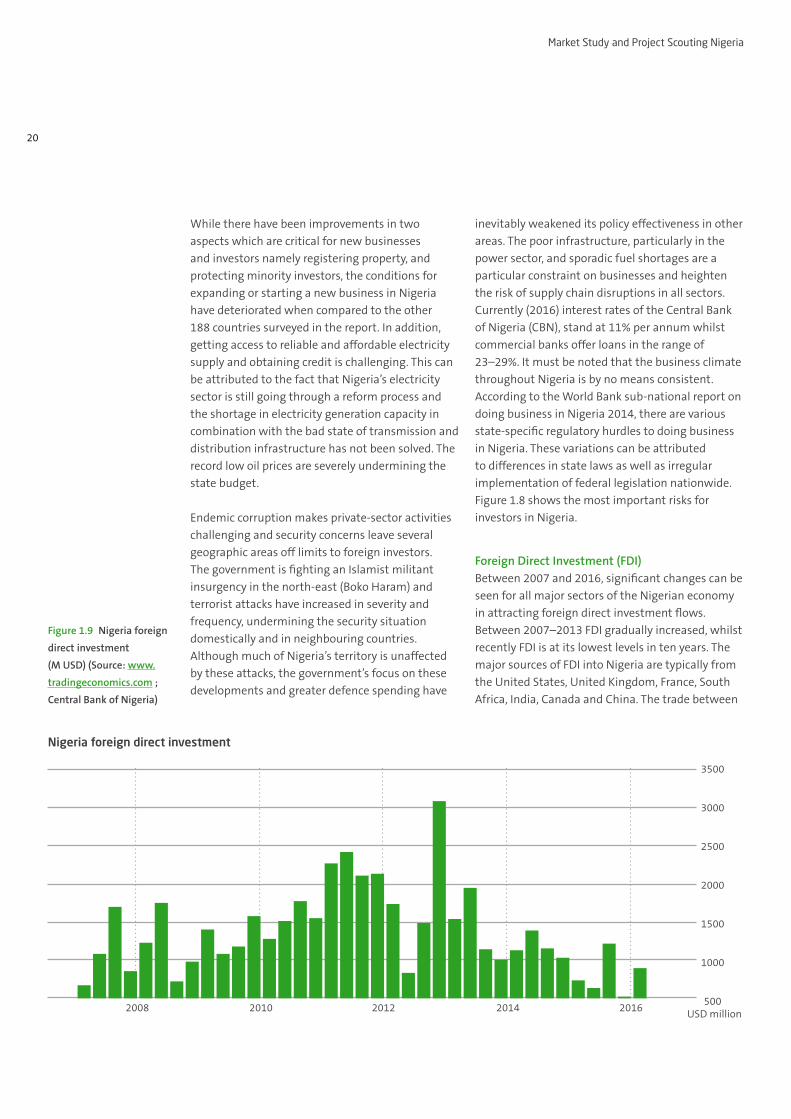
Foreign Direct Investment (FDI)Between 2007 and 2016, significant changes can be
seen for all major sectors of the Nigerian economy
in attracting foreign direct investment flows.
Between 2007–2013 FDI gradually increased, whilst
recently FDI is at its lowest levels in ten years. The
major sources of FDI into Nigeria are typically from
the United States, United Kingdom, France, South
Africa, India, Canada and China. The trade between
Figure 1.9 Nigeria foreign
direct investment
(M USD) (Source: www.
tradingeconomics.com ;
Central Bank of Nigeria)
Nigeria foreign direct investment
3500
3000
2500
2000
1500
1000
500USD million
2008 2010 2012 2014 2016

21
Chapter 1 Nigeria country profile
India and Nigeria has grown in recent years
estimated to be about $ 20 billion in 2013. China
has contributed mostly in the construction sector
and in capital projects.
Energy The lack of access to reliable and affordable energy
is an important business risk in Nigeria. This is the
case for electricity (grid-connected) but also for
energy from fossil fuels (primarily diesel and gas)
due to reoccurring unavailability of these fuels.
The electricity sector has undergone major reforms
in recent years and as a result almost the entire
value chain of the electricity sector, covering
generation to distribution is fully privatised.
The government owned electric utility, National
Electric Power Authority, was unbundled into
16 distribution companies (DisCos) and seven
generation companies (GenCos) owned and
operated privately, as well as one Transmission
Company (TCN) owned by the Federal Government
of Nigeria (FGN). Currently, it is estimated that
the installed capacity on the Nigerian grid is
approximately 13 GW, but it only has a generating
capacity of 6,8 GW, due to the poor state of the
grid infrastructure and poor maintenance of power
stations (GIZ, 2015).
Within the last two years, major financial support
agreements have been signed between the Central
Bank of Nigeria (CBN), Deposit Money Banks
(DMBs), and the regulator, the National Electricity
Regulatory Commission (NERC). The idea behind
these agreements is to offer financial support to
power generating and distributing companies,
through the Nigeria Electricity Market Stabilization
Facility (NEMSF), from which € 934 million will
be disbursed (see chapter 6, page 94 for more
information on NEMSF).
Employment and labour forceIn 2013 the National Population Commission
(NPC) and the Nigeria Bureau of Statistics (NBS),
published an unemployment rate of 24%. The
Nigerian labour force was reclassified in 2014,
totalling the labour force at 73 million people,
Figure 1.10 Socio-
economic indicators
and age distribution.
(Source: UNESCO
www.uis.unesco.org)
Total population (in thousands) 172.817
Annual population growth (%) 2,7
Population 15–24 years (in thousands) 32.803
Rural population (% of total population) 53
Total fertility rate (births per women) 5.7
Infant mortality rate (per 1.000 live births) 72
Life expectancy at birth (years) 52
Prevalence of HIV (% of population aged 15–49 years) 3,2
Poverty headcount ration at 2 PPP$ a day (% of total population) 76,5
GDP per capita – PPP$ 5.911
Annual GDP growth (%) 6,3
Total debt service (% of GNI) 0,1
GDP in billions – PPP$ 1.049
Total population by age group, 2014 (in thousands)
Population aged 14 years
and younger represents
44% of the total
80+
75 to 79
70 to 74
65 to 69
60 to 64
55 to 59
50 to 54
45 to 49
40 to 44
35 to 39
30 to 34
25 to 29
15 to 19
10 to 14
5 to 9
0 to 4|0
|30.000
|20.000
|10.000
22
Market Study and Project Scouting Nigeria
where unemployment rate stood at 6,4% and labour
underutilization rate was 17,9%. Nigeria’s National
minimum wage, valid for public and private actors
in all sectors of the economy, currently stands at
18,000 Naira a month (USD 90)7.
43,3% of the youth (15–24 years) is either
unemployed or underemployed. Unemployment
in Nigeria is largely attributed to the phenomena
of jobless growth, increased number of school
graduates with no matching job opportunities, a
freeze in employment in many public and private
sector institutions and continued job losses in the
manufacturing and oil sectors.
Nigeria developed the National Action Plan on
Employment Creation 2009–2020. The action
plan highlights the major activities that need
to be undertaken in the eleven key sectors of
the Nigerian economy to meet unemployment
challenges. Furthermore, with ILO support, the
Federal Government of Nigeria is reviewing the
National Employment Policy in order to address
the contemporary issues in employment creation
and the policy aims to harmonise the different
strategies of the government in addressing
unemployment challenges (www.ilo.org, July 2016).
Business ownership modelsThere are several business models on which
Nigerian businesses can be based. The most
common models used are:
» Sole proprietorship
» Partnership
Sole proprietorship This generally refers to a form of business ran by
an individual, where there is no legal distinction
between the business and the owner. A foreigner
is allowed to engage in lawful business activity
7) Throughout the report, the exchange rate of May 2016 is used.
However, due to the volatility of the Naira, the values in USD or
EUR may be inaccurate
as a sole proprietorship, but only when he/she
obtains Nigerian citizenship or residency status for
immigration purposes. In addition, local partners
are required for foreigners to start a business in
Nigeria.
The way to obtain residency in Nigeria is by
acquiring a CERPAC (Combined Expatriate Residence
Permit and Aliens Card). This document is a
combined residency and work permit. Although the
process involves a lot of paperwork, it should not
be too troublesome for expats. An important notice
is that the CERPAC is tied to a specific job. If one
decides to change jobs, he/she needs to re-apply.
Partnership A form of business where two or more persons
come together to own a business and they are
personally responsible for the debts and other
obligations of the business. Foreign participation is
possible when the investors obtain citizenship or
residency status for immigration purposes and a
work permit.
CompanyAny company with a foreign shareholding must
possess a minimum share capital of 10 million
Naira (about $ 50.000), in order to secure a business
permit from the Nigerian Investment Promotion
Council (NIPC). In some more regulated sectors like
aviation, banking and insurance, the share capital
may be higher. For example, in the banking sector
the share capital required is 25 billion Naira (€ 109
million).
Free Trade Zones (FTZs) and Export Processing Zones (EPZs) As part of its efforts to drive growth in the
industrial sector, the Federal Government of Nigeria
established Free Trade Zones (FTZ) and Export
Processing Zones (EPZ) in various locations around
the country. Both zones are clearly delineated
industrial estates within a nation’s customs
and trade regime. They are normally set up for
manufacturing concerns producing mainly for the
export market. The Nigerian trade zones, designed

23
Chapter 1 Nigeria country profile
to insulate the industrial sector from the effects of
external risks such as blackouts from the national
grid, would benefit from the use of common
infrastructure facilities such as power generation
plants, and logistics hubs among other things. The
majority of the manufacturing clusters are located
in the southern parts of the country, due to close
proximity to the seaports on the Atlantic Ocean.
Figure 1.11 shows the geographical location of the
main zones. A full list of FTZs is provided in Annex B.
In total 31 Free Trade Zones are to be established.
14 of them are currently operational, while the
other 17 are under construction. The most notable
operational FTZs are: Calabar Free Zone, Kano
Free Zone, Lekki Free Zone, Tinapa Free Zone and
Tourism Resort, Onne Oil and Gas Export Free Zone,
Ogun Free Zone. Most manufacturing activity is
concentrated in three industrial clusters, two of
which are located in the south:
» Lagos-Ota-Agbara industrial cluster
» Port Harcourt-Aba industrial zone
» Kano-Kaduna axis
Figure 1.11 Geographical
distribution of key FTZs
and EPZs in Nigeria. Source:
NESP, 2014
Kano FTZ
Calabar FTZ
Snake Island FTZ
Lekki FTZ
Olokola FTZ
Lekki EPZ
ABUJA
Maigatri BFZ Banki BFZ
Onne Oil & Gas FZ

24
Market Study and Project Scouting Nigeria
Foreign investors are allowed to set up businesses
directly in any of the FTZs, and it’s not necessary
to incorporate a company in the customs territory.
Also fully registered companies are allowed to
register separately and carry out operations in an
FTZ. Such companies though will be required to add
FZE as a suffix to the end of its name. A company
that has a Free Trade Zone entity, benefits 100%
capital and profit repatriation. It is also exempted
from all Federal, State, and Local Government taxes,
levies, and rates, alongside waivers on customs and
import duties.
Fiscal incentives and exchange control
» The Federal Government of Nigeria targets to
have a power generation capacity of more than
40 GW by 2020, with an energy mix that will
consist of 69% thermal generation, 17% hydro,
10% coal; and about 4% renewables8. This aspi-
ration of 40 GW should move Nigeria to a much
more stable socio-economic position. However,
the enormous capital required to achieve this
target cannot be funded by the government
alone, the private sector will have to participate.
Therefore, a number of investment incentives
are provided by FGN, for the power sector. They
include:
» 0% duty on power generation equipment;
» 20% capital allowance (tax allowance on assets)
for five years;
» Tax holiday for manufacturing activities (up to
5 years’ tax holiday for renewables).
In addition, companies active in independent power
generation utilizing gas, coal and renewable energy
sources, can apply for a ‘pioneer status’ at the
Nigerian Investment Promotion Commission. The
pioneer status can provide companies additional
tax holidays (www.nipc.gov.ng).
8) www.nipc.gov.ng
Exchange transactions are regulated by the
Foreign Exchange (Monitoring and Miscellaneous
Provisions) Act 1995. The Naira is used for the day
to day transactions. Cross border transactions are
permitted, with some level of restrictions to curb
money laundering, prevent the funding of terrorist
groups and protect the Naira.
Import of capitalInvestments as share of capital or loan, are
permitted in foreign currency, however information
on such transaction must be submitted to CBN
within 24 hours, so the investor can be issued a
Certificate of Capital Importation (CCI). Once the
CCI has been obtained it allows for the repatriation
of the following:
» Royalties
» Dividends
» Rent
» Profits (net of taxes) that can be attributed to the
investment
» Payment of interest and capital on foreign loans
» Remittance of proceeds (net of taxes) and any
other obligation to the investment.
Dealers of foreign currencies, who are duly
authorised, must inform the CBN of any cash
transfer to or from a foreign country of any amount
that exceeds $ 10.000. To remit dividend out of
Nigeria, a tax clearance certificate is also required.
Financial servicesThe CBN is the independent government agency
vested with the duty of policy formulation and
implementation, regarding monetary and credit
policies, trade, exchange. It also regulates the
foreign exchange market, as well as formulation of
currency policies. Commercial Banks in Nigeria carry
out foreign exchange transaction, but are controlled
by the CBN based on foreign exchange regulations.

25
Chapter 1 Nigeria country profile
The Legal System
The Constitution of Nigeria is the supreme law of
the country. There are four distinct legal systems
in Nigeria:
» English law which is derived from its colonial past
with Britain;
» Common law, a development of its post-colonial
independence;
» Customary law which is derived from indig-
enous traditional norms and practice, including
the dispute resolution meetings of pre-colonial
Yorubaland secret societies and the Èkpè and
Okónkò of Igboland and Ibibioland;
» Sharia (Islamic) law, used only in the predomi-
nantly Muslim north of the country. Civil sharia
law has always been enshrined in the various
Nigerian constitutions since independence. The
most recent constitution came into effect in
1999. With the return of the country to demo-
cratic rule in 1999, some of the predominantly
Muslim northern states have instituted full sharia
law (criminal and civil). Full sharia law was first
passed into law in Zamfarain late 1999 and the
law came into effect in January 2000. Since then
eleven other states have followed suit. These
states are Kano, Katsina, Niger, Bauchi, Borno,
Kaduna, Gombe, Sokoto, Jigawa, Yobe, and Kebbi.
The country has a judicial branch, the highest
court of which is the Supreme Court of Nigeria.
The Nigerian constitution recognizes courts as
either Federal or State courts. A primary difference
between both is that the President appoints
Justices/Judges to federal courts, while State
Governors appoint Judges to state courts. All
appointments (federal or state) are based on the
recommendations of the National Judicial Council.
The Federal courts are: The Supreme Court, the
Court of Appeal and the Federal High Court. The
State courts include: The High Court of a State,
the Customary Court of Appeal of a State and
the Sharia Court of Appeal of a State. Each of
the 36 states is constitutionally allowed to have
all of these courts. However, the predominantly
Muslim northern states tend to have Sharia courts
rather than Customary courts. The predominantly
Christian southern states tend to have Customary
courts and not Sharia courts.

26
Market Study and Project Scouting Nigeria

27
The energy situation in Nigeria is critical and is a key
constraint for economic development. About 55% of
the population has no access to electricity (Nigeria
Power Baseline Report9) and out of the total energy
consumption, traditional biomass (firewood and
charcoal) accounts for 86%. Population growth and
economic development contribute to an increased
need for electricity. The gap between production
capacity and demand in combination with poorly
maintained generation installations and a poor
9) nesistats.org
national and regional electricity grid, results in
unstable and unreliable electricity supply for both
households and companies. Firms from around
Nigeria report average power outages of 8 hours
per day. As a consequence, many companies and
households rely on diesel generators for their
electricity, with larger companies relying on gas or
diesel for both electricity and power. However, also
gas and diesel supply has proven unreliable.
CHAPTER 2 ENERGY SITUATION IN NIGERIA
Sector Coal Oil products Natural gas Bios and waste Electricity Total*
Industry 27 405 Declined 6.997 335 9.801
Transport 0 8.227 Static 0 0 8.227
Residential 0 529 Declined 91.227 1.157 92.914
Other 0 2.146 Improved 2.385 527 5.058
* Totals may not add up due to
rounding
Annex I provide a glossary of the
terms used in above figure
Total energy consumption in Nigeria in 2013 (in ktoe)
Figure 2.1 Total energy
consumption in Nigeria in
2013 (in ktoe). (Source: IEA
statistics www.iea.org)
Other 2%
Transport 0%
Industry 6%
Electricity 2%Natural gas 2%
Oil products 10%
Biofuel and waste (PERCENTAGE)
Residential 78%
28
Market Study and Project Scouting Nigeria
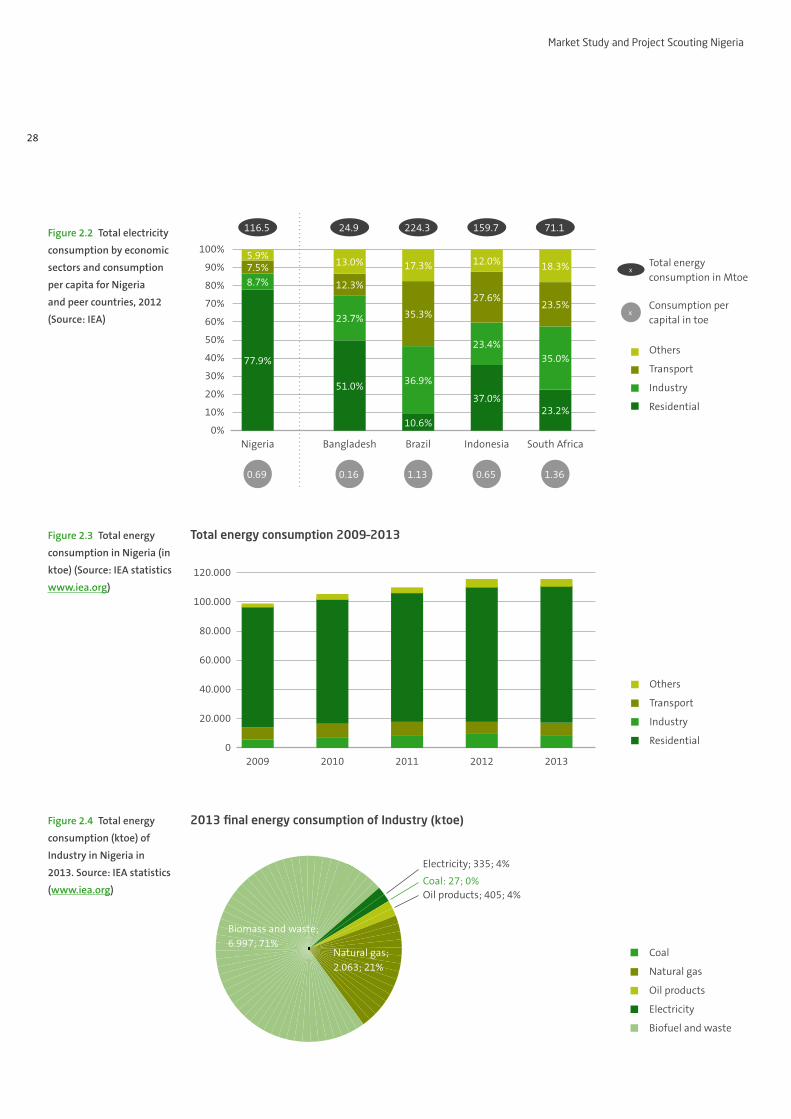
Figure 2.2 Total electricity
consumption by economic
sectors and consumption
per capita for Nigeria
and peer countries, 2012
(Source: IEA)
Figure 2.4 Total energy
consumption (ktoe) of
Industry in Nigeria in
2013. Source: IEA statistics
(www.iea.org)
Figure 2.3 Total energy
consumption in Nigeria (in
ktoe) (Source: IEA statistics
www.iea.org)
100%
90%
80%
70%
60%
50%
40%
30%
20%
10%
0%
77.9%
8.7%7.5%5.9%
Nigeria
0.69
116.5
51.0%
23.7%
12.3%
13.0%
24.9
Bangladesh
0.16
37.0%
23.4%
27.6%
12.0%
159.7
Indonesia
0.65
10.6%
36.9%
35.3%
17.3%
224.3
Brazil
1.13
23.2%
35.0%
23.5%
18.3%
71.1
South Africa
1.36
Total energy consumption in Mtoe
Consumption per capital in toe
x
x
Residential
Industry
Transport
Others
120.000
100.000
80.000
60.000
40.000
20.000
0
Total energy consumption 2009–2013
2009 2010 2011 2012 2013
Residential
Industry
Transport
Others
Electricity
Biofuel and waste
Oil products
Natural gas
Coal
2013 final energy consumption of Industry (ktoe)
Natural gas; 2.063; 21%
Biomass and waste; 6.997; 71%
Electricity; 335; 4%
Oil products; 405; 4%Coal: 27; 0%

29
Chapter 2 Energy situation in Nigeria
Energy consumption
The available data on electricity consumption
in Nigeria per sector reveals that – similar to
energy consumption in general – the residential
sector consumes most electricity (Figure 2.2 and
2.3). Figure 2.2 shows a comparison between the
electricity consumption in Nigeria and some other
countries. However, these figures do not account for
captive generation from decentralized diesel and
gas generators that are used in many industries,
which exceeds the available grid-connected
capacities. When taking this privately owned
generating capacity into account, the share of
industrial consumption is much larger.
As can be seen from Figure 2.4, of the total energy
consumed by Nigerian industries only 4% is from
grid-connected electricity. 96% is self-produced,
using either natural gas, oil products (usually diesel)
and biomass and waste (usually wood products
and agri-waste). This explains why the share of
electricity consumption of the industry sector is
relatively low for Nigeria in previous figures.
Figure 2.6 Projected Grid-
connected & Off-Grid
Electricity Demand
(Source: NESP, 2015b)
Figure 2.5 Grid-connected
electricity consumption
in Nigeria (Source: United
National Energy Statistics
Database1)
1) Unstats.un.org/unsd/
energy/edbase.htm
Grid + off-Grid demand. TWh
550
500
450
400
350
300
250
200
150
100
50
0
Off-Grid A: Backup
Grid
Off-Grid B: Full-time ≥ 1 MW
Off-Grid C: Full-time < 1 MW
Off-Grid D: No grid access
|
2010|
2035|
2033|
2030|
2028|
2025|
2023|
2020|
2018|
2015|
2013
20.000
18.000
16.000
14.000
12.000
10.000
8.000
6.000
4.000
2.000
0
1990
1990
1990
1990
1990
1990
1990
1990
1990
1990
1990
1990
1990
1990
1990
1990
1990
1990
1990
2010
Electricity Consumption (Million kWh)
Household
Industry
Other

30
Market Study and Project Scouting Nigeria
In Figure 2.5 the historical development of grid-
connected electricity consumption per sector is
presented. From this picture it shows that it is the
residential sector (households) where the increase
over the ten-year period is most pronounced. This
can be attributed to the rapid population growth
from 95 million in 1990 to almost 160 million
in 2010. As a result of a growing population and
economic growth, the on- and off-grid demand
for energy and electricity are expected to grow
significantly in the coming years. Figure 2.6 shows
the projected increases in demand for electricity.
Electricity and power generation
But there are positive signals. The current
government has started (but not yet completed)
very important and constructive additional reforms.
The successful implementation of these reforms
is key to provide an enabling environment for
private investment in generation capacity (and
other phases of the electricity value chain). New
regulation, which entered into force in February
2016, sets up dollar-denominated Feed-in-Tariffs
with 20 year PPAs and a 50% renewable energy
procurement goal for electricity distribution
companies (DisCos). Nigeria also has several hydro
projects under construction, which are equivalent
to nearly 5 GW. Late last year, a 450 MW greenfield
gas fired power plant called Azura-Edo raised € 745
million, providing a framework for project finance
for Independent Power Producers (IPPs) in Nigeria.
Electricity generationWithin the Nigerian electrical power landscape,
four basic power generation options are to be
differentiated. These are:
1. Grid-connected: the electricity generated is
evacuated on the TCN grid.
2. Embedded: electricity that is directly
evacuated through a distribution system
which is connected to a transmission network
operated by a System Operations Licensee.
3. Captive: the generation of off-grid electricity
that is entirely consumed by the generator
itself and has an installed capacity exceeding
1 MW, with no upper limit.
4. Off-grid (including mini-grids): small scale (up
to 1 MW) electricity generation to a single or
limited number of customers.
While licenses are needed to operate a generator
according to options 1 and 2, captive generation
only requires a permit by the NERC. In this report,
options 1 and 2 will be discussed in greater detail in
chapters 2 and 3, while captive generation (option
3) will be discussed in greater detail in chapter 4
and 5. Off-grid electricity will be briefly discussed in
this chapter.
Grid-connected and embedded electricity generationGrid-connected electricity generation refers to a
system of power generation evacuated through
the national grid to off-takers which may be the
Nigerian Bulk Electricity Trading company (NBET),
who through vesting contracts supplies the power
to Distribution Companies (DisCos); or directly
to eligible customers, as may be declared by the
Minister of Power.
In Nigeria, licenses for grid-connected power plants
(including GenCos) amount to 19.407 MW. Of
this licensed capacity, approximately 13.000 MW
is actually installed. The remainder 31% licensed
capacity is not yet built or is under development.
Of the 13.000 MW, approximately 6.000 MW is
available capacity and approximately 7.000 MW is
non-operational, due to poor grid infrastructure and
poor maintenance to the power stations. In 2015,
84% of the installed capacity came from gas and
18% from hydro.
Table 2.1 shows the historical grid-connected
energy supply in Nigeria. This table shows an
overall growing trend in the generation of energy,
but a decline over the last year in per capita energy
supply. Because of issues such as unavailability
of gas, breakdowns, water shortages, and grid

31
Chapter 2 Energy situation in Nigeria
constraints only between 3.000 and 4.500 MW
are actually being generated. Up to 2.700 MW is
regularly lost due to gas shortage, another 500 MW
is often lost due to water shortages, and some
100 MWs are lost due to line constraints.
There are currently two main types of grid-
connected power plants operating in Nigeria:
(1) hydro-electric and (2) thermal fossil fuel power
plants.
The power plants in Nigeria can be classified, based
on ownership, as either:
» Owned by the Niger Delta Power Holding
Company (NDPHC). The Federal Government
incorporated NDPHC as a limited liability
company to serve as the legal vehicle to hold the
National Integrated Power Project (NIPP) assets
using private sector-orientated best business
practices. The National Integrated Power Project
(NIPP) was conceived in 2004 as a fast-track
government funded initiative to stabilize Nigeria’s
electricity supply system while the private-
sector-led structure of the Electric Power Sector
Reform Act (EPSRA) of 2005 took effect. The
NDPHC is owned by the three tiers of government
in Nigeria: Federal, State and Local.
» Wholly owned by state governments and/or
private companies. Such power plants are referred
to as being an Independent Power Producer (IPP).
Some of these plants originally were fully owned
by the Federal Government of Nigeria (Power
Holding Company of Nigeria; PHCN) but have
been privatised in recent years.
NIPP was originally designed around seven
medium sized gas fired power stations in the gas
producing states, and the critical transmission
Figure 2.7 Geographical
location of Nigeria’s
electricity plants (Source:
Detail, 2015)
POWER GENERATION LEGEND
On-Grid IPP’s (Operational)
On-Grid IPP’s (Non-Operational)
Off-Grid IPP’s (Operational)
Off-Grid IPP’s (Non-Operational)
NIPP’s (Operational)
NIPP’s (Non-Operational)
FGN Privatized Gencos (Operational)
Embedded Gencos (Operational)
Embedded Gencos (Non-Operational)
IbomAkwa
ImoAbia
Rivers
Delta
EdoOndo
Lagos
Ogun
Ekiti
Kogi
Niger
Sokoto
Kaduna
Plateau
BauchiCombe
Bayelsa
Cross RiverEnugu
Anambra

32
Market Study and Project Scouting Nigeria
infrastructure needed to evacuate the added
power into the national grid. A commitment to
electrify host communities in the vicinity of the
power stations and major substations gave rise
to the distribution component of the project. In
August 2005, the National Council of State and the
National Assembly approved an initial funding for
NIPP from the ‘excess crude savings account’ which
statutorily belongs to the Federal, State and Local
Governments.
Early 2016, there are 23 grid-connected power
generating plants “in operation” in the Nigerian
Electricity Supply Industry10 (NESI), with a total
installed capacity of 10.396 MW and available
capacity of 6.056 MW. Most generation is thermal
based, with an installed capacity of 8.457,6 MW
(81% of the total) and an available capacity of
4.996 MW (83% of the total). Hydropower from
three major plants accounts for 1.938,4 MW of
total installed capacity (and an available capacity of
1.060 MW).11
10) The entire electricity value chain (generation, transmission
and distribution) including the associated fuel supply
11) www.nipptransactions.com, July 2016
Figure 2.7 shows the list of power plants with
capacities and the geographical position of the
power plants. This figure shows that of the available
power plants, only 31% of the installed capacity is
operational capacity.
Grid-connected power generation is faced with
different challenges, some of which are12:
» Unavailability of gas: About 85% of installed
generation capacity is thermal. Although Nigeria
has the world’s 9th largest gas reserves, gas
production is significantly low. This constraint
is said to reduce power generation capacity by
1.995 MW; reasons for this include uneconomical
gas prices; pipeline vandalism; insufficient gas
infrastructure; and uncertainty in regulation and
fiscal policies for gas.
» Inadequate electricity transmission infra-
structure: The existing electricity transmission
system is only capable of delivering about
5.300 MW (out of the total installed capacity of
12.522 MW) to DisCo trading points. The majority
of Nigeria’s infrastructure is radial, which means
a single path of transmission with a power source
at one end. This implies that any fault in the path
could potentially lead to a collapse of the entire
transmission network. The issue with trans-
12) Detail Commercial Solicitors, published in www.financialnige-
ria.com on 13 January 2016
Table 2.1 Historical grid
connected energy supply
in Nigeria (Source: Energy
sector study (NESP, 2015b))
YearAverage generation capacity (MW)
Max. peak generation (MW)
Max. daily energy generated (MWh)
Total energy generated (MWh)
Total energysent out (MWh)
Per Capita Energy Supply (kWh)
2007 3.781,3 3.599,6 77.322,3 22.519.330,5 21.546.192,2 155,3
2008 3.917,8 3.595,9 86.564,9 18.058.894,9 17.545.382,5 120,4
2009 4.401,8 3.710,0 82.652,3 18.904.588,9 18.342.034,7 122,0
2010 4.030,5 4.333,0 85.457,5 24.556.331,5 23.939.898,9 153,5
2011 4.435,8 4.089,3 90.315,3 27.521.772,5 26.766.992,0 165,8
2012 5.251,6 4.517,6 97.781,0 29.240.239,2 28.699.300,8 176,4
2013 5.150,6 4.458,2 98.619,0 29.537.539,4 28.837.199,8 181,4
2014 6.158,4 4.395,2 98.893,8 29.697.360,1 29.013.501,0 167,6

33
Chapter 2 Energy situation in Nigeria
mission has been estimated to reduce the power
generation capacity by a total of about 263 MW.
TCN plans to upgrade the transmission system
to a capacity of 11.000 MW by 2020 (subject to
adequate funding and completion of projects
planned for implementation).
» Liquidity issues in the Nigerian Electricity Supply
Industry (NESI): The NESI has, since the priva-
tisation of the government owned generation
companies (GenCos) and DisCos in November
2013, been faced with liquidity issues resulting
from non-cost reflective tariffs and non-paying
customers. The DisCos, being the cash collectors
in the power value chain were unable to collect
sufficient revenue to pay their power bills which
should sustain the rest of the value chain (GenCos,
gas suppliers and service providers). As a result, all
the market participants in the power value chain
cannot get their revenues in full, and this has
led to a cash deficit in the sector. This is clearly a
disincentive to investment in additional gener-
ation or capital expenditure for the DisCos. Even
with the new tariffs (MYTO), the liquidity issues
should not be expected to disappear over night.
» Nigerian Integrated Power Project (NIPP) priva-
tisation: Closely related to the liquidity issues,
are the issues affecting the completion of the
NIPP privatisation. The privatisation process of
NIPP Power Plants, which has a capacity to add
up to 4.775 MW to the grid, has been fraught
Figure 2.8 List of Nigeria’s
hydro and thermal Power
Plants and Capacities
(Source: Advisory Power
Team, 2015)
Power plant
EGBIN
AFAM VI
OKPAI
DELTA
JEBBA
OLORUNSOGO GAS
IHOVBOR NIPP
GEREGU NIPP
KAINJI
OLORUNSOGO NIPP
OMOTOSHO NIPP
OMOTOSHO GAS
SHIRORO
GEREGU GAS
SAPELE NIPP
IBOM
SAPELE
ALAOJI NIPP
ODUKPANI NIPP
AFAM IV-V
ASCO
OMOKU
TRANS AMADI
AES GAS
RIVERS IPP
TOTAL
IPP
PRIVATISED PHCN
IPP
NIPP
IPP
PRIVATISED PHCN
PRIVATISED PHCN
PRIVATISED PHCN
NIPP
IPP
NIPP
PRIVATISED PHCN
PRIVATISED PHCN
NIPP
IPP
PRIVATISED PHCN
NIPP
IPP
PRIVATISED PHCN
NIPP
IPP
PRIVATISED PHCN
NIPP
PRIVATISED PHCN
IPP
1.320
685
900
480
570
335
434
450
720
760
500
335
600
414
450
190
504
720
561
724
294
110
150
180
136
539
182
153
374
171
76
455
179
131
262
169
69
375
173
111
189
163
67
64
2
0
0
0
0
0
941
431
444
508
219
270
587
277
260
159
158
0
536
374
306
184
234
0
463
328
280
91
3
175
0 1) A
vera
ge d
aily
cap
acit
y Ja
n t
o A
ug
15 2
015
wit
h d
ata
extr
apol
ated
for
days
on
wh
ich
dat
a n
ot a
vaila
ble
2) A
vera
ge o
f dai
ly t
otal
acr
oss
plan
ts L
ess
than
10%
ope
rati
onal
12.522 57% 7.141 54% 3.879
31%
Avg. available capacity2 MW Avg. operational capacity2 MW
Installed capacity1 MW

34
Market Study and Project Scouting Nigeria
with issues including the ones described above
and a lack of government credit enhancements.
This is especially complicated by the fact that
most Nigerian Banks have a substantial amount
of exposure to the power sector from the PHCN
privatization, and the alternative is international
funding which would be subject to more scrutiny
by international banks.
Despite these challenges the power sector has
elicited high investment interest, and many
developers have secured generation licenses
from NERC. Zuma Energy Nigeria Limited recently
executed its first power purchase agreement (PPA)
with NBET for construction of a 300 MW coal power
plant in Kogi State. The 300 MW plant is reported to
be the first phase of the 1200 MW coal fired power
plant Zuma Energy will develop. There has also been
a recent upsurge in interest in solar power projects
in Nigeria. As at 10 November 2015, NBET indicated
that it was negotiating eight PPAs with solar
power developers whose projects are at different
phases. However, due to varied reasons, none of the
greenfield IPPs have commenced operations.
Based on an overview of the licenses that have been
issued by NERC (see Annex C), the following can be
concluded:
» The majority (98%) of licensed generation
capacity is grid-connected.
» A little over a third (37%) of the licensed gener-
ation capacity is operational.
» Licenses have been issued for 423 MW of captive
and surplus power. Only 340 MW is operational.
» Three quarters (77%) of licensed renewable
generation capacity (1.969 MW) is from hydro
power.
» Of the licensed renewable generation capacity
only hydropower is actually operational
(1.930 MW).
» Since 2013 the number of issued (and probably
also requested) generation licenses and the
overall generation capacity (in MW) is declining.
An exception is the number of ‘small’ (<100 MW)
renewable energy projects; between 2011–2015
the number of issued licenses has grown from
zero to four annually.
» Embedded power generation is almost non-ex-
istent.
Captive and surplus power means:
generator produces electricity mainly for own use (off-grid) but sells electricity (in excess of 1 MW) to an off-taker.
Figure 2.9 Issued licenses
for generation capacity
(NERC, January 2016)
Licensed generation capacity (MW) Licensed operational generation capacity (MW)
363423
33.433
10340
12.250
captive and surplus power
embedded
on-grid

35
Chapter 2 Energy situation in Nigeria
Embedded generation Embedded power currently is almost non-existent
in the Nigerian electricity system. However there
seems to be a major prospect for embedded power.
Only in Lagos State, in eleven industrial areas
and residential estates, more than 6.500 diesel
generators, totalling 600 MW, are installed (see
Annex G).
Captive generation In Nigeria, captive power is a widespread form of
off-grid power generation. Captive generation is
defined as generation of electricity for the purpose
of consumption by the generator and which is
consumed by the generator itself and not sold to
a third party. The NERC Captive Power Generation
Regulation reinforces the definition in the Electric
Power Sector Reform Act 200513 (EPSRA) and
goes to define captive power generation to mean
generation of electricity exceeding 1 MW for the
purpose of consumption by the generator and
which is consumed by the generator itself and not
sold to a third party14 (Detail Commercial Solicitors,
Nigeria Power Guide, Volume 3, 2015 Edition).
13) Nigerian Ministry of Power, Works and Housing
14) Detail Commercial Solicitors, Nigeria Power Guide, Volume 3,
2015 Edition
Figure 2.10 Current IPPs
in Nigeria (Latham &
Watkins, 2016)
Gombe State
Plateau State
Enugu State
Abia State
Rivers State
Delta State
Kogi StateOgun State
Lagos State
Anambra State
Akwa Ibom State
Edo State
» Mabon Limied, Dadinkowa 39 MW | Hydro
» JBS Wind Power Limited, Maranban Pushit, Mangu 39 MW | Hydro
» Minaj Holdings Limited, Adu-Amorji 115 MW | Coal
» Aba IPP, Aba 141 MW | Gas
» Supertek Limited, Akwete 1000 MW | Gas
» Eleme Petrochemical Company Limited, Eleme Complex, Port Harcourt 135 MW | Gas
» Notore Power Limited, Onne 50 MW | Gas
» Okpai Power Plant/Nigeria Agip Oil Company Okpai 480 MW | Gas
» Delta Electric Power Limited, Etiope 116 MW | Gas
» Ethiope Energy Limited, Sapele 2800 MW | Gas
» Itobe Power Plant (Zuma Energy Limied), Itobe 1200 MW | Coal
» Knox J&L Energy Solutions Limited, Ajaokuta 1000 MW | Gas
» DIL Power Plc, Obajana 135 MW | Coal
» Westcom Tech & Energy Service 1000 MW | Gas
» Magboro Power Plant/ Bresson A.S. Nigeria Limited, Magboro 90 MW | Gas
» Agbara Shoreline Power Limied, Agbara 100 MW | Gas
» Paras Engergy & Natural Resources Development Limied, Ogijo 96 MW | Gas
» Westcom Tech & Energy Service Limited, Sagamu 1000 MW | Gas
» Farm Electric Supply Limited, Ota 150 MW | Gas
» Hudson Power Limited, Warawa 150 MW | Gas
» Ibafo Power Station Limited, Ibafo 200 MW | Gas
» AES Barge Power Plant, Egbin 270 MW | Gas
» Anita Energy Limited, Agbara 90 MW | Gas
» MBH Power Limited, Ikorodu 300 MW | Gas
» Energy Company of Nigeria (NEGRIS), Ikorodu 150 MW | Gas
» Ibafo Power Station Limited, Ibafo 140 MW | Gas
» Century Power Generation Limited, Okila 495 MW | Gas
» Ibom Power Limited, Ikot Abasi 190 MW | Gas
» Azura Power Plant, Benin City 459 MW | Gas
Key:
Installed/Licensed Capacity (MW) | Feed Stock

36
Market Study and Project Scouting Nigeria
According to a 2013 survey15, approximately 80%
of the Nigerians use alternate sources of electricity
supply such as diesel generators or solar PV.
Estimates suggest that between 8 and 14 GW of
decentralised diesel generator capacity is currently
installed in the country16, mostly in industry. About
86% of the companies in Nigeria own or share a
generator and about 48% (of their total electricity
demand) is covered by these private generators
[GIZ; Mar 2015]. With several millions of privately
15) Survey of Power Demand and Energy Consumption in the
Industrial Sector in Nigeria, GIZ, 2013
16) GIZ and NIAF estimation (taken from: The Nigerian Energy
Sector, GIZ, 2015)
installed diesel generators, Nigeria leads Africa
as a generator importer and is one of the highest
importers worldwide, with a total annual import
figure being worth NGN 17.9 billion (€ 95 million).
The total captive power capacity for which licenses
and permits have been issued by NERC add up
to about 1.700 MW. Based on rough estimations
that the total market for self-generated power in
Nigeria is between 8 and 14 GW, it seems a very
large share of the self-generated power market has
a maximum generation capacity below 1 MW and /
or captive power generation is not accounted for
in the overviews of permits and licenses that are
available (see Annex C). Permits might have been
Figure 2.11 Overview
of issued Captive Power
permits 2010–2013 (NERC)
Figure 2.12 Overview
of issued Captive Power
permits per state between
2010–2013 (NERC)
Issued captive Power permits
Issued captive Power permits Per State
Total generation capacity
# permits
600
500
400
300
200
100
0
25
20
15
10
5
0
374
2010
583,5
2012
342
2011
# is
sued
per
mit
s
gen
erat
ion
cap
acit
y (M
W)
11
22
17
gen
erat
ion
cap
acit
y (M
W)
400
350
300
250
200
150
100
50
0
Ogu
n
123
Imo
9
Kadu
na
59
Edo
7
Cro
ss
50
Kats
ina
3
Kan
o
32,5
FVT
2
Ana
mbr
a
1
400
Rive
rs
325
Lago
s
282
Akw
a

37
Chapter 2 Energy situation in Nigeria
issued before 2010 and licenses before 2006 (if
required at that time), excluding them from current
statistics.
Based on the overview of issued permits (Figure
2.11 and 2.12 and Annex C), the following can be
concluded:
» In total 1.300 MW of Captive Power permits have
been issued.
» 78% of the issued permits is in three states: Akwa
Ibom (22%), Ogun (25%) and Rivers (31%); the
major industrialised and oil and gas states.
» No permits or licenses have been issued for
renewable captive power (or not registered as
such).
Off-grid generationOff-grid generation in Nigeria is defined as stand-
alone power generation systems (up to 1 MW),
which typically provide smaller communities (e.g.
rural areas; industrial clusters or residential estates)
with electricity through independent electricity
distribution network systems or mini-grids. Off-grid
electricity is not evacuated on the electricity grid
of the TCN or a DisCo. The total off-grid electricity
generation capacity is still marginal. Considering
Nigeria’s plans to increase generation capacity
in the coming years and the low level of access
to electricity in the rural areas, there is need for
significant investment in off-grid generation.
There are some very good prospects for off-grid
solutions in Nigeria17:
» Potential to grow industrial clusters and small
cottage industries: These businesses require unin-
terrupted power supply to function optimally.
The power supplied could be generated through
fully off-grid power plants (or embedded power).
Steps are already being taken in this direction
with the development of a proposed framework
17) Detail Commercial Solicitors, published in www.financialnige-
ria.com on 13 January 2016
for micro-grid power generation for industrial
clusters in Nigeria. The Manufacturers Asso-
ciation of Nigeria (MAN) identified about 28
clusters for mini-grid modular plants ranging
from 5 to 50 MW in areas including Ogun and
Lagos States.
» Opportunities for household mini-grids: Unserved households in (usually rural) areas
that do not fall within a DisCo concession, can
be served by investors who may wish to create
off-grid supply over their own local grid. In line
with the NERC Regulation for Independent
Electricity Distribution Networks (IEDN Regula-
tions, 2012), off-grid generation plants require
an IEDN (often a mini-grid) to supply electricity
to end users. Topographical and geographical
challenges in rural areas make it uneconomical to
extend the grid to such areas. Rural electrification
in Nigeria is low, hence there is a direct need for
investments. End of 2015, bids were requested by
the Rural Electrification Agency (REA) for several
rural electrification projects across Nigeria. It is
expected that several rural electrification projects
will be realised in 2016.
» Opportunities for DisCos cooperating with IEDNs:
Expansion of the electricity grid with IEDNs in
areas outside and within the DisCo concession
areas could potentially be a win-win situation
for DisCos. After an independent developer has
established the off-grid generation and distri-
bution system, the DisCo could either collaborate
with developers to expand or refurbish their
network (then becoming embedded gener-
ation), which will add to their number of paying
customers, or acquire the developer assets, given
the right regulatory framework.
» Opportunity to collaborate with State Govern-
ments: Many state governments are looking
to partner with investors to develop off-grid
projects. This may be to avoid regulatory
constraints (as a result of the fact that most
laws, regulations, and agencies for grid-con-
nected projects are controlled by the federal
government) which state governments may expe-
rience when executing on-grid projects. Notably,
the Lagos State Government has initiated some

38
Market Study and Project Scouting Nigeria
Independent Power Projects (IPPs) to provide
electricity to its own establishments, including
schools, ministries, hospitals, and courts. As at
July 2015, the state had commissioned five IPPs
with an accumulated capacity of 47,5 MW.
» Considerable insulation from the issues within
the NESI: off-grid solutions within a cluster of
customers willing and able to pay, presents a
viable investment opportunity for power devel-
opers, particularly because the investment would
be insulated from the current liquidity issues in
the NESI.
Electricity transmission
Nigeria’s transmission network consists of
159 substations with a total (theoretical)
transformation capacity of ca. 19.000 MW and
15.022 km of transmission lines. The national grid
operates at 330 kV and 132 kV high voltage level.
126 approved TCN projects worth approximately
€ 1,2 billion are underway to strengthen the
transmission network. For electricity generation,
however, delivery has been slow and only 22 of the
126 approved TCN projects have been completed,
primarily because of inadequate funding and
invoicing delays (ongoing FGN funded projects
are generally ineligible to access external funding
reserved for new projects). Of those yet to be
completed, ca. 30% have been underway for more
than five years and eight even started in 2001. In
addition, various external funding sources have
been made available to finance new projects within
the transmission sector. However, much funding
has yet to be accessed as the number of bankable
projects is low. When complete, these projects could
increase grid-wheeling capacity to ca. 7.200 MW
and the length of the network to ca. 21.000 km.
Figure 2.13 shows the transmission grid of Nigeria
Figure 2.13 Existing
Transmission Line System
(Transmission Company of
Nigeria, 30 June 2015)

39
Chapter 2 Energy situation in Nigeria
as of 2015. Currently the network is not well
developed in the Northern and Eastern regions of
the country.
Electricity distribution
The Nigerian government moved to privatise the
power sector with the Electric Power Sector Reform
Map of 2005 and the launch of the Roadmap for
Power Sector Reform in 2010. In this Roadmap, the
former National Electric Power Authority (NEPA)
was unbundled and replaced by the Power Holding
Company of Nigeria (PHCN). From 2007 until
September 2013, the PHCN was the state-owned
company in charge of generating, transmitting
and distributing electricity in the entire country.
In addition, 10 new National Integrated Power
Projects (NIPP) were under development. As part
of the privatisation process, the government
owned (PHCN) generation facilities were sold to
private parties (GenCos), the NIPP projects were
put-up for sale and the distribution network was
broken up into eleven regional grids (DisCos),
which were then partly sold off to local and
foreign investors. A minority stake of the DisCos
was retained by the government of Nigeria. The
resulting distribution companies vary greatly in
terms of network size, number of customers and
geographic area. Figure 2.14 and Figure 2.15 show
the distribution companies and their customers,
network distribution and allocated percentage of
electricity. The privatisation was performed through
a competitive bidding process and was completed
in November 2013. TCN is still fully owned by the
government but has been under a management
contract with Manitoba Hydro International for
four years. In July 2016 the federal government has
resumed the management of TCN.
The privatization has not (yet) brought major
improvements in the electricity situation.
Figure 2.16 shows an overview of the daily
cumulative electricity supply for Nigerian
households. Over the period of 2013–2015, the
average hours of electricity supply per connected
household was 6,2 hours (www.noi-polls.
com, October 2015). This situation forces both
Figure 2.14 The 11 DisCos
in Nigeria (Source: Advisory
Power Team, 2015)
KADUNA
ABUJA
IKEJA EKO
BENINENUGU
JOS
YOLA
PORT HARCOURT
IBADAN

40
Market Study and Project Scouting Nigeria
Figure 2.15 Customers,
network length and
allocated energy per DisCo.
(Source: Advisory Power
Team, 2015)
Figure 2.16 Monthly (daily
average) – Energy sent out
MWh (NERC, July 2016)
74,555 86,772 75,548 76,297 84,318 74,890 73,807 830,96 78,793 83,229 86,705 83,948
83,425 81,821 80,101 74,803 60,422 80,630 89,813 93,462 94,110 91,110 95,756 91,278
96,686 92,981 81,648 73,539 61,322 51,637 66,986
2014
2015
2016
120.000
100.000
80.000
60.000
40.000
20.000
0
2014 2015 2016
Jan Feb AprMar May Jun Jul Aug Sep Oct Nov Dec
NUMBER OF CUSTOMERS(‘000, 2014)
AREA
ABUJA
BENIN
EKO
ENUGU
IBADAN
IKEJA
JOS
KADUNA
KANO
PORT HARCOURT
YOLA
755
1.187
581
819
1.750
1.128
466
459
598
557
345
107.254
104.702
8.093
25.078
24.355
12.466
12.227
26.653
21.041
17.989
6.505
12 %
15 %
13 %
9 %
9 %
11 %
8 %
7 %
6 %
8 %
4 %
15 %
14 %
13 %
12 %
11 %
9 %
8 %
7 %
5 %
5 %
2 %
DISTRIBUTION NETWORK(KM, 2008)
VARIATION OF CUSTOMERS AND NETWORK DISTRIBUTION
ALLOCATED ENERGY1
(% OF TOTAL ENERGY ALLOCATED)
ALLOCATION(% OF GRID ENERGY)
ACTUAL AVERAGE(JAN’ 14 – APR’ 15)
1 ) Du
e to
rou
ndi
ng
perc
enta
ges
don’
t ad
d to
100
%

41
Chapter 2 Energy situation in Nigeria
households and industry to rely on privately
owned petrol and diesel generators for much of
their power requirements. Before February 2016,
generating electricity from these generators was
more than twice as expensive (€ 0,27 – € 0,41/ kWh)
than grid-based power (end user tariff of € 0,11 –
€ 0,16 /kWh).
As of February 1, 2016 there was a 45% increase
in on-grid electricity tariffs (see Annex H for the
latest electricity tariffs) as established by NERC.
According to NERC the increase in tariff will boost
private investment in the sector. However, this tariff
increase has been declared illegal by the Federal
High Court in Lagos on July 13, 2016. NERC has filed
for stay of execution and a notice of appeal of the
judgement.
The biggest challenge the distribution sector faces
is the level of distribution losses. This includes
technical, commercial (electricity not billed for), and
collection losses (electricity billed but not paid for).
When the distribution companies were privatised,
the transactions assumed particular loss levels.
After the asset hand-over, however, it became clear
that the losses were much higher than had been
estimated. In 2014, ca. 46% of potential revenues
were lost through technical (12%), commercial (6%),
and collection losses (28%).
Stakeholders
In this section the key stakeholders in the power
sector are introduced briefly. In chapter 6, the
relevant stakeholders for captive renewable energy
are described in more detail.
The key decision, policy, and regulatory bodies
active in the sector are:
» The Presidency
» Nigerian Electricity Regulatory Commission
(NERC)
» Energy Commission of Nigeria (ECN)
» Ministry of Power (MoP)
» Ministry of Environment (MoE)
» Ministry of Petroleum Resources (MoPR)
» Ministry of Finance (MoF)
» National Council on Privatisation (NCP) with its
secretariat, the Bureau of Public Enterprises
» Hydro Electric Power Producing Areas Devel-
opment Commission (HEPPADC)
» Nigerian Investment Promotion Commission
(NIPC)
» Rural Electrification Agency (REA)
The main players in the daily operations of the
power market:
» Nigeria Bulk Electricity Trader (NBET)
» Transmission Company of Nigeria (TCN)
» Nigerian National Petroleum Corporation (NNPC)
and its key operational subsidiaries, the Nigerian
Gas Company (NGC) and the Nigerian Petroleum
Development Company (NPDC)
» Niger Delta Power Holding Company (NDPHC)
» Private sector natural gas producers: interna-
tional and indigenous oil and gas companies
» The divested generation companies (GenCos)
» The divested distribution companies (DisCos)
» The independent power producers (IPPs)
Figure 2.17 presents an overview of the key power
market actors in Nigeria. From this figure it shows
that NBET buys in the electricity generated from
the GenCos or IPPs. After this the electricity is
transmitted by TCN, against transmission charges,
to DisCos who distribute and sell the electricity to
the end-user. NERC functions as an overarching
regulatory commission in the electricity sector.
Embedded power is directly distributed by DisCos
without any interference from TCN, NBET or NERC.

42
Market Study and Project Scouting Nigeria
Policies and regulations
The energy landscape in Nigeria has undergone
drastic changes in recent years due to the ongoing
privatisation of the sector. In recent decades the
electricity market has changed from a vertically-
integrated organisation under the state-owned
National Electric Power Authority (NEPA), to a multi-
stakeholder privatised market. In the following the
existing policies and regulations are summarized in
chronological order. Some are less relevant due to
the many changes in the sector in the last ten years.
The following policies and regulations specific to
renewable energy are mentioned in more detail in
chapter 3 (page 60):
» Renewable Electricity Policy Guidelines 2006
(REPG)
» Renewable Electricity Action Programme (REAP),
2006
» National Biofuel Policy and Incentives (2007)
» Renewable Energy Master Plan (REMP), 2012
» National Renewable Energy Action Plan, 2016
National Electric Power Policy (NEPP), 2001Because of population- and economic growth
in the late 1990s, the demand for energy grew
rapidly. NEPA was unable to keep pace with the
growing demand, which led to an energy supply
crisis in 2001. Because of the crisis, the National
Electric Power Policy (NEPP) was launched, aiming
at fundamental changes in the ownership,
control, and regulation of the electricity sector. Figure 2.17 Overview of
key power market actors
(NERC, July 2016)
NERC(NIGERIAN ELECTRICTIY REGULATORY COMMISSION)» Overarching power sector regulator» Responsible for licensing, tariffs, codes and other policies
CUSTOMERS» 8 million customers» 36% collection loss
DISCOS(DISTRIBUTION COMPANIES)
» 11 privatised DisCos» Sell directly to
customers and industries
TCN (TRANSMISSION COMPANY OF NIGERIA)
» Owns and operates transmission grid
» Managed by Manitoba Hydro International
GENCOS (GENERATION COMPANIES)
» 25 grid-connected power plants » Mix of public and private
ownership (privatised PHCN, NIPP and IPP)
GAS PRODUCERS» NNPC, IOCs, and Local
Independents » JV, PSC, and Independent field
development
NBET(NIGERIAN BULK ELECTRICITY TRADING PLC)
» Creditworthy intermediary between DisCos, TCN and GenCos
» Temporary role until sector achiefes fiscal strenght
GASPURCHASEAGREEMENTS
POWER PURCHASEAGREEMENTS
TRANSMISSION CHARGES
VESTINGCONTRACTS
RETAIL TARIFFS
~8.9 BSCFDDaily production
~0.8 BSCFDSupplied to power plants
GAS85%
Hydro 15%
GAS THERMAL PLANTS» 85% of installed
capacity» 22 gas thermal
plants
HYDRO-ELECTRIC PLANTS» 15% of installed
capacity
» 3 hydro plants
12,522MWinstalled capacity
3,879MWOperational capacity
~3,600MWTransmitted capacity
~3,100MWDistributed capacity
43
Chapter 2 Energy situation in Nigeria
The NEPP focused on creating a privatised sector
that was able to overcome the poor service, low
availability and high frequency of outages in the
system through the creation of an investor friendly
environment with low government involvement.
The NEPP consisted of three principal phases.
The first step aimed at privatisation and the
introduction of independent power producers
(IPP). The second step aimed at increasing the
competition between market participants,
reduction of subsidies, and sale of excess power
to DisCos. The final step consisted of a further
intensification of the market and competition
through full cost pricing of supply, liberalised
selection of supplier beyond the local DisCos
and full competitive market trading. The
implementation of the NEPP was later incorporated
in the Electric Power Sector Reform Act (EPSRA) of
2005.
National Energy Policy (NEP), 2003This policy was designed as a framework for
the development of the sector. It covers the
development, exploitation, and supply of all
energy resources and their utilisation. The policy
programme consists of three topics with individual
policy goals, namely:
» Renewable Energy: The NEP recognizes the
conversion of all energy resources as vital for
development and therefore makes a provision for
renewable sources and how they can effectively
be utilised. However, no quantitative targets are
given.
» Energy efficiency and conservation: The NEP
points out that energy efficiency is very low in
Nigeria and called for the promotion of energy
conservation. However, no quantitative targets
are given.
» Rural electrification: The NEP recommends the
promotion of off-grid and standalone power
systems in order to supply electricity to remote
areas.
National Economic Empowerment and Development Strategy (NEEDS), 2004The NEEDS programme was intended as an
overarching statement for the period 2003–2007
combating the social, political and economic decay
in the country. The policy promotes the privatisation
of infrastructure. Furthermore, the programme
promotes the uptake of renewable energy in the
total energy mix. The policy makes provisions
for the vertical and horizontal unbundling of the
electricity company into separate and competitive
entities.
Electric Power Sector Reform Act (EPSRA), 2005The NEPP was the basis for the Electric Power
Sector Reform Act of 2005. Through this reform
act, the energy sector of Nigeria was privatised in
the following decade. This policy provides a new
legal and regulatory framework for the sector. The
fundamental reform was the privatisation of the
government owned NEPA to the PHCN holding
company including the subsequent splitting of
its assets into 18 separate successor companies
responsible for the generation, transmission, and
distribution. The Act makes provisions for the
vertical and horizontal unbundling of the electricity
company into separate and competitive entities,
thus restructuring the whole energy landscape with
different players for the generation, transmission,
distribution and commercialisation of the
electricity. The intention of the programme was to
increase competition significantly by establishing
a wholesale electricity market and promoting the
participation of private companies. The Act is the
most important legislature in the electricity sector.
The Act also mandates the NERC to ensure that
all electricity generated is efficiently sourced and
distributed to the customer.
44
Market Study and Project Scouting Nigeria
Vision 20:2020, 2010The Vision 20:2020 outlines the path to position
the country amongst the leading 20 economies
of the world in 2020. The vision recognises the
importance of Nigeria’s renewable energy resource
potential in meeting the national electricity targets.
Therefore, the vision called for various measures
and strategies as contained in the document to
support the sustainable integration of renewable
energy generated electricity into the energy mix of
the country. Some of the goals highlighted in the
document include:
» Achieving a 15% and 20% contribution of hydro-
power to the nation’s electricity generation mix
by 2015 and 2020 respectively;
» Ensuring a 1% contribution of wind energy to the
nation’s electricity generation mix;
» Attaining a 1% contribution of solar energy to the
nation’s electricity generation mix;
» Replacing 50% of firewood consumption for
cooking ;
» Putting in place a power generation capacity of
1,000 MW using biomass resource;
» Maintaining a biofuel blend not exceeding 10% in
transport fuels, using locally produced renewable
biofuels from secondary biomass.
Embedded Generation Regulations, 2012In this regulation, the NERC defines the standards
for embedded generators and the operation of
electricity supply systems. Embedded generation is
defined as generating units that are connected to
the distribution grid. Embedded generators are not
obliged to provide electricity to the public. However,
the regulation prescribes that the embedded
generator must enter into various network
agreements such as power purchase agreement,
and an ancillary services agreement with the NERC
and NBET.
Regulations for Independent Electricity Distribution Networks (IEDN), 2012This regulation provides the provisions for the
issuance of licenses for DisCos and electricity
distributors independent of a distribution company
(DisCo). An IEDN entails an isolated rural or urban
network not connected to the national grid. An
IEDN is required to operate its own generator or
to obtain electricity from another distribution
company via a purchase agreement.
Renewable Energy Master Plan (REMP), 2012The Renewable Energy Master Plan (REMP) sets
out in the short, medium and long term what
the national energy supply mix should be and
articulates the strategic approach and measures to
meet the targets. For more details, see chapter 3,
page 61.
Roadmap for Power Sector Reform, 2010 and 2013 updateThe updated roadmap of 2013 was based on the
roadmap of 2010 and includes fine-tuned plans and
strategies to finalise the power sector reforms. The
roadmap does not introduce new policies but sets
strategies to accelerate achieving the objectives of
the NEPP of 2003.

45
Chapter 2 Energy situation in Nigeria
National Renewable Energy and Energy Efficiency Policy (NREEEP), 2015In May 2015, NREEEP was approved by the
Federal Executive Council. NREEP targets for
power generation using biomass, wind, solar and
hydropower as well as renewable electricity overall
supply projections. For more details, see chapter 3,
page 61.
Multi-Year Tariff Order (MYTO), 2015The MYTO is set to cover a total of 15 years and is
reviewed biannually. It sets feed-in tariffs in order
to ensure there are clear rules in the interim market
for energy. In January 2015, the MYTO 2.118 was
initiated that sets feed-in tariffs for:
» New entrance gas power plants
» New entrance coal power plants
» Small hydropower plants
» Land-mounted wind power plants
» Solar power plants
National Renewable Energy Master Plan, 2016The National Renewable Energy Action Plan
(NREAP) describes the opreationalisation of
NREEEP, and includes baseline data, information on
renewable energy sources and technologies, various
activities and programmes in renewable energy in
Nigeria, barriers to the development of renewable
energy, and targets for 2020 and 2030. For more
details, see chapter 3.
18) http://www.nercng.org/index.php/myto-2/96-myto-2
Licences for market participants
The players in the Nigerian electricity market are
often referred to as market participants. In order
to carry on business as a market participant, it is
imperative that such entities obtain the appropriate
licences from NERC. In chapter 6, detailed
information is provided on the steps a market
participant has to take to implement on- and off-
grid electricity projects in Nigeria, including captive
and embedded power projects.

46
Market Study and Project Scouting Nigeria

47
Resources and potential
Nigeria’s abundant renewable energy resources are
largely untapped. Table 3.1 shows the renewable
potentials per resource type for Nigeria.
Hydro power potentialThe gross hydro potential for the country is
approximately 14,75 GW (11,25 GW large and 3,5
GW small), enough to solely power the current
electricity generation in the country. Of this
potential only 13% is currently utilised. The Federal
Ministry of Power (FMP) classifies hydropower
plants that generate less than 30 MW as small,
and of less than 1 MW as mini hydropower plants.
Hydropower power plants larger than 30 MW are
considered medium plants and those larger than
100 MW are considered large plants (FMP; 2015).
Table 3.2 shows the potential of SHP in five selected
states and Figure 3.1 shows the geographical
location of river basins with hydropower potential
in Nigeria.
A more detailed study on the overall hydropower
potential for Niger State (Rufai, 2012) revealed
a total untapped potential of about 2.491 MW.
This includes construction of new small, medium
and large dams, using existing dams for hydro
and ensuring the existing hydropower stations
across are not operating below capacity. Still the
potentials claimed by ECN have to be assessed
carefully: A recent study [GIZ; 2015] based on a
data set provided by JICA suggests that hydropower
potential might be more limited than the ECN
figures suggest. Flow patterns vary considerably
CHAPTER 3 RENEWABLE ENERGY IN NIGERIA
Resource type Reserves (natural units) Current utilization and further remarks
Hydro (large) 11.250 MW 1.900 MW exploited
hydro (small) 3.500 MW 64,2 MW exploited
Solar PV 4,0 – 6,5 kWh/m2/day 15 MW dispersed solar PV (estimate)
Wind 2–4m/s @10m hub height on-shore N/A
Biomass (non-fossil organic matter)
Municipal Waste18,5 million tonnes produced in 2005 and now estimated at 0,5kg/capita/day
Fuel wood 43,4 million tonnes annual fuel wood consumption
Animal waste 245 million assorted animals in 2001
Agricultural residues 91,4 million tonnes/yr. produced
Energy crops 28,2 million hectares of arable land; 8,5% cultivated
State River basin No of sitesPotential capacity (MW)
Cross River Cross River 18 28,1
Niger Niger 30 117,6
Ogun 0
Plateau Lower Benu 32 110,4
Sokoto Sokoto-Rima 22 30,6
Table 3.2 ECREE, Baseline
Report on Small-scale
Hydropower in the
ECOWAS Region (2012)
Table 3.1 Estimated
renewable energy
resources in Nigeria
(ECN, 2014)

48
Market Study and Project Scouting Nigeria
Figure 3.1 River basins
with large and small scale
hydro power potentials
(ECREE, 2012)
Figure 3.2 Locations of
major dams in Nigeria
(GIZ, 2015)
Legend
Major Dam
National Boundary
State Boundary
National Capital
State Capital
Legend River Basin Boundaries Hydro Site
(Existing of being Developed) Rivers
Key of River Basins indicatedI Sokoto-RimmaII Hadeija-jamaareIII ChadIV NigerVI Upper BenueVI Lower BenueVII Cross riverVIII Anambra-ImoIX DeltaX OwengaXI Ogun-Osun
Large Hydro sites
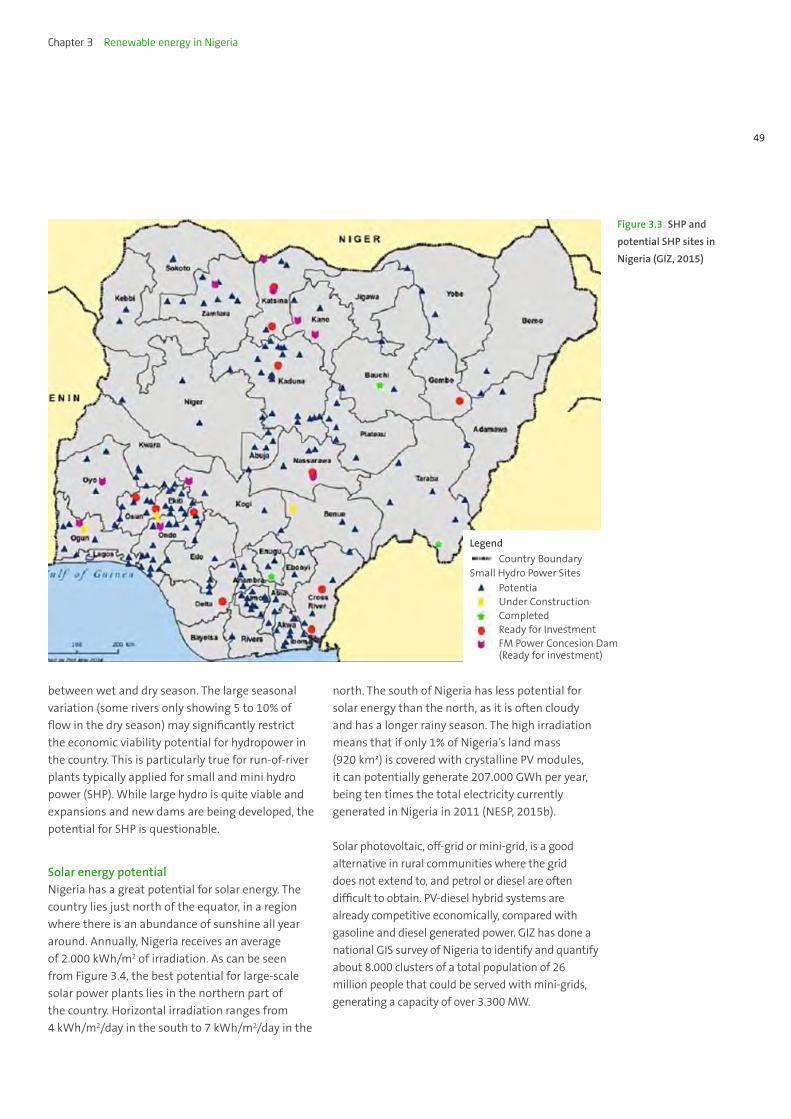
49
Chapter 3 Renewable energy in Nigeria
Figure 3.3 SHP and
potential SHP sites in
Nigeria (GIZ, 2015)
between wet and dry season. The large seasonal
variation (some rivers only showing 5 to 10% of
flow in the dry season) may significantly restrict
the economic viability potential for hydropower in
the country. This is particularly true for run-of-river
plants typically applied for small and mini hydro
power (SHP). While large hydro is quite viable and
expansions and new dams are being developed, the
potential for SHP is questionable.
Solar energy potentialNigeria has a great potential for solar energy. The
country lies just north of the equator, in a region
where there is an abundance of sunshine all year
around. Annually, Nigeria receives an average
of 2.000 kWh/m2 of irradiation. As can be seen
from Figure 3.4, the best potential for large-scale
solar power plants lies in the northern part of
the country. Horizontal irradiation ranges from
4 kWh/ m2/day in the south to 7 kWh/m2/day in the
north. The south of Nigeria has less potential for
solar energy than the north, as it is often cloudy
and has a longer rainy season. The high irradiation
means that if only 1% of Nigeria’s land mass
(920 km²) is covered with crystalline PV modules,
it can potentially generate 207.000 GWh per year,
being ten times the total electricity currently
generated in Nigeria in 2011 (NESP, 2015b).
Solar photovoltaic, off-grid or mini-grid, is a good
alternative in rural communities where the grid
does not extend to, and petrol or diesel are often
difficult to obtain. PV-diesel hybrid systems are
already competitive economically, compared with
gasoline and diesel generated power. GIZ has done a
national GIS survey of Nigeria to identify and quantify
about 8.000 clusters of a total population of 26
million people that could be served with mini-grids,
generating a capacity of over 3.300 MW.
Legend
Country Boundary
PotentiaUnder ConstructionCompletedReady for InvestmentFM Power Concesion Dam (Ready for investment)
Small Hydro Power Sites

50
Market Study and Project Scouting Nigeria
Wind energy potentialThe Ministry of Science and Technology has carried
out wind energy resource mapping [Lahmeyer;
2005] (see Figure 3.5). This wind mapping project
indicated wind speeds of up to five meters per
second in the most suitable locations, which reveals
only a moderate and local potential for wind energy.
The highest wind speeds can be expected in the
Sokoto region, the Jos Plateau, Gembu and Kano /
Funtua. The stations at Maiduguri, Lagos and Enugu
also indicated fair wind speeds, sufficient for energy
generation by wind turbines. Apart from these sites,
other promising regions with usable wind potential
are located on the Nigeria western shoreline (Lagos
Region) and partly on the Mambila Plateau. The
calculations indicate the highest energy yield at the
coastal area of Lagos, followed by the Sokoto area
and the Jos Plateau. Figure 3.6 shows geographical
locations with potential for wind generated
electricity in Nigeria.
Bioenergy potentialNigeria possesses huge potentials in biomass
considering the country’s potentials in agriculture
and forestry. Of the total land area of 91.077 kha
for Nigeria, 78% (70.800 kha) is arable land and
less than 9% (7812 kha) is forest area (FAO, 2013).
Several biomass resources are available in large
quantities in Nigeria. These include agricultural crop
residues, forestry and wood processing residues,
animal waste, human faecal waste, municipal solid
waste, organic waste from food and feed processing
industry and agricultural and forestry energy crops.
In addition, there are several agricultural crops (that
can be) cultivated in Nigeria that have the potential
to be transformed into liquid and solid biofuels,
e.g. Jatropha, Cassava, Maize, Sugar Cane, Oil Palm
and some more (Agba et al., 2010). Since 2010 the
general view on the cultivation of energy crops,
and their viability as well as their potential impact
on sustainability, food security and land rights has
become more nuanced and actual potentials are
likely to be lower.
Figure 3.4 Solar radiation
in Nigeria (GIZ, 2015)
Ave
rage
an
nu
al s
um
(4/2
004
– 3/
2010
)
<160
0 17
50
1900
20
50
2200
>kW
h/m
20
1
00
200
km

51
Chapter 3 Renewable energy in Nigeria
Figure 3.5 Wind speed
map in Nigeria (GIZ, 2014)
Figure 3.6 Potential for
wind energy application in
Nigeria (CRET, 2015)
Wind velocities in m/s0.0 – 3.03.0 – 4.04.0 – 5.05.0 – 6.06.0 – 7.07.0 – 8.0

52
Market Study and Project Scouting Nigeria
Table 3.3 summarises the different bioenergy
potentials in Nigeria. From this table it shows that
energy crops and agricultural residues have the
greatest potential for bioenergy production.
Agricultural crop residuesSimonyan and Fasina (2013) estimated the amount
of agricultural residues that are available in Nigeria
on the basis of production data19 of 14 annual
and perennial crops. Using the residue-to-product
ratios of the different crops and a conservative 30%
energy conversion rate, they have estimated that
agricultural crop residues can provide 604 x 106
GJ in energy. Table 3.4 and table 3.5 show some
annual and perennial crops from which agricultural
residues can be won.
Forestry and wood residuesIn Nigeria, forestry residues consist of residues
from logging, sawmilling, plywood production, and
particle board production (Table 3.6). According
to Simonyan and Fasina (2013), these combined
sources can provide 17,7 MJ in energy. The
bioenergy potential from these forestry and wood
residues seems unreasonably low but no further
study has been performed to validate this data.
19) 2012 production data taken from FAO and Nigeria National
Assembly (NASS)
Municipal solid wasteMunicipal solid waste composition in Nigeria is
estimated to be 87% organic (Eisa and Visvanathan,
2002). With an estimated 3.168 million tonnes of
waste generated by the urban population in Nigeria
in 2010 and 60% recovery rate, potentially 186,33 GJ
of energy per year can be generated (Simonyan and
Fasina, 2013). This potential is currently not utilised
as municipal solid waste is landfilled.
Animal (livestock) wasteIn 2010, it was estimated that there was a total of
15,76 million tonnes of dry matter animal dung
available in Nigeria (Simonyan and Fasina, 2013).
This amount of animal dung has a potential biogas
yield of 4,19 × 10⁹ m3/year, which potentially can be
converted to 29,25 GJ of energy. Table 3.7 shows the
bioenergy potential from animal waste. As animal
dung is often disposed of without proper treatment,
livestock companies cause severe negative
environmental impacts and create potential health
hazards. Also with the cattle and poultry sector
showing steady and steep growth in production
volumes for the last ten years, there might be good
opportunities for combined waste treatment and
energy production. In Nigeria, cattle, goat and pig
farms have the highest biogas potential.
Human (faecal) wasteAlso human (faecal) waste can be utilized for
bioenergy production. With a population of over
180 million, Nigeria has a vast amount of human
faecal waste that can be used for biogas production.
In 2010, the estimated amount of dry matter
human waste was 2,59 million tons (Simonyan and
Fasina, 2013). With a biogas yield of 0,45m3 per kg
dry matter, the total energy potential from human
waste is 8,13 GJ.
SourceBioenergy potential (GJ/year)
Agricultural crop residues 604 x 106
Forestry and wood residues 18 x 10–3
Municipal solid waste 186
Animal waste 29
Human waste 8
Food and feed processing waste Limited
Energy crops 1.700 x 10⁶
Total 2.3 x 10⁹
Table 3.3 Bioenergy
potential in Nigeria
(Simonyan and Fasina,
2013)

53
Chapter 3 Renewable energy in Nigeria
CropProduction (million tons)
ResidueAmount available (million tons)
Energy available (*1000 GJ)
Rice 3,37 Straw 7,86 125.920
Husk 1,19 23.000
Maize 7,68 Stalk 10,75 211.350
Cob 2,10 34.190
Husk 0,92 14.320
Cassava 42,53 Stalks 17,01 297.680
Peelings 76,56 812.300
Groundnut 3,90 Shells 1,81 28.350
Straw 4,37 76.830
Soybean 0,36 Straw 0,91 11.270
Pods 0,37 4.580
Sugar cane 0,48 Bagasse 0,14 1.990
Tops/leaves 0,14 2.210
Cotton 0,60 Stalk 2,25 41.870
Millet 5,17 Straw 7,24 89.630
Sorghum 7,14 Straw 7,14 88.390
Cowpea 3,37 Shell 4,89 95.060
Total 145,62 19.588.940
Table 3.4 Energy potential
from annual agricultural
crops in 2010 (Simonyan
and Fasina, 2013)
Crop Production (tons) ResidueAmount available (million tons)
Energy available (*1000 GJ)
Oil palm 8.500 Fibre 1.020 11.570
Empty bunches 1.955 15.950
1.170 Palm kernel 0.878 16.530
Cocoa 360.000 Pods 0.188 2.740
Coconut 170 Husk 0.072 1.340
Shell 0.028 51
Natural rubber 143.500 Leaves 0.338 5.960
Total 4.472 54.600
Table 3.5 Energy potential
from perennial plantation
crops in 2010 (Simonyan
and Fasina, 2013)

54
Market Study and Project Scouting Nigeria
Food and feed processing wasteFood processing industries (e.g. abattoirs, rice
millers, bakeries, pastry production, fruit and
vegetable processing) usually have limited amounts
of organic waste streams that can be used for
energy production. Also, these waste streams are
often already utilised for feed purposes and as such
not available for energy. There are exceptions, for
example companies producing starch from cassava.
The waste is usually not being used for feed and is
of high volume.
Energy crops – biofuelsNigeria has immense potential for energy crops
cultivation and the production of bioethanol
and biodiesel. Existing figures show that Nigeria
produces huge amounts of crops that can be used
for energy production such as soybean, palm oil,
sesame and cassava. The rainfall distribution shows
that most energy crops can be grown in Nigeria.
Some of the major crops can produce a total 1,7
EJ of energy annually. However, the production
of energy from food and non-food crops is highly
disputed and should be treated with care.
Type PopulationDry matter produced per year (kg) *
Dry matter available per year (kg)
m3/kg dry matter **
Total potential m3 biogas / year
Cattle (cow) 18.900.000 19.700 x 10⁶ 5.910 x 10⁶ 0,20 1.182 x 10⁶
Goat 65.700.000 13.230 x 10⁶ 5.292 x 10⁶ 0,25 1.323 x 10⁶
Pig 6.000.000 14.570 x 10⁶ 1.457 x 10⁶ 0,56 815 x 106
Sheep 37.400.000 4.493 x 10⁶ 1.348 x 10⁶ 0,25 337 x 106
Chicken 101.700.000 160 x 106 1.596 x 10⁶ 0,28 447 x 106
Duck 9.600.000 18 x 106 159 x 106 0,56 89 x 106
Total 15.760 x 10⁶ 4.190 x 10⁶
Table 3.7 Energy potential
from Animal Waste in 2010
(Simonyan and Fasina,
2013)
Table 3.6 Energy potential
from forest and wood
residues (FAOSTAT, 2010
and Simonyan and Fasina,
2013)
Types Residues % of residue Total residues (m3) Energy potential (MJ)
Logging Solid wood 40 911.600 6,36
Dust 20 455.800 3,18
Sawmilling Sawdust 12 273.480 1,91
Solid wood 38 866.020 6,06
Plywood Solid 45 25.200 0,18
Dust 5 2.800 0,02
Particle board Dust 10 4.000 0,00
Total 17,7

55
Chapter 3 Renewable energy in Nigeria
Installed and planned renewable capacity
Table 3.1 shows that Nigeria’s estimated installed
renewable capacity is currently only 1.979 MW.
Of this installed capacity, 1.900 MW is from three
large hydropower plants, and 64,2 MW derives from
small hydropower plants. Finally, it is estimated that
about 15 MW of dispersed solar PV is installed.
Grid-connectedUp to date, no commercial large-scale grid-
connected renewable energy project other than
hydropower has been successfully implemented.
The mentioned 1,9 GW of hydropower capacity is
installed in three large power plants:
» Kainji hydropower plant; 760 MW
» Jebba hydropower plant; 570 MW
» Shiroro hydropower plant; 600 MW
From these hydropower plants, approximately half
of the installed capacity is operational.
There is a 10 MW wind project (supported by the
Ministry of Power) in Katsina implemented by
Vergnet, a French company. However, in 2015 the
project has been stalled. It is unclear if and when
the project will be finalised.
Hydropower forms the backbone of Nigeria’s
electricity generation capacity. As dams require
extensive maintenance some of them are only
partly operational reducing their contribution to the
overall electricity generated. The World Bank, in its
report “Low-Carbon Development Opportunities for
Nigeria”, which captured the plans of the Federal
government and feedback from stakeholders,
highlights the plans to increase hydropower
utilisation to 7,2 GW by 2035, following the
Renewable Energy Master Plan of 2012 (WB, 2013).
As shown in Figure 3.2, various dams are available
for retrofitting with hydropower plants.
There are numerous plans and initiatives for grid-
connected renewable installations (see Annex D).
The majority of these plans are still in an early
development stage, with most just completing
the Environmental Impact Assessment. In total six
wind energy, one hybrid solar-wind, 38 solar, nine
hydroelectric, nine biofuel and four waste to energy
and biomass projects have been identified. See
Annex D for a full overview of projects. The reality
Name of Licensee Capacity (MW) Fuel Type State Geopolitical Zone
JAP Energy Limited 504 Biomass Lagos South-West
Premier Energy Limited 50 Hydrogen fuel cell Adamawa North-East
Rook Solar Investment Limited 50 Solar Osun South-West
Quaint Global Nigeria Limited 50 Solar Kaduna North-West
Nigeria Solar Capital Partners 100 Solar Bauchi North-East
Anjeed Kafanchan Solar Limited 10 Solar Kaduna North-West
Lloyd and Baxter LP 50 Solar Abuja North-Central
KVK Power Pvt Limited 50 Solar Sokoto North-West
Pan African Solar 54 Solar Katsina North-West
Mabon Limited 39 Hydro Gombe North-East
JBS Wind 100 Wind Plateau North-Central
Table 3.8 Renewable
Energy projects with a
license from NERC
(CRET, 2015)

56
Market Study and Project Scouting Nigeria
in Nigeria may be that most of the planned projects
will not be implemented. So far eleven project
proposals have received a NERC license (table 3.8).
Mid-2016 NBET has approved solar PPAs with 14
developers which are reported to have the potential
of adding about 1.125 MW in capacity to the grid.
The fact that there is now a 20-year NBET-agreed
tariff of $ 0,115 per kWh (€ 0,0978) for large solar
grid-connected generators outside the REFIT
Regulations, could encourage an influx of project
developers interested in the Nigerian electricity
sector. Some of the current projects that received a
PPA include: Nigeria Solar Capital Partners’ 135 MW
plant in Bauchi State; the Pan Africa Solar project
for the development of a 75 MW solar photovoltaic
power project located in Katsina State; the Nova
Scotia power project and CDIL project for the
development of a 80 MW plant in Jigawa State; and
the 383 kW Solar PV plant hybrid technology being
built by General Electric in Kaduna State.
No embedded20 renewable energy power projects,
operational, under construction or planned have
been identified.
Off-gridThere are many different off-grid renewable energy
solutions. These can be grouped into:
» Solar-Home-Systems (up to 100 kW) and solar
appliances (lamps, phone chargers and etcetera).
» Mini-grids, typically supplying smaller commu-
nities (e.g. rural areas; industrial clusters or
residential estates) with electricity through inde-
pendent electricity distribution network systems.
The electricity can be generated by solar, wind or
other renewable sources or a hybrid system.
» Captive power21; electricity and other power
20) Electricity is evacuated through a transmission network oper-
ated by a System Operations Licensee (DisCo).
21) In Nigerian regulations Captive Power is defined as: the
generation of off-grid electricity that is entirely consumed by the
generator itself and has an installed capacity exceeding 1 MW.
that is entirely consumed by the generator itself.
This can be schools, hotels, offices and industrial
companies.
» Small-scale stand-alone renewable energy
systems (e.g. for water pumping)
» Clean cookstoves, using solid biomass (pellets,
briquettes or alternative charcoal) or liquid
biofuels (e.g. bio ethanol).
Off-grid renewable electricity solutions are useful
in Nigeria in view of some topographical or
geographical challenges in the rural areas (notably
long distance to the grid and low population
densities) which make it uneconomical to extend
the grid to such areas.
In the 1990s, the Energy Commission of Nigeria
(ECN) and the former Federal Ministry of Power
and Steel pioneered the installation of off-grid
solar PV in Nigeria, including mini-grids and stand-
alone systems for residential, irrigation and cooling
purposes. However, only recently renewable energy
based off-grid electrification has been addressed
more comprehensively. In 2014 the Federal Ministry
of Power launched the initiative Operation Light-
up Rural Nigeria, which was aimed at utilizing
renewable energy for electrifying rural communities
in all 36 States in the country including the
Federal Capital Territory (FCT), but in 2015 this
initiative was terminated. In recent years, the
Rural Electrification Agency (REA) and the Federal
Ministry of Environment (FME) have also started
developing activities using solar PV for social uses.
Solar Home Systems (SHS)There is a huge market for SHS22, rooftop
installations, solar lights and solar phone chargers23,
due to the unreliable supply of power by the
utilities and increasing electricity prices. As a result,
22) Examples of companies active in this market are: SME Fund,
Lumos, Arnergy, Solynta, Rubitec and many others.
23) Examples of companies active in this market are: d.light,
Barefoot Power, Rubitec and many others.
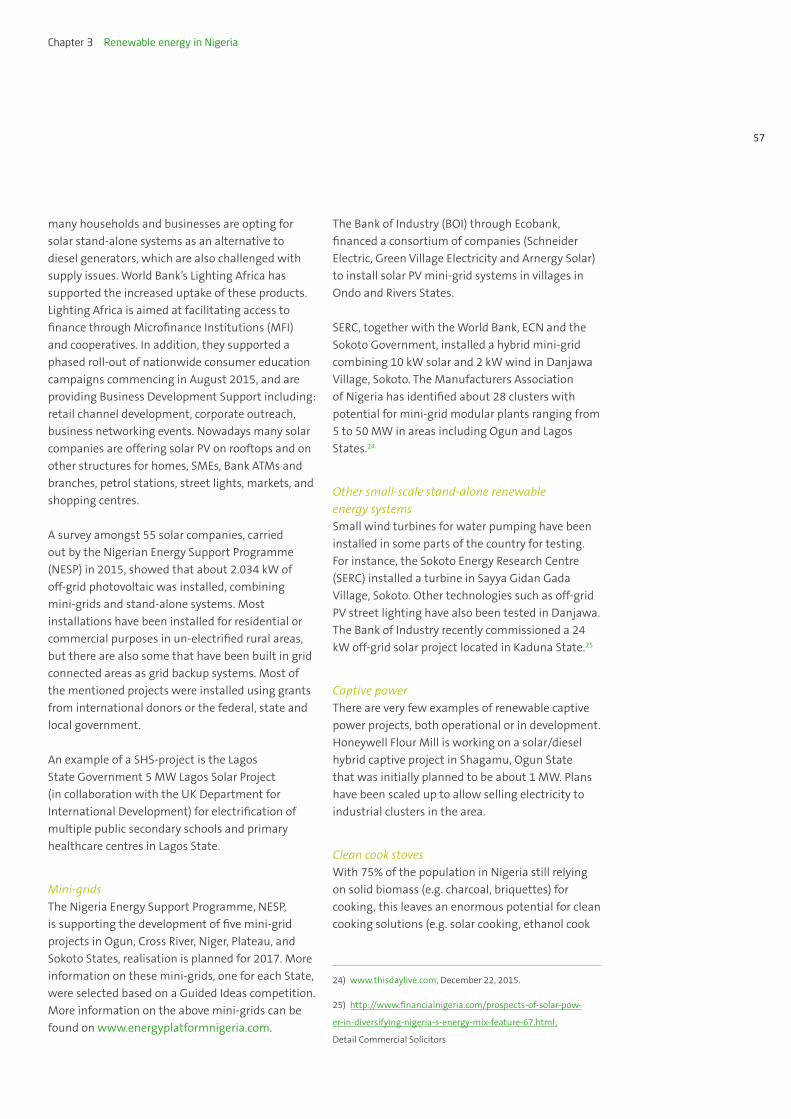
57
Chapter 3 Renewable energy in Nigeria
many households and businesses are opting for
solar stand-alone systems as an alternative to
diesel generators, which are also challenged with
supply issues. World Bank’s Lighting Africa has
supported the increased uptake of these products.
Lighting Africa is aimed at facilitating access to
finance through Microfinance Institutions (MFI)
and cooperatives. In addition, they supported a
phased roll-out of nationwide consumer education
campaigns commencing in August 2015, and are
providing Business Development Support including:
retail channel development, corporate outreach,
business networking events. Nowadays many solar
companies are offering solar PV on rooftops and on
other structures for homes, SMEs, Bank ATMs and
branches, petrol stations, street lights, markets, and
shopping centres.
A survey amongst 55 solar companies, carried
out by the Nigerian Energy Support Programme
(NESP) in 2015, showed that about 2.034 kW of
off-grid photovoltaic was installed, combining
mini-grids and stand-alone systems. Most
installations have been installed for residential or
commercial purposes in un-electrified rural areas,
but there are also some that have been built in grid
connected areas as grid backup systems. Most of
the mentioned projects were installed using grants
from international donors or the federal, state and
local government.
An example of a SHS-project is the Lagos
State Government 5 MW Lagos Solar Project
(in collaboration with the UK Department for
International Development) for electrification of
multiple public secondary schools and primary
healthcare centres in Lagos State.
Mini-gridsThe Nigeria Energy Support Programme, NESP,
is supporting the development of five mini-grid
projects in Ogun, Cross River, Niger, Plateau, and
Sokoto States, realisation is planned for 2017. More
information on these mini-grids, one for each State,
were selected based on a Guided Ideas competition.
More information on the above mini-grids can be
found on www.energyplatformnigeria.com.
The Bank of Industry (BOI) through Ecobank,
financed a consortium of companies (Schneider
Electric, Green Village Electricity and Arnergy Solar)
to install solar PV mini-grid systems in villages in
Ondo and Rivers States.
SERC, together with the World Bank, ECN and the
Sokoto Government, installed a hybrid mini-grid
combining 10 kW solar and 2 kW wind in Danjawa
Village, Sokoto. The Manufacturers Association
of Nigeria has identified about 28 clusters with
potential for mini-grid modular plants ranging from
5 to 50 MW in areas including Ogun and Lagos
States.24
Other small-scale stand-alone renewable energy systemsSmall wind turbines for water pumping have been
installed in some parts of the country for testing.
For instance, the Sokoto Energy Research Centre
(SERC) installed a turbine in Sayya Gidan Gada
Village, Sokoto. Other technologies such as off-grid
PV street lighting have also been tested in Danjawa.
The Bank of Industry recently commissioned a 24
kW off-grid solar project located in Kaduna State.25
Captive powerThere are very few examples of renewable captive
power projects, both operational or in development.
Honeywell Flour Mill is working on a solar/diesel
hybrid captive project in Shagamu, Ogun State
that was initially planned to be about 1 MW. Plans
have been scaled up to allow selling electricity to
industrial clusters in the area.
Clean cook stovesWith 75% of the population in Nigeria still relying
on solid biomass (e.g. charcoal, briquettes) for
cooking, this leaves an enormous potential for clean
cooking solutions (e.g. solar cooking, ethanol cook
24) www.thisdaylive.com, December 22, 2015.
25) http://www.financialnigeria.com/prospects-of-solar-pow-
er-in-diversifying-nigeria-s-energy-mix-feature-67.html;
Detail Commercial Solicitors

58
Market Study and Project Scouting Nigeria
stoves or pellet cook stoves). A number of initiatives
and companies are active in this field (e.g. SME
Fund, Green Social Bioethanol) and stoves and fuels
are being distributed in large quantities and also
through Micro Finance Banks (MFBs).
Key renewable energy stakeholders
The key renewable energy stakeholders that
are active in Nigeria can be grouped in: public
authorities, private sector, foreign development
cooperation organisations, development banks and
key players in research, capacity development and
training.
Public authoritiesIn the renewable energy sector of Nigeria, the
Federal Ministry of Power has the leadership
position in terms of policy and regulation
formulation. Two other important Ministries are the
Federal Ministry of Environment and the Federal
Ministry of Water Resources. In addition, NERC,
ECN, NBET and TCN are important stakeholders.
Table 3.9 presents the functions of the different
public authorities that play a role in the renewable
energy sector.
Private sector actorsA large number of private companies, both local
and foreign, is active in the renewable energy
sector in Nigeria. No sole local contractor or
project developer is currently deemed capable of
implementing medium or large scale renewable
energy projects. As the sector is getting traction
and knowledge and experience are building
up, amongst others due to the involvement of
foreign companies, this may change. Local actors
are available for example for civil and electrical
engineering, cable manufacturing, legal support,
management consulting and E(S)IA studies. For
solar installations a pool of solar PV technicians and
installers is readily available.
Since the privatisation of the sector in 2015, a
large number of foreign investors, developers,
and consulting and engineering companies have
become active in the Nigerian renewable energy
market. Some have acquired DisCos and GenCos.
In recent years also some industry associations have
become more and more active:
» The Council for Renewable Energy (CREN) is a not
for profit, multi-stakeholder association, which
promotes the appropriate use of renewable
energy technology in Nigeria.
» Nigeria Alternative Energy (NAE) is
a global consortium with the vision
of increasing capacity in Nigeria with alter-
native energy solutions. The network is dedicated
to the use of renewable energy and energy
efficiency.
» The Renewable Energy Association of Nigeria
(REAN) has been launched in 2016 and focuses
on decentralised renewable energy, specifically
related to energy access.
Foreign development cooperation organisations and development banksA number of different international donors and
organisations are active in the renewable energy
sector in Nigeria. The major bilateral implementing
agencies with offices in Nigeria are26:
» Agence Française de Développement (AFD),
French development cooperation agency
» Department for International Development
(DFID), British development cooperation organi-
sation
» Deutsche Gesellschaft für Internationale
Zusammenarbeit (GIZ) GmbH, German Agency
for International Cooperation
» Japan International Cooperation Agency (JICA)
26) GIZ, 2015

59
Chapter 3 Renewable energy in Nigeria
Table 3.9 Public authorities
in the renewable energy
sector in Nigeria (GIZ, 2015)
Main actors Functions Role in Renewable Energy
Federal Ministry of Power (FMP)
FMP is responsible for policies, programs andmonitoring of the power sector in the country.
To promote a diversified electricity mix for the country including electricity generated from renewable energysources.Drafted the National Renewable Energy and Energy Policy and leads the Inter-ministerial Committee on Renewable Energy and Energy Efficiency (ICREEE)
Federal Ministry of Environment (FMENV)
The FMENV prepares comprehensive national policies for the protection of the environment and conservation of natural resources, including procedure for environmental impact assessment of all developing projects
Plays a secondary role, as it has no direct mandate in the power sector. It approves ESIA. In addition, FMENV grants tax holiday for utility scale PV plants.
Federal Ministry of Water Resources (FMWR)
The FMWR formulates National Water Resources policies towards ensuring adequate water supply for agricultural, industrial, recreational, domestic and other uses. It develops programmes and policies towards surface water storage schemes and guiding principles for dam construction nationwide
Role in hydro development (e.g. dam construction, hydrological activities etc.). Currently, the FMWR undertakes civil works on hydropower stations in cooperation with the FMP.
Nigerian Electricity Regulatory Commission (NERC)
NERC is a key organisation responsible for regulation of the power sector across power generation, transmission and distribution. NERC is responsible for the creation of a competitive power sector; establishment of operating codes and standards; licensing and regulation of persons engaged in any of the power subsector activities; tariff determination; approval of amendments to electricity market rules; and other related regulatory functions. It is governed by seven commissioners, six from geopolitical regions and one designated Chairman/Chief Executing Officer (CEO).
NERC issues generation licenses to applicants in Renewable Energy and administers and implements preferential tariffs (e.g. the MYTO feed-in tariffs).
Energy Commission of Nigeria (ECN)
ECN’s role as per the ECN Act is mainly research, data gathering and coordination.
The commission promotes the use of renewables and alternative energies via research, pilot project and strategy development. These ECN activities are carried out by the departments at its head office and the Energy Research Centres located at Nsukka, Sokoto, Lagos, Bauchi, Ilorin and Benin.
Nigerian Bulk Electricity Trading Plc (NBET)
NBET is the off-taker o electricity and inter alia concludes PPAs. NBET receives payments fromDISCOs for energy received and pays generation companies for bulk power sent to the grid.
Enter into and execute PPAs with power generating companies and procure new generation capacity on competitive basis, as required.
Transmission Company of Nigeria (TCN)
State entity responsible for the transmission of electricity from power plants to distribution companies, eligible customers and for export.Acts as Transmission Services Provider (TSP), System Operator (SO) and Market Operator (MO).Managed by Manitoba Hydro International of Canada under a three year management contract.
TCN is responsible for grid-connection agreements and may assist in the determination of MW targets for renewable energy

60
Market Study and Project Scouting Nigeria
» United States Agency for International Devel-
opment (USAID)
» The DFID-supported Nigeria Infrastructure
Advisory Facility (NIAF)
Besides the bilateral agencies, different
development banks are active in Nigeria. The
following are active in projects related to
renewables:
» African Development Bank (AfDB)
» International Finance Corporation (IFC)
» Word Bank (WB) – Lighting Africa
More information on these organisations is
provided in Annex K.
Key players in research, capacity development and trainingSeveral pilot projects, surveys and studies have been
undertaken under the supervision of the Energy
Commission of Nigeria, which has registered five
energy research centres. Four centres are dedicated
to renewable energy and energy efficiency:
» National Centre for Energy Research and Devel-
opment (NCERD), at the University of Nigeria,
Nsukka (research in solar and renewable energy).
» Sokoto Energy Research Centre (SERC), at Usmanu
Danfodiyo University, Sokoto (research in solar
and renewable energy).
» National Centre for Hydropower Research and
Development (NCHRD) at the University of Ilorin
(research in hydropower).
» The National Agency for Science and Engineering
Infrastructure (NASENI) advises the science
and engineering community and SMEs to take
advantage of the facilities available to fast-track
their manufacturing processes and upgrade their
Research and Development (R&D) knowledge.
» The National Power Training Institute of Nigeria’s
(NAPTIN) primary purpose is to provide training for
power sector personnel and coordinate training
activities in the sector. In pursuit of this mandate,
NAPTIN has taken over the management of
existing seven regional training centres of PHCN.
Policies and regulations
In chapter 2 (page 42) the relevant policies and
regulations for the power sector in general have
been summarised. In the following paragraphs the
most important policies and regulations regarding
renewable energy in Nigeria are summarized in
chronological order.
Renewable Electricity Policy Guidelines 2006 (REPG)This policy provided the Federal Government
vision, policies and objectives for all electricity from
renewable sources. This REPG document was issued
in 2006 by the then Federal Ministry of Power and
Steel. The document stated that the government
will expand the renewable electricity market to
at least 5% of total electricity generated and a
minimum of 5 TWh of electricity production by
2016. The National Renewable Energy and Energy
Efficiency Policy (NREEEP) has replaced the REPG,
which has been approved by the Federal Executive
Council in 2015.
Renewable Electricity Action Programme (REAP), 2006This is a corresponding policy document by the then
Federal Ministry of Power and Steel produced in
2006 as well. This programme seems to have been
abandoned with the restructuring of the Federal
Ministry of Power and Steel to the Federal Ministry
of Power.

61
Chapter 3 Renewable energy in Nigeria
The main focus of this document is utilising all
forms of renewable energy sources for electricity
generation. It highlights potential gaps, technical
assessments and the financial implications of
utilising renewable energy and looks at the general
overview of the potentials for renewable energy
technologies, and potential markets, elaborating
on the development targets per technology,
application and strategies for achievement.
National Biofuel Policy and Incentives (2007) This is a policy document that came about during
the peak interest in liquid biofuels. Hence it was
meant to support a biofuel programme, with the
aim of integrating the agricultural sector of the
Nigerian economy, as well as the downstream
sector of the petroleum industry.
The major targets of this policy documents are:
» All biofuels companies to contribute 0,25% of
their revenue to fund research into feedstock
production, development of local technology and
improved farming practice.
» Granting an import waiver for biofuels for ten
years and exemption from taxation for biofuel
companies in Nigeria.
» The biofuel programme aspired to achieve 100%
domestic production consumed in Nigeria by
2020, with off-take guarantee from the NNPC, as
buyer of last resort.
Although this policy appears to be in force, no
information is available as to which extent it has
been implemented or adapted. The supposed major
player in this area, NNPC has only performed some
feasibility studies on ethanol, cassava and palm-oil
based production and only mentions a handful of
projects and initiatives on its website.
Renewable Energy Master Plan (REMP), 2012The REMP was drafted by the Energy Commission
of Nigeria (ECN), supported by the United Nations
Development Programme (UNDP), in 2005
and reviewed in 2012. The document projects
Nigeria’s vision and lays out a road map for the
increased role of renewable energy in attaining
sustainable development. Though there is no
clear differentiation between on-grid and off-grid
generation, it refers to integrating renewable
energy into buildings, electricity grids and other
distribution systems (ECN, 2014).
The 2005 version is an approved document, which
sets out short, medium and long-term targets for
renewable energy sources in the national energy
mix. However, the revised 2012 version has not
been approved by the Federal Government. The
National Renewable Energy and Energy Efficiency
Policy (NREEEP) replaces REMP.
REMP is solely dedicated to the utilization of
renewable sources of energy. It identifies Nigeria’s
potential for generating electricity from solar, small
and large hydro, biomass and wind across the
country. REMP also focuses on the gradual move
away from a fossil based economy, to one driven by
an increased share of renewable energy, combined
with the need for private sector participation.
National Renewable Energy and Energy Efficiency Policy (NREEEP), 2015The National Renewable Energy and Energy
Efficiency Policy (NREEEP), is a document developed
by the Federal Ministry of Power in 2013 and 2014
and has been approved by the Federal Executive
Council in 2015 (FMP, 2015). The NREEEP seeks the
development of a national renewable energy action
plan and a national energy efficiency action plan to
stimulate the overall achievement of the objectives
set out by this policy. The National Renewable Energy
Action Plan was published in July 201627.
27) Available for download at the website of the Ministry of
Power: http://www.power.gov.ng/Press%20Release/NATIONAL%20
RENEWABLE%20ENERGY%20ACTION%20PLANS%20(NREAP).pdf

62
Market Study and Project Scouting Nigeria
NREEEP outlines the national thrust of the policies
and measures for promoting renewable energy and
energy efficiency. The document aims to draw the
attention of policy makers to the political, social
and economic potentials of renewable energy and
prescribes that appropriate strategies should be de-
veloped to harness these potentials so as to add value
to the ongoing changes in the power sector of Nigeria.
NREEEP calls for an integrated renewable energy
and energy efficiency policy. NREEEP seeks to
consolidate all previous policies and strategies
in one document, hence it can be considered
an umbrella document. Recognising the multi-
dimensional nature of energy, NREEEP delves into
several issues like renewable energy utilisation and
supply, pricing and financing, legislation, regulation
and standards, energy efficiency and conservation,
research and development, training and capacity
building. Furthermore, it acknowledges gender,
environmental issues, as well as planning and policy
implementation. Overall the focus of this policy
document is to fully utilise the renewable energy
resources of Nigeria for sustainable development
and to meet the renewable energy generation and
energy efficiency targets for ECOWAS for 2020 and
beyond.
National Renewable Energy Action Plan (2016) The National Action Plan presents the expected
development and expansion of renewable energies
in Nigeria in order to achieve the national target
under ECOWAS Renewable Energy Policy (EREP), and
thus Nigeria’s contribution to the overall ECOWAS
target of 23% and 31% renewable energy in 2020
and 2030. It contains existing and currently planned
measures, with which the national target is to
be achieved. The NREAP specifies targets for the
Nigerian energy sector (on-grid, off-grid, cooking
energy, solar water heaters and liquid biofuels) in
2020 and 2030, as well as the 2010 baseline. The
implementation of the NREAP will be monitored by
the Federal Ministry of Power, Works and Housing.
Table 3.10 Summary
of renewable electricity
targets (GIZ, 2015)
The figures shown in the table are original figures from the source. Figures in (green) are obviously arithmetically wrong.
** The projection for “all energy resources (on-grid power plus 12,500 MW of self-generated power)” is based on the addition of on-grid power, and a base capacity of 12,500 MW
of self- generation (i.e. power generated for own use) including off-grid generation from year 2012 to 2030.
S/N 2012 [MW]Short Term (2015) [MW]
Medium Term(2020) [MW]
Long Term(2030) [MW]
1 Hydro (LHP) 1,938.00 2,121.00 4,549.00 4,626.96
2 Hydro (SHP) 60.18 140.00 1,607.22 8,173.81
3 Solar 15.00 117.00 1,343.17 6,830.97
4 Biomass – 55.00 631.41 3,211.14
5 10.00 50.00 57.40 291.92
All renewables plus LHP(1,985.18)2,023.18
(2,438.00)2,483.00
8,188.20 23,134.80
All energy resources (on-grid power plus12,500MW of self-generated power)
21,200** 24.380** 45,490** 115,674**
% of renewables incl. LHP (23%) 10% 18% 20%
% renewable energy excl. LHP 0.80% 1.30% 8% 16%

63
Chapter 3 Renewable energy in Nigeria
Challenges for renewable energy solutions in Nigeria
The development of renewable energy solutions
in Nigeria, both grid-connected and off-grid, faces
several challenges. In the following, the main
challenges to this development are summarized:
» Capabilities and know-how of local private
sector: No sole national contractor or project
developer is currently deemed capable of imple-
menting a medium or large scale renewable
energy project. The sector, in cooperation with
foreign companies and financiers, is working hard
to gain the competence to design, build, operate
and maintain larger renewable energy installa-
tions.
» Regulatory framework: There is still a consid-
erable amount of uncertainty with respect to
the regulations as it relates to off-grid projects.
An example of uncertainty in the regulations is
whether isolated IEDNs can exist within a DisCos
franchise area.
» Resistance from existing market players: There is
a likelihood of objections to the grant of off-grid
licences from DisCos in the areas currently
covered by DisCo licences.
» Access to land: For renewable energy, there must
also be access to land for project construction,
mostly in the case of solar PV and large hydro-
power.
» Financing and other considerations: Establishing
medium or large scale renewable energy instal-
lations is capital intensive with long pay back
periods, and acquiring finance for these projects,
especially early stage finance for project devel-
opment, is not easy.

64
Market Study and Project Scouting Nigeria

65
Nigeria’s manufacturing sector is one of the major
driving forces behind the country’s economic
growth. In light of the plunge in global oil prices,
this sector becomes even more significant for
Nigeria. The manufacturing sector accounted for
9% of GDP (€ 40 billion) during 2013. Growth in the
sector has been rapid at a pace of almost 18% p.a.
during 2011–13, although it is hampered by supply
bottlenecks, including disruptions to the electricity
supply. In total the manufacturing industry grew
63% in the period 2010–2013 (KPMG, 2015). The
food, beverages and tobacco sub-sector is the
biggest, accounting for more than half of nominal
factory output (see the Figure below).
The manufacturing sector in Nigeria is divided into
10 sub-sectors:
1. Food and beverage & tobacco
2. Chemical and pharmaceutical products
3. Non-metallic products
4. Base metal,iron & steel
5. Automotive
6. Pulp and paper products
7. Textile, apparel and footwear
8. Plastic and rubber products
9. Wood and wood products
10. Other manufacturing
CHAPTER 4 NIGERIAN MANUFACTURING INDUSTRY
Figure 4.1 Manufacturing
industry usage of raw and
intermediate materials
Intermediate goods are producer goods or semi-finished products
Nigeria Manufacturing: Raw & Intermediate Materials Usage ($bn)
Raw Materials: Domestic Supply
Raw Materials: Imported Intermediate Goods
2010 2011 2012 2010 2011 2012 2010 2011 2012
Food, beverages & tobacco 1.7 2.7 3.8 4.5 5.9 5.9 19.8 19.7 22.0
Textiles, apparel & footwear 8.5 8.5 8.7 3.1 3.8 4.3 3.2 4.3 5.4
Wood & wood products 0.0 0.0 0.0 0.0 0.0 0.0 0.7 0.7 0.7
Pulp, paper & paper products 0.1 0.1 0.1 0.1 0.1 0.1 0.2 0.3 0.3
Chemical & pharmaceutical products 33.2 18.6 12.9 8.5 9.2 9.9 0.3 0.3 0.5
Other non-metallic products 1.5 2.7 2.8 0.5 1.0 1.1 0.9 0.9 1.1
Plastic & rubber products 0.2 0.3 0.4 0.2 0.3 0.5 0.5 0.6 0.9
Base metal, iron & steel 1.4 1.1 1.3 1.1 0.7 1.1 0.5 0.7 0.7
Motor vehicles & assembly 1.3 1.7 2.3 1.0 5.2 1.2 0.0 0.0 0.0
Other manufactures 0.6 3.2 3.3 0.2 1.9 1.6 0.7 1.0 1.3
Total 48.6 39.1 35.7 19.2 28.2 25.6 26.9 28.6 33.0
Source: Nigeria’s National Bureau of Statistics (NBS)
Latest available data, published October 2014

66
Market Study and Project Scouting Nigeria
The manufacturing sector has shown strong
growth in recent years. Nonetheless, the
sector faces ongoing challenges, including an
inadequate electricity supply, poor infrastructure
and plant maintenance, and heavy dependency
on agricultural inputs, which themselves are
vulnerable to shocks. Its strengths are nonetheless
abundant; semi-skilled yet low paid workforce, the
availability of domestically sourced inputs and most
importantly, a huge domestic demand for consumer
products. It therefore displays great potential for
future expansion.
The food, beverages and tobacco sector is
the largest contributor (50,44%) to the total
manufacturing output, followed by textiles apparel
and footwear representing (18,82%). In the food,
beverages and tobacco sub-sector, the largest
contributor to total manufacturing output is sugar
manufacturing which constituted 44,20% of the
sub-sector’s total in 2012, and contributed the
majority of the growth in the entire manufacturing
sector at 27,59% in 2012. Bread production is the
second largest contributor at 21,52% to the sub-
sector and 13,43% of the manufacturing total
output in 2012. This is followed by rice representing
12,41% of total output, and biscuits constituting
8,21% in 2012 (NBS, 2014).
Staple Crop Processing Zones (SCPZs)In the food, beverages and tobacco sub-sector,
Nigeria already produces amongst others, large
volumes of cassava, palm oil, rice, cocoa, cowpea,
groundnuts, maize, and sweet potatoes. This is
further stimulated by federal policies. An important
policy is on establishing Staple-Crop Processing
Zones (SCPZs). The Federal Executive Council (FEC)
in May 2015 approved the National Policy on Staple
Crops Processing Zones to guard the development,
management and operation of these zones in the
country. Currently, there are 14 SCPZs, located in
six states (Kogi, Kano, Lagos, Anambra, Enugu and
Niger). Main objectives of the SCPZ are to develop
commercial agriculture; to attract private sector
food processing companies into rural areas; to add
value to staple food crops; to reduce post-harvest
losses; to reduce Nigeria’s dependence on food
imports; create jobs and revive the rural economy.
However, there is an immense deficit of electricity
supply along the value chain of these crops
especially in the processing. SCPZs are focused on
attracting private sector agribusinesses to set up
processing plants in zones of high food production,
and to process commodities into food products.
Government has put in place appropriate fiscal,
investment and infrastructure measures for SCPZs,
such as:
» Tax breaks on import of agricultural processing
equipment
» Tax holidays for food processing companies
» Complimentary investments by government in
infrastructure (e.g. transport and logistics, power
and irrigation and flood control)
Energy consumption in the manufacturing sectors
From Figure 4.3 it can be seen that only 3–4% of the
energy consumption of the Nigerian manufacturing
industry is coming from grid-connected electricity.
The majority of the energy consumption is using
‘biofuels and waste’. In the IEA definitions (see
Annex I), ‘Biofuels and Waste’ is comprised of solid
biomass, liquid biofuels, biogases, industrial waste
and municipal waste. The huge contribution of
biofuels and waste in the energy consumption
statistics is likely a result of the huge informal and
non-mechanised sector in Nigeria (70% of all jobs)
and their dependence on cheap solid biomass
fuels (briquettes, fuelwood and charcoal) and
agricultural waste (shells, stems, leaves, cobs, fibre
and sawdust).
However, also the formal sector is consuming
large amounts of energy, not being grid-connected
electricity. They often depend on a mix of grid-
connected electricity and self-generation capacity,
using diesel and gas.

67
Chapter 4 Nigerian manufacturing industry
Figure 4.2 Manufacturing
Industry energy
consumption in 2009–
2013 (in ktoe) (Source: IEA
statistics www.iea.org)
In 2007, the Manufacturers Association of Nigeria
(MAN) carried out a power and energy consumption
survey in which power demand for the sector was
projected for a period of five years. In total 1.500
industrial units spread across the country were
surveyed. However, the report flawed in certain
ways, according to the Scoping Study: Energy
Efficiency in the Manufacturing Sector in Nigeria
(2014) by the Nigerian Energy Support Programme
(NESP, 2014) “It is important to note that the survey
data revealed some loop holes; some extrapolation
is missing, creating gaps between capacity installed,
energy consumption and the geographic distribution
of the industries. The survey data was nevertheless
used as it provides at the same time a vital overview
about energy user patterns in the industrial clusters.”
From Figure 4.3, it can be seen that the food &
beverage sector is, together with the chemicals &
pharmaceuticals sector, the largest consumer of
power.
Self-generation capacity
Due to irregular power supply and the need for
manufacturing industries to sustain production,
Nigerian manufacturers have resorted to the use
of diesel and gas for their energy needs. Estimates
suggest that between 8 and 14 GW of decentralised
diesel generator capacity is currently installed in the
country.
Figure 4.4 shows the self-generation in each of
Nigeria’s manufacturing sub-sectors.
Without discussing the total volume required by
Nigeria’s manufacturing sector, the scoping study
distributes the diesel requirement sector-wise as
illustrated in Figure 4.5.
10.000
9.000
8.000
7.000
6.000
5.000
4.000
3.000
2.000
1.000
0
Coal Oil products Natural gas Electricity TotalBiofuels and waste
2012
2013
2011
2010
2009

68
Market Study and Project Scouting Nigeria
Figure 4.4 Installed
self-generation capacity
in Nigerian industry
(Source: Scoping Study:
Energy Efficiency in the
Manufacturing Sector in
Nigeria (NESP, 2014))
Figure 4.5 Distribution
of diesel consumption
of Nigeria’s industrial
subsector (NESP, 2014)
20.00
18.00
16.00
14.00
12.00
10.00
8.00
6.00
4.00
2.00
0.00
Food & Bevera
ge
Basic M
etal, I
ron &
Steel
Textil
e, Apparels
& Leath
er
Chemica
ls & Pharm
aceutic
als
Pulp & Paper P
roducts
Plastic &
Rubber Pro
ducts
Non-Meta
llic Pro
ducts
Autom
otive
Wood &
Wood Pro
ducts
Installed Self-Generation Capacity (MVA)
Food & Beverage
Chemicals & Pharmaceuticals
Non Mettallic Products
Basic Metal, Iron & Steel
Automotive
Pulp & Paper Products
Textiles, Apparel & Leather
Plastic and Rubber Products
Wood & Wood Products
22%
21%
15%
17%
6%
14%
2%
Figure 4.3 Percentages of
power consumption per
sector (MAN, 2007) Food & Beverage
Chemicals & Pharmaceuticals
Non Mettallic Products
Basic Metal, Iron & Steel
Automotive
Pulp & Paper Products
Textiles, Apparel & Leather
Plastic and Rubber Products
Wood & Wood Products
21%
21%
17%
13%
12%
5%
5%4% 2%

69
Chapter 4 Nigerian manufacturing industry
Figure 4.6 Nigeria gasoline
prices in 2016 (www.
tradingeconomics.com)
Figure 4.7 Estimated
energy costs captive power
for food and beverage
companies in Nigeria
(Sources: Oladokun, 2015,
interviews with food and
beverage companies, (ODI,
2016))
Energy costs and security of supply
Based on the interviews with food and beverage
companies, it seems electrical power is mainly
produced using diesel or gas, with smaller
companies mainly using diesel generators.
In the first half of 2016, the supply of diesel and gas
was irregular impacting the fuel price. In April 2016
the diesel price was at an all-time high level. Since
then availability and prices have normalised again.
For manufacturing companies, access to and cost of
energy are both important. The inadequate supply
of grid-connected electricity is the main reason for
industry to generate power themselves. The grid-
connected electricity is used when available, as
Nigeria Gasoline Prices
Estimated energy Costs (€ cents / kWh)
0.75
0.7
0.65
0.6
0.55
0.5
0.45
0.4Jan 2015 Apr 2015 Jul 2015 Oct 2015 Jan 2016 Apr 2016 Jul 2016
40
35
30
25
20
15
10
5
0diesel CNG CNG piped
32
13
9
23,4
19,3
14,5 14,5
Bioenergy Off-grid Solar-PV
FIT Solar-PV grid power

70
Market Study and Project Scouting Nigeria
Customer Classification
Description Remarks
Special
A1Single and 3 Phase
Customers such as agriculture and agro-allied industries, water boards, religious houses, hospitals, government research institutes and educational establishments.
A2LV Maximum Demand
A3HV Maximum Demand
Table 4.2 Tariff classes
typically relevant for
agricultural, food and
beverage companies
(NERC)
the costs for this electricity is much lower than the
self-generated power. Figure 4.7 presents estimated
prices of different energy solutions. From this
figure it shows that the price for renewable off-grid
solutions is competitive when substituting diesel
generators. Also (large-scale) solar-PV is competitive
with grid electricity (with the new MYTO tariffs) and
coming close to CNG.
The above estimates are current Total Cost of
Ownership cost, using a genset of > 100 KVA. The
grid power costs are based on the different DisCo
tariffs.
Grid electricity prices – MYTOSince privatisation of the energy sector, electricity
prices have been set by the Multi-Year Tariff Order
(MYTO). The consumer pays a set price per region
and consumer category to the local DisCo. For
consumer categories, a distinction is made between
private, commercial, and industrial customers.
The energy bill for customers is made up from two
elements: a fixed charge and an energy charge.
The fixed charge covers the capital goods and
operational fixed costs, while the energy costs cover
the costs of consumption (fuel costs, variable costs,
maintenance costs, tax). In Table 4.3, the energy
charges per consumer group are presented for
Abuja and Jos DisCos. Web links to the tariffs for the
other DisCos are provided in Annex H.
Agricultural, food and beverage companies fall
under customer classification ‘Special’. Table 4.3
shows that a ‘Special’ industrial customer with a
single phase and 3 phase connection pays NGN
23,16 (€ 0,10) in the Abuja district and NGN 25,63
(€ 0,11) in the Jos district per kWh of electricity
in 2015. In 2016 both prices have increased
respectively with 51% and 59%. For all DisCos, the
new tariffs have increased significantly, on average
45%. For some DisCos (Abuja DisCo), the published
tariffs will steadily increase until 2017 or 2018 and
then decrease again. For some (Abuja DisCo) the
tariffs will steadily increase for almost the entire
period of ten years.

71
Chapter 4 Nigerian manufacturing industry
Customer Classification
Abuja DisCo (Naira/kWh) Jos DisCo (Naira/kWh)
2015 2016 2017 2018 2019 2015 2016 2017 2018 2019
Residential
R1 4,00 4,00 4,00 4,00 4,00 4,00 4,00 4,00 4,00 4,00
R2 14,70 24,30 24,30 24,03 20,40 16,75 26,93 29,81 30,93 32,05
R3 32,25 46,23 47,09 45,72 38,82 35,70 43,91 45,76 47,64 49,28
R4 32,25 46,23 47,09 45,72 38,82 35,70 43,91 45,76 47,64 49,28
Commercial
C1 23,61 36,65 37,39 36,25 30,78 25,94 38,91 42,64 44,27 45,80
C2 29,98 46,23 47,09 45,72 38,82 33,18 42,61 45,55 47,29 48,92
C3 29,98 46,23 47,09 45,72 38,82 33,18 42,61 45,55 47,29 48,92
Industrial
D1 24,19 35,35 36,07 34,96 29,68 25,94 38,91 42,64 44,15 45,67
D2 31,43 46,23 47,09 45,72 38,82 34,78 39,25 41,54 43,25 44,74
D3 31,43 46,23 47,09 45,72 38,82 34,78 38,37 40,40 41,05 41,50
Special
A1 23,16 35,02 35,74 34,63 29,40 25,63 40,74 44,65 46,23 47,82
A2 23,16 35,02 35,74 34,63 29,40 25,63 40,74 44,65 46,23 47,82
A3 23,16 35,02 35,74 34,63 29,40 25,63 40,74 44,65 46,23 47,82
Street Lighting
S1 19,11 26,84 27,14 26,54 22,53 24,70 41,04 44,98 46,57 48,18
Table 4.3 Electricity prices
in Naira/kWh per customer
type (NERC website, 1 July
2016)

72
Market Study and Project Scouting Nigeria
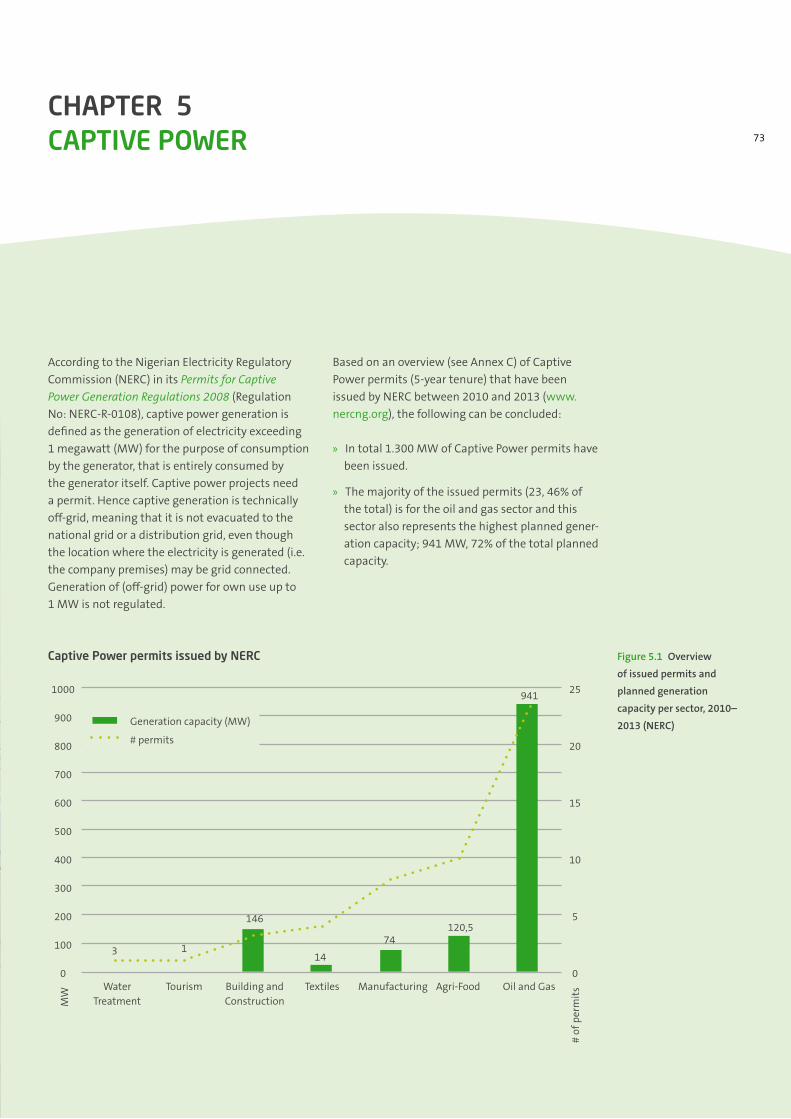
73
CHAPTER 5 CAPTIVE POWER
According to the Nigerian Electricity Regulatory
Commission (NERC) in its Permits for Captive
Power Generation Regulations 2008 (Regulation
No: NERC-R-0108), captive power generation is
defined as the generation of electricity exceeding
1 megawatt (MW) for the purpose of consumption
by the generator, that is entirely consumed by
the generator itself. Captive power projects need
a permit. Hence captive generation is technically
off-grid, meaning that it is not evacuated to the
national grid or a distribution grid, even though
the location where the electricity is generated (i.e.
the company premises) may be grid connected.
Generation of (off-grid) power for own use up to
1 MW is not regulated.
Based on an overview (see Annex C) of Captive
Power permits (5-year tenure) that have been
issued by NERC between 2010 and 2013 (www.
nercng.org), the following can be concluded:
» In total 1.300 MW of Captive Power permits have
been issued.
» The majority of the issued permits (23, 46% of
the total) is for the oil and gas sector and this
sector also represents the highest planned gener-
ation capacity; 941 MW, 72% of the total planned
capacity.
Figure 5.1 Overview
of issued permits and
planned generation
capacity per sector, 2010–
2013 (NERC)
Captive Power permits issued by NERC
1000
900
800
700
600
500
400
300
200
100
0
25
20
15
10
5
0Water
TreatmentTourism Building and
ConstructionTextiles Manufacturing Agri-Food
120,5
941
74
14
146
13
Oil and Gas
# of
per
mit
s
MW
Generation capacity (MW)
# permits

74
Market Study and Project Scouting Nigeria
» 78% of the permits are issued in three states:
Akwa Ibom (22%), Ogun (25%) and Rivers (31%);
the major industrialised and oil and gas states.
» The Agri-Food sector is second with ten permits
and planned generation capacity of 121 MW (9%).
» It is unclear if there are renewable energy
projects amongst these captive power projects
but it seems unlikely.
Rough estimations suggest the total market for self-
generated power in Nigeria is between 14–20 GW.
The total issued licenses and permits that can be
regarded as (off-grid) self-generated power, adds up
to about 1,700 MW. This leaves a huge gap of self-
generated power not accounted for. The most likely
explanation is that the self-generated power is not
included in the overview of licenses and permits
as it has a maximum generation capacity below
1 MW, or licenses ad permits are not obtained or
incorrectly registers.
Figure 5.2 shows the value of diesel gensets that
have been imported into Nigeria in the period
2010–2014. In the past five years about 4.000 diesel
gensets with an output capacity of more than
375 kVA have been imported in Nigeria (based on
calculations using the cost for a 500 kVA genset)
and about 56.000 diesel gensets with an output
capacity between 75–375 kVA have been imported
(based on calculations using the cost for a 100 kVA
genset). With an estimated lifespan of 7,5 years,
one can expect there are at least 2.000 gensets with
output > 375 kVA and 20.000 with output 75–375
kVA still in use in the country. This means at least an
estimated:
» 75.000 gensets with output 75–375 kVA
» 6.000 gensets with output > 375 kVA are still
operational in Nigeria.
The above number of gensets are likely to be an
underestimation as field visits and interviews
suggests the lifespan of many diesel generators is
much longer. The field visits and interviews with
agri-food processing companies suggests enormous
numbers of diesel generators are being used in
small and medium sized enterprises with a power
capacity requirement of 100–500 kW. Also in other
manufacturing sectors, hotels, restaurants, and
etcetera, diesel generators with a capacity between
100–500 kW seem to be abundant.
Figure 5.2: Imported diesel
generators in Nigeria
(Source: own calculations
based on UN COMTRADE
statistics1)
1) www.intracen.org
160
140
120
100
80
60
40
20
0impo
rted
gen
sets
(mill
ion
USD
)
2012
2013
2011
2010
2009141
93
73 72
153
2834
53
38
51
114
90
108
78
114
Generating sets (output ≤ 75 kVA)
Generating sets (output 75–375 kVA)
Generating sets (output ≥ 375 kVA)

75
Chapter 5 Captive Power
Agri-food sectors suited to captive renewable energy
Figure 5.3 provides an overview of the sub-sectors
and processing activities for different agricultural,
dairy and livestock products. Especially the
primary and secondary processing steps have a
relatively high potential for the use of renewable
energy, especially bioenergy. This is because of the
following:
» In the production of primary products (agri-
culture sector), relatively little energy is being
used.
» In primary and secondary processing large
amounts of energy are used and feedstock and
agricultural residues are often available at the
processing location.
» In tertiary processing, large amounts of energy
are used but very limited feedstocks and agricul-
tural residues are available.
In some cases, primary processing is already done
by the farmer. In these instances, this reduces the
potential for using agricultural residues for power
production.
In addition, most often primary and secondary
processing is done in the vicinity of the locations
where the primary products are produced (to
avoid transportation of large volumes of primary
product). This primary product is produced in
rural, often remote, areas with poor access to grid
electricity. Tertiary processing is often done in close
urban areas and / or industrial areas, close to the
customer base or transportation hubs, with often
better access to grid-electricity.
Based on their overall renewable energy potential
in Nigeria (see Tables 3.3 – 3.7), the availability of
biomass at the processing location and existence of
medium and large processing companies, the three
agricultural value chains with the best potential for
captive renewable energy are:
Figure 5.3 Different
processing steps in the
value chain of agricultural
products
Agriculture sector Food processing sector
Primary products Lorem Lorem Lorem
Crop products
Grains and cereals 8.500 Fibre 1,020
Fruits and vegetables Empty bunches 1,955
Grasses (sugar cane and sorghum)
1.170 Palm kernel 0,878
Oil seeds 360.000 Pods 0,188
Beverages (grains / fruits / leaves)
170 Husk 0,072
Dairy products
Milk Shell 0,028
Livestock products
Meat and poultry
143.500 Leaves 0,338
Marine products
Emiel Hanekamp
Opmerking over tekst
see the correct table at the end of the document (amendment 1)
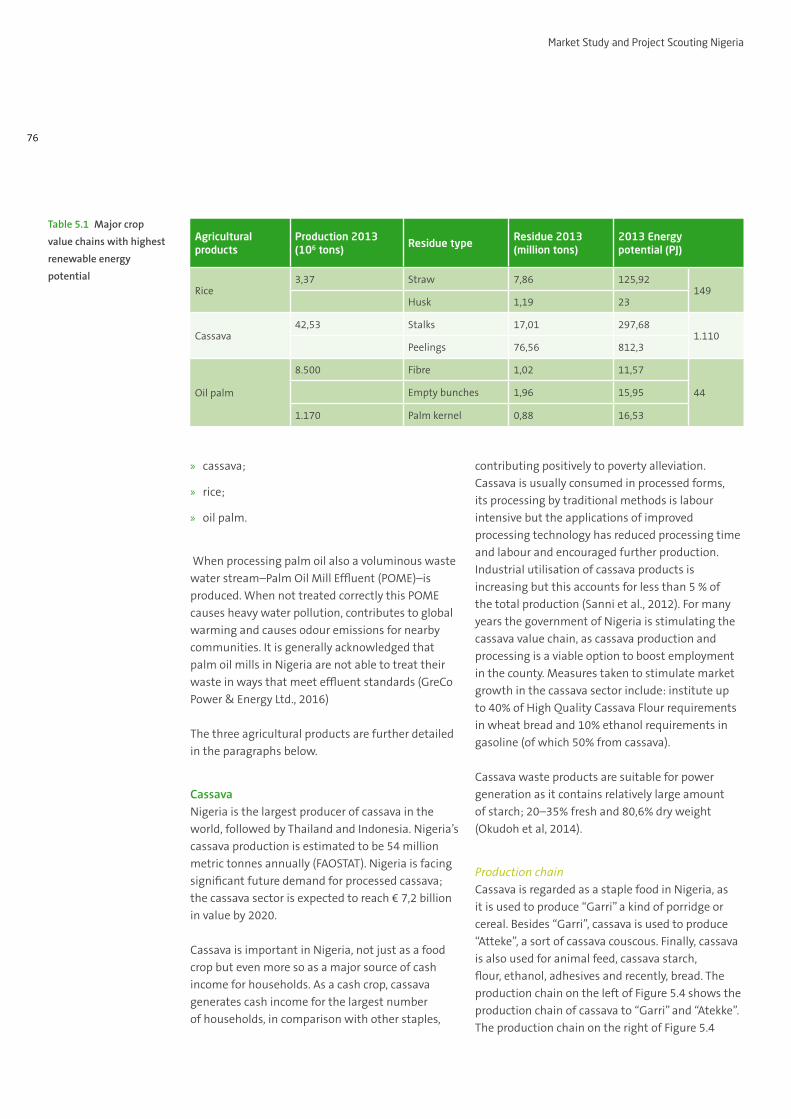
76
Market Study and Project Scouting Nigeria
» cassava;
» rice;
» oil palm.
When processing palm oil also a voluminous waste
water stream–Palm Oil Mill Effluent (POME)–is
produced. When not treated correctly this POME
causes heavy water pollution, contributes to global
warming and causes odour emissions for nearby
communities. It is generally acknowledged that
palm oil mills in Nigeria are not able to treat their
waste in ways that meet effluent standards (GreCo
Power & Energy Ltd., 2016)
The three agricultural products are further detailed
in the paragraphs below.
CassavaNigeria is the largest producer of cassava in the
world, followed by Thailand and Indonesia. Nigeria’s
cassava production is estimated to be 54 million
metric tonnes annually (FAOSTAT). Nigeria is facing
significant future demand for processed cassava;
the cassava sector is expected to reach € 7,2 billion
in value by 2020.
Cassava is important in Nigeria, not just as a food
crop but even more so as a major source of cash
income for households. As a cash crop, cassava
generates cash income for the largest number
of households, in comparison with other staples,
contributing positively to poverty alleviation.
Cassava is usually consumed in processed forms,
its processing by traditional methods is labour
intensive but the applications of improved
processing technology has reduced processing time
and labour and encouraged further production.
Industrial utilisation of cassava products is
increasing but this accounts for less than 5 % of
the total production (Sanni et al., 2012). For many
years the government of Nigeria is stimulating the
cassava value chain, as cassava production and
processing is a viable option to boost employment
in the county. Measures taken to stimulate market
growth in the cassava sector include: institute up
to 40% of High Quality Cassava Flour requirements
in wheat bread and 10% ethanol requirements in
gasoline (of which 50% from cassava).
Cassava waste products are suitable for power
generation as it contains relatively large amount
of starch; 20–35% fresh and 80,6% dry weight
(Okudoh et al, 2014).
Production chainCassava is regarded as a staple food in Nigeria, as
it is used to produce “Garri” a kind of porridge or
cereal. Besides “Garri”, cassava is used to produce
“Atteke”, a sort of cassava couscous. Finally, cassava
is also used for animal feed, cassava starch,
flour, ethanol, adhesives and recently, bread. The
production chain on the left of Figure 5.4 shows the
production chain of cassava to “Garri” and “Atekke”.
The production chain on the right of Figure 5.4
Agricultural products
Production 2013(106 tons)
Residue typeResidue 2013(million tons)
2013 Energy potential (PJ)
Rice3,37 Straw 7,86 125,92
149Husk 1,19 23
Cassava42,53 Stalks 17,01 297,68
1.110Peelings 76,56 812,3
Oil palm
8.500 Fibre 1,02 11,57
44Empty bunches 1,96 15,95
1.170 Palm kernel 0,88 16,53
Table 5.1 Major crop
value chains with highest
renewable energy
potential

77
Chapter 5 Captive Power
shows the production chain of cassava starch from
cassava. From both production chains it can be seen
that substantial residue streams become available
when processing cassava.
The amount of residue becoming available in the
different cassava processing steps provides an
excellent basis for renewable energy captive power
production. However, despite this potential and the
boost in cultivation of cassava, there is no reported
operational captive power plant, using cassava
residue in Nigeria.
TechnologyFor the production of energy from cassava residues,
several energy conversion technologies can be
utilized, depending on the type of residue and
energy requirements of the processor. Figure 5.4
shows the peels and pulp residues are available
in large quantities. However, also the wastewater,
cassava bagasse and starch residues can be used
for energy production. Table 5.2 gives an overview
of the most suitable technologies, and conversion
processes for energy generation from cassava waste
streams. Combustion and digestion can be used at
a relatively small scale. CHP and gasification usually
require a somewhat larger scale, for cost efficiency
Figure 5.4 The production
chain of Garri and Atteke
(Left) and starch (Right)
using cassava
Peels (250–300kg)
Peels (20–50kg)
Pulp waste (600kg)
HCN (24g)
Waste water (12–20 m3)1) Solids (18kg)
2) HCN (342–570g)Starch residue
Starch (180–200 kg)
1) Th
is s
tep
may
be
repe
ated
sev
eral
tim
es
Cassava Fresh Roots (1 tonne)
mechanical grating
grating
fermentation
Fuelwood (1.5–2.5 kg/kg final product)
Water (3m3)
Fiber waste (20–40kg)
sieving
Gari (200–240 kg)
Atteke (200–240 kg)
steaming toasting
manual peeling mechanical peeling and washing
Cassava Fresh Roots (1 tonne)
Water (3–5m3)
sedimentation1)
drying
sieving
Squeezing juice (220–240kg)
squeezing
Water (12–20m3)

78
Market Study and Project Scouting Nigeria
reasons. In addition to the options mentioned in
the table, fermentation technology can be used
to convert cassava into bioethanol. However, this
technology usually uses the entire cassava and not
only the residues, and is therefore not included.
The selection of the most appropriate technology
depends on the scale of operation, availability of
sufficient space for an installation and the energy
demand of the company.
Business modelsPotential business models for the realisation of
renewable energy captive power projects depend
on the size of the cassava processing company.
Large scale, well equipped cassava processors,
usually can develop, build, maintain and operate a
captive power generation installation themselves.
These companies are able to bear the capital
investments required to build a power system and
are likely to have (or be able to acquire) the know-
how and experience needed. Another option for
these companies is to engage in a Design-Build-
Operate-Maintain (DBOM) or a Build-Own-Operate-
Transfer (BOOT) contract with a third party. With
this third party a PPA can be negotiated by the
cassava processor. This way, the cassava processor
is able to receive a steady supply of energy, without
having to manage the plant itself.
For medium- and small scale cassava processors, it
will hardly be feasible to develop and build a captive
power plant internally. This can be ascribed to
two facts. Firstly, the capital investments required
for a captive power plant will most likely be too
large for a medium- or small scale entrepreneur
in the cassava processing industry. Secondly, they
usually do not have the required know-how and
skills within their firm, to develop, build, operate
and maintain a waste to energy captive power
plant. Therefore, the most suitable business model
for using captive power for medium- and small
scale cassava processor is a third party that will
exploit the captive power plant and that supplies
the energy to the cassava processor under a PPA
agreement.
Both business models show a commercial potential.
When the captive power plant is managed
internally, cost savings for the cassava processor
can be achieved through the substitution of diesel
and grid electricity. When a third party exploits
the captive power plant, cost savings through the
substitution of diesel can occur for the cassava
processor as well, and additional income for the
exploiting party is generated. An example of a
potential captive power project is presented in
Figure 5.5.
Cassava processorsCassava is mainly cultivated in Anambra, Delta, Edo,
Cross River, Ino, Oyo, Ogun, Niger, Rivers, Kwara and
Benue. There are about 1.200 large scale farmers
(10–1000 ha) and 5.000 medium scale farmers (6–
10 ha) in Niger Delta, supplying a handful of large
processing industries and about 50 small-medium
scale industries (PIND, 2011b). The National Cassava
Processors and Marketers Association (NCAPMA),
mention 65 members on their website (http://
ncapma.org/directory/listing/). Table 5.3 shows
an overview of the large agri-food processing
companies in the cassava sector that have been
identified in Cross river, Ogun and Niger state.
Table 5.2 Cassava residues,
energy conversion
technologies and type of
energy produced
Cassava residue(Solid waste =10–25% of fresh root)
Conversion technology Energy / fuel
PeelsCombustion, Gasification, CHP (large scale), and fermentation
Heat, Syngas, electricity, and ethanol
Squeezing juice and pulp, waste water, and starch residue
Anaerobic Digestion Biogas

79
Chapter 5 Captive Power
Potential business case for a biogas cassava residue captive power projectIn order to estimate the commercial viability of captive power for the cassava processing industry, an
analysis of a potential captive power project for a SME company, producing food-grade starch from
cassava in Ogun State, has been conducted. On site, the company peels the cassava, produces the
starch and dries and packages the end-product. This makes the company suitable for captive power
generation as it possesses the waste streams at their location. The company produces a daily average
of 25 tonnes of starch Currently, they use boilers and diesel generators to provide electricity. Table 5.3
gives an overview of the estimated costs of energy for the company.
Table 5.3: Estimated energy costs
Diesel per year (l) Costs per year (Naira) Costs per year (€)
Boilers 270.000 36.450.000 € 163.661
Electricity 375.000 50.625.000 € 227.306
Total 645.000 87.075.000 € 390.967
A waste to energy project using a biogas digester appears to be most suitable. It is estimated that
the company has 750 tonnes of cassava waste per year. When this cassava waste is used for the
production of biogas (which can be converted to electricity or heat), substantial costs savings on
energy occur. Table 5.4 shows an overview of the amount of the costs savings that can be achieved by
using the cassava wastes as feedstock for captive power generation.
Table 5.4: Estimation of annual biogas production and diesel substitution
Amount of cassava waste (kg/year)
Biogas production (m3/year)
Electricity production (kWh/year)
Substituted diesel (l/year)
Cost savings (€/year)
750.000 487.500 1.023.750 268.125 162.524
The capital expenditure (including design and building) for a biogas digester of the size needed is
(depending on the technology chosen) estimated to be between € 350.000–700.000. A very rough
estimation of the payback time (including operation and maintenance costs) results in a payback
between 2,5 – 4,5 years. A biogas digester also produces significant amounts of excess heat, that can
be utilised e.g. for drying of cassava.
Figure 5.5 Case study for
a potential captive power
project
State Company Activities
Cross River Godilogo Farms Cassava processing
Niger Dewo Integrated Farms Ltd Cassava chips
Ogun
GreenTech Industries Limited Cassava processing
Cassava farming village, Boodo Cassava processing
Ilugun North Cassava Processing Cassava processing
Matsol Farms Ltd Cassava processing
Golden Hebron Company Ltd Cassava processing
Table 5.3 Large scale
processors of cassava
in Cross river, Niger and
Ogun state

80
Market Study and Project Scouting Nigeria
Figure 5.6 Potential
use of oil palm tree and
opportunities for energy
use (Source: adapted from
PIND, 2011a)Fruit Fibre
Oleochemical (stearine, soap, detergent, lubricant, biodiesel)
Food (frying oil, margarine, cocoa butter substitute) energy
Pulp, paper, particle board, fertiliser energy
Furniture, particle board, feedstuff, starch energy
Sludge
Kernel
Palm cake
Empty bunch
Shell
Crude palm oil
Particle board, pulp, paper
Feedstuffm soap, fertiliser energy
Frying oil, salad oil, oleochemical energy
Feedstuff, fertiliser energy
Carbon briquette, activated carbon, particle board
Trunk
NutOil palm
Oil palmNigeria produced nearly 8 million tonnes of oil palm
fruits (resulting in about 1 million tonnes of palm
kernel) and is the third largest producer in the world
after Indonesia and Malaysia. Oil palm processing
offers the empty fruit bunches, the processing
waste effluent (POME) and the palm kernel shells
as options for bioenergy. About 80% of production
comes from scattered smallholders spread over an
estimated 1.6 million hectares of land. Plantations
occupy between 200.000 and 360.000 hectares. Oil
palm provided direct employment and income to
about 5 million Nigerians.
Oil palm is grown abundantly in southern Nigeria,
with a majority of large and small holder farms
found in the south-east and south-south. The Niger
Delta’s nine states (Akwa Ibom, Abia, Rivers, Edo,
Imo, Ondo, Bayelsa, Cross River and Delta) account
for about 80% of total Nigerian palm oil production.
But this production is dominated by the collection
of palm fruit e.g. Fresh Fruit Bunches (FFB) from
wild groves (74% of area and about 50% of supply
of FFB), followed by production from private
plantations (small, medium and large farmers,
19% of area and 34% of supply of fruit) and large
corporate and government owned plantations
(about 7% of area 25% supply of fruit). Other
important oil palm producing states are: Ekiti,
Ogun, Enugu, and Oyo.
In 2012, the Government of Nigeria initiated the
Agricultural Transformation Agenda for increasing
palm oil production in the country. Government
sources indicate that they have distributed hybrid
seedlings to farmers to replace the low-yielding and
old trees and the government is collaborating with
farmers and private sector organizations to expand
palm plantations. Some production increases have
been recorded from this initiative.
The government also supports domestic production
through research. The Nigerian Institute for Palm
Oil Research (NIFOR) was set up to support the
palm oil production and it has been under the
control of the Federal Ministry of Agriculture since
1992. The current formal mandate of NIFOR is to
conduct research on production of palm oil and
other palm plant and to transfer the research
outputs to producers, especially the traditional
small-scale processors (for further information
about NIFOR, visit: http://nifor.org/).

81
Chapter 5 Captive Power
Production chainThe Nigerian palm oil processing industry is made
up of four identifiable channels (see also Figure 5.7):
» Channel 1: Traditional TPO (Technical Palm Oil)
» Channel 2: Medium Technology TPO
» Channel 3: Medium Technology SPO
(Special Palm Oil)
» Channel 4: Integrated
Channel 1 is the largest of the four channels, but
it is shrinking. It is dependent on the wild grove
harvest and tens of thousands of small processors,
each producing between 40 and 200 litres poor
quality product, produced with traditional
production techniques. In this channel the end
markets / end-users are food vendors, hoteliers and
households.
Channel 2 is driven increasingly by improved
farming techniques (commercially oriented) and
by an improved processing technology for crude
palm oil. The channel is comprised of the larger
private producers of FFB who are integrating
vertically into using more efficient processing
technologies. Channel 2 is attracting the more
commercially oriented actors from Channel 1 to
upgrade and move into a more productive segment.
It is generally expected Channel 2 will become
the dominant channel in the oil palm value chain.
This channel is already handling more than 50%
of all the oil palm that is mechanically processed
and commercially marketed. It has more than a
thousand processors around the Niger Delta Area
alone.
Channel 3 represents an intermediate technology
between the semi improved processing and the
expensive modern methods. The majority of oil
palm estates produce of Special Palm Oil (SPO).
The channel has different actors in all of the
Figure 5.7 Value chain
map for palm oil in Nigeria
(Source: PIND, 2011a)
End Markets
Retailing
RuralP=N240/LT
Channel 1Traditional TPO
Channel 2medium TPO
Channel 3Medium Tech. SPO
Channel 4integrated
UrbanP=N260/LT
Palm Oilretailers P=N230
secondary Processing
Aggregation & wholesale
Primary Processing
ProductionWild grovesA=1,062,345HA
Small scale
farmers
Small scale
estates
Medium scale
estates
Large scale
estatesOut growers
Medium scale
farmers
Large scale
farmers
Seedling
HH Consumers TPO
NIFOR
Traditional Processing
Miniprocessors
MediumProcessors
Palm Oil DealersTPO=423,154T P=N200/LTSPO=76,502T P=N220/LT
Commercial usersTPO P=N230/LT
Secondary Processors
V=98,183T(SPO)V=234,133T(PKO)
Large automated Processing
plants
Industrial usersSPO/PKO PRODUCTS

82
Market Study and Project Scouting Nigeria
functions from input supplier, producer, processors,
wholesalers, retailers, and end-users so the vertical
coordination is complex. The channel is growing
gradually due to high demand for the product in
Nigeria.
Channel 4 is comprised of the large estates
with vertically integrated through processing
with fully automated processing plants. Some
of the companies, like PRESCO, take the product
all the way through to the fractionated Oleins
and Stearins, while others sell their SPO to the
secondary processors for fractionating. This channel
is the model being used by the largest industries
in the world from Malaysia and Indonesia, which
are able to control the production of the fruit, the
timing of its delivery to the mills, and the access to
the end markets. Medium and large scale farmers in
both the TPO and SPO channels seem very suitable
to adapt to renewable energy captive power.
TechnologyFor the production of energy from oil palm residues,
different energy conversion technologies can be
utilized, depending on the type of residue and the
energy requirements of the oil palm processor.
Table 5.4 gives an overview of the most suitable
technologies, and conversion processes for energy
generation from oil palm residues. The selection of
the most appropriate technology depends on the
scale of operation, availability of sufficient space for
an installation and the specific energy requirements
of the company. An example of a captive power
project is included in Annex L.
Business modelsPotential business models for the realisation of
renewable energy captive power projects depend
on the size of the oil palm processing company.
Large (automated) palm oil processors, usually
can develop, build, maintain and operate a captive
power generation installation themselves. These
companies are able to bear the capital investments
required to build a power system. Moreover, these
companies are likely to have, or be able to acquire,
the know-how and experience needed. Another
option for these companies is to engage in a
Design-Build-Operate-Maintain (DBOM) or a Build-
Own-Operate-Transfer (BOOT) contract with a third
party. With this third party a PPA can be negotiated
by the cassava processor. This way, the palm oil
processor is able to receive a steady supply of
energy, without having to manage the plant itself.
For medium and mini-processors, it will hardly be
feasible to develop and build a captive power plant
internally. This can be ascribed to two facts. Firstly,
Oil palm residues Conversion technology Energy / fuel
Empty Fruit Bunch (EFB), Palm kernel shell (PKS) and Palm Fibre
Combustion, Gasification, CHP (for large scale)
Heat and electricity
Palm Oil Mill Effluent (POME) Anaerobic DigestionBiogas (converted in heat and electricity)
Table 5.4 Oil palm
residues, energy conversion
technologies and type of
energy produced
State Company Activities
Cross River
Wilmar Group / PZ Cussons Plantation and refinery
Real Oil Plantation and mills
Pamol Plantation and mills
IBAD Farms Plantation and mills
ROYAL Int. Farms Plantation and mills
Ogun Diamond Pearl Agro Allied Ltd Palm oil processing
Table 5.5 Large scale
processors of oil palm in
Cross river, Niger and Ogun
state

83
Chapter 5 Captive Power
Rice residues Conversion technology Energy / fuel
Rice husk Combustion, Gasification Heat and syngas
Straw (not available at mill) Combustion Heat
the capital investments required for a captive
power plant will most likely be too large for these
companies. Secondly, they usually do not have the
required know-how and skills within their firm,
to develop, build, operate and maintain a waste
to energy captive power plant. Therefore, the
most suitable business model for these oil palm
processors is using the DBOM model, having a third
party exploit the captive power plant and supplying
the energy to the oil palm processor under a PPA
agreement.
Both business models show a commercial potential.
When the captive power plant is managed
internally, cost savings for the oil palm processor
can be achieved through the substitution of diesel,
gas and/or grid electricity. When a third party
exploits the captive power plant, cost savings
through the substitution of diesel, gas and/or grid
electricity can occur as well, and additional income
for the exploiting party is generated.
Oil palm processorsTwo companies in channel 4 are currently at
the fore front in the production of SPO. These
companies are PRESCO & Okomu Oil, both located
in Edo state. Other actors in this channel are Golden
Oil company and Envoy Oil Industries located in
Anambra state, Agro Ideas International located
in Akwa-Ibom state, EFB Industries Limited in
Abia state and Sudit Oil in Oyo state. Table 5.3
shows an overview of the large oil palm processing
companies that have been identified in Cross river,
Ogun and Niger state.
Support organisations NIFOR is the dominant institution in support of the
palm oil industry. It is charged with all research on
palm varieties, identification and propagation of the
best varieties of palm plants, and research into the
best technologies for processing the fruit into oil.
RiceRice production in Nigeria seems to have gradually
increased in recent years’ to 6,7 million tons in 2014
(FAOSTAT). Estimates indicate that over 90 % of
domestic rice production comes from resource-poor
and weakly organized small holders. Niger State
produces the largest amount of paddy in the North
Central zone at 473.000 tonnes paddy per annum
(GIZ, 2015b).
In the last few years’ backward integration in the
form of installation of rice mills and direct farming
seems to be gaining more ground. Good examples
of this are Olam and Dangote. In 2015 Olam
Nigeria has invested € 94 million in an integrated
farm and milling facility in Nasarawa State. One
of the biggest commitments for investing in rice
processing was made in 2014 by Dangote Group.
This Nigerian conglomerate committed to spend
more than N165bn (€ 750 million) in mills, farms
and related infrastructure in a bid to support the
country in its goal of becoming a net-exporter of
rice. The group acquired farmland in five states,
which will be used for the commercial production of
rice paddy. It will also set-up two rice mills with an
installed capacity of 240.000 tonnes of rice per day.28
Sources note that the government regime may
adopt the Agricultural Transformation Agenda’s
rice policy for self-sufficiency. Encouraged by official
28) http://www.oxfordbusinessgroup.com/news/nige-
ria-full-swing-rice-production
Table 5.6 Rice residues,
energy conversion
technologies and type of
energy produced

84
Market Study and Project Scouting Nigeria
policy proposition to ban rice imports by 2017 as
well as Nigeria’s differential tariff policy, private
sector investments in local rice farming have
increased, partly offsetting production declines by
small scale farmers.
Production chainThe Nigerian rice value chain is made up of five
different channels (see Figure 5.8). The integrated
industrial processing mills seem the most suitable
to adapt to renewable energy captive power.
Nigerian Rice Value Chain
Retail
Wholesale
Mill/polish
Mill/hull
Paraboiling
Paddy trade
Input Supply
Research/seed
Storage
Channel 1Traditional
Channel 2Service Milling
Channel 3Medium Commercial
milling
Channel 4industrial processing
with outgrowers
Channel 5Imported Rice
Import/Trade
Production
retailers
Medium Mill – Grow,
Buy, store and trad
Sm. & medium
service Mill
Hand Mill
Mkt. retailers
Paraboilers
Contract farmer/out
grower
Emerging Commercial
farmer
Rice Traders
Paddy Traders
Government of Nigeria fertilizer
Input suppliers (seed, fertilizer, etc.)(i.e. CANDEL, Premier Seeds Nigeria)
wholesale
Supermarkets, shops
Importers
Asia, USA
~ 2M Tons/Yr ~ 3M Tons/Yr
Rural HH Consumption 250.000 mt?
Rural Town Markets
1.000.000 mt?
Inst’I Mkt ~300.000 T
Low end Urban Mkt. Domestic Rice
500.000 mt?
High end Urban Mkt. Imported Rice
2.000.000 mt
import
(i.e. Olam, Veetee)
Integrated Industrial
processing mills
Traditional farmer
Figure 5.8 Value chain map
for rice in Nigeria
(Source: Simpson, 2011)

85
Chapter 5 Captive Power
State Company Activities
Cross River Ogoja Central Rice Mill Cluster Rice Mill
NigerPearl Universal ImpexBadegi Rice MillMinna-Kpakakungu Clusters
Rice MillRice MillRice processing
Jigawa Danmordi Rice Mill Rice Mill
Kano Stallion Rice Rice Mill
EbonyeEbonyi Agro rice millEbonyi State Government rice mill
Rice MillRice Mill
Table 5.7 Examples
of medium scale Rice
Millers, identified in
different states
TechnologyFor the production of energy from rice residue,
different energy conversion technologies can be
utilized, depending on the energy requirements
of the processor. As straw is usually not available
at the milling site, this residue is not a suitable
feedstock for renewable energy captive power at
the mill location.
Business modelsFor the large scale rice millers, it is possible to
install and manage the captive power generation
facility internally. The large milling companies are
able to bear the relatively high capital investments
required to start generating power using rice husk.
Moreover, these companies are likely to have access
to the know-how required to build, own, maintain
and operate a captive power plant. Another option
for these companies is to appoint a third party
that will be responsible for the exploitation of the
captive power plant. With this third party a PPA can
be negotiated. This way, the processor is able to
receive a steady supply of energy, without having to
manage the plant itself.
For medium scale rice millers, it will hardly be
feasible to develop and build a captive power plant
internally. This can be ascribed to two facts. Firstly,
the capital investments required for a captive
power plant will most likely be too large for these
companies. Secondly, they usually do not have the
required know-how and skills within their firm, to
develop, build, operate and maintain a waste to
energy captive power plant. Therefore, the most
suitable business model for these rice millers is
using a DBOM model, having a third party design,
build, operate and maintain the captive power
plant, supplying energy to the rice processor under
a PPA agreement. Some might prefer to use the
BOOT model. For small rice millers only the DBOM
model seem suitable.
All business models show a commercial potential.
When the captive power plant is managed
internally, cost savings for the rice miller can be
achieved through the substitution of diesel, gas
and/or grid electricity. When a third party exploits
the captive power plant, cost savings through the
substitution of diesel, gas and/or grid electricity
can occur as well, and additional income for the
exploiting party is generated.
Rice millersIn recent years’ significant investments have been
made in increasing the rice processing capacity in
Nigeria. Resulting in the number of rice mills rising
from one plant five years ago to 24 at present (see
Annex F) according to the Rice Millers, Importers
and Distributors’ Association of Nigeria.

86
Market Study and Project Scouting Nigeria

87
CHAPTER 6 PROJECT DEVELOPMENT PROCEDURES
This chapter highlights the steps a project
developer has to take to implement on- and off-grid
electricity projects in Nigeria, including captive and
embedded power projects.
The information below is based partially derived
from official policy and regulatory documents
as well as 22 interviews with key governments
agencies (NERC, NBET, NIPC and others), and
industry players such as the GenCos, DisCos,
financiers, relevant experts and those that have
(attempted to) established power projects in
Nigeria. Information was collected between May
and July 2016.
Further topics addressed in this chapter are:
» Business environment in general
» Transparency and procedural challenges
» Financial considerations
» Feedback from key stakeholders on liaising with
regulatory bodies
» The relation between generation companies and
distribution companies
» Key challenges as mentioned by project devel-
opers
» Strategies proposed by stakeholders to overcome
key challenges
Processes, procedures, timelines, fees and the likes
are subject to change, and several respondents
indicated that there are hidden obstacles and
processes. Therefore, any entity intending to set
up a power project in Nigeria would be wise to
liaise with local experts who can use their insider
knowledge and relationships to ensure all necessary
steps are indeed taken.
The role of the government
Nigeria is a federation of 36 States and the Federal
Capital Territory (Abuja). In the federal system,
political power is shared between the three tiers of
government (federal, state and local government).
Roughly based on the American model of a
federation, States in Nigeria play an important
role in the daily lives of the citizens. More on the
role of state governments below, but first the key
government player in the Nigerian energy sector
will be discussed; The Federal Government.
The Federal Government and associated agenciesThe Federal Government of Nigeria (FGN) has
a responsibility of ensuring a power system
of generation, transmission, distribution and
marketing that is efficient, safe, affordable and
cost-effective throughout the country. This is made
possible by ensuring that the power sector attracts
private investment both from Nigeria and overseas.
In developing private investment and enhancing
indigenous capacity, the FGN is working towards
a transparent and effective regulatory framework
for the power sector. The FGN is also divesting
its interest in the state-owned entities thus
restructuring and privatizing the electric power
sector.
88
Market Study and Project Scouting Nigeria
In promoting competition to meet growing demand
through the full liberalization of the electricity
market, the key roles of the FGN are:
» To review and update electricity laws in
conformity with the need to introduce private
sector operation and competition into the sector;
» To ensure that electricity supply is made more
reliable, economically efficient and equitable
so as to effectively support the socio-economic
development of the country;
» To provide access to electricity, on or off-grid;
» To encourage domestic production of electrical
equipment in Nigeria, and the development of
related software and services;
» To establish and meet the targets of the rural
electrification programme;
» To ensure minimum adverse environmental
impact;
» To create the enabling environment, including
the provision of incentives, that will attract
investors and resources to achieve the objectives
earlier stated;
» To minimize government guarantees for privately
funded investment;
» To ensure that subsidies are efficiently targeted.
Related to the FGN are a number of government
agencies who are jointly responsible for the
development of the electric power sector. The
ultimate goal of all agencies is to ensure that
Nigeria has an electricity supply industry that
meets the needs of its citizens. In the following,
these agencies are described.
Federal Ministry of PowerWebsite: http://www.power.gov.ng/
Description: Formulation of broad policies for the development of the power sector and coordinating
activities within the sector. Its function is to:
» Ensure the establishment of a robust power sector: fully supporting the socio-economic needs of the
nation in ensuring an efficient, safe, affordable and cost-effective system of generation, transmission,
distribution and marketing.

89
Chapter 6 Project Developer Information
Energy Commission of NigeriaWebsite: http://www.energy.gov.ng/
Description: The ECN also developed the first ever Renewable Energy Master Plan (REMP) with the support
of the United Nations Development Programme (UNDP) in 2005 and this was reviewed in 2012. Its
functions are:
» Recommending to the Government any alternative or new energy sources;
» The ECN is charged with the responsibility for the strategic planning and coordination of national
policies in the field of energy in all its ramifications;
» Creating awareness in Government in order to improve the investing environment;
» Proposing incentives the Government can give to private sector investors. Some of these incentives have
been adopted by the Nigerian customs and this is available on their website;
» According to information provided by ECN, they also provide technical information on private, local and
foreign investors in Nigeria about the RE market;
» The ECN can also carry out specific studies/research/ for the investor and can provide advisory services to
the investors;
» ECN liaises with international agencies on energy matters, thus the ECN is the focal agency in Nigeria
for bodies like the International Renewable Energy Agency, World Energy Council and IAEA (before the
establishment of the Nigerian Atomic Agency).
Federal Ministry of EnvironmentWebsite: http://environment.gov.ng/
Description: The Federal Ministry of Environment was established to ensure effective coordination of all
environmental matters. Its function is to:
» Advise and cooperate with the Federal Government on national environmental policies and priorities, the
conservation of natural resources and sustainable development and scientific and technological activities
affecting the environment and natural resources;
» Promote cooperation in environmental science and conservation technology with similar bodies in other
countries;
» Prescribe, monitor and enforce regulations on water quality, environmental protection, effluent limi-
tations, air quality, atmospheric protection, ozone protection, noise control as well as the removal and
control of hazardous substances;
» Assess Environmental- and Social Impact Assessments submitted by project developers.

90
Market Study and Project Scouting Nigeria
Nigerian Bulk Electricity Trading Plc (NBET)Website: http://nbet.com.ng/
Description: NBET enters into power purchase agreements with generation companies and resells power to
distribution companies through the vesting contracts. Its functions are:
» Buying power from IPPs that are connected to the national TCN grid and reselling the power to the distri-
bution companies (DisCos) and eligible customers;
» Manage existing PPAs and new procurement of power in the transition.
Nigerian Electricity Regulatory Commission (NERC)Website: http://www.nercng.org/
Description: Tasked with the promotion of the managerial efficiency of the power sector and improving
access to electricity services through technical regulations, protecting consumers. Two of NERC’s key
regulatory functions are:
» Licensing: NERC issues licenses for on and off-grid generation of power, as well as for distribution of
electricity to end users.
» Tariff setting: NERC manages price regulation through the Multi-Year Tariff Order (MYTO).
Hydro Electric Power Producing Areas Development Commission (HYPPADC)Description: HYPPADEC was established to manage the impact of ecological issues due to the operations of
dams and hydroelectric power activities in power producing areas. Its functions are to:
» Protect the host communities of areas where dams and hydro-power energy infrastructure are planned
and located;
» Manage the fund containing 10% of hydro power revenue by DisCos (this fund is not yet in function and
therefore it is still unclear how this fund will operate).
91
Chapter 6 Project Developer Information
Nigerian Investment Promotion Commission (NIPC)Website: http://www.nipc.gov.ng/
Description: The Nigerian Investment Promotion Commission (NIPC) was established to promote, co-
ordinate and monitor all investments in Nigeria. Its function is to:
» Co-ordinate, monitor, encourage and provide necessary assistance and guidance for the establishment
and operation of enterprises in Nigeria;
» Initiate and support measures which shall enhance the investment climate in Nigeria for both Nigerian
and non-Nigerian investors;
» Promote investments in and outside Nigeria through effective promotional means;
» Facilitate the registration of foreign businesses in Nigeria over the One Stop Investment Centre.
Rural Electrification AgencyWebsite: http://www.rea.gov.ng/
Description: REA’s mandate is the expansion of the grid to rural areas, development of isolated and mini-
grid systems, and renewable power generations. Its function is to:
» Administer and manage the Rural Electrification Fund (REF). REF targets grid extension projects, solar
projects, the installation of transformers, and mini hydro power projects;
» Provide overall support and coordination of rural electrification activities in Nigeria.

92
Market Study and Project Scouting Nigeria
Private sector respondents on State & Local governmentsEnergy projects are a way to score political points for a State Government;
they are therefore keen to (appear to) support a project developer.
However, bureaucracy can be crippling and transparency remains an issue.
Moreover, State Governors have far reaching powers and can support the
speedy execution of projects; developing a positive relationship prior to
setting up a power project, and choosing a more efficient State to locate a
project, is thus recommended.
Local government in a number of states are a mere political compensation
for the government loyalists. Corruption is widespread. The inadequacies
of operational and capital funds constitute a set-back on local government
implementation of regular services and investment programme.
The role of state and local governmentsAlthough electricity projects are licensed and
regulated by the federal government (agencies),
state governments are known to compliment the
efforts of the federal government by implementing
electrification projects in their states. State
governments play a major role in land acquisition to
private investors looking to establish power projects
in the state. The key aspects to their role are:
» Acquisition of land
» Consent for land usage
» Right of way surveys and assessments
Respondents who have set up power projects in
Nigeria, or who have acted as advisors on such
projects, all confirm the importance of developing
a good relationship with the State. The right of
way survey, for example, has to be submitted when
applying for a license. When the State delays the
survey process, the entire licensing process will be
delayed.
Role of the local government The local government is the third tier of
government and represents the interest of
(small) communities in a state. They help
facilitate development from the grassroots.
Local governments only play a minor role in the
development of electric power projects. However, in
rural areas where the State has little oversight, the
local government acquire greater significance. Most
interactions between local governments and private
electric power companies relate to the collection of
local taxes and levies.
The role of, and relation between, GenCos and DisCos
After the privatization, the Federal Government
only retained control in the energy sector of the
transmission and system operation, owning 100%
of the Transmission Company of Nigeria (TCN),
while its equity in the generating companies is
20% leaving 80% to private investors. In the case of
distribution companies, the Government only sold
60% while it retained 40% equity. The structure
of the privatised power sector is shown in the
following picture.
The GenCos, DisCos and TCN are all co-dependent
and the activity of one (or lack thereof) has an
effect on the others. The relationship is often
suboptimal, as financial streams are frequently
interrupted and the business environment is
challenging. NBET and NERC are pivotal in this
(financial) relationship, as is depicted below.
Financial concerns The sometimes strenuous relations between the
stakeholders are caused by the inability to generate
enough cash for the operations and/or to remit it
to the relevant players. Especially the DisCos battle
with customers who do not pay their bills – the
biggest culprit being governmental institutions.
As at Q1–2016, the government had about $ 300
million in unpaid electricity bills according to a
report by Financial Derivatives Company. While
it is easier for DisCos to threaten the average
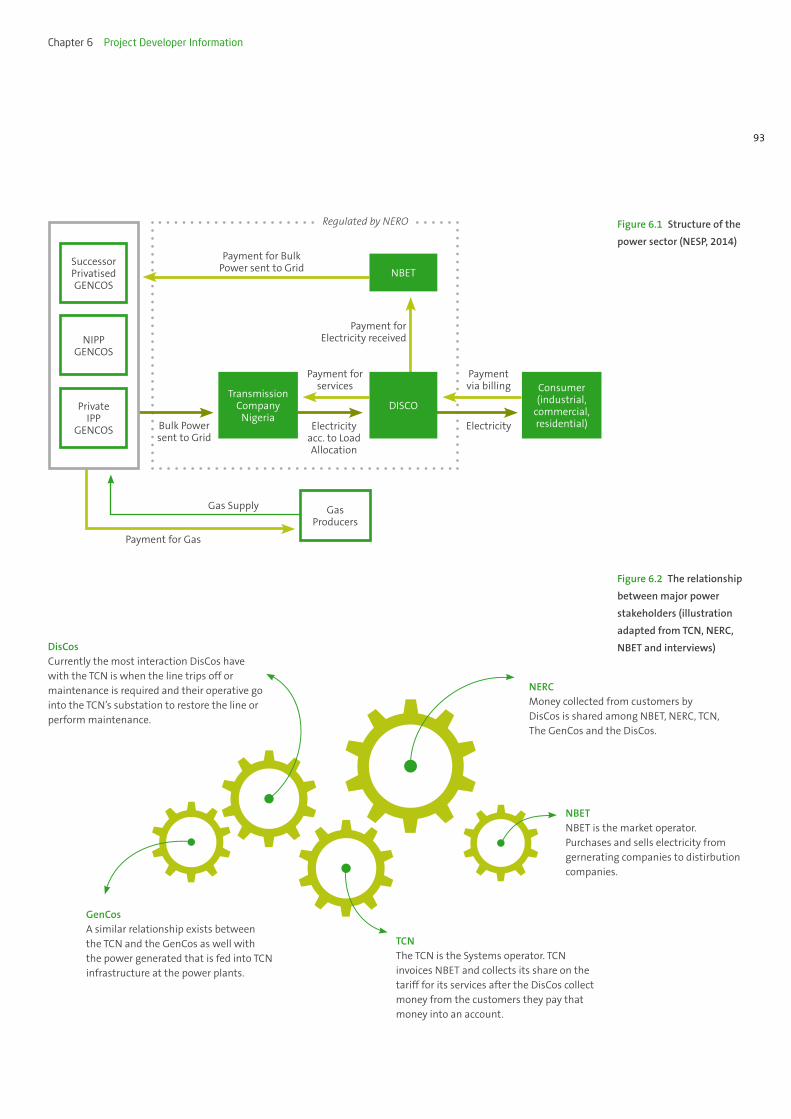
93
Chapter 6 Project Developer Information
Figure 6.1 Structure of the
power sector (NESP, 2014)
Figure 6.2 The relationship
between major power
stakeholders (illustration
adapted from TCN, NERC,
NBET and interviews)DisCosCurrently the most interaction DisCos have with the TCN is when the line trips off or maintenance is required and their operative go into the TCN’s substation to restore the line or perform maintenance.
GenCosA similar relationship exists between the TCN and the GenCos as well with the power generated that is fed into TCN infrastructure at the power plants.
TCNThe TCN is the Systems operator. TCN invoices NBET and collects its share on the tariff for its services after the DisCos collect money from the customers they pay that money into an account.
NBETNBET is the market operator.Purchases and sells electricity from gernerating companies to distirbution companies.
NERCMoney collected from customers by DisCos is shared among NBET, NERC, TCN, The GenCos and the DisCos.
Payment via billing
Payment for services
Electricity acc. to Load Allocation
Bulk Power sent to Grid
Payment for Bulk Power sent to Grid
Payment for Electricity received
Electricity
Gas Producers
Transmission Company
NigeriaDISCO
NBET
Consumer (industrial,
commercial, residential)
Payment for Gas
Gas Supply
SuccessorPrivatisedGENCOS
NIPPGENCOS
PrivateIPP
GENCOS
Regulated by NERO
94
Market Study and Project Scouting Nigeria
citizen with notices and written warnings, it is
more difficult to do so with e.g. a ministry or army
barracks. As a result, at the time of writing this
report, the DisCos have only paid 30% of their
invoices over the past three months, according to
the NIAF.
During the last administration, the CBN in
conjunction with the NERC, the Ministry of Power
and the Ministry of Petroleum Resources developed
the Nigeria Electricity Market Stabilization Facility
(NEMSF). The NEMSF is designed as an intervention
fund to ameliorate the effects of a liquidity shortfall
in the value chain of the Nigerian Electricity
Supply Industry. Managed by the Bank of Industry
(handling the operational aspects) and the Central
Bank of Nigeria, the NESMF is meant to support
the distribution companies to fulfil their market
obligations (i.e. the cost of power supplied to
them by NBET and the cost of services including
the transmission and market operations services
etc). The CBN intervention fund arose as a result of
several entreaties made by the power generating
companies (and gas suppliers owed by some of
the thermal generating plants) who were not
being fully paid for their monthly invoices raised
in respect of power generated. Thus the measures
proposed by the CBN and its partner government
agencies included:
» Providing liquidity support
» Tariff adjustments
» Commitments by electricity market participants
The facility was disbursed back to back and the
distribution companies were not given the money
directly but were disbursed up the value chain
(i.e. the GenCos and gas companies were the chief
beneficiaries) yet the DisCos were obligors for the
facility. According to a representative from the
NERC, the fund is almost exhausted.
Operators also complain that the current tariffs are
not sufficient to break even. The Nigerian Electricity
Regulation Commission had been ordered to reverse
its 45% hike in tariffs by the Federal High Court in
Lagos. Backed by the Ministry of Power, the NERC is
seeking appeal at the Supreme Court. It is therefore
no surprise that these energy industry players
have huge debt burdens. As at March 2016, the
generating companies had outstanding loans worth
N367 billion. TCN and the DisCos have a joint debt
of N162 billion. This increases the risk of the sector
and discourages further private investments.
Another complication in this relation between
GenCos and DisCos is that some of the generating
companies are contemplating delivering straight
to key clients, bypassing the DisCos -and have a
direct financial relationship with them. Some of
our respondents believe this will only make the
distribution companies more territorial, as they
would be competing with such GenCos for key, high
value clients.
TCN and the changing roles of industry players
At present, the TCN has a large role to play in grid-
connected power projects. A schematic overview of
their role is given below:
NBET is a transitional agency for the period
where the Nigerian electricity supply industry is
still immature. Once the privatisation has been
finalised, direct bilateral agreements will govern
the relationships between the DisCos and the
GenCos. A model for this future market structure is
currently being experimented. A good example is
the Egbin Power Plant in Lagos. For their 6th turbine
(capacity of 220 MW) they signed an agreement
with the Ikeja DisCo to provide power to certain
customers. As Ikeja DisCo is part of the same group
of companies as Egbin, they feel payment issues will
be minimalized. AES Barge and a private company,
Paras, have also signed an agreement with the
DisCos to provide power using TCN’s infrastructure.
Currently the most interaction that the DisCos have
with the TCN is when the line trips off or when
maintenance is required and their engineer has to
go into the TCNs substation to restore the line or

95
Chapter 6 Project Developer Information
Figure 6.3 The position
and role of the
Transmission Company of
Nigeria (GIZ, 2014)
perform maintenance. A similar relationship exists
between the TCN and the GenCos as well as with
the GenCos generating power that is fed into TCN
infrastructure at the power plants.
DisCos and GenCos in relation to project developers
Power project developers can have the intention to
set up generating companies of their own (IPPs),
which would make them competitors to GenCos;
the privatised generating plants. Considering the
huge requirement for power generation in Nigeria,
the competition for demand is not fierce. However,
GenCos are contractually obliged to supply to the
grid, whereas an independent power producers can
decide to have an embedded or captive structure.
Developing a good relationship with DisCos is
essential when developing an embedded project.
For a grid-connected power project, the relationship
between DisCo and IPP will go through NBET, as
they are remitting funds to the IPP. However, for
embedded project a power developer has to work in
association with the DisCo relevant for that area on
grid connection matters. If there is no DisCo in the
area, the project developer can supply users directly.
A DisCo can consider an IPP as a competitor if the
IPP targets a company or area that is potentially
lucrative in terms of willingness and ability. An
example for this would be a large new residential
estate which will have a power plant of its own
without a relationship with any DisCo.
DISCO: Distribution Company VA: Vesting AgreementNBET: Nigerian Bulk Electricity TraderIPP: Independent Power ProducerPPA: Power Purchase Agreement
DISCO NBET
Transmission Service Provider
System Operator Grid Code
Market Operator Market Rules
System Operations and Market
Administration/Regulatory Charges
Transmission Use of System/Bulk Trader/Regulatory Changes
VA Invoice Payment
PPA Invoice Payment
Transmission Company of NigeriaGrid Connection
Wheeling Agreements
Grid Connection/ Ancillary Service Agreements
Market Participation Agreement
VA PPA
Market Participation Agreement
IPPs/Privatised Plants

96
Market Study and Project Scouting Nigeria
Power generation regulations and procedures
Embarking on a power generation project has the
potential to be attractive in Nigeria as there is a
far higher demand for power than there is supply.
However, one of the biggest challenges developers
and investors face is the lack of clarity around the
rules and regulations governing power generation
in Nigeria.
Any developer will be dealing with several
government agencies at once: NERC for licenses,
NBET for PPAs, Ministry of Environment for ESIA,
and TCN for evacuation approvals. Obviously,
the Ministry of Power is pivotal, their policies
drive initiatives within the sector. Moreover, the
Ministry of Power gives NBET the approval to sign
the PPAs. Lastly, a developer has to work closely
with the State Government as well. Essentially, a
project developer will have to inform all relevant
stakeholders about his decision to set up a power
project, and carry those stakeholders along in the
process.
The key agencies to work with when starting a
power project are NERC (for all types of power
projects) and NBET and TCN for those that also
involve feeding electricity into the grid.
Overview of steps to take to initiate a power project in NigeriaFour different power projects are distinguished in
this report: grid-connected, embedded, captive and
mini-grid. There are a number of similar steps to
be taken for each one of them, but the flows below
have a few relevant distinctions.
These steps below are a high-level overview of
official rules and regulations only. Note that
the ‘appoint local advisors’ and ‘stakeholder
consultations’ are not part of the official regulation
(see also text blocks on this page).
It is also worth to note that many steps in the
process can be initiated more or less at the same
time due to the duration before completion. The
next sections of this chapter will dive deeper into
the application process for licenses/ approvals/
permits from NERC, NBET and TCN.
Stakeholder consultationsTaking along the government is always
relevant in a country like Nigeria, and it will
enable a faster project implementation.
Some project developers would do this even
for a mini-grid or a solar project of under
1 MW: part out of courtesy, part out of the
intention to build awareness and capacity with
government entities.
Appointing local advisorsThe sector is still very young: the privatization
of the sector was only concluded a few years
ago and all relevant agencies will have to
find their feet in a new role. This adds to the
difficulty to get all processes and guidelines
crystal clear at this point in time. It is therefore
recommended that any power project
developer works with a specialist advisor who
is entirely up to date.

97
Chapter 6 Project Developer Information
1 Grid-connected power projectsGrid-connected generation refers to a system of power generation evacuated through the national grid
to off-takers which may be the Bulk Trader (NBET), who through vested contracts supplies the power to
distribution companies; or directly to eligible customers, as may be declared by the Minister of Power.
2 Embedded power projectsThe Nigerian Electricity Regulatory Commission (NERC)’s embedded generation regulation allows an
independent power producer to embed power within the network of the local distribution company
without connecting to the transmission network. The generation of electricity is directly connected to
and evacuated through a distribution system. This is connected to a transmission network operated by a
System Operations Licensee.
Power project developer appoints a specialist advisor
Appoint local advisors Stakeholder consultation
Company Registration Land Acquisition Licences and permits Off-Take
Agreements
Land Acquisition
Apply for NERC generation license
Fuel supply due diligence
Conduct ESIA
Evacuation approval from TCN
State level
Apply to State Govt.
» Acquisition of land rights
» Consent for land usage
» Right of way surveys & assessments
Sign Agreement with Bulk Trader (NBET)
Federal level Apply
for CAC certificate
Get tax clearance certificatelocal
Govt. level
Power project developer appoints a specialist advisor
Appoint local advisors Stakeholder consultation
Company Registration Land Acquisition Licences and permits Off-Take
Agreements
Licences and permits
Agreement with DISCO to embed using local grid infrastructure
Fuel supply due diligence
Conduct ESIA
State level
Apply to State Govt.
» Acquisition of land rights
» Consent for land usage
» Right of way surveys & assessments
Sign Agreement with DISCO’s
Federal level Apply
for CAC certificate
Get tax clearance certificatelocal
Govt. level

98
Market Study and Project Scouting Nigeria
3 Captive power projectsCaptive power generation is the generation of electricity for the purpose of consumption by the generator
itself, and not sold to a third-party. For projects below 1 MW it is not necessary to obtain a license or
permit, the figure below refers to a project of over 1 MW.
4 Mini-grid projectsA mini grid, also sometimes referred to as a “micro grid or isolated grid” it is a set of electricity generators
and possibly energy storage systems interconnected to a distribution network. It supplies electricity to a
localized group of customers, usually without connection to the national grid.
Power project developer appoints a specialist advisor
Appoint local advisors Stakeholder consultation
Company Registration Land Acquisition Licences and permits Off-Take
Agreements
Apply for NERC generation Permit
Fuel supply due diligence
Conduct ESIAApply to State Govt.
» Acquisition of land rights
» Consent for land usage
» Right of way surveys & assessments
Sign Agreement with localised group of customers
Statel level
Apply for CAC certificate
Get tax clearance certificate
Local Govt. level
Power project developer appoints a specialist advisor
Appoint local advisors Stakeholder consultation
Company Registration Land Acquisition Licences and permits Off-Take
Agreements
Regulatory framework yet to be established comletely. At
present no further licenses of permits are rquired.
State level
Apply to State Govt.
» Acquisition of land rights
» Consent for land usage
» Right of way surveys & assessments
Sign Agreement with Bulk Trader (NBET)
Federal level
Local Govt. level
Apply for CAC certificate
Get tax clearance certificate

99
Chapter 6 Project Developer Information
NERC application for generating licenceAs stated earlier, the Nigerian Electricity Regulatory
Commission (NERC) issues licenses for on and off-
grid generation of power, as well as for distribution
of electricity to end users. Section 62 of the Electric
Power Sector Reform Act 2005 states that any entity
intending to engage in the business of electricity
generation, transmission, system operation, and
distribution or trading shall be required to obtain an
operator’s licence from the NERC.
» To be able to generate more than 1 MW of power
for your own use (Captive Power Generation),
you need to apply for a permit. For self-generated
power less than 1 MW no regulation is in place.
» To be able to Transmit, Distribute or Generate
power for sale, you need to apply for a license.
On the following page the eligibility criteria and
pre-NERC application steps are detailed.
Company must be registered in Nigeria
and must possess tax clearance certificate for
immediate past three (3) years
COMPANY REGISTRATION
EXEMPTIONS FROM AUDIT
OFF-TAKE AGREEMENT
OTHER IPP REQUIREMENTS
AUDIT OF FINANCIAL STATEMENT
ENVIRONMENTAL IMPACT
ASSESSMENT
Company is also expected to have
conducted an audit of its Financial
Statements and Accounts for
immediate past three (3) years
Where the company is a newly incorporated Special
Purpose Vehicle, exemptions would
need to be sought in respect to audits
Company is expected to have conducted an EIA in respect of the proposed
area of operation or where the proposed generation capacity is less than 10 MW, an assessment of how effluents and discharges will be
managed
It is expected that the IPP would have in place an Offtake Agreement or arrangement with a power purchaser.
Where the IPP proposes to supply power to the grid, this would involve negotiating a PPA with
the Nigerian NBET
In addition to documents
evidencing the above requirements, NERC
as well as NBET will require certain
information in dealing with an IPP

100
Market Study and Project Scouting Nigeria
Eligibility criteriaNERC provides the “mandatory submissions for applications” on its website. Relevant documents such
as the application form are also obtainable from the official website (www.nercng.org). The following
requirements have to be met in order to obtain a license:
S/N Requirement for license S/N Requirement for license
1 Completed Application Form; 11 Ten-year Business Plan;
2Certificate of Incorporation and Memorandum and Articles of Association, or Deed of Partnership, or Deed of Trust, etc. (as applicable);
12 Off-take Agreement or Arrangement;
3Registered Title Deed to Site, or Sale Agreement, or Deed of Assignment/Gift, or evidence of submission of a title deed to a relevant land processing agency (as applicable);
13
Environmental Impact Assessment (EIA) Approval Certificate, or Proof of submission and acceptance for processing of the Report on EIA to the Ministry of Environment, Housing & Urban Planning, or Details on how effluents and discharges will be managed;
4Tax Clearance Certificate for immediate past three (3) years;
14Fuel Supply Agreement, or a letter from a fuel supplier and transporter indicating the inclusion of the fuel needs of the applicant in the supply plans of the fuel supplier and transporter;
5Certified Audited Financial Statements and Accounts for immediate past three (3) years;
15Agreement/Approval with Ministry of Water Resources (where applicable);
6Detailed CVs of managerial and technical staff of the power plant;
16Letter of intent or an MoU from Engineering Procurement Contract (EPC) Contractor;
7 Location Map; 17 MoU or Letter of Intent from the technical partner;
8 Single Line Diagram; 18Evidence of confirmation from Transmission Company of Nigeria, proposed connection point has capacity to take load which will be fed to it (only for application for Generation Licence);
9Power Plant Design (only for application for Generation Licence);
19 Financing Agreements or Letter to fund the project from bank(s); and
10 Site Plan Drawings; 20Timelines for commissioning of the power plant and on the date when different capacities of the plant will come into operation, relative to date of issuance of a licence.

101
Chapter 6 Project Developer Information
The different fees charged by NERCThe NERC clearly indicates on its website the fees (see Annex J for a full list of all the fees) involved at
various stages of the process:
Processing Fees for Applications
» Every application for a licence made to the Commission shall be accompanied by the non-re-
fundable Application Processing Fees as specified in the Schedules.
» The Fees payable under these Regulations shall be paid by means of bank draft or cheque
drawn in favour of the “Nigerian Electricity Regulatory Commission”.
» All Fees received by the Commission under these Regulations shall be acknowledged by the
issuance of the Commission’s official receipt.
Licence Fees
» Upon approval by the Commission of an application for a licence, the Commission shall
inform the applicant, in writing, of such approval and be informed of the licence fee required
to be paid by the applicant for the grant of a licence.
» The licence fee to be paid shall be as specified in the Schedules (see below).
» Where the licence fee is not paid within the time specified in the terms and conditions of the
Licence, a surcharge will be payable on the amount due at the rate of 1% per week up to a
maximum period of 12 (twelve) weeks after which period the grant of a licence shall lapse.
Processing Fees for Amendment, Renewal, and Extension Tenure
» Every application for the Amendment, Renewal or Extension of Tenure of an existing Licence
by a licensee shall be accompanied by the applicable processing fees as specified in the
Schedules.
» The processing fee for Amendment, Renewal or Extension of Tenure shall be non-refundable.
Annual Operating Fees
» Licensees shall pay Annual Operating Fees.
» The Annual Operating Fee payable shall be charged in accordance with the rates specified in
the Schedules.
» Where the Operating Fee is not paid within the time specified in the terms and conditions of
the licence, surcharge shall be payable on the amount due at the rate of 1% per week up to a
maximum period of 12 (twelve) weeks after which period the Commission shall apply appro-
priate penalties in accordance with the terms and conditions of the licence.

102
Market Study and Project Scouting Nigeria
Figure 6.4 NBETs role and
position (GIZ, 2014)
GenCo1
DisCo11DisCo1 DisCo5DisCo2 DisC6 DisC9DisCo3 DisCo7 DisCo10
BULK TRADER
Additional CapacityPPAs
PPAs
Eligible Customers
DisCo4 DisCo8
GenCo6GenCo5GenCo4New IPPsExisting IPPs
Existing IPPs
Existing IPPsGenCo3GenCo2
POWER PURCHASE AGREEMENTS
VESTING CONTRACTS
Steps for obtaining a PPA from NBETNBET is a bulk purchaser and seller of electricity
from generating companies to distribution
companies. It manages existing Power Purchase
Agreements (PPA’s) and new procurement of power
in the Transitional Electricity Market (TEM). The
below is a graphic depiction of NBET’s role:
There are two ways of getting PPA:
» Unsolicited bids
» Competitive procurement
Unsolicited bids have been used until now; 13
projects have been initiated under the unsolicited
bidding phase, and the competitive procurement
phase will now be the next phase that will ensure
the best price for all parties.
Unsolicited bids: NBET’s unsolicited power procurement
STEP 1
NBET has four mandatory requirements for its due
diligence exercise:
1. Land: NBET will request for any one of the
following documents relating to your land:
I. Registered title deed to project site land.
II. Notarized sale agreement of the project
site land.
III. Deed of assignment of the project site
land.
IV. Evidence of submission of a title deed to a
relevant land processing agency regarding
the project site land.
2. ESIA: The Environmental and Social Impact
Assessment (ESIA) has to be completed. An
ESIA is required for the project which meets
the Federal Ministry of Environment standards.

103
Chapter 6 Project Developer Information
Figure 6.5 Overview
of NBETs ‘step-by-step
guide’ for unsolicited bids
(adapted from NBET)
The final and complete ESIA for the project and
also the evidence of approval from the Federal
Ministry of Environment must be submitted
to NBET.
3. Evacuation: A comprehensive evacuation study
at the project site must be completed and
the project must get a provisional evacuation
approval from the Transmission Company
of Nigeria (TCN). This will provide NBET the
assurance of no stranded generation capacity.
4. Fuel: In case of gas based electricity gener-
ation, NBET requires a gas supply agreement
from a reputable gas supplier.
The above are the four mandatory requirements
that must be met before NBET starts any
negotiation with IPPs. Additional due diligence
documents the developer should provide include
information on:
» Project partners – sponsors, technical and
financial partners.
» Status of license application and other permits.
» Project – capacity, technology, initial timelines.
STEP 2
Once the developer satisfies NBET’s four mandatory
due diligence requirements, NBET will share the
Form PPA with the developer to review before
commencement of PPA negotiations. All proposed
modifications to the Form PPA should be inserted in
Schedule 1, and are subject to agreement between
both parties. The developer will be charged a token
fee for due diligence verification.
STEP 5 Initiation of EPC tender
STEP 1mandatory
requirements
STEP 2 reception of
PPA form
STEP 3 Request for
licenses
STEP 4 requirements
during negotiations
STEP 6 execution
of PPA
» Land» ESIA» Evacuation» Fuel
» Land» ESIA» Evacuation» Fuel
» Land» ESIA» Evacuation» Fuel
» Land» ESIA» Evacuation» Fuel
» Land» ESIA» Evacuation» Fuel
» Land» ESIA» Evacuation» Fuel

104
Market Study and Project Scouting Nigeria
STEP 3
If a developer does not have a generation licence,
but has completed the bulk trader’s four mandatory
requirements, a Letter of Intent will be issued to
NERC indicating NBET’s commitment to procure
power from the developer.
STEP 4
Prior to the PPA negotiations, the developer is
required to provide an ‘Issues’ list concerning his
review of NBET’s Form PPA. Consequently, a date
will be scheduled to discuss the issues list and other
Project Agreements.
NBET requires the following documents from the
developer during PPA Negotiations:
» Financial Model
» For a renewable plant: the Energy Yield Report
» Transmission Use of System Agreement (TUOS)
STEP 5
The developer is required to initiate a tender
process for its Engineering, Procurement &
Construction (EPC) contract: the developer must
exercise due care in the execution of the EPC
contract. NBET will not entertain any requests
from the developer to cater for project cost over-
runs after the PPA has been executed. Two other
Agreements to be tendered alongside the EPC
are the Long Term Service Agreement and the
Operation & Maintenance (O&M) Agreement.
STEP 6
Finally, when NBET and the developer agree on
the terms in the PPA, the tariffs, and the developer
has completed his bid for the appointment of an
EPC contractor and O&M contractor in addition to
having his LTSA executed, both parties will execute
the PPA.
Competitive procurement: NBET’s competitive power procurementBefore a developer goes into the expression
of interest (EOI) it is expected that some level
of development is done. Once the EOI stage is
completed, the project will enter the Request
for Proposal (RFP) stage where the following
documents will have to be shared:
» PPA template
» Put or Call Option Agreement
» Grid Connection Agreement
» Partial Risk Guarantee
Moreover, any project developer should meet four
criteria before the PPA is signed:
» Land title
» Evacuation approval from the TCN (see also
below)
» ESIA from the Federal Ministry of Environment,
done to meet World Bank standard
» Yield study completed
Timeline for acquiring PPAThe timeline for acquiring a PPA through
competitive procurement from NBET is a function
of how good the documents for request for
proposal (RFP) are, according to NBET officials.
Typically, a six to nine-month period is expected
between the date of advertising for the EOI to when
the PPAs are signed. Then the developer is given
another twelve months to meet the conditions
precedent in the PPAs before reaching financial
close. To finish the bidding process, you need to
meet the condition precedence (CP) to be able to
reach financial closure which is dependent on the
project developers.

105
Chapter 6 Project Developer Information
Fees for the competitive bidFees for the competitive procurement phase are
yet to be made public. As it is, there is a bond
for the RFP that must be put in place to confirm
investor commitment. This bond will be returned
to unsuccessful bidders, but will be kept when the
bidder is successful. After emerging successful, a
developer will be given a time limit to meet the
financial closure. If not met, the project developer
forfeits the bond. When financial closure is met in
time, the developer has an option to convert the
bond into a performance bond.
The System Operator generates an Annual Power Requirements Report detailing location and type of demand for electricity, projected gas supply and other fuel capabilities amon other things
NERC furnishes Successful Bidders to NBET after review.
NBET issues Request for Proposal to Successful Bidders composed of a Technical Proposal and a Commercial Proposal
The RFP shall also contain standardized Financial Model for populating among other Supporting Documents
Bidders shall enter into the following Agreements as part of the RFP among other Agreements:
I. Power Purchase Agreement
II. Engineering, Procurement & Construction Contract
III. Electricity Interconnection Agreement
Interested parties submit Bids based on the globally publicized Expression of Interest
NBET reviews submitted Bids based on the technical expertise, financial capability, and operating experience.
Competitive Procurement Management Committee reviews shortlisted Bidders and forwards to Nigerian Electricity Regulatory Commission for final approval
Evaluation of the Proposals shall be conducted on the following basis:
Technical Coherence and Feasibility; Ability of Bidder to achieve Financial Close; and the Price per mW submitted.
NBET shall fprward outcome of the Evaluation to NERC for auditing by the Tender Auditor.
After audit, NBET shall execute PPA with Preferred Bidder based on satifactory negotiations.
NBET Power Procurement department reviews Report and btains Managerial approval for issuing Expression of Interest (EOI) for the procurement of generation capacity.
Initiation of Procurement
Due Diligence Review
Successful Bidders
Evaluation of Proposals
Approval of Preferred Bidder
Figure 6.6 Overview
of NBETs process for
competitive procurement
(NBET)

106
Market Study and Project Scouting Nigeria
Application for Provisional Approval (PA) to TCNAny prospective grid-connected IPP is required by
NERC to obtain a provisional approval from TCN
which will show that the TCN has the capacity to
evacuate the power generated on site.
The procedure required for an IPP to have their
produced power be transmitted by the TCN is
depicted in Figure 6.7. It is necessary to conduct an
“evacuation study” which in the past was done by
TCN, but these days the TCN has an approved list of
consultants who perform this study. The provisional
approval allows the prospective IPP to connect
to the grid and from this point the IPP promoter
can go to NERC to start processing a licence. The
evaluation of the evacuation study is done free of
charge by the TCN.
Note that just before publication of this document
the management of the Transmission Company of
Nigeria has changed when the contract with the
Canadian company Manitoba was not renewed.
There may be new processes and regulations as a
result.
Stakeholder feedback on liaising with regulatory bodies The processes for licencing and other legal
requirements for starting and running a power
plant can be quite complex. There are a lot of
processes that are not explicitly stated. The system
lacks standardisation; therefore, different entities
may be subject to varying licencing processes. These
processes are seen to be in constant flux.
In addition, stakeholders interviewed for this report
mention the following challenges:
» Planning processes are interrupted by different
political administrations and the involvement of
different government agencies.
Figure 6.7 Procedure for
IPP to be able to transmit
power by the TCN (TCN)
Negotiate
General Con-
nection Agreement
& Ancillary Services
Agreement with TCN while
negotiating licence
from NERC
1
Secure right of way.
This is a requirement
of the TPA that the IPP
developer will sighn with
the TCN
2
Take the issued PA to the
NRC and apply for license
to be issued
4
Open formal
negotioations
with NBET
5
Sign sub-station
agreement required for
TPA then proceed to sign
TPA with the TCN
3
Procedure required for an IPP to have their produced power be transmitted by the TCN

107
Chapter 6 Project Developer Information
» Lack of transparent and competitive bidding for a
power project.
» Many PPAs are structured as “take-or-pay”
agreements, which means that the purchaser
will pay the seller not only for the power actually
delivered to the point of delivery, but also for
“available capacity,” or power that would have
been delivered but for the curtailment. The
unnecessarily long duration of a power purchase
agreement (PPA) will lock in a high cost structure
in the grid system because of this take-or-pay
clause in the agreement.
» Regulatory governance is not sufficiently trans-
parent or accountable.
» Unpredictability of the regulatory decisions.
» Poor communication within the agencies.
While many developers report challenges with
the regulatory process, there are also entities
that call the process smooth. From the interviews
conducted for this report, it emerges that the
challenges were more pronounced at the beginning
of the privatization process, but great efforts to
streamline the process have been made recently.
Furthermore, officials show a willingness to support
project developers, even if they sometimes lack the
specific knowledge required. This holds particularly
for renewable energy, as most officials are more
informed about conventional energy. The only
regulatory difficulty remains with off-grid/ mini
grid projects, for which there is no clear regulatory
framework yet.
Some of the larger, foreign-backed players in the
industry confirm that the regulators tend to listen
to industry players. Moreover, the feedback is that
it is possible to deal with the government in a
transparent and effective way as well.
Other relevant regulations
Obtaining land rightsPurchasing or leasing land, and obtaining the right
of way are described as some of the major hurdles
by our respondents. However, it is important to
note that in Nigeria, acquiring land and the right of
way is only one step: a project developer also should
bring the local community on board before, during
and after this process. While this is not a regulatory
requirement, it is essential in the Nigerian context.
It is not uncommon for local communities to
demand free electricity for hosting a power plant in
their area, or to demand employment and training
for the youth.
State Governors grant statutory right of occupancy
and determine lease conditions on both urban and
non-urban land, with ease periods of up to 99 years
for residential plots and 40 years for industrial plots.
Nigeria has no restrictions on property ownership
by non-residents. However, a foreigner or foreign
entity must obtain written approval of the Governor
of the State in which he or she wants to buy land,
before the transaction can be executed. Moreover,
a foreigner can obtain these land rights for only 25
years.
The Land Use Act as amended in 2004 establishes
a uniform system of landholding for the entire
country. Land acquisition in Nigeria involves the
same basic legal principles, regardless of the
particular State of the Federation in which the land
is located. This provision does not discriminate
between indigenes and non-indigenes. When
properly applied it would mean all entities have
equal opportunity for acquiring land throughout
the entire country.
While the Act applies to the entire country, there
are differences in some processes and fees between
States, and any project developer would do well to
check such specific requirements.

108
Market Study and Project Scouting Nigeria
Figure 6.8 Procedure for
land acquisition
Procedure for right of way acquisition Acquiring the Right of Way is a necessary step when
setting up a power plant. It must be secured from
the State government for the construction of the
spur line that will connect a power plant to the
approved connection point. This is a requirement of
the Transmission Project Agreement that the power
project developer will also sign with the TCN.
The procedure for right of way acquisition is divided
into four steps. These steps are:
Step I: Notification / Sensitization
Notification and sensitization of State and Local
Government(s), communities as well as individuals
affected.
Step II: Identification, Census, Enumeration and
Valuation
After the approval of the route survey and line
profile by TCN, census, enumeration and valuation
of properties along the right of way (ROW) were
commenced by representatives. Claimants are
notified of the date of enumeration of their
properties in specified areas. They are required to be
present to identify their property.
Step III: Payment of Resettlement/Compensation
Payment of compensation is based on the value of
affected properties. Payments are made directly
or indirectly to the owners of the property after
consultations with affected parties.
Apply for a right of occupancy from Government. When granting the right of occupancy, the Governor or Local Government issues a Certificate of Occupancy in evidence of the grant. However, other documents are sometimes issued.
Assessment of current holder’s title by real estate investor or legal pracitioner
Preparation of an appropriate legal documents
Obtain consent of the State or Local Government
Finally, obtain stamped and registered document
Land Acquisition
Land acquisition from the Nigerian Government
Acquisition of land from holders of interest under

109
Chapter 6 Project Developer Information
Figure 6.9 Procedure for
right of way acquisition Notification/Sensitization» State Government» Local Governments » Communities» Individuals
Consultation with Identified Stakeholders» Clan Councils» Villages/Communities» Individuals (PAPs)
Route Topographical Survey
Administer TCN Work Description
Enumeration/Valuation(including census) within ROW
Payment of Compensation
Post Payment Monitoring
Payment of Compensation Confirmation
EPC Mobilisation / Construction
Grievance Redress Mechanism
110
Market Study and Project Scouting Nigeria
Step IV: Post-compensation Issues
Project Affected Persons will be encouraged to
direct all post-compensation grievances to TCN
for investigation and verification through the
Grievance Redress Committee. Work activities will
not commence until resettlement/compensation
payments have been made to all affected persons.
Regulations on foreign investmentThe Nigerian Investment Promotion Council (NIPC)
is a one stop investment centre for the registration
of Foreign Businesses in Nigeria. General rules of
registering a business in Nigeria with the Corporate
Affairs Commission, Federal Inland Revenue Service
etc. also apply for investors, but foreign investors
will be required to register with NIPC as well as the
Ministry of the Interior and the Ministry of Power.
The full registration process takes around 30 days. In
2016 Nigeria ranked 139th out of 189 countries in the
category “starting a business” – a deterioration of
the 2015 ranking (131), but a higher ranking than for
most of the other indicators Nigeria was ranked on.
The NIPC Act of 1995 allows full foreign ownership
of firms, except in the oil and gas sector where
investment stays limited to joint ventures or
production-sharing agreements.
Power project developers are afforded pioneer
status. Under this rule power companies are
granted a statutory three year company income tax
holiday and an additional two years if they satisfy
certain conditions.
Foreign investors must register with the NIPC
after incorporation under the Companies and
Allied Matters Decree of 1990. The Act prohibits
the nationalization or expropriation of foreign
enterprises except in cases of national interest.
This regulation is done with the Corporate Affairs
Commission. Other agencies that play a role
in relation of foreign investment in Nigeria are
the National Office for Technology Acquisition
& Promotion (NOTAP), the Ministry of Internal
Affairs with the Nigerian Immigration Service.
Nigerian laws apply equally to domestic and foreign
investors. Relevant laws include:
» The Nigerian Oil and Gas Content Development
Act 2010,
» Nigerian Minerals and Mining Act of 2007,
» Nigeria Extractive Industries Transparency Initi-
ative (NEITI) Act of 2007,
» Central Bank of Nigeria Act of 2007,
» Electric Power Sector Reform Act of 2005,
» Money Laundering Act of 2003,
» Investment and Securities Act of 2007,
» Foreign Exchange Act of 1995,
» Banking and Other Financial Institutions Act of
1991, and
» National Office of Technology Acquisition and
Promotion Act of 1979
Regulations on export of capital and profitsInvestments in form of share capital contribution
or loans may be made in foreign currency but
information on such transactions must be
submitted to the CBN by the dealer within
24 hours in order to obtain a Certificate of Capital
Importation (CCI).
The following can be repatriated without hindrance
provided the foreign investor has a CCI:
» Dividends, rent, royalties, profits (net of taxes)
attributable to the investment.
» Payment of interest and capital on foreign loans.
» The remittance of proceeds (net of taxes) and
other obligations in the event of a sale or liqui-
dation of the enterprise or any interest attrib-
utable to the investment.
Authorized dealers of foreign currencies need to
notify the CBN of any cash transfer to or from a
foreign country of any sum in excess of $ 10,000.
A tax clearance certificate is required to remit
dividend and interest out of the country.

111
Chapter 6 Project Developer Information
Security of investmentWorld Bank guarantee products provide credit
support to the Nigerian Bulk Electricity Trading
Company PLC as it enters into power purchase
agreements with successor generating companies
and existing independent power producers (IPPs)
as well as potential new entrants into the power
generating market. The Multilateral Investment
Guarantee Agency (MIGA)’s mandate is to promote
foreign direct investment (FDI) in developing
countries by providing guarantees (political risk
insurance and credit enhancement) to investors
and lenders. MIGA’s guarantees protect investments
against non-commercial risks and can help
investors obtain access to funding sources with
improved financial terms and conditions. Covers
are against Currency Inconvertibility and Transfer
Restriction / Expropriation / War, Terrorism, and
Civil Disturbance / Breach ofContract.29
The Business Environment
Nigeria is known to be a difficult country for doing
business; the World Bank consistently ranks Nigeria
in the lower regions (see also the first chapter).
Generally speaking, there are many inefficiencies
and bottlenecks in Nigeria. The result is a relatively
high cost for executing any project, and for doing
business altogether.
Project developers have developed strategies on
how to overcome these challenges, some of which
are highlighted below. A fundamental challenge
experienced by investors in the Nigerian power
sector is the lack of integrity and frequent breaches
of contracts. Equally challenging is the financial
environment.
Financial considerations Investors are concerned about the bankability
of their project ideas and see the market as
challenging at the moment. Financial Derivatives
29) http://siteresources.worldbank.org/EXTGUARANTE/Resources/
structure.pdf
Company states in one of its reports that the Multi-
Year Tariff Order (MYTO) is not cost reflective as
most NERC allowable revenue variables (exchange
rate, inflation, gas cost etc.) are not in tandem
with current macroeconomic landscape thus with
implied implication on a company’s profitability.
This means that without a proper change in the
electricity tariff, it will be very difficult to actually
make money. Recently the tariff was increased,
giving the industry hope, but that decision has been
overturned and is currently being fought in court.
It is uncertain if a tariff reflecting all costs will be
allowed in the near term. This puts further pressure
on the developers, in an environment where the
earning model is faulty, or rather: where project
developers have little influence over the payments
they can receive.
Some say the private power market has not yet
developed to the stage the government expected
that it would be by now. There are a large number
of projects NBET is considering at the moment but
they are not yet viable, essentially because DisCos
have difficulties collecting money and paying the
players up the value stream through NBET.
Banks have become reluctant to finance as they
consider the risk of default to be high. Furthermore,
project developers have limited access to funds
in capital markets due to the lack of confidence
the financiers have in the government vis-à-vis
their obligations, and the local banks’ exposure
to the under-performing loans of the parties that
bought the industry assets upon privatization. Even
for smaller and renewable projects, the cost of
technology is relatively high. For project developers
it is moreover important to have multiple streams
of investment to reduce risk and increase total
investment.
112
Market Study and Project Scouting Nigeria
Strategies proposed by stakeholders to overcome key challenges
Doing business in Nigeria is far from easy, and for
a project developer in a changing and relatively
new sector it can be even more challenging.
Stakeholders have developed many strategies and
advice for (international) project developers and
investors, and their input can broadly speaking be
clustered as per the paragraphs below.
Be flexible and willing to adjustA developer needs to be flexible and willing to
adjust with time. Essentially, investors need to
understand that the rules and road map are not
very clear, and should be able to accommodate for
that. You also need to be patient, and be able to
be patient in terms of resources. If you can buffer
your one or two years of instability getting all your
contracts signed, then you are good. Some officials
are better than others, which is also why several
experts would recommend that a project developer
selects a forward thinking and cooperative State
when deciding on the venue for the power plant.
However, being flexible does not equate with
‘bribing your way’. While many of the industry
stakeholders interviewed confirmed that corruption
is still a problem in the sector and that you should
take on a local ‘consultant’ to pave the way, you
don’t have to make the problem worse by taking
bribery as your first strategy. Instead, your strategy
should be to always be transparent, take everyone
along in the process, inform diligently, and build
capacity/ knowledge, including with those in
charge.
Work with a local partnerIn nearly every sector in Nigeria, market entry and
development is greatly facilitated when working
with a local partner. However, it has to be the
right partner, as having the wrong partner can
set you back significantly. This means the partner
should have the right background, track record,
connections and financial capacity to be of support.
Some officials and experts interviewed recommend
that foreign investors work with local parties,
but that they should also ensure that this local
developer has the right documentation and
commitment to their project. Foreign investors
should verify those documents presented by local
developers before commencing the project; due
diligence is an integral part in selecting a partner.
When it comes to identifying a local technical
partner, project developers should be aware that
their capacity is often insufficient, as several of
the respondents mentioned. Therefore, several
recommend a foreign developer should identify
strong international (technical) partners to work
with, since local capacity is not yet good enough for
large projects in terms of delivering within time and
budget, and installing the right infrastructure.
Secure financial viability of your projectFinancial concerns are significant, as noted above.
Therefore, it makes sense to set up power projects
where you can directly sell to clients who you can
directly negotiate a price with. This is however
often not possible in practice due to regulatory
constraints. For non-captive projects it would
only be possible in an embedded structure, with
a DisCo that is financially strong and committed.
This structure is pioneered by Egbin Power Plant, as
discussed before.

113
Chapter 6 Project Developer Information
Be as self-reliant as possibleAs several of our respondents argue, the less you
require from the government the faster you succeed
in setting up your plant. But this independence
should stretch to ensuring control over the entire
value chain, starting with owning the land on
which you base the power plant as well as having
ownership and maintenance of power lines under
own control. The thought is by ‘controlling’ or
having a stake in the entire value chain you can
avoid challenges that might otherwise arise.
Ultimately, doing business in Nigeria will not be
easy and the power sector may be even more
challenging than some of the other sectors.
However, it is possible to get things done. As one of
the experts put it: “Don’t be opportunistic and think
that e.g. with the right government connections
you can quickly make money. Instead, be realistic
and have a long term focus.”

114
Market Study and Project Scouting Nigeria

115ANNEXES
116
Market Study and Project Scouting Nigeria
Abila, N. (2014), Biofuels Adoption in Nigeria. Available at: http://www.uva.fi/materiaali/pdf/isbn_978–
952–476–563–3.pdf
ACAS-LAW (2014), Local Content Regulation for Nigeria’s Power Sector. Available at: http://www.acas-law.
com/assets/power-johnasokhia-150413152651-conversion-gate01.pdf (accessed 14/06/2016)
ActionAid Nigeria (2015), Corruption and Poverty in Nigeria, Available at: http://www.actionaid.org/sites/
files/actionaid/pc_report_content.pdf
Advisory Power Team (2015), Nigeria Power Baseline Report. Available at: http://www.nesistats.org/
uploads/3/6/3/6/3636925/20150916_nigeria_energy_power_report_final.pdf
Agba, A., Ushie, M.E., Abam, F.I. and M.S. Agba (2010), Developing the Biofuel Industry for Effective Rural
Transformation in Nigeria, Eur. J.f Sci. Res. 40(3):441–449”
CIA (2012), The World factbook. Available at: http://www.cia.gov/library/publications/the-world -factbook/
index.html (accessed 24 August 2012)
CIA (2015), The World Factbook. Available at: https://www.cia.gov/library/publications/the-world-
factbook/fields/2122.html (accessed 2015)
CRET (2015), Renewable Energy in Nigeria, final report for the embassy of the republic of Korea
Daily Trust (2016), Nigeria to re-focus on renewable energy, Daily Trust, 20 January 2016
DCS (2016), Prospects of solar power in diversifying Nigeria’s energy mix. Available at: http://www.
financialnigeria.com/prospects-of-solar-power-in-diversifying-nigeria-s-energy-mix-feature-67.html
Detail Commercial Solicitors (2012), The Concept of Embedded Generation, workshop on the embedded
generation framework in the Nigerian electricity supply industry 15th November, 2012
Eberhard, A. and K. N. Gratwick (2012), Light inside: the experience of independent power projects in
Nigeria. Available at: http://www.gsb.uct.ac.za/files/lightinside.pdf (accessed 28/06/2016)
ECN (2014), Energy Implications of Vision 20: 2020 and Beyond, Report no.: ECN/EPA/2014/01
ECN (2015), Nigeria Energy Calculator 2050 (NECAL 2050), http://www.nigeria-energy-calculator.org/
ECREE (2012), Baseline Report on Small-Scale Hydropower in the ECOWAS Region. Available at:
http://www.ecreee.org/sites/default/files/documents/basic_page/ecowas-unido_sshp_baseline_report.
Eisa, M. and C. Visvanathan (2002), Municipal solid waste management in Asia and Africa: A comparative
analysis, United Nations Industrial Development Organization. Vienna, Austria, 69 p.
Ekwueme, C (2016), Land Acquisition in Nigeria. Available at: http://www.ekwueme.com/pages/
landacquisition.php (accessed 14/06/2016)
FAO (2013), Nigeria country profiles. Available at: http://www.fao.org/countryprofiles/index/en/?iso3=NGA
ANNEX A. REFERENCES
http://www.ecreee.org/sites/default/files/documents/basic_page/ecowas-unido_sshp_baseline_report.pdf

117
Annexes
Financial Nigeria (2016), Opportunities for off-grid solutions in the Nigerian power sector. Available at
http://www.financialnigeria.com/opportunities-for-off-grid-solutions-in-the-nigerian-power-sector-
sustainable-293.html#sthash.RPNv9r5G.dpuf (accessed 16/06/2016)
FMP (2015), NATIONAL RENEWABLE ENERGY AND ENERGY EFFICIENCY POLICY (NREEEP). Available at http://
www.power.gov.ng/download/NREEE%20POLICY%202015-%20FEC%20APPROVED%20COPY.pdf
Foraminifera (2012a), How to make huge profit supplying sorghum to local industries to Nigeria; Feasibility
report. Available at: http://www.foramfera.com/index.php/market-research-reports/item/306-how-to-
make-huge-profit-supplying-sorghum-to-local-industries-in-nigeria-the-feasibility-report (accessed 18 Jan
2016)
Foraminifera (2012b), Maize cultivation in Nigeria; The investment opportunity. Available at: http://
foramfera.com/index.php/investment-opportunities-in-nigeria/item/608-maize-cultivation-in-nigeria-the-
investment-opportunity (accessed 19 Jan 2016)
Foraminifera (2012c), Sorghum malt production in Nigeria. Available at http://foramfera.com/index.php/
news-and-press-release/item/628-sorghum-malt-production-in-nigeria-investment-opportunity-in-nigeria
(accessed 18 Jan 2016)
Foraminifera (2012d), Supplying Maize to local industries in Nigeria; How Viable. Available at: http://
www.foramfera.com/index.php/investment-opportunities-in-nigeria/item/146-supplying-maize-to-local-
industries-in-nigeria-how-viable? (accessed 19 Jan 2016)
Foraminifera (2013), Rice, Milling and Packaging in Nigeria, The Feasibility report. Available at: http://www.
foramfera.com/index.php/market-research-reports/item/580-rice-milling-and packaging-in-nigeria-the-
feasibility-report (accessed 18 Jan 2016)
GAIN (2014), Nigeria provides export market for Oilseeds and Products, 6 March 2014
GAIN (2016), Grain and Feed annual Nigeria, 21 April 2016
GIZ (2013), Survey of Power Demand and Energy Consumption in the Industrial Sector in Nigeria
GIZ (2014), The Nigerian Energy Sector–an Overview with a Special Emphasis on Renewable Energy, Energy
Efficiency and Rural Electrification. Available at: https://www.giz.de/en/downloads/giz2014-en-nigerian-
energy-sector.pdf
GIZ (2015), The Nigerian Energy Sector–An Overview with a Special Emphasis on Renewable Energy, Energy
Efficiency and Rural Electrification. Available at: https://www.giz.de/en/downloads/giz2015-en-nigerian-
energy-sector.pdf
GIZ (2015b), Report of base line study on the rice sector in Niger state
GOV UK, Foreign travel advice Nigeria. Available at: https://www.gov.uk/foreign-travel-advice/nigeria
(accessed 1 May 2016)

118
Market Study and Project Scouting Nigeria
GreCo Power & Energy Ltd. (2016), Comparative study of some locally produced waste resources from
agricultural and domestic activities in Nigeria
Harambee, T (2012), Nigeria Boosts Efforts to Obtain High Yield Maize Production. Available at: http://
harambeetoday.org/index.php/economics/item/1564-nigeria-boosts-efforts-to-obtain-high-yield-maize-
production/1564-nigeria-boosts-efforts-to-obtain-high-yield-maize-production (accessed 19 Jan 2016)
Indexmundi (2014), Nigeria sorghum production by year. Available at: http://www.indexmundi.com/
agriculture/?country=ng&commodity=sorghum&graph=production (accessed 18 Jan 2016)
Indexmundi (2015), Nigeria Palm Oil Production Annual Growth Rate. Available at: http://www.
indexmundi.com/agriculture/?country=ng&commodity=palm-oil&graph=production-growth-rate
(accessed 19 Jan 2016)
KPMG (2013), A Guide to the Nigerian Power Sector. Available at: http://www.kpmg.com/Africa/en/
IssuesAndInsights/Articles-Publications/Documents/Guide%20to%20the%20Nigerian%20Power%20Sector.
KPMG (2015), Sector Report Manufacturing in Africa. Available at: http://www.kpmg.com/Africa/en/
IssuesAndInsights/Articles-Publications/General-Industries-Publications/Documents/Manufacturing%20
sector%20report%202015.pdf
Lagos Climate and Temperature. Available at: http://www.lagos.climatemps.com/
Lahmeyer (2005), Wind Energy Resource Mapping and Related Works Project, Lahmeyer International, 2005
Land Use Act Chapter 202 Laws of the Federation of Nigeria 1990. Available at: http://www.nigeria-law.
org/Land%20Use%20Act.htm (accessed 14/06/2016)
Land Use Act Chapter L5 Laws of the Federation of Nigeria 2004. Available at: http://www.lawyard.ng/wp-
content/uploads/2015/11/LAND-USE-ACT-2004.pdf (accessed 14/06/2016)
Latham & Watkins (February 2016), Nigerian Power Sector: Opportunities and Challenges for Investment in
2016, Client Alert White paper no 1930
Multilateral Investment Guarantee Agency (MIGA)-World Bank Group (2015), Investments Guarantee
Guide. Available at https://www.miga.org/documents/IGGenglish.pdf (accessed 29/06/2016)
My News Watch Times (2014), Nigeria spends over N356bn to import rice annually. Available at http://
www.mynewswatchtimesng.com/nigeria-spends-n356bn-import-rice-annually/ (accessed 18 Jan 2016)
NBET (2016a), A Step by Step Guide for NBET’s Unsolicited Power Procurement. Available at: http://
nbet.com.ng/developers/a-step-by-step-guide-for-nbets-unsolicited-power-procurement/ (accessed
09/06/2016)
NBET (2016b), Flow process for unsolicited bidders. Available at: http://nbet.com.ng/developers/a-step-by-
step-guide-for-nbets-unsolicited-power-procurement/ (accessed 09/06/2016)
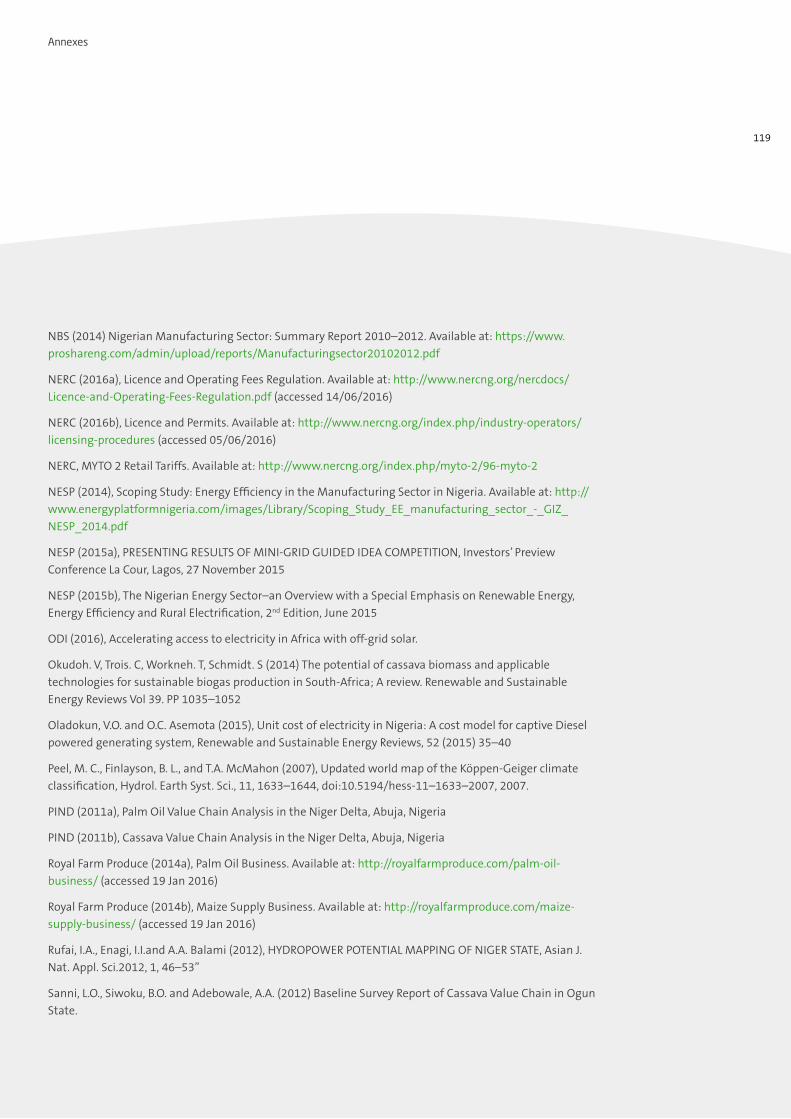
119
Annexes
NBS (2014) Nigerian Manufacturing Sector: Summary Report 2010–2012. Available at: https://www.
proshareng.com/admin/upload/reports/Manufacturingsector20102012.pdf
NERC (2016a), Licence and Operating Fees Regulation. Available at: http://www.nercng.org/nercdocs/
Licence-and-Operating-Fees-Regulation.pdf (accessed 14/06/2016)
NERC (2016b), Licence and Permits. Available at: http://www.nercng.org/index.php/industry-operators/
licensing-procedures (accessed 05/06/2016)
NERC, MYTO 2 Retail Tariffs. Available at: http://www.nercng.org/index.php/myto-2/96-myto-2
NESP (2014), Scoping Study: Energy Efficiency in the Manufacturing Sector in Nigeria. Available at: http://
www.energyplatformnigeria.com/images/Library/Scoping_Study_EE_manufacturing_sector_-_GIZ_
NESP_2014.pdf
NESP (2015a), PRESENTING RESULTS OF MINI-GRID GUIDED IDEA COMPETITION, Investors’ Preview
Conference La Cour, Lagos, 27 November 2015
NESP (2015b), The Nigerian Energy Sector–an Overview with a Special Emphasis on Renewable Energy,
Energy Efficiency and Rural Electrification, 2nd Edition, June 2015
ODI (2016), Accelerating access to electricity in Africa with off-grid solar.
Okudoh. V, Trois. C, Workneh. T, Schmidt. S (2014) The potential of cassava biomass and applicable
technologies for sustainable biogas production in South-Africa; A review. Renewable and Sustainable
Energy Reviews Vol 39. PP 1035–1052
Oladokun, V.O. and O.C. Asemota (2015), Unit cost of electricity in Nigeria: A cost model for captive Diesel
powered generating system, Renewable and Sustainable Energy Reviews, 52 (2015) 35–40
Peel, M. C., Finlayson, B. L., and T.A. McMahon (2007), Updated world map of the Köppen-Geiger climate
classification, Hydrol. Earth Syst. Sci., 11, 1633–1644, doi:10.5194/hess-11–1633–2007, 2007.
PIND (2011a), Palm Oil Value Chain Analysis in the Niger Delta, Abuja, Nigeria
PIND (2011b), Cassava Value Chain Analysis in the Niger Delta, Abuja, Nigeria
Royal Farm Produce (2014a), Palm Oil Business. Available at: http://royalfarmproduce.com/palm-oil-
business/ (accessed 19 Jan 2016)
Royal Farm Produce (2014b), Maize Supply Business. Available at: http://royalfarmproduce.com/maize-
supply-business/ (accessed 19 Jan 2016)
Rufai, I.A., Enagi, I.I.and A.A. Balami (2012), HYDROPOWER POTENTIAL MAPPING OF NIGER STATE, Asian J.
Nat. Appl. Sci.2012, 1, 46–53”
Sanni, L.O., Siwoku, B.O. and Adebowale, A.A. (2012) Baseline Survey Report of Cassava Value Chain in Ogun
State.

120
Market Study and Project Scouting Nigeria
Simonyan, K.J. and O. Fasina (2013), Biomass resources and bioenergy potentials in Nigeria, African Journal
of Agricultural Research, Vol. 8(40), pp. 4975–4989, 17 October, 2013,
Simpson, Brent M. (2011), Extension and Value Chain Development, Michigan State University / USAID
The World Bank Partial Risk Guarantee Programme (PRG) Nigeria, World Bank Support for Power Sector
Reforms Mobilizing Financing, Available at: www.nigeriaelectricityprivatisation.com/wp-content/
plugins/.../download.php?id=30 (accessed 28/06/2016)
This Day Live (2013a), Investment in Cassava Farming and Processing Projects. Available at: http://www.
thisdaylive.com/articles/investment-in-cassava-farming-and-processing-projects/142523 (accessed 18 Jan
2016)
This Day Live (2013b), Nigeria Expects High Revenue from Cassava Production. Available at: http://www.
thisdaylive.com/articles/nigeria-expects-high-revenue-from-cassava-production/166564/ (accessed 18 Jan
2016)
This Day Live (2015), Palm Oil Importation: A Strategic Stabiliser for Palm Oil Industry in Nigeria. Available
at: http://www.thisdaylive.com/articles/palm-oil-importation-a-strategic-stabiliser-for-palm-oil-industry-
in-nigeria/198476/ (accessed 19 Jan 2016)
Trade economics, Nigeria GDP Annual Growth Rate. Available at: http://www.tradingeconomics.com/
nigeria/gdp-growth-annual TCN, 30 June 2015
USAID (2013), opportunity assessment: Investment On the Lakaji Agricultural Growth Corridor. Available at:
http://pdf.usaid.gov/pdf_docs/PA00KDHK.pdf
Vanguard Nigeria (2012), The Nigerian Palm Oil Industry. Available at http://www.vanguardngr.
com/2012/04/the-nigerian-palm-oil-industry-what-went-wrong-and-the-way-forward-part-1–3/
(accessed 19 Jan 2016)
Vanguard Nigeria (2013), Nigeria to produce high-energy food from sorghum to reduce malnutrition.
Available at: http://www.vanguardngr.com/2013/06/nigeria-to-produce-high-energy-food-from-sorghum-
to-reduce-malnutrition/ (accessed 18 Jan 2016)
World Bank Group Guarantee Instruments, Structure of IBRD/IDA, IFC, and MIGA Contractual Framework.
Available at: http://siteresources.worldbank.org/EXTGUARANTE/Resources/structure.pdf (accessed
29/06/2016)
World Bank (2015), Doing Business in Nigeria 2015. Available at: http://www.doingbusiness.org/data/
exploreeconomies/nigeria/
World Databank. Available at: http://databank.worldbank.org/data/reports.
aspx?source=2&country=NGA&series=&period=
World Grain (2015), Focus on Nigeria. Available at: http://www.world-grain.com/Departments/Country%20
Focus/Country%20Focus%20Home/Focus%20on%20Nigeria%202015.aspx?cck=1 (accessed 18 Jan 2016)

121
Annexes
Used websites
faostat.fao.org
nbet.com.ng
www.afd.fr
www.afdb.org/en/countries/west-africa/nigeria
www.businessjournalng.com
www.energyplatformnigeria.com
www.financialnigeria.com
www.iea.org
www.iea.org/statistics/resources/balancedefinitions/#agforestry
www.ilo.org
www.jica.go.jp/nigeria
www.kara.com.ng
www.nepza.gov.ng/freezones.asp
www.nercng.org
www.ng.undp.org/content/nigeria/en/home/operations/projects/environment_and_energy
www.noi-polls.com
www.nyenet.com
https://www.riskmaps.aon.co.uk/
www.solar-ng.com
www.tcnorg.com
www.thisdaylive.com
www.tradingeconomics.com
www.uis.unesco.org
www.usaid.gov/powerafrica/nigeria
www.worldpowerfaqs.com
www.xe.com

122
Market Study and Project Scouting Nigeria
Sixteen FTZ’s are focussed on Manufacturing and one on Food Processing.
ANNEX B. LIST OF FREE TRADE ZONES IN NIGERIA
# Name Location Date of designation Specialty
1 Calabar Free Trade Zone Cross River June 14, 1905 Manufacturing, Oil & Gas, Logistic Services
2 Kano Free Trade Zone Kano June 20, 1905Manufacturing, Logistic Services, Warehousing
3 Tinapa Free Zone & Resort Cross River October 7, 2004 Manufacturing, Trade, Tourism & Resort
4 Snake Island Int. Free Zone Lagos April 4, 2005 Steel Fabrication, Oil & Gas, Sea Port
5 Maigatari Border Free Zone Jigawa June 22, 1905 Manufacturing, Warehousing
6 Ladol Logistics Free Zone Lagos June 21, 2006Oil & Gas, Fabrication, Oil & Gas Vessels, Logistics
7 Airline Services EPZ Lagos March 21, 2003 Food Processing and Packaging
8 ALSCON EPZ Akwa Ibom June 1, 2004 Manufacturing
9 Sebore Farms EPZ Adamawa December 21, 2001 Manufacturing, Oil & Gas, Petrochemical
10 Ogun Guandong FT Zone Ogun February 28, 2008 Manufacturing
11 Lekki Free Zone Lagos December 4, 2008 Manufacturing, Logistics
12 Abuja Tech. Village Free Zone FCT May 18, 2007 Science & Technology
13 Ibom Science & Tech. FZ Akwa Ibom July 14, 2006 Science & Technology
14 Lagos Free Trade Zone Lagos October 4, 2002 Manufacturing, Oil & Gas, Petrochemical
15 Olokola Free Trade Zone Ondo & Ogun June 26, 1905 Oil & Gas and Manufacturing
16 Living Spring Free Zone Osun October 12, 2006 Manufacturing, Trading and Warehouse
17 Brass LNG Free Zone Bayelsa February 2, 2007 Liquefied Natural Gas
18 Banki Border Free Zone Borno Manufacturing, Warehousing, Trading
19Oils Integrated Logistics Services Free Zone
Lagos October 12, 2004Marine, Logistics, Support Services for offshore Oil Repairs
20 Industrial FTZ Ogun April 30, 2007 Rail Cargo Transport
21 Imo Guangdong FTZ Imo May 7, 2007 Manufacturing
22 Kwara Free Zone Kwara July 10, 2009 Trading, Warehousing
23 Koko Free Trade Zone Delta December 2, 2009 Manufacturing
24 Oluyole Free Zone Oyo May 16, 2000 Manufacturing
25 Ibom Industrial Free Zone Akwa Ibom Feb 20, 2012 Manufacturing, Oil & Gas, Trading Services
Figure B.1 List of Free
Trade Zones in Nigeria (GN)
Source: http://www.nigeriatradehub.gov.ng/Portals/0/Documents/LIST%20OF%20FREE%20TRADE%20ZONE%20IN%20NIGERIA.pdf

123
Annexes
Figure C.1 Issued licenses
for generation capacity
(NERC, January 2016)
ANNEX C. OVERVIEW AND ANALYSIS OF NERC LICENSES AND PERMITS
Since 2013, progress has been made with policy
reforms for renewable energy, energy efficiency
and rural electrification. The focus of the reforms
has however been on grid-connected electricity
production. A very limited set of relevant policies
and regulations is applicable to the captive power
sector.
From REGULATION NO: NERC-R-0108 the following
definitions are derived:
» Captive power means generation of electricity
exceeding 1 MW for the purpose of consumption
by the generator itself, and not sold to a third-party.
» Any person wishing to construct, own, maintain,
install, and/or operate a captive generating plant
shall first apply for and obtain a permit issued by
the NERC.
» A permit holder must apply for, and receive prior
written consent of the NERC before supplying
surplus power not exceeding 1 MW to an
off-taker.
» A permit holder who intends to supply surplus
power exceeding 1 MW to an off-taker must
apply for a generation licence in compliance with
the provisions of Section 62(2) of the Act.
LicensesBased on an overview (Figure C.1 and Figure C.2) of
the licenses, the following can be concluded:
» The majority (98%) of licensed generation
capacity is grid-connected.
» A little bit over a third (37%) of the licensed
generation capacity is actually operational.
» Three quarters (77%) of licensed renewable
generation capacity (1.969 MW) is from hydro
power.
» Of the licensed renewable generation capacity
only hydropower is actually operational
(1.930 MW).
» Since 2013 the number of issued (and probably
also requested) generation licenses and the
overall generation capacity (in MW) is declining.
An exception is the number of ‘small’ (<100 MW)
renewable energy projects. Between 2011–2015
the number of issued licenses has grown
gradually to four annually.
» Embedded power generation is almost non-
existent.
363423
33.433
10340
12.250
Licensed generation capacity (MW)
Licensed operational generation capacity (MW)
Captive and surplus power means: generator produces electricity mainly
for own use but sells electricity (in excess of 1 MW) to an off-taker.

124
Market Study and Project Scouting Nigeria
Figure C.2 Issued licenses
for renewable generation
capacity (NERC, January
2016)
Permits for captive power projectsBased on an overview (see Figure C.5 – Figure C.7)
of captive power permits (5-year tenure) that have
been issued by NERC between 2010 and 2013
(www.nercng.org), the following can be concluded:
» In total 1.300 MW of Captive Power permits have
been issued.
» 78% of the permits were issued in three states:
Akwa Ibom (22%), Ogun (25%) and Rivers (31%);
the major industrialised and oil and gas states.
» The majority of the issued permits (23; 46% of
the total) is for the oil and gas sector and this
sector also represents the highest planned gener-
ation capacity; 941 MW, 72% of the total planned
capacity.
» The agri-food sector is second with ten permits
and planned generation capacity of 121 MW (9%).
» It is unclear if there are renewable energy
projects amongst these captive power projects
but it seems unlikely.
A rough estimation of the total market for self-
generated power in Nigeria is between 14 and 20
GW, while the total issued licenses and permits
for captive power add up to about 1.700 MW. This
reveals that a large share of the self-generated
power market has a maximum generation capacity
below 1 MW and / or captive power generation is
not accounted for in the overviews of permits and
licenses that are available.
Wind
Hydro
PV
Licensed Renewable generation capacity (MW) Operational Renewable generation capacity (MW)
1.969489
100
1.930

125
Annexes
Figure C.3 Overview of
issued generation licenses
[NERC, January 2016]
Issued generation licences
Issued Renewable generation licenses
‘06 ‘07 ‘08 ‘09 ‘10 ‘11 ‘14‘12 ‘15‘13
7.000
6.000
5.000
4.000
3.000
2.000
1.000
0
30
25
20
15
10
5
0gene
rati
on c
apac
ity
(MW
)
# of
lice
nses
1.400
1.200
1.000
800
600
400
200
0
4
3
2
1
0‘06 ‘07 ‘08 ‘09 ‘10 ‘11 ‘14‘12 ‘15‘13
gene
rati
on c
apac
ity
(MW
)
# of
lice
nses
total generation capacityoperational capacity# licences# operational projects
total generation capacityoperational capacity# licences# operational projects
Figure C.5 Overview of
issued Captive Power
permits 2010–2013 (NERC)
Total generation capacity
# permits
600
500
400
300
200
100
0
25
20
15
10
5
0
374
2010
583,5
2012
342
2011
# is
sued
per
mit
s
gen
erat
ion
cap
acit
y (M
W)
11
22
17
Figure C.4 Overview
of issued Renewable
generation licenses (NERC,
January 2016)

126
Market Study and Project Scouting Nigeria
Figure C.7 Overview
of issued permits and
planned generation
capacity per sector,
2010–2013 (NERC)
gen
erat
ion
cap
acit
y (M
W)
400
350
300
250
200
150
100
50
0
Ogu
n123
Imo
9
Kadu
na
59
Edo
7
Cro
ss
50
Kats
ina
3
Kan
o
32,5
FVT
2
Ana
mbr
a
1
400
Rive
rs
325
Lago
s
282
Akw
a
1000
900
800
700
600
500
400
300
200
100
0
25
20
15
10
5
0Water
TreatmentTourism Building and
ConstructionTextiles Manufacturing Agri-Food
120,5
941
74
14
146
13
Oil and Gas
# of
per
mit
s
MW
Generation capacity (MW)
# permits
Captive Power permits issued by NERC
Figure C.6 Overview of
issued Captive Power
permits per state between
2010–2013 (NERC)

127
Annexes
Figure D.1 Hybrid Solar-
Wind power systems
under development (CRET,
2015; Federal Ministry of
Environment)
ANNEX D. PLANNED RENEWABLE ENERGY PROJECTS
The tables below present an overview of renewable energy projects that have been announced. The status
of these projects and the likelihood these projects will be completed, is unknown.
SOLAR AND WIND ENERGY PROJECTS CAPACITY (MW) PROPONENT
SOLAR-WIND FARM AT ATACHIDA TOWN, WURNO LGA, SOKOTO STATE.
50 FALMATA AND HINNAI NIG. LTD.
S/N SOLAR ENERGY PROJECTS STATECAPACITY (M/W)
PROPONENT
1 PV GRID - TIED GENERATOR SYSTEM AT ATAKUMOSA WEST LGA OSUN 50 ROOK SOLAR INVESTMENT LTD.
2 EVER POWER SOLAR POWER PLANT AT MANCHOK, KAURA LGA KADUNA 50 QUAINT GLOBAL ENERGY LTD.
3 SOLAR FARM PROJECT AT NJUMTILO, MAIDUGURI BORNO 200 BORNO STATE GOVERNMENT
4 SOLAR FARM AT KADO KADUNA 59 SYNERGENT POWERSHARE NIG LTD
5 SOLAR INDEPENDENT POWER PROJECT, AT GANJUWA BAUCHI 100 NIGERIAN SOLAR CAPITAL PARTNERS
6 ANJEED KAFANCHAN POWER AT ZIPAK, KAFANCHAN, JAMA’A LGA KADUNA 50 ANJEED INNOVA LIMITED
7 SOLAR PHOTO-VOLTAIC POWER GENERATION PROJECT AT YABO LGA SOKOTO 50 GEO ENVIRNMENTAL SERVICES
8 SOLAR FARM PROJECT AT KANKIA KATSINA 30 KATSINA STATE GOVT
9 JAPANESE GRANT SOLAR POWER PLANT AT LOWER USMAN DAM FCT, ABUJA 0.9 FED. MIN. OF POWER. ABUJA.
10 ON-GRID SOLAR POWER GENERATION AT USMAN DAM FCT, ABUJA 200 99 EFFECTS ENERGY LTD
11 PHOTOVOLTAIC SOLAR FARM PROJECT AT KANKIA KATSINA 20 KATSINA STATE GOVERNMENT
12 SOLAR PROJECT AT DANMARKE, BUNGUDU LGA ZAMFARA 75 SPGS POWER LIMITED
13 SOLAR POWER PLANT, PANYAM DISTRICT, MANGU LGA PLATEAU 50 CT COSMOS LTD
14 SOLAR FARM AT RIKO, JIBIYA LGA KATSINA 10 SINOSUN INVESTMENT LIMITED
15 SOLAR GENERATION PLANT IN DAMATURU YOBE 1000 GOPA INT’L ENERGY CONSULTANT
16 PHOTO VOLTAIC POWER PLANT IN DUKPA/WUNA, GWAGWALADA FCT, ABUJA 100 LR-AARON POWER LIMITED
17 SHIRORO SOLAR POWER PROJECT AT SHIRORO LGA NIGER 300 NORTH SOUTH POWER COMPANY LTD
18 SOLAR POWER PLANT AT ABULE OLOKUTA VILLAGE, IREWOLE OSUN 50 ROMIX ENERGIES LTD
19 SOLAR POWER PLANT IN LAMBA VILLAGE, BAKURA LGA ZAMFARA 150 PV BAKURA LIMITED
20 SOLAR POWER PLANT AT USO, OWO LGA ONDO 25 CECUSAFE LIMITED
Figure D.2 Solar power
systems under development
(CRET, 2015; Federal
Ministry of Environment)

128
Market Study and Project Scouting Nigeria
21 SOLAR FARM AT GUSAU, GUSAU LGA ZAMFARA 50 SINOSUN INVESTMENT LIMITED
22 SOLAR PANELLED POWER PROJECT, KEFFI LGA NASSARAWA AVENSOL SOLAR POWER NIG. LTD
23 SOLAR FARM AT KIRU LGA KANO 40 BRAVOS ENERGY RESOURCES
24 SOLAR PROJECT IN KANKIYA LGA KATSINA 125 NOVA SOLAR 5 FARMS LTD
25 SOLAR ENERGY PROJECT IN UDI LGA ENUGU 1200 MOTIR SEASPIRE ENERGY NIGERIA LTD
26 SOLAR PLANTS IN DUTSE LGA JIGAWA NOVA SCOTIA POWER DEV LTD
27 SOLAR POWER PLANT (OROCERAM), ISOKUN OLOPAN, ILORIN SOUTH KWARA 150 OROCERAM LIMITD
28 SOLAR POWER PLANT (OROCERAM), DOBWA JERE PAIKO LGA NIGER 150 OROCERAM LIMITD
29 SOLAR POWER PLANT IN DUTSE LGA JIGAWA 75 PAS DUTSE LTD
30 SOLAR POWER PLANT IN HADEJIA LGA JIGAWA 75 PAS HADEJIA LTD
31 SOLAR ENERGY PROJECT AT GWAGWALADA AREA COUNCIL FCT, ABUJA SUPER SOLAR NIGERIA LTD.
32 SOLAR ENERGY PROJECT AT GWAGWALADA AREA COUNCIL FCT, ABUJA 100 ENERLOG LIMITED
33 SOLAR POWER PROJECT IN YABO SOKOTO 100 KVK POWER NIGERIA PVT LTD
34 SOLAR POWER PLANT IN KANKIA LGA KATSINA 80 PAN AFRICA SOLAR LIMITED
35 SOLAR POWER PLANT AT LAMBAN VILLAGE, BAKURA LGA ZAMFARA 300 BAKURA ENERGY LIMITED
36 SOLAR PLANT IN ONYI, KOKONA LGA NASARAWA 50 AFRINGIA POWER LIMITED
37 SOLAR POWER PLANT AT NUMAN, NUMAN LGA ADAMAWA 35HILL CREST ENV. MANAGEMENT COY LTD.
38 RENEWABLE ENERGY AT OWO LGA ONDO 10 GOTTPOWER LIMITED
S/N WIND ENERGY PROJECTSCAPACITY (M/W)
PROPONENT
1 WIND POWER PROJECT AT VWEI KURU, JOS PLATEAU STATE. 100 JBS WIND POWER LTD
2 WIND IN COASTAL AREA PROJECT IN LEKKI TOWN, LAGOS STATE PRICEWATER HOUSE COOPERS LTD
3 WIND FARM POWER PLANT AT LAMBA, RIMI LGA, KATSINA STATE 10 FED. MIN. OF POWER
4 WIND FARM PROJECT AT ADO EKITI 8.5 ENERSYS NIG LTD
5 KATSINA WIND FARM 10 FED. MINISTRY OF POWER
6CGC NIG. LIMITED LOCATED AT PLOT 674 CAD ZONE, ALONG LUGBE EXPRESSWAY, FCT ABUJA
CGC NIGERIA
Figure D.3 Wind
power systems under
development (CRET,
2015; Federal Ministry of
Environment)

129
Annexes
Figure D.5 Biomass and
waste projects under
development (CRET,
2015, Federal Ministry of
Environment)
Figure D.6 Biofuels
projects under
development (CRET,
2015, Federal Ministry of
Environment)
S/N POWER STATIONCAPACITY (M/W)
COMPLETION YEARS
1 Zungeru, Niger State 700 20174
2 Mambilla, Taraba State 3,050 2018
3 Gurara I, Niger State 30 2014
4 Gurara II, Niger State 360 N/A
5 Itisi, Kaduna State 40 N/A
6 Kashimbilla, Taraba State 40 2015
7 Kano, Kano State 100 2015
8 Zamfara, Zamfara State 100 2012
9 Kiri, Adamawa State 35 2016
S/N BIO FUELS ENERGY PROJECTS PROPONENT
1 NNPC BIOMASS FUELS PROGRAMME (PLANTATION PROJECT)
2 AUTOMOTIVE BIOMASS ETHANOL PROGRAMME AT AKURE NNPC
3INTEGRATED SUGARCANE PLANTATION AND ETHANOL DISTILLERY PLANT IN BURUKU, BENUE STATE
NNPC
4INTEGRATED SUGARCANE PLANTATION AND ETHANOL DISTILLERY PLANT IN AGASHA, BENUE STATE
NNPC
5 AUTOMOTIVE BIOFUEL PROGRAMME AT EBENEBE ANAMBRA STATE NNPC
6INTEGRATED PALM OIL BASED BIODIESEL ON 25,000HA LAND SIZE IN IKOM CALABAR, CROSS RIVER STATE
RENEWABLE ENERGY DIVISION NNPC
7CASSAVA-BASED ETHANOL PROCESSING FACILITY IN EKU/ABRAKA/KOKORI IN ETHIOPE LGA IN DELTA STATE
LIFEWAY ETHANOL REFINERY LTD.
8AFRO-FORESTRY JATROPHA CURCAS PLANTATION DEVELOPMENT PROJECT.
THRESHOLD BIOFUEL ENERGY COMPANY LTD.
9180,000 LPD CASSAVA ETHANOL AND 100 TPD CASSAVA STORAGE/FLOUR FACTORY AT IYAMERE IKOLE LGA, EKITI STATE.
WASTE TO FUEL ENERGY PROJECTS PROPONENT
RENEWWABLE (GREEN) ENERGY WASTE/MANAGEMENT PROJECT AT UBIMA, RIVERS STATE SIAT NIGERIA LTD (SNL)
60 MW WASTE-TO-ENERGY POWER PLANT AT IKORODU HIGHLAND NIG LTD
GREEN ENERGY PRODUCTION SYSTEM- WASTE REDUCTION PRODUCTION AT BENIN/SAPELE RD.
PRESCO PLC
BIOFUEL (BIOMASS AND WASTE) INJECTION AT SHAGAMU, OGUN STATE. WAPCO
Figure D.4 Hydropower
systems under
development (CRET, 2015)

130
Market Study and Project Scouting Nigeria
ANNEX E. IDENTIFIED INVESTMENT OPPORTUNITIES ON THE LAKAJ AGRICULTURAL GROWTH CORRIDOR
Focussed Niger, Lagos and Ogun State (USAID, 2013)
Investment Type Name Brief DescriptionInvestment Value(M/W)
Low End High End
Production; Processing Rice Production and MillingEstablish new rice production and milling sites involving smallholder farmers
$ 30,000,000 $ 100,000,000
Production; Warehousing and Logistics
Maize and Soybean Production and Storage
Increase size of maize and soybean production and create new storage and warehousing facilities
$ 15,000,000 $ 100,000,000
ProcessingMaize and Soybean Processing Mills
Create new processing mills and link aggregators to these
$ 2,000,000 $ 5,000,000
Processing Industrial Shea ProcessingEstablish industrial size shea processing facility
$ 3,000,000 $ 5,000,000
Production; ProcessingHoney Production and Processing
Establish industrial size honey processing facilities
$ 100,000 $ 500,000
Production; ProcessingCassava Processing and Aggregation
Establish new cassava processing facilities and expand aggregation and market linkages with smallholder farmers
$ 5,000,000 $ 25,000,000
ProcessingCashew Processing and Aggregation
Establish an industrial size processing facility for cashew
$ 25,000,000 $ 30,000,000
Production; ProcessingCocoa Aggregation and Processing
Improve capacity of existing processing facility, improve yield and quality of multiple cocoa product lines
$ 3,000,000 $ 7,000,000
Production; Processing Poultry Farming and ProcessingCreate a new poultry farm and/or processing facility
$ 3,000,000 $ 6,000,000
Production AcquacultureCreate new acquaculture production sites
$ 2,000,000 $ 5,000,000
Production Vegetable ProductionExpand commercial vegetable production
$ 500,000 $ 2,000,000
ManufacturingAgricultural Equipment Manufacturing
Increase productivity of an existing agro-allied equipment manufacturing plant
$ 2,000,000 $ 6,000,000
Warehousing and Logistics
Cold Storage FacilityCreate a new cold storage facility in Lagos at the Inland Container Depot
$ 3,000,000 $ 7,000,000

131
Annexes
Type of Financing Type of Deal State Location IdentifiedLand Acquired
Value Chain
Working capital; CAP-EX Greenfield Niger No No Rice
Working capital; CAO-EX
Joint venture or equity partnership
NigerYes (existing firms); new land for expanded production not yet identified
No Maize and Soybean
CAP-EXGreenfield, potentially joint venture
Niger No No Maize and Soybean
CAP-EXGreenfield, potentially joint venture
Niger No No Shea
CAP-EX Greenfield NigerNo (unless co-located in new agro-industrial park)
No Honey
CAP-EX; working capital Greenfield Ogun No No Cassava
CAP-EX; working capital Greenfield Ogun No No Cashew
CAP-EX; working capital Greenfield Ogun No No Cocoa
CAP-EXGreenfield, joint venture, acquisition
LagosNo (unless rehabilitate existing infrastructure)
No Poultry
Working capital; CAP-EX Greenfield, joint venture Lagos No No Fish
Working capital; CAP-EX Greenfield, joint venture Lagos No NoTomatoes, cucumbers, peppers, onions
Working capital; CAP-EXJoint venture, equity partnership
Lagos Yes (existing firm) YesInfrastructure (mineral and agro-allied equipment)
CAP-EX Greenfield Lagos Yes (Inland Container Depot) Yes Logistics

132
Market Study and Project Scouting Nigeria
ANNEX F. LARGE RICE MILLS IN NIGERIA
S/No. Name Location Region Contact Person Type
Installed Capacity (MT/Annum)
Present Status
1 Onyx Rice Mill Bida, Niger StateNorth Central
Peter Sheshi (07033009917)
IRM 12.000 Functioning
2 Olam Nigeria LimitedRukubi Village, Doma LGA Nassarawa
North Central
Ade Adefeko (08037420080)
IRM 105.000 Functioning
3Masco Agro Allied Industry
Makurdi, Benue StateNorth Central
Amit Rai (GM Agric Business, 08058604300)
IRM 70.000Under construction
4 Mikap Nigeria Limited Makurdi, Benue StateNorth Central
Hon. Aondoaka (08078131246)
IRM 60.000 Functioning
5 Ashi Rice Ltd. Makurdi, Benue StateNorth Central
Joseph Tsawsar (08033455595)
IRM 10.000 Functioning
6 Quarra Rice Mill Tsaragi, Kwara StateNorth Central
Mr. Emeka (08177744058)
IRM 20.000 Functioning
7Klysat Foods and Beverages Ltd
Hadejia, Jigawa State North EastInuwa Musa (08023108014; [email protected])
IRM 52.000Installation, nearing completion
8 Gouria Rice Mills Bauchi State North EastDr. Dogo Muhammed (08037042486)
5.000 Functioning
9 3 Brothers Rice Mills Hadejia, Jigawa State North EastAlhaji Widi Muhammadu (08022300456)
IRM 30.000Newly completed, not yet functioning
10Danmodi Food Processing Ltd
Kaffi Hausa, Jigawa State North EastAlhaji Umar Namadi (08023898740)
IRM 12.000 Functioning
11Al Umalau Nigeria Enterprises Limited
Jalingo, Taraba State North East 08087934585 IRM 9.000 Functioning
12Popular Farms and Mills Ltd
Kano State North WestAmit Rai (GM, Agric Business; 08058604300)
IRM 150.000 Functioning
13 Umza Rice Mill Kano State North WestAlhaji Abubakar (08033475657)
IRM 75.000 Functioning
14 Labana Rice Mill Kebbi State North WestSen. Muhammad Adamu Ailero (07066847000)
IRM 100.000 Functioning

133
Annexes
15A.A. Ibrahim and Company Limited
29, Unity Road Kano North West 08150999436 IRM 30.000Under construction
16 Tara Agro Industry Ltd.Km 4 Ogurugu Road, Adani, Uzo-Uwani, Enugu
South East 080741961111 IRM 42.000 Functioning
17Integrated Grains Processor Nig. Ltd
Oma-Eke, Udi LGA, Enugu
South East 08034068151 IRM 12.000 Functioning
18 Stine Industries LimitedAmichi Nnewi South LGA, Anambra
South EastMr. Akai Egwuonwu (07081435500)
IRM 132.000 Functioning
19 Ebony Agro Industry Ltd Ikwo, Ebonyi State South East 080741961111 IRM 30.000 Functioning
20 Mordern Rice Mill Ikwo, Ebonyi State South EastEngr. Uche Emmanuel (08037856069)
IRM 12.000 Functioning
21 Mordern Rice Mill Iboko, Ebonyi State South EastEngr. Uche Emmanuel (08037856069)
IRM 12.000 Functioning
22 Mordern Rice Mill Oso-Edda, Ebonyi State South EastEngr. Uche Emmanuel (08037856069)
IRM 12.000 Functioning
23 Conti Agro (Eko Rice Mill)Imota, Ikorodu, Lagos State
South West
Raja Valecha (08035354407) Dr. Rotimi Fashola (08034549326)
IRM 13.200 Functioning
24 Popular Farms and Mills Ltd Lagos State South WestAmit Rai (GM, Agric Business; 08058604300)
IRM 210.000 Functioning

134
Market Study and Project Scouting Nigeria
No Area Installed capacity (MW) No. of generators
1 Somolu Printing Community 11 300
2 Matori Industrial Estate 40 105
3 Ilupeju Industrial Estate 25 105
4 Ikorodu Industrial Estate 135 31
5 Lagos Island (broad street & Marina only) 100 252
6 Ikeja GRA 68 804
7 Oba Akran 69 548
8 Agindingbi 70 820
9 Omole 1 13 89
10 Omole 11 43 2.410
11 Dolphin Estate 22 1.089
TOTAL 596 6.553
ANNEX G. OPPORTUNITIES FOR EMBEDDED POWER GENERATION IN LAGOS STATE
The table below presents an estimation of the
amount of diesel generators that are currently
being used for embedded power generation in
eleven industrial- and residential estates. The
table shows all generators that are used for power
generation that is transmitted to the end user
through a distribution network. Many of these
generators are relatively small-scale. The table
was presented in a workshop on the embedded
generation framework in the Nigerian electricity
supply industry on November 15th, 2012. The table
below shows that a total installed capacity of
almost 600 MW is used for embedded generation
in the eleven industrial- and residential estates, for
which more than 6.500 generators are used.
Source: Presentation on Power Sector Development: Lagos State
Economic Summit April 23–25 2012, Detail Commercial Solicitors
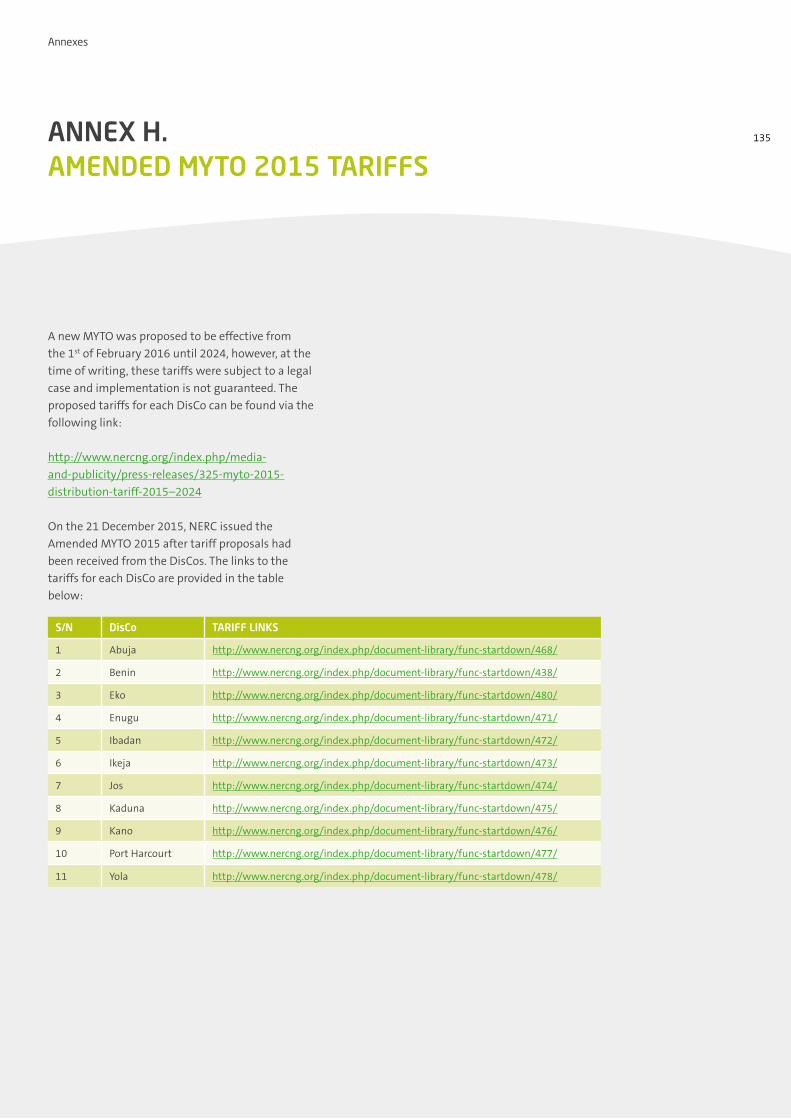
135
Annexes
S/N DisCo TARIFF LINKS
1 Abuja http://www.nercng.org/index.php/document-library/func-startdown/468/
2 Benin http://www.nercng.org/index.php/document-library/func-startdown/438/
3 Eko http://www.nercng.org/index.php/document-library/func-startdown/480/
4 Enugu http://www.nercng.org/index.php/document-library/func-startdown/471/
5 Ibadan http://www.nercng.org/index.php/document-library/func-startdown/472/
6 Ikeja http://www.nercng.org/index.php/document-library/func-startdown/473/
7 Jos http://www.nercng.org/index.php/document-library/func-startdown/474/
8 Kaduna http://www.nercng.org/index.php/document-library/func-startdown/475/
9 Kano http://www.nercng.org/index.php/document-library/func-startdown/476/
10 Port Harcourt http://www.nercng.org/index.php/document-library/func-startdown/477/
11 Yola http://www.nercng.org/index.php/document-library/func-startdown/478/
ANNEX H. AMENDED MYTO 2015 TARIFFS
A new MYTO was proposed to be effective from
the 1st of February 2016 until 2024, however, at the
time of writing, these tariffs were subject to a legal
case and implementation is not guaranteed. The
proposed tariffs for each DisCo can be found via the
following link:
http://www.nercng.org/index.php/media-
and-publicity/press-releases/325-myto-2015-
distribution-tariff-2015–2024
On the 21 December 2015, NERC issued the
Amended MYTO 2015 after tariff proposals had
been received from the DisCos. The links to the
tariffs for each DisCo are provided in the table
below:
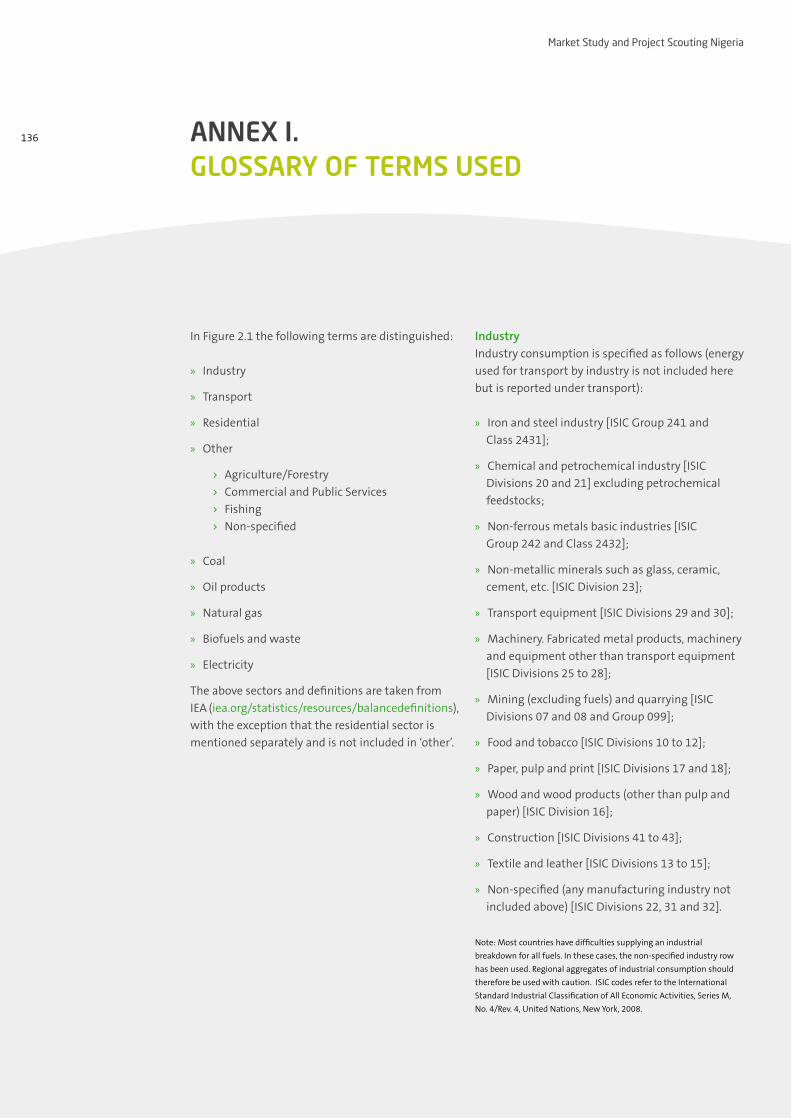
136
Market Study and Project Scouting Nigeria
ANNEX I. GLOSSARY OF TERMS USED
In Figure 2.1 the following terms are distinguished:
» Industry
» Transport
» Residential
» Other
› Agriculture/Forestry
› Commercial and Public Services
› Fishing
› Non-specified
» Coal
» Oil products
» Natural gas
» Biofuels and waste
» Electricity
The above sectors and definitions are taken from
IEA (iea.org/statistics/resources/balancedefinitions),
with the exception that the residential sector is
mentioned separately and is not included in ‘other’.
IndustryIndustry consumption is specified as follows (energy
used for transport by industry is not included here
but is reported under transport):
» Iron and steel industry [ISIC Group 241 and
Class 2431];
» Chemical and petrochemical industry [ISIC
Divisions 20 and 21] excluding petrochemical
feedstocks;
» Non-ferrous metals basic industries [ISIC
Group 242 and Class 2432];
» Non-metallic minerals such as glass, ceramic,
cement, etc. [ISIC Division 23];
» Transport equipment [ISIC Divisions 29 and 30];
» Machinery. Fabricated metal products, machinery
and equipment other than transport equipment
[ISIC Divisions 25 to 28];
» Mining (excluding fuels) and quarrying [ISIC
Divisions 07 and 08 and Group 099];
» Food and tobacco [ISIC Divisions 10 to 12];
» Paper, pulp and print [ISIC Divisions 17 and 18];
» Wood and wood products (other than pulp and
paper) [ISIC Division 16];
» Construction [ISIC Divisions 41 to 43];
» Textile and leather [ISIC Divisions 13 to 15];
» Non-specified (any manufacturing industry not
included above) [ISIC Divisions 22, 31 and 32].
Note: Most countries have difficulties supplying an industrial
breakdown for all fuels. In these cases, the non-specified industry row
has been used. Regional aggregates of industrial consumption should
therefore be used with caution. ISIC codes refer to the International
Standard Industrial Classification of All Economic Activities, Series M,
No. 4/Rev. 4, United Nations, New York, 2008.

137
Annexes
TransportConsumption in transport covers all transport
activity (in mobile engines) regardless of the
economic sector to which it is contributing [ISIC
Divisions 49 to 51], and is specified as follows:
» Domestic aviation
» Road includes fuels used in road vehicles as well
as agricultural and industrial highway use.
» Rail
» Pipeline transport
» Domestic navigation
Note: International marine bunkers and international aviation
bunkers are shown in Supply and are not included in transport as part
of final consumption. ISIC codes refer to the International Standard
Industrial Classification of All Economic Activities, Series M, No. 4/Rev. 4,
United Nations, New York, 2008.
Agriculture/ForestryAgriculture/forestry includes deliveries to users
classified as agriculture, hunting and forestry by
the ISIC, and therefore includes energy consumed
by such users whether for traction (excluding
agricultural highway use), power or heating
(agricultural and domestic) [ISIC Divisions 01 and
02].
Commercial and Public ServicesCommercial and public services [ISIC Divisions 33,
36–39, 45–47, 52, 53, 55, 56, 58–66, 68–75, 77–82,
84 (excluding Class 8422), 85–88, 90–96 and 99].
FishingFishing includes fuels used for inland, coastal and
deep-sea fishing. Fishing covers fuels delivered to
ships of all flags that have refuelled in the country
(including international fishing) as well as energy
used in the fishing industry [ISIC Division 03].
Non-specifiedNon-specified includes all fuel use not elsewhere
specified as well as consumption in the above-
designated categories for which separate figures
have not been provided. Military fuel use for all
mobile and stationary consumption is included here
(e.g. ships, aircraft, road and energy used in living
quarters) regardless of whether the fuel delivered is
for the military of that country or for the military of
another country.
CoalCoal and peat includes all coal, both primary
(including hard coal and lignite) and derived fuels
(including patent fuel, coke oven coke, gas coke,
BKB, gas works gas, coke oven gas, blast furnace gas
and oxygen steel furnace gas). Peat is also included
in this category.
Oil productsOil products comprise refinery gas, ethane, LPG,
aviation gasoline, motor gasoline, jet fuels,
kerosene, gas/diesel oil, fuel oil, naphtha, white
spirit, lubricants, bitumen, paraffin waxes,
petroleum coke and other oil products. Oil products
are any oil-based products which can be obtained
by distillation and are normally used outside the
refining industry. The exceptions to this are those
finished products which are classified as refinery
feedstocks.

138
Market Study and Project Scouting Nigeria
Natural gasNatural gas comprises gases, occurring in
underground deposits, whether liquefied or
gaseous, consisting mainly of methane. It includes
both “non-associated” gas originating from fields
producing only hydrocarbons in gaseous form, and
“associated” gas produced in association with crude
oil as well as methane recovered from coal mines
(colliery gas) or from coal seams (coal seam gas).
Production represents dry marketable production
within national boundaries, including offshore
production and is measured after purification
and extraction of NGL and sulphur. It includes
gas consumed by gas processing plants and gas
transported by pipeline. Quantities of gas that are
re-injected, vented or flared are excluded.
Biofuels and waste Biofuels and waste is comprised of solid biofuels,
liquid biofuels, biogases, industrial waste
and municipal waste. Note that for biomass
commodities, only the amounts specifically used
for energy purposes (a small part of the total)
are included in the energy statistics. Therefore,
the non-energy use of biomass is not taken into
consideration and quantities are null by definition.
Electricity Electricity shows final consumption and trade in
electricity (which is accounted at the same heat
value as electricity in final consumption; i.e. 1 GWh
= 0.000086 Mtoe).

139
Annexes
ANNEX J. NERC LICENSE FEES
http://www.nercng.org/nercdocs/Licence-and-Operating-Fees-Regulation.pdf
Grid-connected generation
Embedded generation
Licence CategoryValidity Period (Years)
Processing Fees for Application & Amendment of Licences
Licence Fees (US Dollars) or Naira equivalent
Processing Fees for Renewal & Extension of Tenure (Naira)
Annual Operating Fees
Generation:
1 – 10MW
11 – 50MW
51 – 100MW
101 – 200MW
201 – 300MW
301 – 400MW
401 – 500MW
Above 500MW
10
N 70,000.00
N 150,000.00
N 200,000.00
N 250,000.00
N 350,000.00
N 400,000.00
N 450,000.00
N 500,000.00
US$ 5,000.00
US$ 30,000.00
US$ 40,000.00
US$ 60,000.00
US$ 80,000.00
US$ 100,000.00
US$ 120,000.00
US$ 140,000.00
N 35,000.00
N 75,000.00
N 100,000.00
N 125,000.00
N 175,000.00
N 200,000.00
N 225,000.00
N 250,000.00
1.5% of
Licensee’s
Charges /kWh
Licence CategoryValidity Period (Years)
Processing Fees for Application & Amendment of Licences
Licence Fees (US Dollars) or Naira equivalent
Processing Fees for Renewal & Extension of Tenure (Naira)
Annual Operating Fees
Generation:
1 – 10MW
11 – 25MW
26 – 40MW
41 – 60MW
61 – 85MW
86 – 100MW
101 – 200MW
201 – 400MW
401 – 500MW
Above 500MW
Up to10
N 50,000.00
N 150,000.00
N 175,000.00
N 225,000.00
N 250,000.00
N 275,000.00
N 300,000.00
N 400,000.00
N 500,000.00
N 600,000.00
US$ 10,000.00
US$ 35,000.00
US$ 40,000.00
US$ 45,000.00
US$ 50,000.00
US$ 55,000.00
US$ 75,000.00
US$ 95,000.00
US$ 150,000.00
US$ 200,000.00
N 25,000.00
N 75,000.00
N 87,500.00
N 112,500.00
N 125,000.00
N 137,500.00
N 150,000.00
N 200,000.00
N 250,000.00
N 300,000.00
1.5% of Tariff
Charge /kWh

140
Market Study and Project Scouting Nigeria
Captive generation
Mini grids
Licence CategoryValidity Period (Years)
Processing Fees for Application & Amendment of Licences
Licence Fees (US Dollars) or Naira equivalent
Processing Fees for Renewal & Extension of Tenure (Naira)
Annual Operating Fees
Generation:
1 – 10MW
11 – 50MW
51 – 100MW
101 – 200MW
201 – 300MW
301 – 400MW
401 – 500MW
Above 500MW
10
N 70,000.00
N 150,000.00
N 200,000.00
N 250,000.00
N 350,000.00
N 400,000.00
N 450,000.00
N 500,000.00
US$ 5,000.00
US$ 30,000.00
US$ 40,000.00
US$ 60,000.00
US$ 80,000.00
US$ 100,000.00
US$ 120,000.00
US$ 140,000.00
N 35,000.00
N 75,000.00
N 100,000.00
N 125,000.00
N 175,000.00
N 200,000.00
N 225,000.00
N 250,000.00
1.5% of
Licensee’s
Charges/
kWh
Licence CategoryValidity Period (Years)
Processing Fees for Application & Amendment of Licences
Licence Fees (US Dollars) or Naira equivalent
Processing Fees for Renewal & Extension of Tenure (Naira)
Annual Operating Fees
Generation:
1 – 10MW
11 – 25MW
26 – 40MW
41 – 60MW
61 – 85MW
86 – 100MW
101 – 200MW
201 – 400MW
401 – 500MW
Above 500MW
Up to10
N 50,000.00
N 150,000.00
N 175,000.00
N 225,000.00
N 250,000.00
N 275,000.00
N 300,000.00
N 400,000.00
N 500,000.00
N 600,000.00
US$ 10,000.00
US$ 35,000.00
US$ 40,000.00
US$ 45,000.00
US$ 50,000.00
US$ 55,000.00
US$ 75,000.00
US$ 95,000.00
US$ 150,000.00
US$ 200,000.00
N 25,000.00
N 75,000.00
N 87,500.00
N 112,500.00
N 125,000.00
N 137,500.00
N 150,000.00
N 200,000.00
N 250,000.00
N 300,000.00
1.5% of Tariff
Charge/kWh

141
Annexes
A number of international donors and organisations
are active in the renewable energy sector in Nigeria.
The major bilateral implementing agencies with a
local office in Nigeria are30:
» Agence Française de Développement (AFD),
French development cooperation agency
» Department for International Development
(DFID), British development cooperation organi-
sation
» Deutsche Gesellschaft für Internationale Zusam-
menarbeit (GIZ) GmbH, German Agency for
International Cooperation
» Japan International Cooperation Agency (JICA)
» United States Agency for International Devel-
opment (USAID)
Agence Française de DéveloppementSince its inception in Nigeria in 2008, AFD has been
giving support to the power sector. In May 2016,
a new funding was granted by AFD to enable the
expansion and modernization of infrastructure,
better training of technicians and development of
public-private partnerships in the power sector.
A partnership has been established between
the National Power Training Institute of Nigeria
(NAPTIN) and Schneider Electric Nigeria (SEN), for
training local electricians on safety compliance
standards for domestic installations and for the
promotion of entrepreneurship in the power sector.
A second partnership agreement was signed
between the Association of Nigerian Electricity
Distributors and CODIFOR, a non-profit organization
founded by French professional organizations
30) GIZ, 2015
in order to share their experience, expertise and
know-how at international level in the development
of employees’ skills and support to power
stations. This second partnership should enable
the implementation of a technical cooperation
programme for public – private partnerships in the
electricity sector.
Two credit facility agreements were signed:
» to modernise the National Power Training
Institute of Nigeria (€ 40 million);
» to facilitate the financing of investments by
private electricity distribution companies through
a credit line granted by Zenith bank to private
Power Distribution companies (€ 85 million).
Department for International Development (DFID) – Solar NigeriaDFID will provide € 44 million of grant finance,
through the Solar Nigeria programme, over six
years (2014 – 2020) for the installation of solar
photovoltaic (PV) systems in 200 schools and
eight health centres in rural areas of Lagos State.
Moreover, DFID will expand the PV market and build
a commercial base for that market in the North
of Nigeria. Solar Nigeria collaborates with other
donors and Nigeria’s federal and state governments.
The programme works directly with companies
that manufacture, install, and finance solar energy
systems in Nigeria, supplying technical assistance
to companies; providing facilities for affordable
consumer credit; and delivering demonstration
projects that show how well-designed solar
systems are sustainable, save money, and reduce
greenhouse gasses.
ANNEX K. KEY DEVELOPMENT COOPERATION ORGANISATIONS

142
Market Study and Project Scouting Nigeria
DFID also supports the Nigeria Infrastructure
Advisory Facility (NIAF) which provides rapid and
flexible consulting expertise to help the Nigerian
government to improve its infrastructure and
private sector investment. NIAF does not work with
developers directly.
Deutsche Gesellschaft für Internationale Zusammenarbeit (GIZ)In the energy sector, GIZ provides advisory services
to Nigerian partners on rural electrification, energy
efficiency and renewable energy. The Nigerian
Energy Support Programme (NESP) is commissioned
by the German Federal Ministry for Economic
Cooperation and Development (BMZ) and the
European Union.
NESP’s activities are focused around the following
topics:
» Policy reform and on-grid renewable energy: the
programme is supporting implementation of the
Electric Power Sector Reform Act, while helping
to improve the legal framework for investment in
renewable energy. Key stakeholders in the sector
are also supported to coordinate and harmonise
their activities.
» Energy efficiency: the programme is contributing
to draw up strategies and standards for energy
efficiency in accordance with international best
practice, and to encourage the implementation
via support mechanisms and demonstration
projects.
» Rural electrification and sustainable energy
access: a standardised approach at national
level for the planning and promotion of rural
electrification is supported. Five federal states
are supported to produce electrification plans
and develop a data management system. The
electrification of off-grid villages, social facilities
and small businesses will demonstrate how
renewable energy can contribute to providing
electricity access to rural areas.
» Capacity development: the National Power
Training Institute of Nigeria (NAPTIN) and other
training institutes are being assisted to deliver a
range of relevant training courses on renewable
energy and energy efficiency for engineers, archi-
tects and technicians. Interventions also train
selected professionals of partner institutions and
enhance capacities of the power sector as whole.
Japan International Cooperation Agency (JICA)The purpose of JICA’s cooperation in the energy
sector entails:
» Contribution to realizing a low-carbon society
that can develop sustainably
» Contribution to inclusive growth and poverty
reduction by improving energy access
» Contribution to boosting global vigour by
utilizing Japanese technologies and know-how
Concrete projects include:
» A grant for the Federal Capital Territory: The
Project for Emergency Improvement of Electricity
Supply Facilities in Abuja.
» A grant for The Federal Capital Territory: The
Project for Introduction of Clean Energy by Solar
Electricity Generation System.
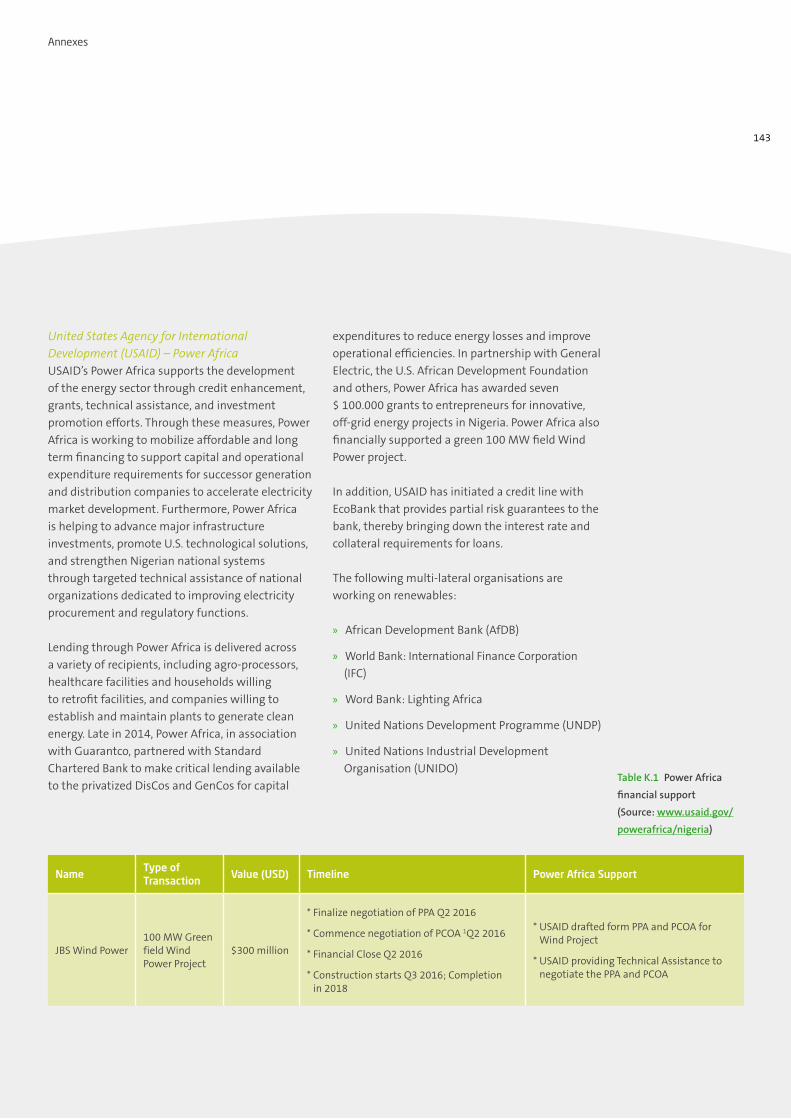
143
Annexes
Table K.1 Power Africa
financial support
(Source: www.usaid.gov/
powerafrica/nigeria)
United States Agency for International Development (USAID) – Power AfricaUSAID’s Power Africa supports the development
of the energy sector through credit enhancement,
grants, technical assistance, and investment
promotion efforts. Through these measures, Power
Africa is working to mobilize affordable and long
term financing to support capital and operational
expenditure requirements for successor generation
and distribution companies to accelerate electricity
market development. Furthermore, Power Africa
is helping to advance major infrastructure
investments, promote U.S. technological solutions,
and strengthen Nigerian national systems
through targeted technical assistance of national
organizations dedicated to improving electricity
procurement and regulatory functions.
Lending through Power Africa is delivered across
a variety of recipients, including agro-processors,
healthcare facilities and households willing
to retrofit facilities, and companies willing to
establish and maintain plants to generate clean
energy. Late in 2014, Power Africa, in association
with Guarantco, partnered with Standard
Chartered Bank to make critical lending available
to the privatized DisCos and GenCos for capital
expenditures to reduce energy losses and improve
operational efficiencies. In partnership with General
Electric, the U.S. African Development Foundation
and others, Power Africa has awarded seven
$ 100.000 grants to entrepreneurs for innovative,
off-grid energy projects in Nigeria. Power Africa also
financially supported a green 100 MW field Wind
Power project.
In addition, USAID has initiated a credit line with
EcoBank that provides partial risk guarantees to the
bank, thereby bringing down the interest rate and
collateral requirements for loans.
The following multi-lateral organisations are
working on renewables:
» African Development Bank (AfDB)
» World Bank: International Finance Corporation
(IFC)
» Word Bank: Lighting Africa
» United Nations Development Programme (UNDP)
» United Nations Industrial Development
Organisation (UNIDO)
NameType of Transaction
Value (USD) Timeline Power Africa Support
JBS Wind Power100 MW Green field Wind Power Project
$300 million
* Finalize negotiation of PPA Q2 2016
* Commence negotiation of PCOA 1Q2 2016
* Financial Close Q2 2016
* Construction starts Q3 2016; Completion in 2018
* USAID drafted form PPA and PCOA for Wind Project
* USAID providing Technical Assistance to negotiate the PPA and PCOA

144
Market Study and Project Scouting Nigeria
African Development Bank (AfDB)The AfDB 2013–2017 Nigeria Country Strategy
Paper31 mentions the focus area “Contribution to
low-carbon climate resilient development”. The
specific activities are mentioned in the table above.
World Bank: International Finance Corporation (IFC)As part of a wider programme to help mitigate
climate change, IFC is investing in and providing
advisory services to private enterprises in the
renewable energy sector, throughout emerging
markets, and across all parts of the supply chain.
IFC is supporting a 120 MWp PV project. In
December 2015 IFC signed a Joint Development
Agreement with Alten’s Middle Band Solar One
Limited, a Nigerian solar power project company,
to co-develop the project with a consortium
of developers. The project is expected to reach
financial close by the end of 2016.
31) www.afdb.org/en/countries/west-africa/nigeria
Word Bank (WB)In April 2014 The World Bank Group in collaboration
with the Federal Republic of Nigeria endorsed a
new Country Partnership Strategy (CPS)32 that
includes support for development of targets and
interventions up to 2017. The World Bank Group’s
support for Nigeria is structured around three
strategic priorities, one is focussed on energy,
especially the reforming of the power sector.
The “Lighting Africa” programme is also targeting
Nigeria. The aim is to improve access to clean,
affordable, quality-verified off-grid lighting and
energy products by catalysing the market through a
number of activities:
» Market intelligence on the off-grid market and
providing critical data to help manufacturers,
distributors and retailers to make informed
business decisions
» Quality assurance of off-grid lighting products
and solar home systems
» Access to finance for actors all along the supply
chain
» Consumer education on off-grid lighting products
and solar home systems
» Business development support
32) www.worldbank.org/en/country/nigeria
Table K.2 AfDB activities in
Nigeria related to energy
(AfDB 2013–2017 Nigeria
Country Strategy Paper)
Activity AfDB Contribution
Support the implementation of power sector reforms to unlock the huge economic and environmental potential benefits of the large reserves of gas to generate power
Significant
Investment in small hydro power plants Moderate
Promotion of renewable energy alternatives, particularly solar and biomass (energy crops) Moderate
Energy efficiency programmes in public, industrial and residential buildings Moderate
Reduce transmission and distribution losses Small

145
Annexes
United Nations Development Programme (UNDP)One of UNDP’s interventions in Nigeria is to
strengthen the country’s capacities to address
the various environmental challenges at national,
state and local government levels by sharing with
government partner’s experiences from other parts
of the world and provide innovative policy advice
and building of lasting partnerships.
The Access to Renewable Energy UNDP/Bank of
Industry project is focussed on increasing the
national capacity to invest in and utilize renewable
energy resources to improve the access to modern
energy services for MSMEs and households. It also
aims to build capacity in the business and financial
sectors to incorporate renewable energy in business
planning and development, and to support the
evolution of renewable energy policy and public
planning. It aims to enable:
» MSMEs to incorporate renewable energy either
as a business in and of itself, or as service for
business development;
» Financial institutions to better understand and
assess the credit and financial risks of renewable
energy investments and services;
» Government to develop and implement
renewable energy policies and regulatory frame-
works.
UNDP has funded an ECN solar-power energy
project for five rural communities in Bwari Area
Council in the FCT. The benefitting communities
are Tokulo, Zhiko, Sunape, Youpe and Goipe. In each
community in total 400 solar home systems were
installed, 14 solar street lights, solar PV systems
at each primary health centres, 400 clay-based
efficient woodstoves and a solar-powered water
supply borehole with 10.000 litres storage tank.
United Nations Industrial Development Organization (UNIDO) The UNIDO regional office in Nigeria is presently
working with the Government of Burkina Faso,
Benin Republic, Niger, Mali and Nigeria to promote
inclusive and sustainable industrial activities.
Under the “Safeguarding the environment” focus
area, UNIDO currently supports the following
projects related to renewable energy:
» Scaling up small hydro power in Nigeria: this
project is aimed at promoting renewable energy
based mini-grid as an alternative to diesel based
energy generation systems in Nigeria.
» Mini-grids based on renewable energy (small
hydro and biomass) sources to augment
rural electrification: UNIDO is assisting the
Government of Nigeria through this GEF funded
project to foster a public-private partnership
for the investment of $ 12 million to establish
a 5 MW rice husk fuelled power plant in Ebonyi
State and to encourage its replication across
other states in Nigeria.
UNIDO and to a lesser extent UNDP have been
involved in a number of pico and small hydro
power development projects. Examples are: Evboro
II pico-hydropower plant in Edo State, the 70 kW
micro-hydropower plant in Osun State for village
electrification, and the 400 kW mini-hydropower
plant in Taraba State for self-generation at a
beverage company. All these hydropower projects
are meant to be used for village electrification with
the exception of the last one which will be used for
self-generation at a beverage company. However,
none of these installation have been realised and
are currently operational.

146
Market Study and Project Scouting Nigeria
ANNEX L. EXAMPLE OF A CAPTIVE POWER PROJECT IN OIL PALM PROCESSING
Below information is generated from publicly
available sources. It is unclear what is the current
status of the captive power installation.
Introduction PrescoPresco is the Nigerian market leader for specialty
fats and oils. It is a fully-integrated agro-industrial
establishment with oil palm plantations, a palm oil
mill, a palm kernel crushing plant and a vegetable
oil refining and fractionation plant.
Presco is one of the largest employers of labour in
Edo and Delta states, with about 3.500 employees.
Currently the total planted area is 11.537 hectares
of oil palm plantations. The palm oil mill capacity
has increased from 48 to 60 tonnes fresh fruit
bunches (FFB)/hour. The palm kernel crushing plant
operates at 45 tonnes/day. The refinery has recently
been increased to 100 metric tonnes per day and
fractionation plant capacity and refined products to
60 tonnes/day.

147
Annexes
Diesel US$
Kerosene 999.653 709.754
Diesel 4.643 3.900
Kerosene equivalent sent to the flare
976.251 693.138
Waste productionThe production of palm oil results in the generation
of large quantities of polluted waste water,
commonly referred to as palm oil mill effluent
(POME). Typically, one ton of crude palm oil
production requires 5–7,5 tonnes of water; over
50% of which ends up as POME. Fresh POME is
a hot, acidic, brownish colloidal suspension. The
Presco POME is characterized by high amounts of
total solids (35 g/l), oil and grease (17 g/l), COD
(50 g/l) BOD (64 g/l) and a PH of 4,4.
POME has been identified as one of the major
sources of aquatic pollution, since its normal
treatment is solely ponding and/or digestion in
open digesting tanks; the emission of greenhouse
gases (GHG) (CH4–methane and CO2) from these
systems to the atmosphere has been reported as a
major source of air pollution from the palm oil mills.
Biogas waste treatment plantThe installed posttreatment system is bag digester.
After the effluent is treated, the characteristics are
improved to:
» pH =7,1
» Total solids = 8,6 g/l
» COD = 19,v6 g/l
The by-products of this anaerobic digestion are
biogas and sludge. The biogas is used for energy
purposes and the sludge is used as an organic
fertiliser for the palms.
BiogasIn ten months’ time (December 2013-September
2014) a total of 3.508.966 m3 of biogas has been
produced. This biogas is used for:
» Thermo-oil boiler
» Stand-by boiler
» Generator (substituting diesel)
Note: The price of the kerosene was considered to be US$ 0.71/litre and
the price of diesel US$ 0.84/litre.
Costs savings for this ten months’ period is thus
totalling 713.000 $. The excess gas is flared.
Sludge
» For a 135.000 T/year milling, the sludge
production in PRESCO is estimated to be around
23.000 m3/year. It means the sludge generation is
around 17% of the milling, and represents around
100 m3/day x 230 days. For an average dry matter
(total solids) content of 3%, the average NPK
nutrients content is:
» N: 2,3 kg/m3 (=2,5 US$/m3)
» P2O5: 1 kg/m3 (=1,1 US$/m3)
» K2O: 1,6 kg/m3 (=1,6 US$/m3)
In six months 6,600 m3 of sludge has been spread in
the plantation, totalling 34.320 $ worth of fertiliser.

148
Market Study and Project Scouting Nigeria


Amendment 1 (page 75)
Figure 5.3 Different processing steps in the value chain of agricultural products