Changes in financial aid and student enrollment at ...Changes in financial aid and student...
39
U.S. Department of Education April 2015 Making Connections Changes in financial aid and student enrollment at historically Black colleges and universities after the tightening of PLUS credit standards Matthew Johnson Julie Bruch Brian Gill Mathematica Policy Research Key fndings • The year after the U.S. Department of Education tightened credit standards for Parent Loans for Undergraduate Students (PLUS), both the share of PLUS participants and the loan dollar amounts declined substantially at four-year historically Black colleges and universities (HBCUs), and other types of federal fnancial aid did not fully make up for the decline. • Enrollment at HBCUs declined the year after credit standards were tightened (2012/13), and the decrease was larger than at other institutions, corresponding to the larger decline in PLUS loan recipients at HBCUs. The biggest decline in enrollment was among frst-year students. • Nationwide, 2012/13 enrollment decreased more for Black students than for students of other races/ethnicities. At ICF International
Transcript of Changes in financial aid and student enrollment at ...Changes in financial aid and student...

U . S . D e p a r t m e n t o f E d u c a t i o n
April 2015
Making Connections
Changes in financial aid and student enrollment at
historically Black colleges and universities after the tightening
of PLUS credit standards
Matthew Johnson Julie Bruch Brian Gill
Mathematica Policy Research
Key findings
• The year after the U.S. Department of Education tightened credit standards
for Parent Loans for Undergraduate Students (PLUS), both the share of PLUS
participants and the loan dollar amounts declined substantially at four-year
historically Black colleges and universities (HBCUs), and other types of
federal financial aid did not fully make up for the decline.
• Enrollment at HBCUs declined the year after credit standards were
tightened (2012/13), and the decrease was larger than at other institutions,
corresponding to the larger decline in PLUS loan recipients at HBCUs. The
biggest decline in enrollment was among first-year students.
• Nationwide, 2012/13 enrollment decreased more for Black students than
for students of other races/ethnicities.
At ICF International

U.S. Department of Education Arne Duncan, Secretary
Institute of Education Sciences Sue Betka, Acting Director
National Center for Education Evaluation and Regional Assistance Ruth Curran Neild, Commissioner Joy Lesnick, Associate Commissioner Amy Johnson, Action Editor Felicia Sanders, Project Officer
REL 2015–082
The National Center for Education Evaluation and Regional Assistance (NCEE) conducts unbiased large-scale evaluations of education programs and practices supported by federal funds; provides research-based technical assistance to educators and policymakers; and supports the synthesis and widespread dissemination of the results of research and evaluation throughout the United States.
April 2015
This report was prepared for the Institute of Education Sciences (IES) under Contract ED-IES-12-C-0006 by Regional Educational Laboratory Mid-Atlantic administered by ICF International. The content of the publication does not necessarily reflect the views or policies of IES or the U.S. Department of Education, nor does mention of trade names, commercial products, or organizations imply endorsement by the U.S. Government.
This REL report is in the public domain. Although permission to reprint this publication is not necessary, it should be cited as:
Johnson, M., Bruch, J., & Gill, B. (2015). Changes in financial aid and student enrollment at historically Black colleges and universities after the tightening of PLUS credit standards (REL 2015–082). Washington, DC: U.S. Department of Education, Institute of Education Sciences, National Center for Education Evaluation and Regional Assistance, Regional Educational Laboratory Mid-Atlantic. Retrieved from http://ies.ed.gov/ncee/edlabs.
This report is available on the Regional Educational Laboratory website at http://ies.ed.gov/ ncee/edlabs.

Summary
The federal Parent Loans for Undergraduate Students (PLUS) program provides loans to parents of dependent undergraduate students to help pay for education expenses. To bring the standards in line with those used by banks, the U.S. Department of Education tightened the credit standards for PLUS loans in October 2011. In the first full school year that the new standards were in place (2012/13), the total dollar amount of federal loans approved for parents decreased substantially.
Regional Educational Laboratory (REL) Mid-Atlantic’s Historically Black Colleges and Universities College Completion Research Alliance wanted to know how the tightened standards affected historically Black colleges and universities (HBCUs), which enroll many students from low-income and racial/ethnic minority families. On average, HBCUs have smaller endowments than other institutions and rely more heavily on tuition. Therefore, a reduction in PLUS loans could lead to decreased enrollment at HBCUs, which might threaten the viability of the institutions through reduced tuition revenue. The research alliance asked REL Mid-Atlantic to work in partnership to measure and understand changes in enrollment at HBCUs in the wake of the more restrictive PLUS credit standards. A careful and objective analysis of the PLUS program data should be useful to policymakers in the continuing debate about credit standards for the program.
This descriptive study is the first to examine enrollment changes at HBCUs nationwide following the 2011 change in PLUS credit standards. The study investigates the extent to which PLUS participation and loan dollar amounts declined at HBCUs and other institutions of higher education after the tightening of credit standards. At institutions that experienced a decline in PLUS loan dollar amounts, the study looked for evidence of a shift toward other forms of federal financial aid, such as federal direct loans, Perkins loans, and work-study programs. To determine whether and how the decreased loans affected enrollment, the study examined changes in enrollment at HBCUs and other institutions of higher education in 2012/13 and whether colleges and universities with a larger decline in PLUS loan recipients experienced a greater enrollment change.
The results show that during the school year following the tightening of PLUS credit standards, the share of PLUS participants and loan dollar amounts declined substantially at four-year HBCUs. PLUS loans were not fully replaced by other types of federal financial aid. Enrollment at HBCUs declined as well, and the decline was larger than at other institutions of higher education. The HBCU enrollment decline was especially large for first-year students. Nationwide, enrollment decreased more for Black students than for students in other racial/ethnic groups.
i

Contents
Summary i
Why this study? 1
What the study examined 1 Research questions 1 Changes to the Parent Loans for Undergraduate Students program 2
What the study found 6 Changes in financial aid 6 Changes in undergraduate enrollment 10 How changes in financial aid and changes in undergraduate enrollment were related 13
Implications for future research 15
Limitations of the study 15
Appendix A. Data and sample restrictions A-1
Appendix B. Supplementary tables on financial aid analysis B-1
Appendix C. Enrollment changes at public and private institutions C-1
Appendix D. Technical details of the enrollment prediction model D-1
Appendix E. Changes in PLUS loans and enrollment at two-year and for-profit institutions E-1
References Ref-1
Boxes 1 Background on historically Black colleges and universities 2 2 Data and methods 4
Figures 1 PLUS loan recipients and PLUS loan dollar amounts declined more at four-year
historically Black colleges and universities than at other colleges and universities between 2011/12 and 2012/13 7
2 The decline in PLUS loan dollar amounts at historically Black colleges and universities and other colleges and universities in 2012/13 was a departure from historical trends 7
Tables 1 Changes in PLUS loan recipients as a share of undergraduate enrollment at four-year
colleges and universities between 2011/12 and 2012/13 8 2 Aggregate changes in dollar amounts of PLUS loans and other types of Title IV aid at
four-year colleges and universities between 2011/12 and 2012/13 (millions of dollars) 10 3 Changes in undergraduate enrollment at four-year colleges and universities between
2011/12 and 2012/13 11
ii

4 Changes in Hispanic and Black undergraduate enrollment at four-year colleges and universities between 2011/12 and 2012/13 12
5 Difference in changes in undergraduate enrollment between four-year historically Black colleges and universities and other colleges and universities between 2011/12 and 2012/13, with and without accounting for changes in PLUS loan recipients 13
6 Actual and predicted changes in undergraduate enrollment at four-year colleges and universities between 2011/12 and 2012/13 14
7 Difference between actual and predicted percentage change in undergraduate enrollment at historically Black colleges and universities and other colleges and universities between 2011/12 and 2012/13, with and without accounting for change in PLUS loan recipients 15
A1 Sample restrictions A-4 B1 Characteristics of four-year colleges and universities in analytic sample (percent unless
otherwise indicated) B-1 B2 Aggregate changes in PLUS loan recipients and PLUS loan dollar amounts at four-year
institutions between 2011/12 and 2012/13 B-2 B3 Percentage changes in PLUS loan recipients and PLUS loan dollar amounts at public
and private four-year colleges between 2011/12 and 2012/13 B-2 B4 Regression of percentage change in PLUS loan recipients at four-year colleges between
2011/12 and 2012/13 on institution characteristics B-3 B5 Regression of change in share of undergraduates receiving PLUS loans at four-year
colleges between 2011/12 and 2012/13 on institution characteristics B-4 C1 Changes in undergraduate enrollment at public and private four-year colleges between
2011/12 and 2012/13 C-1 D1 Measures of fit for prediction model 1 of undergraduate enrollment at four-year colleges D-2 E1 Changes in PLUS loan recipients and PLUS loan dollar amounts at two-year nonprofit,
two-year for-profit, and four-year for-profit institutions between 2011/12 and 2012/13 E-1 E2 Changes in undergraduate enrollment at two-year nonprofit, two-year for-profit, and
four-year for-profit colleges between 2011/12 and 2012/13 E-2
iii

Why this study?
The federal Parent Loans for Undergraduate Students (PLUS) program provides loans to parents of dependent undergraduate students to help pay for education expenses that other sources of financial aid do not cover. The PLUS program provides substantial financial aid. Approximately 13 percent of full-time dependent undergraduates have parents who have taken out PLUS loans, with each loan averaging almost $13,000 a year (Radwin, Wine, Siegel, & Bryan, 2013). In October 2011, to bring the PLUS credit standards in line with those of banks, the U.S. Department of Education tightened the credit history standards for PLUS loans. In the first full school year that the new standards were in place (2012/13), the total dollar amount of federal loans approved for parents fell 11 percent (Anderson, 2013).
These changes could have had especially large impacts on historically Black colleges and universities (HBCUs), which enroll large shares of students from low-income and racial/ ethnic minority families (box 1). On average, HBCUs have smaller endowments than other institutions (Gasman, 2013) and rely more heavily on tuition (Gasman, 2009). Therefore, a reduction in PLUS loans could lead to decreased enrollment in HBCUs, which might threaten the viability of the institutions through reduced tuition revenue. Regional Educational Laboratory Mid-Atlantic’s Historically Black Colleges and Universities College Completion Research Alliance wanted to measure and understand changes in enrollment at HBCUs in the wake of tightened credit standards for PLUS loans. The expectation was that a careful and objective analysis of the data would benefit policymakers engaged in the continuing debate about credit standards for the program.
What the study examined
This descriptive study is the first to examine enrollment changes at HBCUs nationwide following the 2011 change in PLUS credit standards. It provides important information on enrollment changes at HBCUs and other higher education institutions serving large shares of low-income students.
Research questions
The report addresses four descriptive research questions: • How much did PLUS participation and PLUS loan dollar amounts decline at HBCUs
and other institutions of higher education following the tightening of credit standards? • At institutions that experienced a decline in PLUS loan dollar amounts, is there
evidence of a shift toward other forms of financial aid, such as federal direct loans, Perkins loans, and work-study programs?
• How much did enrollment at HBCUs and other institutions of higher education change?
• Among all institutions of higher education, did those with a larger decline in PLUS loan recipients experience a greater enrollment change?
The study examined part-time and full-time student enrollment and distinguished between new students and continuing students. It also analyzed changes in racial/ethnic minority student enrollment separately from changes in overall enrollment. Only four-year institutions were analyzed because the small number of two-year HBCUs precluded a separate analysis for those institutions.
This descriptive study is the first to examine enrollment changes at HBCUs nationwide following the change in PLUS credit standards. It provides important information on enrollment changes at HBCUs and other higher education institutions serving large shares of low-income students
1

Box 1. Background on historically Black colleges and universities
Until the mid-twentieth century, historically Black colleges and universities (HBCUs) enrolled
more than 90 percent of Black students attending U.S. higher education institutions (Gasman,
2013). HBCUs currently enroll 11 percent of Black students attending higher education
institutions, but they constitute fewer than 3 percent of colleges and universities (Gasman,
2013). There are 100 HBCUs in the United States, approximately half public and half private;
89 percent are four-year institutions.
HBCUs tend to have lower tuition than other institutions of higher education do. In 2011/12
average in-state tuition and fees totaled $6,000 for students at public HBCUs, compared with
$7,500 at other four-year public institutions, and $15,500 at private HBCUs, compared with
$27,500 at other private nonprofit institutions. The average out-of-pocket cost for students receiv
ing grant or scholarship aid was $9,500 at public HBCUs, compared with $11,500 at other public
institutions, and $17,000 at private HBCUs, compared with $22,000 at other private institutions.1
In the decade preceding the tightening of PLUS credit standards, enrollment at HBCUs
rose but at a slower pace than at other institutions. Between fall 2001 and fall 2011 enroll
ment at four-year HBCUs increased an average 0.8 percent a year, compared with 2.5 percent
a year at four-year nonprofit institutions nationwide (Snyder & Dillow, 2013).
HBCUs serve predominantly students of racial/ethnic minority background and from low-
income families. At HBCUs 85 percent of students are Black, compared with 10 percent at
non-HBCU institutions. Seventy-two percent of students at HBCUs receive Pell grants com
pared with 38 percent of students at non-HBCUs. Entering students at HBCUs also have lower
average SAT and ACT scores than students at non-HBCU four-year institutions. Open enrollment
admission policies are in place at 23 percent of four-year HBCUs, compared with 12 percent of
other institutions. HBCUs also have lower graduation rates than other institutions; the six-year
bachelor’s degree graduation rate at HBCUs is 33 percent, compared with 56 percent at other
four-year institutions. However, the graduation rates of Black students at HBCUs do not differ
from those of similar Black students at other institutions (Kim & Conrad, 2006; Montgomery &
Montgomery, 2012; Richards & Awokoya, 2012).
Note 1. Average out-of-pocket cost is the average amount of federal, state, and local government or institutional grant and scholarship aid subtracted from the total cost of attendance (including tuition, fees, books and supplies, room and board, and other expenses). The average tuition and fees and average out-of-pocket costs were calculated based on four-year nonprofit institutions and weighted by undergraduate enrollment.
Source: Author’s calculations using data from the Integrated Postsecondary Education Data System (U.S. Department of Education, National Center for Education Statistics, 2014) for undergraduate students for the 2011/12 school year.
Changes to the Parent Loans for Undergraduate Students program
Before 2011 PLUS applications were approved if the applicant had no bankruptcies, foreclosures, student loan defaults, tax liens, or wage garnishments during the preceding five years and was not more than 90 days delinquent on any debt. The changes in credit standards introduced in 2011 were intended to bring the standards in line with those used by banks (Nelson, 2012). After the change, having unpaid debts in collection or student loans written off as unpayable in the previous five years could also block the approval of PLUS loans (Doubleday, 2013). Because parents who wish to take out PLUS loans are required to reapply each year, these new credit standards applied to parents of both incoming first-year students and continuing students.
2

The 2011 tightening of standards was meant to “prevent people from taking on debt they may not be able to afford while protecting taxpayer dollars,” according to a spokesperson for the U.S. Department of Education (Wang, Supiano, & Fuller, 2012). The change in PLUS credit standards could result in improved outcomes for some parents if it induces students to find alternatives to PLUS loans to finance their education. Low-income parents are more likely to face large debt burdens, which could lead to default. A survey of PLUS borrowers showed that PLUS repayments make up 38 percent of monthly income for parents in the bottom decile of the income distribution (Wang et al., 2012). However, the change in PLUS credit standards could also result in negative outcomes if the reduced access to PLUS loans makes it more difficult for some students to attend college.
PLUS loans, which had been increasing each year since 2008/09, declined following the 2011 changes in credit standards. The amount of money disbursed under PLUS loans more than doubled in real terms in the decade leading up to the 2012/13 school year (Wang et al., 2012). Growth was not constant over the period, and there were some declines in the mid-2000s, but the drop in 2012/13 was substantially larger than in any other year during the preceding decade. After the change in PLUS loan credit standards, there was a 21 percentage point decline in the PLUS approval rate at United Negro College Fund member institutions (all of which are HBCUs), from 48 percent in 2011/12 to 27 percent in 2012/13 (United Negro College Fund, 2014).
PLUS credit standards were loosened somewhat in October 2014, when the U.S. Department of Education announced changes to the program to relax the 2011 credit standards and require parents with adverse credit histories to receive loan counseling before obtaining a PLUS loan (Field, 2014). Under the 2014 rules, parents can obtain loans if they do not have debts totaling more than $2,085 that are either 90 days delinquent or that have been placed in collection or charged off during the previous two years (U.S. Department of Education, 2014).
Studies have shown that inadequate financial support is related to attrition from higher education (Palmer, Davis, & Hilton, 2009) and that a significant positive relationship exists between parents' income and assets and children’s educational attainment, after controlling for student ability (Belley & Lochner, 2007; Huang, Guo, Kim, & Sherraden, 2010; Kinsler & Pavan, 2011). Students’ higher education decisions are strongly related to monetary transfers from parents, including transfers from parents' income and loans taken out by parents (Johnson, 2013; Keane & Wolpin, 2001; Winter, 2014). The extent to which parents can find other sources of income or cut their expenses to finance higher education might moderate the effect of a PLUS loan denial on the higher education decisions of students.
In general, students are reluctant to take out large loans to finance higher education. In addition, increasing parent contributions and tuition subsidies is substantially more effective in raising educational attainment than is increasing student loan availability (Johnson, 2013). Therefore, although students become eligible for additional unsubsidized federal direct loans when their parents are denied PLUS loans, students may choose not to take out the additional loans and may instead switch to part-time enrollment, increase paid work, transfer to lower-cost institutions, or drop out of school.
Changes to the financial aid landscape might have a particularly strong effect on students who attend HBCUs. Although tuition tends to be lower at HBCUs than at other comparable institutions, studies show that recent increases in tuition at HBCUs to compensate for
The change in PLUS credit standards could result in improved outcomes for some parents if it induces students to find alternatives to PLUS loans to finance their education but could also result in negative outcomes if the reduced access to PLUS loans makes it more difficult for some students to attend college
3
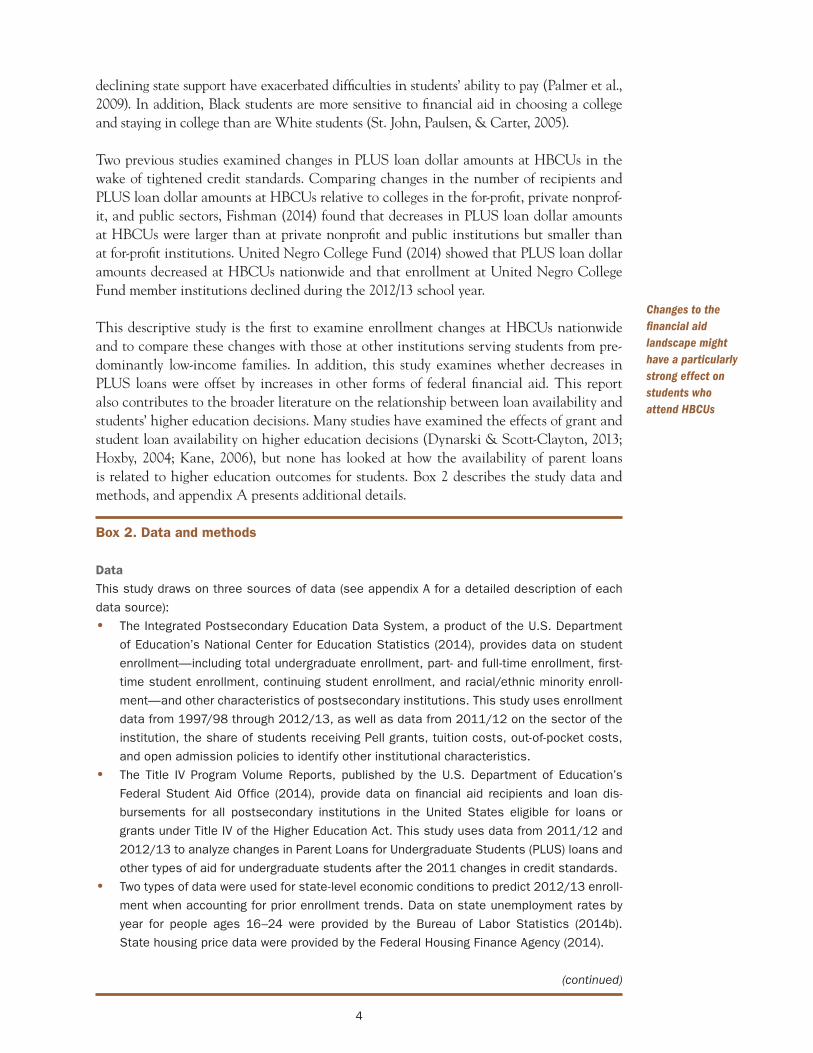
declining state support have exacerbated difficulties in students’ ability to pay (Palmer et al., 2009). In addition, Black students are more sensitive to financial aid in choosing a college and staying in college than are White students (St. John, Paulsen, & Carter, 2005).
Two previous studies examined changes in PLUS loan dollar amounts at HBCUs in the wake of tightened credit standards. Comparing changes in the number of recipients and PLUS loan dollar amounts at HBCUs relative to colleges in the for-profit, private nonprofit, and public sectors, Fishman (2014) found that decreases in PLUS loan dollar amounts at HBCUs were larger than at private nonprofit and public institutions but smaller than at for-profit institutions. United Negro College Fund (2014) showed that PLUS loan dollar amounts decreased at HBCUs nationwide and that enrollment at United Negro College Fund member institutions declined during the 2012/13 school year.
This descriptive study is the first to examine enrollment changes at HBCUs nationwide and to compare these changes with those at other institutions serving students from predominantly low-income families. In addition, this study examines whether decreases in PLUS loans were offset by increases in other forms of federal financial aid. This report also contributes to the broader literature on the relationship between loan availability and students’ higher education decisions. Many studies have examined the effects of grant and student loan availability on higher education decisions (Dynarski & Scott-Clayton, 2013; Hoxby, 2004; Kane, 2006), but none has looked at how the availability of parent loans is related to higher education outcomes for students. Box 2 describes the study data and methods, and appendix A presents additional details.
Box 2. Data and methods
Data This study draws on three sources of data (see appendix A for a detailed description of each
data source):
• The Integrated Postsecondary Education Data System, a product of the U.S. Department
of Education’s National Center for Education Statistics (2014), provides data on student
enrollment—including total undergraduate enrollment, part- and full-time enrollment, first-
time student enrollment, continuing student enrollment, and racial/ethnic minority enroll
ment—and other characteristics of postsecondary institutions. This study uses enrollment
data from 1997/98 through 2012/13, as well as data from 2011/12 on the sector of the
institution, the share of students receiving Pell grants, tuition costs, out-of-pocket costs,
and open admission policies to identify other institutional characteristics.
• The Title IV Program Volume Reports, published by the U.S. Department of Education’s
Federal Student Aid Office (2014), provide data on financial aid recipients and loan dis
bursements for all postsecondary institutions in the United States eligible for loans or
grants under Title IV of the Higher Education Act. This study uses data from 2011/12 and
2012/13 to analyze changes in Parent Loans for Undergraduate Students (PLUS) loans and
other types of aid for undergraduate students after the 2011 changes in credit standards.
• Two types of data were used for state-level economic conditions to predict 2012/13 enroll
ment when accounting for prior enrollment trends. Data on state unemployment rates by
year for people ages 16–24 were provided by the Bureau of Labor Statistics (2014b).
State housing price data were provided by the Federal Housing Finance Agency (2014).
(continued)
Changes to the financial aid landscape might have a particularly strong effect on students who attend HBCUs
4

Box 2. Data and methods (continued)
Title IV, Integrated Postsecondary Education Data System, and economic conditions data
files were merged to create an institution-level dataset. The analytic sample includes four-year
nonprofit institutions that had enrollment data for 2011/12 and 2012/13, along with data
on the share of students receiving Pell grants in 2011/12. More information on the analytic
sample is in appendix A.
Methods Descriptive statistics about changes in financial aid and enrollment are presented for three
groups of institutions: historically Black colleges and universities (HBCUs), other colleges and
universities serving students from low-income families, and other colleges and universities
serving students from higher income families. Institutions serving students from low-income
families are defined as those with 64 percent or more of undergraduates receiving Pell grants,
a proxy for the share of low-income students at each institution. The group of non-HBCUs
serving students from higher income families represents all other four-year institutions in the
sample (87 percent of all four-year institutions) and is designed to provide a broad picture of
how financial aid and enrollment were changing in 2012/13.
The cutoff for classifying an institution as serving students from low-income families was
chosen so that the percentage of students eligible for Pell grants in HBCUs and non-HBCUs
serving students from low-income families in 2011/12 was similar (approximately 72 percent).
The two groups of institutions differ in racial/ethnic composition, with a higher percentage of
Black students at HBCUs and a higher percentage of Hispanic students at non-HBCUs serving
students from low-income families. The multivariate regressions of PLUS loan changes account
for these differences in student body composition. These two groups of institutions were also
compared on several institutional characteristics; they do not differ significantly in their distri
butions across sectors (public or private) or in their out-of-pocket student expenses. Additional
details are in table B1 in appendix B.
The descriptive statistics are shown as percentage changes in financial aid and student
enrollment between the 2011/12 and 2012/13 school years. Statistics are also presented
for the changes in the dollar amounts of financial aid (expressed in 2012 dollars using the
consumer price index from the Bureau of Labor Statistics [2014a]) and changes in the average
number of students enrolled at each institution type.
Linear regression models were used to examine whether, after accounting for institution
and student characteristics, HBCUs experienced disproportionate changes in PLUS loans rel
ative to similar institutions. These institution and student characteristics include the share of
undergraduates receiving Pell grants, the share of Black students, the share of Hispanic stu
dents, the share of students age 25 or older, the share of foreign students, the out-of-pocket
costs of attendance, and whether the institution has an open admission policy. An additional
linear regression model was used to examine whether HBCUs experienced a disproportionate
decline in enrollment in 2012/13 after accounting for a decrease in PLUS loan recipients.
To account for factors other than the change to PLUS credit standards that may have influ
enced enrollment, another linear regression model was used to predict enrollment in 2012/13.
This model used data on enrollment, the state-level unemployment rate, and the state-level
house price index from 1997/98 through 2011/12 to predict enrollment in 2012/13 in the
absence of changes to PLUS credit standards. This predicted enrollment was compared with
the actual enrollment to estimate the relationship between the tightened credit standards and
changes in student enrollment.
5

What the study found
PLUS loan amounts declined substantially at HBCUs in 2012/13 in the wake of tightened credit standards, and they were not fully replaced by other federal aid. HBCUs experienced a larger decline in enrollment than other institutions of higher education in 2012/13, corresponding to their larger decline in PLUS loan recipients.
At HBCUs the share of families with PLUS loans declined 46 percent, and the dollar amount of PLUS loans fell 36 percent—a larger decline than at other institutions of higher education. The disproportionate decline in PLUS loan recipients at HBCUs is related statistically to the demographic composition of HBCU students. Institutions with larger proportions of low-income and Black students experienced a larger decline in PLUS loans, perhaps because low-income and Black families were more likely to be affected by the tightened credit standards. Other types of federal loans increased among HBCU students, but only enough to cover about a tenth of the decline in PLUS loans.
Enrollment at HBCUs declined 3.4 percent in 2012/13, at the same time that enrollment was increasing at other institutions of higher education, including other institutions serving student populations with similar levels of family income. The decline in enrollment at HBCUs was due almost entirely to a decline in full-time enrollment. Enrollment of first-year students declined by a larger percentage than enrollment of continuing students. In all types of institutions, enrollment of Black students declined more than enrollment of students of other races/ethnicities. The disproportionate decline in enrollment at HBCUs may be associated with the decrease in PLUS loan recipients at these institutions.
Changes in financial aid
PLUS loans declined at HBCUs between 2011/12 and 2012/13. In 2012/13, the first full school year during which the modified credit standards for PLUS loans were in place, PLUS loans declined disproportionately at HBCUs. The number of PLUS loan recipients at HBCUs decreased 45.7 percent in 2012/13, significantly more than the 28.7 percent drop at non-HBCUs serving students from low-income families (figure 1). The number of PLUS loan recipients also decreased at non-HBCUs serving students from higher income families, but by less than at non-HBCUs serving students from low-income families (14.3 percent). Coinciding with the drop in the number of recipients, the total dollar amount of PLUS loans received by students at HBCUs dropped 36.4 percent, compared with 23.5 percent at non-HBCUs serving students from low-income families (see figure 1). The aggregate changes in PLUS loan recipients and PLUS loan dollar amounts between 2011/12 and 2012/13 across all institutions are reported in table B2 in appendix B.
The decline in PLUS loan dollar amounts in 2012/13 is a departure from historical trends. Between 1999/2000 and 2011/12, PLUS loan dollar amounts at all three groups of institutions more than doubled in real terms. Although PLUS loan dollar amounts also declined at HBCUs between 2004/05 and 2008/09, the drops were substantially smaller than the drop in 2012/13 (figure 2).
The study team also examined the patterns in public and private institutions separately to identify any differences. In both the public and the private sectors, HBCUs experienced a larger drop in PLUS loan recipients and PLUS loan dollar amounts than non-HBCUs
The number of PLUS loan recipients at HBCUs decreased 45.7 percent in 2012/13, significantly more than the 28.7 percent drop at non-HBCUs serving students from low-income families
6

Figure 1. PLUS loan recipients and PLUS loan dollar amounts declined more at four-year historically Black colleges and universities than at other colleges and universities between 2011/12 and 2012/13
Percentage change
–50
–40
–30
–20
–10
0
Historically Black colleges and universities (HBCUs) (n = 83)
Non-HBCUs serving students from higher income families (n = 1,435) Non-HBCUs serving students from low-income families (n = 131)
Change in PLUS loan recipients Change in PLUS loan dollar amounts
PLUS is the federal Parent Loans for Undergraduate Students program.
Note: Differences between HBCUs and non-HBCUs serving students from low-income families as well as differences between non-HBCUs serving students from higher income families and non-HBCUs serving students from low-income families are statistically significant at the p < .001 level.
Source: Authors’ calculations based on data from the Integrated Postsecondary Education Data System (U.S. Department of Education, National Center for Education Statistics, 2014) and Title IV Program Volume Reports (U.S. Department of Education, Federal Student Aid Office, 2014).
Figure 2. The decline in PLUS loan dollar amounts at historically Black colleges and universities and other colleges and universities in 2012/13 was a departure from historical trends
Index of PLUS loan dollar amounts (100 = 1999)
100
150
200
250
300 Historically Black colleges and universities (HBCUs) (n = 80)
Non-HBCUs serving students from low-income families (n = 119)
Non-HBCUs serving students from higher income families (n = 1,401)
1999 2000 2001 2002 2003 2004 2005 2006 2007 2008 2009 2010 2011 2012
PLUS is the federal Parent Loans for Undergraduate Students program.
Note: The year refers to the fall semester of each academic year. PLUS loan dollar amounts for each institution group are normalized to equal 100 in the base year of 1999/2000. During this year the total amount of PLUS loans was $152 million at HBCUs, $39 million at non-HBCUs serving students from low-income families, and $3.5 billion at non-HBCUs serving students from higher income families. The sample includes only institutions that enrolled undergraduate students during all years between 1999/2000 and 2012/13.
Source: Authors’ calculations based on data from the Integrated Postsecondary Education Data System (U.S. Department of Education, National Center for Education Statistics, 2014) and Title IV Program Volume Reports (U.S. Department of Education, Federal Student Aid Office, 2014).
7

=
- -
=
-
=
did. However, public HBCUs experienced a larger decline than private HBCUs, and the difference between HBCUs and non-HBCUs was greater in the public sector (see table B3 in appendix B).
As the aggregate number of PLUS loan recipients declined, so did the share of undergraduates receiving PLUS loans. In 2012/13 the share of undergraduates receiving PLUS loans dropped 6.8 percentage points (from 15.4 percent to 8.6 percent) at HBCUs, compared with less than 1 percentage point at non-HBCUs serving students from low-income families (table 1).
The disproportionate decline in PLUS loans at HBCUs was related to the characteristics of the students served by HBCUs. The previous comparison of HBCUs with non-HBCUs serving students from low-income families was intended to restrict the sample to institutions serving students from families with similar income levels (see figure 1). To investigate PLUS loan changes at HBCUs independent of student demographic characteristics, a multivariate regression was conducted using the percentage change in PLUS loan recipients between 2011/12 and 2012/13 as the outcome variable, with control variables for baseline student demographic characteristics.
In analyses that do not account for student characteristics, HBCUs showed a significantly larger decline in PLUS loan recipients than non-HBCUs (see model 1, table B4 in appendix B). However, adding variables for student demographics—family income, race/ethnicity, age, and residence—changes the story. The disproportionate change in PLUS loan recipients at HBCUs is fully explained (statistically) by the demographic characteristics of the student body (see model 3, table B4 in appendix B).
An alternative measure of changes in PLUS loans—the change in the share of undergraduates receiving PLUS loans—was also examined. This measure incorporates enrollment changes between 2011/12 and 2012/13, not just changes in the number of PLUS loan recipients. It is the same measure used in the aggregate analysis in table 1. In this regression, student demographic characteristics explain most, but not all, of the differences in PLUS loan changes between HBCUs and non-HBCUs in 2012/13 (see model 3, table B5 in appendix B).
Table 1. Changes in PLUS loan recipients as a share of undergraduate enrollment at four-year colleges and universities between 2011/12 and 2012/13
The disproportionate change in PLUS loan recipients at HBCUs is fully explained (statistically) by the demographic characteristics of the student body
Variable
Historically Black colleges and
universities (HBCUs) (n 83)
Non HBCUs serving students from low
income families (n 131)
Non HBCUs serving students from higher
income families (n 1,435)
Undergraduates receiving PLUS loans in 2011/12 (percent) 15.4 2.4 8.2
Undergraduates receiving PLUS loans in 2012/13 (percent) 8.6 1.7 7.0
Change between 2011/12 and 2012/13 in share receiving PLUS loans (percentage points) –6.8 –0.7 –1.2
PLUS is the federal Parent Loans for Undergraduate Students program.
Source: Authors’ calculations based on data from the Integrated Postsecondary Education Data System (U.S. Department of Education, National Center for Education Statistics, 2014) and Title IV Program Volume Reports (U.S. Department of Education, Federal Student Aid Office, 2014).
8
= = =

These findings suggest that the disproportionate decrease in the percentage of students receiving PLUS loans at HBCUs relative to other institutions serving students from low-income families may be a result of the high percentages of Black students enrolled in HBCUs. This result is consistent with findings from prior research that, on average, credit histories are less favorable among Black families than among White families and families of other races/ethnicities, even after accounting for differences in family income. More than half of Black adults have credit scores in the lowest two deciles, compared with 16 percent of White adults and 30 percent of Hispanic adults (Board of Governors of the Federal Reserve System, 2007). Thus, it is likely that Black families were disproportionately affected by the tightening of credit standards for PLUS loans. However, this finding should be interpreted with caution, because there are very few non-HBCUs with Black student populations comparable to those of HBCUs. On average, Black students make up 10 percent of student enrollment at the non-HBCUs in the analytic sample and 84 percent at HBCUs. Only five non-HBCUs in the analytic sample have Black student populations greater than 82 percent, which is the 25th percentile among HBCUs in the sample.
Take-up of other types of federal loans increased in 2012/13 but not enough to make up for loss of PLUS loans. Families that were ruled ineligible for PLUS loans might have compensated for the loss by increasing other types of Title IV financial aid, such as federal direct subsidized loans, federal direct unsubsidized loans, campus-based Perkins loans, and work-study aid. The rules of the Federal Direct Loan Program state that students whose parents are denied PLUS loans are eligible for an additional $4,000–$5,000 in direct unsubsidized loans. Therefore, students might take out additional direct loans in response to PLUS loan denials. Institutions might also make additional Perkins loans available to students. Students could also be more likely to take work-study jobs if their parents are denied PLUS loans.
At HBCUs where PLUS loan dollar amounts decreased (79 of 83 HBCUs), the use of direct unsubsidized loans increased in 2012/13, but this increase compensated for only about a tenth of the drop in PLUS loan amounts. Across all HBCUs in this sample, PLUS loans dropped $164 million in 2012/13, while direct unsubsidized loans increased only $15.7 million. These HBCUs also experienced a small increase in campus-based Perkins loans and a decrease in direct subsidized loans and work-study aid (table 2).
By comparison, non-HBCUs that saw a drop in PLUS loan dollar amounts (1,297 of 1,566 institutions) experienced losses of both subsidized and unsubsidized direct loans and work-study aid and modest increases in campus-based Perkins loans. The decrease in direct loan amounts is consistent with findings from other research on changes in financial aid in 2012/13 (Baum & Payea, 2013).
Access was unavailable to institution-level data on other types of non–Title IV financial assistance that could have been used to make up for the losses of PLUS loans in 2012/13. Data from the College Board on higher education funding nationwide provide some insights into aggregate trends in other sources of financial aid. These data come partly from the College Board’s Annual Survey of Colleges (College Board, 2013), so the sample may not overlap exactly with the one used in this report. The aggregate College Board data show that, although the disbursement of most types of federal grants and loans decreased in 2012/13, undergraduates used more institutional grants (up $1.4 billion, or 4 percent), federal grants for veterans (up $914 million, or 9 percent, in 2012/13), and private loans (up
Across all HBCUs in the sample, PLUS loans dropped $164 million in 2012/13, while direct unsubsidized loans increased only $15.7 million
9

- -
=
-
=
Table 2. Aggregate changes in dollar amounts of PLUS loans and other types of Title IV aid at four-year colleges and universities between 2011/12 and 2012/13 (millions of dollars)
Financial aid category
Historically Black colleges and
universities (HBCUs) (n = 79)
Non HBCUs serving students from low
income families (n 105)
Non HBCUs serving students from higher
income families (n 1,192)
PLUS loans –164.0 –27.0 –924.9
Direct subsidized loans –50.3 –52.4 –573.1
Direct unsubsidized loans 15.7 –57.3 –450.7
Campus-based Perkins loans 1.2 1.0 27.3
Work-study aid –0.7 –2.4 –22.7
PLUS is the federal Parent Loans for Undergraduate Students program.
Note: Sample includes only institutions that experienced a decline in PLUS loan dollar amounts between 2011/12 and 2012/13.
Source: Authors’ calculations based on data from the Integrated Postsecondary Education Data System (U.S. Department of Education, National Center for Education Statistics, 2014) and Title IV Program Volume Reports (U.S. Department of Education, Federal Student Aid Office, 2014).
$650 million, or 12 percent, in 2012/13) than they did in 2011/12 (Baum & Payea, 2013). It is possible that students whose families were denied PLUS loans in 2012/13 turned to these types of aid sources to fund their education expenses.
Changes in undergraduate enrollment
This section examines whether enrollment at HBCUs and other institutions of higher education declined during the same year that PLUS loans declined. This study is not designed to uncover causal effects, but rather to describe changes in enrollment that may be related to the tightening of PLUS credit standards. Analyses of enrollment changes used the same sample and the same comparison groups as the analyses of PLUS loan changes. The sample includes only institutions that had some students who participated in the PLUS loan program in 2011/12, because these institutions are most likely to have been affected by the change in PLUS credit standards.
Undergraduate enrollment at HBCUs declined during the 2012/13 school year. During the first year that tightened credit standards for PLUS loans were in place, undergraduate enrollment declined 3.4 percent at four-year HBCUs, approximately equivalent to an average loss of 97 students per institution (table 3). Other institutions experienced increases in average number of students: enrollment rose by an average of 39 students at non-HB-CUs serving students from low-income families and 45 students at non-HBCUs serving students from higher income families.
In general, out-of-pocket costs of attendance are higher at private institutions than at public institutions. Therefore, losses in supplemental financial aid could affect students at private institutions more than students at public institutions. The analysis found that undergraduate enrollment declined at a slightly higher rate at private HBCUs than at public HBCUs (see table C1 in appendix C), while among non-HBCUs, undergraduate enrollment increased at a higher rate at private institutions than at public institutions.
During the first year that tightened credit standards for PLUS loans were in place, undergraduate enrollment declined 3.4 percent at four-year HBCUs and rose at other institutions
10
== = =

=
- -
=
-
=
Table 3. Changes in undergraduate enrollment at four-year colleges and universities between 2011/12 and 2012/13
Student sample
Historically Black colleges and
universities (HBCUs) (n 83)
Non HBCUs serving students from low income
families (n 131)
Non HBCUs serving students from higher
income families (n 1,435)
Percentage change
Change in average
number of students
per institution
Percentage change
Change in average
number of students
per institution
Percentage change
Change in average
number of students
per institution
All undergraduates –3.4** –97 0.9 39 0.8 45
Part-time undergraduates –1.2 –4 1.7 26 2.1 25
First-year undergraduates –6.4** –38 –3.2 –21 –0.2* –2
* significant at p < .05; ** significant at p < .01.
Note: Significance levels relate to differences in the average percentage change in enrollment relative to non-HBCUs serving students from low-income families.
Source: Authors’ calculations based on data from the Integrated Postsecondary Education Data System (U.S. Department of Education, National Center for Education Statistics, 2014).
At HBCUs, first-time enrollment of degree-seeking students declined 6.4 percent, or almost twice as much as the
The decline in enrollment at HBCUs was due primarily to a loss of full-time students. When financial aid declines, students may switch from full-time to part-time status to reduce the cost of attendance and increase the amount of time they have available to work for pay. Students also may transfer to a school that has lower tuition or offers more financial aid or to a school close to home, to avoid room and board expenses. Or they may drop out of school entirely. The Integrated Postsecondary Education Data System does not allow for examination of the decisions of individual students, but total changes in part- and full-time enrollment can be examined at the institution level.
HBCUs experienced a small drop in part-time enrollment during 2012/13 (see table 3), losing an average of four part-time students per institution. Clearly, then, most of the change in enrollment reported for all undergraduates is due to a drop in full-time student enrollment. In contrast, enrollment increased at non-HBCUs serving students from low-income families and non-HBCUs serving students from higher income families, mostly among students enrolled part-time (see table 3).
Enrollment at HBCUs declined faster among first-year students than among continuing students. Students whose parents are denied PLUS loans may respond differently to the lack of financial aid, depending on their year of enrollment. Continuing students may be more likely than first-year students to seek other sources of financial aid and remain enrolled if they are close to completing a degree. First-year students who would have enrolled in a four-year college might be more likely to switch to a lower cost two-year institution or to postpone enrolling in college because they have not already invested time and money in a four-year college. A decline in first-year enrollment that is larger than the decline in continuing student enrollment could indicate that future enrollment will be even lower than the 2012/13 enrollment if the size of the entering class of students each year remains smaller than in previous years.
decline in total undergraduate enrollment and twice as much as the decline in first-year enrollment at non-HBCUs serving students from low-income families
11
= ==
=
- -
=
-
=
At HBCUs, first-time enrollment of degree-seeking students declined 6.4 percent, or almost twice as much as the decline in total undergraduate enrollment (see table 3). At other four-year institutions, first-year enrollment declined as well, by 3.2 percent at non-HBCUs serving students from low-income families and by 0.2 percent at non-HBCUs serving students from higher income families. This general decline in first-year enrollment at four-year institutions is consistent with the enrollment numbers reported in Knapp, Kelly-Reid, and Ginder (2012) and Ginder and Kelly-Reid (2013).
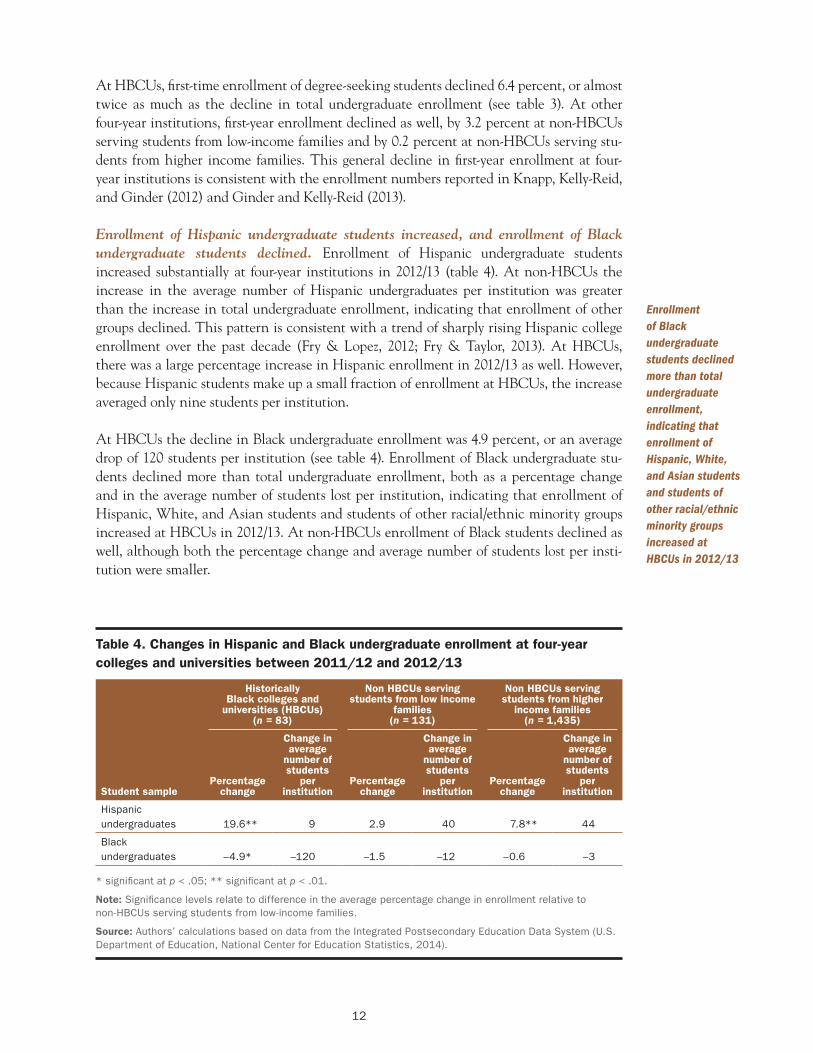
Enrollment of Hispanic undergraduate students increased, and enrollment of Black undergraduate students declined. Enrollment of Hispanic undergraduate students increased substantially at four-year institutions in 2012/13 (table 4). At non-HBCUs the increase in the average number of Hispanic undergraduates per institution was greater than the increase in total undergraduate enrollment, indicating that enrollment of other groups declined. This pattern is consistent with a trend of sharply rising Hispanic college enrollment over the past decade (Fry & Lopez, 2012; Fry & Taylor, 2013). At HBCUs, there was a large percentage increase in Hispanic enrollment in 2012/13 as well. However, because Hispanic students make up a small fraction of enrollment at HBCUs, the increase averaged only nine students per institution.
At HBCUs the decline in Black undergraduate enrollment was 4.9 percent, or an average drop of 120 students per institution (see table 4). Enrollment of Black undergraduate students declined more than total undergraduate enrollment, both as a percentage change and in the average number of students lost per institution, indicating that enrollment of Hispanic, White, and Asian students and students of other racial/ethnic minority groups increased at HBCUs in 2012/13. At non-HBCUs enrollment of Black students declined as well, although both the percentage change and average number of students lost per institution were smaller.
Table 4. Changes in Hispanic and Black undergraduate enrollment at four-year colleges and universities between 2011/12 and 2012/13
Enrollment of Black undergraduate students declined more than total undergraduate enrollment, indicating that enrollment of Hispanic, White, and Asian students and students of other racial/ethnic minority groups increased at HBCUs in 2012/13
Student sample
Historically Black colleges and
universities (HBCUs) (n 83)
Non HBCUs serving students from low income
families (n 131)
Non HBCUs serving students from higher
income families (n 1,435)
Percentage change
Change in average
number of students
per institution
Percentage change
Change in average
number of students
per institution
Percentage change
Change in average
number of students
per institution
Hispanic undergraduates 19.6** 9 2.9 40 7.8** 44
Black undergraduates –4.9* –120 –1.5 –12 –0.6 –3
* significant at p < .05; ** significant at p < .01.
Note: Significance levels relate to difference in the average percentage change in enrollment relative to non-HBCUs serving students from low-income families.
Source: Authors’ calculations based on data from the Integrated Postsecondary Education Data System (U.S. Department of Education, National Center for Education Statistics, 2014).
12
=
= = =

How changes in financial aid and changes in undergraduate enrollment were related
The disproportionate decline in enrollment at HBCUs in 2012/13 was associated with the decline in PLUS loan recipients. A regression model was run to examine whether the larger decline in enrollment at HBCUs than at other institutions serving students from low-income families was related to the decline in the number of PLUS loan recipients.
HBCUs experienced a decline in enrollment that averaged 4.1 percentage points greater than that of non-HBCUs (model 1, table 5), a difference that is statistically significant at the p < .001 level. However, after a variable capturing the change in PLUS loan recipients at each school (as a percentage of 2011/12 enrollment) is added to the regression model, the difference in enrollment changes between HBCUs and non-HBCUs drops to 0.7 percentage point and is no longer statistically significant (model 2, table 5). Thus, the disproportionate decline in enrollment at HBCUs in 2012/13 can be explained largely (statistically) by the decline in PLUS loan recipients. The analyses in this study do not rigorously test whether enrollment changes were the result of PLUS loan changes. Other factors that could have caused enrollment to decrease and that may have had larger impacts on the institutions that experienced a greater decline in the number of PLUS loan recipients in 2012/13 are discussed below.
The results were not sensitive to accounting for institution-specific trends in prior enrollment and changes in economic conditions. During the decade preceding the change in PLUS credit standards, enrollment at HBCUs had increased at a slower pace than enrollment at four-year nonprofit institutions nationwide (see box 1). Between fall 2010 and fall 2011, enrollment at HBCUs fell 0.7 percent, whereas enrollment at four-year nonprofit institutions nationwide, though slowing, increased 1.6 percent (Snyder & Dillow, 2013). Thus the observed decrease in enrollment at HBCUs in 2012/13 could have reflected continuation of a prior trend unrelated to the change in PLUS credit standards. Economic shocks and falling housing values could also have affected enrollment. Undergraduate enrollment tends to be countercyclical, implying that enrollment will fall during good economic times and rise during bad times (Betts & McFarland, 1995; Christian, 2007; Dellas
The disproportionate decline in enrollment at HBCUs in 2012/13 can be explained largely (statistically) by the decline in PLUS loan recipients. The analyses in this study do not rigorously test whether enrollment changes were the result of PLUS loan changes. Other factors could have caused enrollment to decrease and may have had larger impacts on the institutions that experienced a Table 5. Difference in changes in undergraduate enrollment between four-year greater decline in
historically Black colleges and universities and other colleges and universities the number of PLUS
between 2011/12 and 2012/13, with and without accounting for changes in PLUS loan recipients loan recipients in 2012/13
Variable Model 1
(enrollment change only)
Model 2 (enrollment change and PLUS
loan recipient change)
Differencea (percentage points) –4.1*** –0.7
Change in PLUS loan recipients as share of 2011/12 enrollment (percent) na 0.6***
*** significant at p < .001.
na is not applicable.
PLUS is the federal Parent Loans for Undergraduate Students program.
a. A negative value means that enrollment declined.
Source: Authors’ calculations based on data from the Integrated Postsecondary Education Data System (U.S. Department of Education, National Center for Education Statistics, 2014) and Title IV Program Volume Reports (U.S. Department of Education, Federal Student Aid Office, 2014).
13

=
- -
=
-
=
& Koubi, 2003; Kienzl, Alfonso, & Melguizo, 2007). In addition, changes in family wealth related to housing values can affect student enrollment and school completion decisions (Lovenheim, 2011; Lovenheim & Reynolds, 2013).
To account for some of the factors unrelated to the change in PLUS credit standards that might have influenced enrollment in 2012/13, a regression model was run with institution-specific controls for prior trends in enrollment, state-level unemployment rates, and state-level housing prices (see appendix D). The model used undergraduate enrollment, state unemployment, and state house price index data from 1997/98 through 2011/12 to predict enrollment in 2012/13. The differences between actual and predicted enrollment in 2012/13 can be interpreted as the changes in enrollment associated with changes in the PLUS loan credit standards and other unobservable factors not included in the model.
The difference between actual and predicted changes in enrollment is larger in absolute terms at HBCUs than at non-HBCUs serving students from low-income families (table 6). This suggests that accounting for prior enrollment trends, changes in economic conditions, and housing prices does not change the general result that enrollment declined more at HBCUs than at other institutions serving students with similar family income levels. However, models predicting enrollment have considerable statistical noise in the estimates, in part because substantial variability is inherent in institution-level enrollment trends. This is reflected by the fact that the difference between actual and predicted enrollment at HBCUs relative to the difference at non-HBCUs serving students from low-income families is not statistically significant (row 3, table 6), even though the magnitude of that difference is greater than the difference in actual enrollment changes (row 1, table 6). Therefore, the differences between actual and predicted enrollment in table 6 should be interpreted with caution.
The finding that the disproportionate change in enrollment at HBCUs can be explained by a decrease in PLUS loan recipients remains after accounting for institution-specific trends in enrollment and changes in economic conditions. This was examined by regressing the difference between actual and predicted percentage changes in enrollment on an HBCU indicator variable and the change in PLUS loan recipients (as a percentage of 2011/12
Table 6. Actual and predicted changes in undergraduate enrollment at four-year colleges and universities between 2011/12 and 2012/13
The finding that the disproportionate change in enrollment at HBCUs can be explained by a decrease in PLUS loan recipients remains after accounting for institution-specific trends in enrollment and changes in economic conditions
Variable
Historically Black colleges and
universities (HBCUs) (n 81)
Non HBCUs serving students from low
income families (n 123)
Non HBCUs serving students from higher
income families (n 1,416)
Actual change in enrollment (percent)
–3.3** 1.1 0.7
Predicted change in enrollment (percent)
0.9 –0.9 0.2
Difference (percentage points) –4.2 2.0 0.5
** significant at p < .01.
Note: Significance levels relate to differences relative to non-HBCUs serving students from low-income families in each row. The sample size is slightly smaller than for the main descriptive statistics because of the additional requirement that institutions have nonmissing enrollment data for at least eight years before 2012/13 to ensure a long enough enrollment history to estimate an institution-specific enrollment trend. See appendix D for details.
Source: Authors’ calculations based on data from the Integrated Postsecondary Education Data System (U.S. Department of Education, National Center for Education Statistics, 2014).
14
= = =

Table 7. Difference between actual and predicted percentage change in undergraduate enrollment at historically Black colleges and universities and other colleges and universities between 2011/12 and 2012/13, with and without accounting for change in PLUS loan recipients
Variable Model 1
(enrollment change only)
Model 2 (enrollment change and PLUS
loan recipient change)
Differencea (percentage point) –4.8* –2.3
Change in PLUS loan recipients as share of 2011/12 enrollment (percent) na 0.4*
* significant at p < .05.
na is not applicable.
PLUS is the federal Parent Loans for Undergraduate Students program.
Source: Authors’ calculations based on data from the Integrated Postsecondary Education Data System (U.S. Department of Education, National Center for Education Statistics, 2014) and Title IV Program Volume Reports (U.S. Department of Education, Federal Student Aid Office, 2014).
enrollment). The difference between actual and predicted enrollment at HBCUs and other institutions is initially statistically significant and equal to 4.8 percentage points (model 1, table 7). However, the magnitude of the difference decreases and is no longer statistically significant after accounting for the change in PLUS loan recipients (model 2, table 7).
Implications for future research
Although this study did not analyze all possible responses to the tightening of credit standards for PLUS loans, it provides previously undocumented descriptive information on changes in enrollment and federal financial aid at HBCUs and other institutions of higher education.
A useful extension of this study for researchers to consider would involve acquiring student-level data from HBCUs on financial aid and academic outcomes. Students whose parents received a PLUS loan during 2011/12 but were denied a PLUS loan in 2012/13 could be compared with students whose parents continued to receive a PLUS loan in 2012/13. This comparison would be informative about what changes in financial aid, credit completion, and grade point average are associated with the loss of a PLUS loan. A similar research design could be used to analyze the outcomes of students whose parents were previously denied a PLUS loan but were approved for a PLUS loan after implementation of the rule change announced in October 2014 designed to relax credit standards for PLUS loans. An analysis of the outcomes of students whose parents experience a change in PLUS loan eligibility could be useful to HBCUs and other universities in developing strategies to assist students who have unmet financial aid needs.
Limitations of the study
When interpreting the results from this study, two important limitations should be considered:
• The study results provide descriptive evidence but do not support strong causal inferences. Because it was not possible to implement a randomized experiment testing the effect of changing credit standards for PLUS loans, strong causal inferences
This study provides previously undocumented descriptive information on changes in enrollment and federal financial aid at HBCUs and other institutions of higher education
15

cannot be drawn about the influence of the change in credit standards for PLUS loans on financial aid and student enrollment. Rather, the results provide descriptive evidence about changes in financial aid and enrollment that occurred after the tightening of credit standards. The regression analysis that included controls for institution-specific trends in prior enrollment and economic conditions helped account for some other factors that could have influenced enrollment changes in 2012/13. However, the results from this analysis still do not provide causal evidence, because other unknown factors could have affected enrollment.
• Because the study relied on institution-level data rather than student-level data, the analysis may not include all changes that occurred in response to the tightening of credit standards for PLUS loans. For example, the data did not show whether parents found other sources of money to replace lost PLUS loans. The data on student work decisions were limited because only work-study information was available, which did not include hours worked at other jobs. The financial aid information used in the analysis was also limited because data on private student loans were not available. However, the largest change to student aid in response to PLUS loan denial likely involved a change to federally provided loans, given that the rules for the Federal Direct Loan Program increase loan limits if a student’s parents are denied a PLUS loan. In addition, because private loans are often cosigned by a student’s parents, parents who are denied PLUS loans could have credit ratings that are too low to be eligible to cosign for a private student loan.
16

Appendix A. Data and sample restrictions
This appendix describes the data sources and methods used to construct the analytic sample.
Data from the Integrated Postsecondary Education Data System
The Integrated Postsecondary Education Data System (IPEDS; U.S. Department of Education, National Center for Education Statistics, 2014) contains annual data on enrollment, student demographics, attendance costs, and other institutional characteristics from all providers of postsecondary education in the United States. The study uses data from 2012/13 and historical data from the past 15 years: final release data from 1997/98 through 2011/12 and provisional release data from 2012/13. (Provisional release data from historical years showed results similar to final release data.) IPEDS data used in this study included:
• Enrollment. Enrollment data from fall 1997 through fall 2012 on full- and part-time undergraduate students were used in the analyses. To distinguish between first-year and continuing student enrollment, enrollment data were used for first-time, transfer-in, and continuing degree-seeking students available through the IPEDS variable “EFALEVEL.”
• Race/ethnicity. Data on Black and Hispanic undergraduate student enrollment were used as covariates in the regressions of PLUS loan changes and the analysis of enrollment changes. The race/ethnicity data came from the IPEDS variables “EFBKAAT” and “EFHISPT,” which measure the number of Black or African American students and the number of Hispanic or Latino students enrolled at the institution. These variables were combined with “EFALEVEL” to derive the undergraduate Black enrollment and undergraduate Hispanic enrollment.
• Pell grants. Data on the percentage of undergraduates receiving Pell grants were used as a proxy for the percentage of low-income students at each institution. Of Pell grant recipients, 58 percent come from households with family incomes of $20,000 or less, and 85 percent come from households with family incomes of $40,000 or less (U.S. Department of Education, Office of Postsecondary Education, 2013). The study used the IPEDS variable “PGRNT_P,” which measures the percentage of full-time, first-time undergraduate students receiving Pell grants.
• Historically Black colleges and university (HBCU). The analysis was conducted separately for HBCUs and non-HBCUs. HBCUs were identified by the IPEDS variable “HBCU.”
• Level and control of the institution. To compare enrollment changes across institutions with similar structures, the study identified whether the institution is a two-year or four-year college and whether the institution is public or private, using the IPEDS variable “SECTOR.”
• Degree-granting status of the institution. The analysis included only degree-granting institutions. They are identified by the IPEDS variable “HDEGOFFR.”
• Title IV eligibility of the institution. The analysis included only institutions that are eligible to receive student aid through Title IV of the Higher Education Act. They are identified by the IPEDS variable “PSET4FLG.”
• Out-of-pocket costs of attendance. To compare institutions that have similar costs of attendance, the study used data on the out-of-pocket cost of attendance as a covariate in the regressions of Parent Loans for Undergraduate Students (PLUS) changes. The IPEDS variable “NPIST2” captures the average net price for full-time,
A-1

first-time degree- or certificate-seeking undergraduate students receiving any government or institution grant or scholarship aid and paying in-state or in-district tuition at public institutions. The variable “NPGRN2” captures the average net price for students receiving grant or scholarship aid at private institutions.
• Open admission. The IPEDS categorical variable “OPENADMP” indicates whether the institution has an open admission policy.
• Independent status of students. Parents of independent students are not eligible for PLUS loans. Students are considered independent if they are age 23 or older. IPEDS does not identify the percentage of independent students at each institution, but the variable “EFBAGE” provides information on the number of students who are age 25 or older. This can be used as a proxy for the percentage of independent students, and it was included as a covariate in some of the regression models. Students are also considered independent if they are married, are working on a master’s or doctorate degree, are currently serving on active duty in the U.S. armed forces, are veterans of the U.S. armed forces, have children or other nonspouse dependents who receive more than half their support from the student, were in foster care or were wards of the court at any time after age 13, had both parents deceased after age 13, are emancipated minors or in a legal guardianship, or were homeless or self-supporting and at risk for homelessness at any time in the past six months. IPEDS does not include data on any of these criteria for independent status, so they could not be used in the analysis.
• Foreign resident status of students. Parents of students who are residents of foreign countries are not eligible for PLUS loans. The study team used the variable “EFCSTATE” to calculate the percentage of students residing in foreign countries at the time of enrollment. This is included as a covariate in some of the regression models.
Title IV Volume Reports
The Title IV Volume Reports (U.S. Department of Education, Federal Student Aid Office, 2014) contain institutional-level data on federal loans and work-study programs. The data available in the Title IV Volume Reports have a seven-quarter provisional data period to account for adjustments. Title IV data used in this study included:
• Direct loans. These data consist of annual information from the Federal Direct Loan Program in 2011/12 and 2012/13 on the number of loan recipients, the number of loan disbursements, and the dollar amount of the disbursements for direct loans. The data are organized into subsidized federal direct loans, unsubsidized federal direct loans, and direct PLUS loans.
• Campus-based federal student aid. These data contain annual information for 2011/12 and 2012/13, detailing the number of recipients, the dollar award amount, and the dollar disbursement amount for federal work-study programs and Perkins loan programs.
Economic data
The study used several types of economic data from various sources. Inflation data were used to calculate real values for financial aid amounts and tuition expenses, and unemployment and housing price data were used to predict enrollment trends. Economic data used in this study included:
• Inflation. Consumer price index data (Bureau of Labor Statistics, 2014a) were used to calculate the real value of nominal variables such as financial aid amounts,
A-2

tuition expenses, and housing prices. A version of the consumer price index that incorporates housing prices was used to adjust financial aid amounts and tuition expenses, and a version that excludes housing prices was used to adjust housing price index values. All dollar amounts are expressed in 2012 dollars.
• Unemployment. State-level annual unemployment data (Bureau of Labor Statistics, 2014b) were used as a proxy for economic conditions. The unemployment rates for people ages 16–19 and ages 20–24 were averaged to calculate an unemployment rate for people ages 16–24, the age range that includes most undergraduate students. The enrollment prediction model included covariates for unemployment rates to determine the extent to which changes in economic conditions might be related to deviations from enrollment trends.
• Housing prices. State annual housing price index data (Federal Housing Finance Agency, 2014) were used as an additional proxy for economic conditions. Past research has shown that changes in the housing wealth of parents can affect student enrollment and completion decisions (Lovenheim, 2011; Lovenheim & Reynolds, 2013). To account for fluctuations in enrollment because of changes in housing prices, the enrollment prediction model included a control variable for the state-level average house price.
Analytic sample
IPEDS records and Title IV records were merged to create a dataset that could be used to analyze financial aid and enrollment changes. The data were merged using the year variable and the institution’s Office of Postsecondary Education identification (OPE ID) from each data file. It was a many-to-one merger because there is one record per year per OPE ID in the Title IV dataset, but multiple records per year per OPE ID in IPEDS. This is because IPEDS gathers data at the campus level, and some institutions have one OPE ID but multiple campuses.
After the data files were merged, the sample was restricted in several ways to arrive at the group of institutions that was included in the financial aid and enrollment analyses.
Because the study focuses on changes between 2011/12 and 2012/13, the initial sample included all nonprofit postsecondary campuses in IPEDS in 2011/12 (row 1, table A1). Campuses that enrolled no undergraduate students or were missing undergraduate enrollment in 2011/12 or 2012/13 were excluded from the analysis (see row 2, table A1).
Because financial aid data are reported at the OPE ID level, it was necessary to collapse the data so that there was one observation per OPE ID, instead of one observation per campus, as IPEDS is structured (see row 3, table A1). In collapsing the IPEDS records to the OPE ID level, the study team calculated the sum of undergraduate enrollment across campuses. The averages of the out-of-pocket costs of attendance and the percentage of Pell grant recipients, weighted by the undergraduate enrollment at each campus, were calculated. If the institution had two-year and four-year campuses, the institution was counted as a four-year institution.
The sample was then restricted to degree-granting institutions that were eligible for Title IV aid (see row 4, table A1). Institutions were dropped if they were missing key data for the analysis, including the number of PLUS loan recipients and Pell grant recipients (see rows
A-3

-
- -
- - -
5–6, table A1). The final analytic sample included 83 four-year HBCUs, 1,566 four-year non-HBCUs, 4 two-year HBCUs, and 622 two-year non-HBCUs. With only four two-year HBCUs in the analytic sample, the sample size was too small to analyze two-year HBCUs separately. Summary statistics for changes in financial aid and enrollment for all two-year nonprofit institutions (including the four HBCUs), as well as for for-profit institutions, appear in appendix E.
Table A1. Sample restrictions
Restriction
Four year historically
Black colleges and universities
(HBCUs) Four year
non HBCUs Two year HBCUs
Two year non HBCUs
All nonprofit campuses in the Integrated Postsecondary Data System with nonmissing sector information in 2011/12 87 2,199 11 1,240
Drop institutions for which all campuses have 0 or missing undergraduate enrollment in 2011/12 or 2012/13 84 1,911 11 1,216
Collapse institutions with multiple campuses so there is one observation per Office of Postsecondary Education ID 84 1,777 11 1,105
Drop institutions that are non–degree granting or not eligible for Title IV aid in 2011/12 or 2012/13 84 1,774 11 970
Drop institutions that have 0 or missing PLUS loan recipients in 2011/12 83 1,615 4 623
Drop institutions with missing data on the percentage of students receiving Pell Grants in all study years 83 1,566 4 622
PLUS is the federal Parent Loans for Undergraduate Students program.
Source: Authors’ calculations based on data from the Integrated Postsecondary Education Data System and Title IV Program Volume Reports (U.S. Department of Education, Federal Student Aid Office, 2014).
A-4
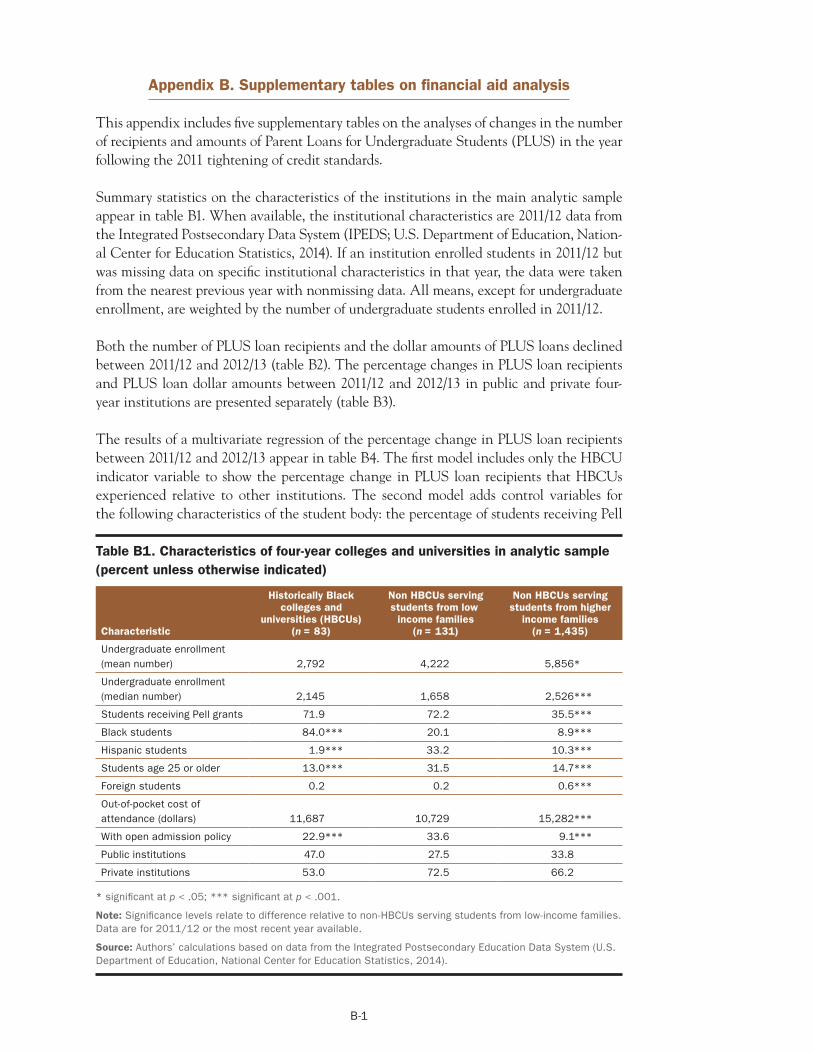
=
- -
=
-
=
Appendix B. Supplementary tables on financial aid analysis
This appendix includes five supplementary tables on the analyses of changes in the number of recipients and amounts of Parent Loans for Undergraduate Students (PLUS) in the year following the 2011 tightening of credit standards.
Summary statistics on the characteristics of the institutions in the main analytic sample appear in table B1. When available, the institutional characteristics are 2011/12 data from the Integrated Postsecondary Data System (IPEDS; U.S. Department of Education, National Center for Education Statistics, 2014). If an institution enrolled students in 2011/12 but was missing data on specific institutional characteristics in that year, the data were taken from the nearest previous year with nonmissing data. All means, except for undergraduate enrollment, are weighted by the number of undergraduate students enrolled in 2011/12.
Both the number of PLUS loan recipients and the dollar amounts of PLUS loans declined between 2011/12 and 2012/13 (table B2). The percentage changes in PLUS loan recipients and PLUS loan dollar amounts between 2011/12 and 2012/13 in public and private four-year institutions are presented separately (table B3).
The results of a multivariate regression of the percentage change in PLUS loan recipients between 2011/12 and 2012/13 appear in table B4. The first model includes only the HBCU indicator variable to show the percentage change in PLUS loan recipients that HBCUs experienced relative to other institutions. The second model adds control variables for the following characteristics of the student body: the percentage of students receiving Pell
Table B1. Characteristics of four-year colleges and universities in analytic sample (percent unless otherwise indicated)
Characteristic
Historically Black colleges and
universities (HBCUs) (n 83)
Non HBCUs serving students from low
income families (n 131)
Non HBCUs serving students from higher
income families (n 1,435)
Undergraduate enrollment (mean number) 2,792 4,222 5,856*
Undergraduate enrollment (median number) 2,145 1,658 2,526***
Students receiving Pell grants 71.9 72.2 35.5***
Black students 84.0*** 20.1 8.9***
Hispanic students 1.9*** 33.2 10.3***
Students age 25 or older 13.0*** 31.5 14.7***
Foreign students 0.2 0.2 0.6***
Out-of-pocket cost of attendance (dollars) 11,687 10,729 15,282***
With open admission policy 22.9*** 33.6 9.1***
Public institutions 47.0 27.5 33.8
Private institutions 53.0 72.5 66.2
* significant at p < .05; *** significant at p < .001.
Note: Significance levels relate to difference relative to non-HBCUs serving students from low-income families. Data are for 2011/12 or the most recent year available.
Source: Authors’ calculations based on data from the Integrated Postsecondary Education Data System (U.S. Department of Education, National Center for Education Statistics, 2014).
B-1
= = =

=
-
- =
-
=
--
-
Table B2. Aggregate changes in PLUS loan recipients and PLUS loan dollar amounts at four-year institutions between 2011/12 and 2012/13
Category
Historically Black colleges and
universities (HBCUs) (n 83)
Non HBCUs serving students from
low income families (n 131)
Non HBCUs serving students from higher
income families (n 1,435)
Aggregate change in number of PLUS loan recipients –16,878 –3,750 –97,554
Aggregate change in PLUS loan amounts (millions of dollars) –164 –26 –850
PLUS is the federal Parent Loans for Undergraduate Students program.
Source: Authors’ calculations based on data from the Integrated Postsecondary Education Data System (U.S. Department of Education, National Center for Education Statistics, 2014) and Title IV Program Volume Reports (U.S. Department of Education, Federal Student Aid Office, 2014).
Table B3. Percentage changes in PLUS loan recipients and PLUS loan dollar amounts at public and private four-year colleges between 2011/12 and 2012/13
Sector
Historically Black colleges and universities
(HBCUs) Non HBCUs serving students
from low income families Non HBCUs serving students from higher income families
Change in PLUS loan recipients
Change in PLUS
loan dollar amounts
Change in PLUS loan recipients
Change in PLUS
loan dollar amounts
Change in PLUS loan recipients
Change in PLUS
loan dollar amounts
Public –50.1*** –43.1*** –27.8 –20.4 –14.6* –9.4
Private –39.9** –30.8 –29.2 –24.7 –13.9*** –9.0***
* significant at p < .05; ** significant at p < .01; *** significant at p < .001.
PLUS is the federal Parent Loans for Undergraduate Students program.
Note: Significance levels relate to differences in the average percentage change in PLUS loan recipients and PLUS loan dollar amounts relative to non-HBCUs serving students from low-income families. The sample for public universities includes 39 HBCUs, 36 non-HBCUs serving students from low-income families, and 485 non-HBCUs serving students from higher income families. The sample for private universities includes 44 HBCUs, 95 non-HBCUs serving students from low-income families, and 950 non-HBCUs serving students from higher income families.
Source: Authors’ calculations based on data from the Integrated Postsecondary Education Data System (U.S. Department of Education, National Center for Education Statistics, 2014) and Title IV Program Volume Reports (U.S. Department of Education, Federal Student Aid Office, 2014).
grants, the percentage of Black students, the percentage of Hispanic students, the percentage of students age 25 or older, and the percentage of foreign students. The percentage of students age 25 or older is included because these students are classified as independent, and thus their parents are not eligible to take out PLUS loans. Institutions with more students age 25 or older are expected to have a smaller decrease in the percentage of PLUS loan recipients (which is reflected in the positive and significant coefficient on this variable). A similar logic holds for the inclusion of the percentage of foreign students variable (although the coefficient estimate for this variable is not significantly different from zero).
When including only linear controls for student characteristics, the coefficient on HBCUs actually becomes positive and statistically significant, indicating that HBCUs experienced a smaller change than other similar institutions in PLUS loan recipients. In model 3, when quadratic controls for the student characteristics are added, the difference between HBCUs and non-HBCUs was small and not statistically significant (p = .48) (see models
B-2
= = =

Table B4. Regression of percentage change in PLUS loan recipients at four-year colleges between 2011/12 and 2012/13 on institution characteristics
Variable Model 1 Model 2 Model 3 Model 4
HBCU indicator –31.17*** 8.09** –3.40 –3.19
Percentage of Pell grant recipients –0.40*** –0.08 –0.06
Percentage of Pell grant recipients squared/100 –0.36*** –0.38***
Percentage of Black students –0.29*** –0.48*** –0.48***
Percentage of Black students squared/100 0.38*** 0.38***
Percentage of Hispanic students 0.21*** 0.41*** 0.40***
Percentage of Hispanic students squared/100 –0.55*** –0.51***
Percentage of students age 25 or older 0.05* –0.03 –0.003
Percentage of students age 25 or older squared/1,000 0.02 0.01
Percentage of foreign students –0.27 1.16 1.27
Percentage of foreign students squared/100 –0.40* –0.44*
Out-of-pocket cost of attendance 0.11**
Open admission policy 0.29
* significant at p < .05; ** significant at p < .01; *** significant at p < .001.
PLUS is the federal Parent Loans for Undergraduate Students program. HBCUs are historically Black colleges and universities.
Note: Model 1 shows the percentage change in PLUS loan recipients that HBCUs experienced relative to other institutions. Model 2 adds control variables for the following characteristics of the student body: the percentage of students receiving Pell grants, the percentage of Black students, the percentage of Hispanic students, the percentage of students age 25 or older, and the percentage of foreign students. Model 3 adds quadratic controls for the student characteristics. Model 4 also controls for average out-of-pocket costs and open admission policies. The sample in regression models 1–3 includes 1,649 four-year universities. The sample in model 4 includes 1,645 four-year universities. The coefficients are weighted by the number of undergraduate students enrolled in each institution in 2011/12.
Source: Authors’ calculations based on data from the Integrated Postsecondary Education Data System (U.S. Department of Education, National Center for Education Statistics, 2014) and Title IV Program Volume Reports (U.S. Department of Education, Federal Student Aid Office, 2014).
2 and 3, table B4). Model 4 in table B4 also controls for average out-of-pocket costs and open admission policies. These covariates do not affect the magnitude of the coefficient on HBCUs, but there is a positive statistically significant relationship between out-of-pocket costs and the percentage change in PLUS loan recipients, indicating that more expensive institutions had a smaller decrease in PLUS loan recipients.
The results of a similar multivariate regression on a different, but related, dependent variable appear in table B5, which shows the change in the share of undergraduates receiving PLUS loans. This measure incorporates enrollment changes between 2011/12 and 2012/13. These results are also used in table 2. In this analysis, student characteristics explain more than half, but not all, of the differences between HBCUs and non-HBCUs (see model 3, table B5).
B-3

Table B5. Regression of change in share of undergraduates receiving PLUS loans at four-year colleges between 2011/12 and 2012/13 on institution characteristics
Variable Model 1 Model 2 Model 3 Model 4
HBCU indicator –5.52*** –2.49*** –2.19*** –2.27***
Percentage of Pell grant recipients –0.03*** –0.09*** –0.12***
Percentage of Pell grant recipients squared/100 0.08*** 0.09***
Percentage of Black students –0.02*** –0.02** –0.02*
Percentage of Black students squared/100 –0.01 –0.02
Percentage of Hispanic students –0.03*** 0.05*** 0.04***
Percentage of Hispanic students squared/100 –0.04*** –0.04***
Percentage of students age 25 or older 0.04*** 0.07*** 0.06***
Percentage of students age 25 or older squared/10,000 0.04*** 0.02*
Percentage of foreign students 0.08 0.41*** 0.36***
Percentage of foreign students squared/100 –0.11*** –0.08**
Out-of-pocket cost of attendance –0.06***
Open admission policy 0.10
* significant at p < .05; ** significant at p < .01; *** significant at p < .001.
PLUS is the federal Parent Loans for Undergraduate Students program. HBCUs are historically Black colleges and universities.
Note: Model 1 shows the percentage change in PLUS loan recipients that HBCUs experienced relative to other institutions. Model 2 adds control variables for the following characteristics of the student body: the percentage of students receiving Pell grants, the percentage of Black students, the percentage of Hispanic students, the percentage of students age 25 or older, and the percentage of foreign students. Model 3 adds quadratic controls for the student characteristics. Model 4 also controls for average out-of-pocket costs and open admission policies. The sample in regression models 1–3 includes 1,649 four-year universities. The sample in model 4 includes 1,645 four-year universities. The coefficients are weighted by the number of undergraduate students enrolled in each institution in 2011/12.
Source: Authors’ calculations based on data from the Integrated Postsecondary Education Data System (U.S. Department of Education, National Center for Education Statistics, 2014) and Title IV Program Volume Reports (U.S. Department of Education, Federal Student Aid Office, 2014).
B-4

--
-
Appendix C. Enrollment changes at public and private institutions
Slightly more than half of four-year historically Black colleges and universities (HBCUs) are private nonprofit institutions, and the rest are public institutions. Private HBCUs are more expensive than public HBCUs: the average out-of-pocket cost of attendance was $17,000 at private HBCUs, compared with $9,500 at public HBCUs. It is possible that the higher cost of attendance would make students at private HBCUs more sensitive than students at public HBCUs to the loss of a PLUS loan.
To examine whether changes in enrollment in 2012/13 differed between public and private HBCUs, the main descriptive statistics are presented separately for both sectors in table C1. Enrollment at private four-year HBCUs decreased 0.79 percentage point more than at public four-year HBCUs. The average number of students lost per institution was greater at public four-year HBCUs because they tend to enroll more students.
Table C1. Changes in undergraduate enrollment at public and private four-year colleges between 2011/12 and 2012/13
Sector
Historically Black colleges and universities
(HBCUs) Non HBCUs serving students
from low income families Non HBCUs serving students from higher income families
Percentage change in enrollment
Change in average
number of students per institution
Percentage change in enrollment
Change in average
number of students per institution
Percentage change in enrollment
Change in average
number of students per institution
Public –3.1* –139 0.6 56 0.6 77
Private –3.9** –60 1.6 33 1.2 28
* significant at p < .05; ** significant at p < .01.
Note: Significance levels relate to differences in the average percentage change in enrollment relative to non-HBCUs serving students from low-income families. The sample for public universities includes 39 historically Black colleges and universities, 36 non-HBCUs serving students from low-income families, and 485 non-HBCUs serving students from higher income families. The sample for private universities includes 44 historically Black colleges and universities, 95 non-HBCUs serving students from low-income families, and 950 non-HBCUs serving students from higher income families.
Source: Authors’ calculations based on data from Integrated Postsecondary Education Data System (U.S. Department of Education, National Center for Education Statistics, 2014).
C-1
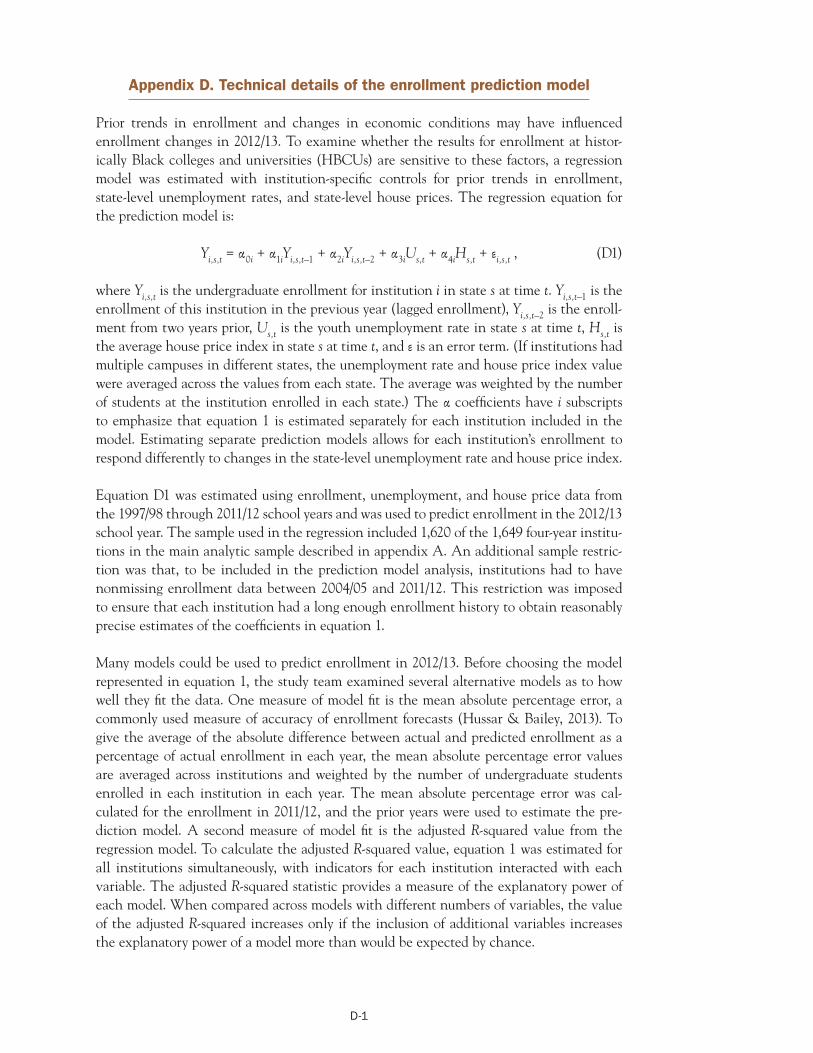
Appendix D. Technical details of the enrollment prediction model
Prior trends in enrollment and changes in economic conditions may have influenced enrollment changes in 2012/13. To examine whether the results for enrollment at historically Black colleges and universities (HBCUs) are sensitive to these factors, a regression model was estimated with institution-specific controls for prior trends in enrollment, state-level unemployment rates, and state-level house prices. The regression equation for the prediction model is:
= α0i + α1i U + α4iH (D1) Yi,s,t Yi,s,t–1 + α2iYi,s,t–2 + α3i s,t s,t + εi,s,t ,
where Yi,s,t is the undergraduate enrollment for institution i in state s at time t. Yi,s,t–1 is the enrollment of this institution in the previous year (lagged enrollment), Yi,s,t–2 is the enrollment from two years prior, U is the youth unemployment rate in state s at time t, H is s,t s,tthe average house price index in state s at time t, and ε is an error term. (If institutions had multiple campuses in different states, the unemployment rate and house price index value were averaged across the values from each state. The average was weighted by the number of students at the institution enrolled in each state.) The α coefficients have i subscripts to emphasize that equation 1 is estimated separately for each institution included in the model. Estimating separate prediction models allows for each institution’s enrollment to respond differently to changes in the state-level unemployment rate and house price index.
Equation D1 was estimated using enrollment, unemployment, and house price data from the 1997/98 through 2011/12 school years and was used to predict enrollment in the 2012/13 school year. The sample used in the regression included 1,620 of the 1,649 four-year institutions in the main analytic sample described in appendix A. An additional sample restriction was that, to be included in the prediction model analysis, institutions had to have nonmissing enrollment data between 2004/05 and 2011/12. This restriction was imposed to ensure that each institution had a long enough enrollment history to obtain reasonably precise estimates of the coefficients in equation 1.
Many models could be used to predict enrollment in 2012/13. Before choosing the model represented in equation 1, the study team examined several alternative models as to how well they fit the data. One measure of model fit is the mean absolute percentage error, a commonly used measure of accuracy of enrollment forecasts (Hussar & Bailey, 2013). To give the average of the absolute difference between actual and predicted enrollment as a percentage of actual enrollment in each year, the mean absolute percentage error values are averaged across institutions and weighted by the number of undergraduate students enrolled in each institution in each year. The mean absolute percentage error was calculated for the enrollment in 2011/12, and the prior years were used to estimate the prediction model. A second measure of model fit is the adjusted R-squared value from the regression model. To calculate the adjusted R-squared value, equation 1 was estimated for all institutions simultaneously, with indicators for each institution interacted with each variable. The adjusted R-squared statistic provides a measure of the explanatory power of each model. When compared across models with different numbers of variables, the value of the adjusted R-squared increases only if the inclusion of additional variables increases the explanatory power of a model more than would be expected by chance.
D-1

-
The final measures evaluated were the Akaike information criteria and Bayesian information criteria, which are also commonly used measures of how well a model fits the data; these measures account for the number of parameters used in the model (Akaike, 1974; Schwarz, 1978). These two information criteria are similar in that lower values of the Akaike and Bayesian information criteria imply a better fit of the prediction model to the data. The Bayesian system includes a larger penalty for additional parameters, meaning that more parsimonious models will tend to be favored by Bayesian relative to Akaike information criteria.
The fit of the different models is shown in table D1. The first row shows the mean absolute percentage error, adjusted R-squared value, and information criteria for the model represented in equation D1 that uses two lags of enrollment, the state unemployment rate and the state house price index, to predict enrollment. The second through fourth rows show variations on this model, which involve removing, in turn, the second lag of enrollment, the house price index, and the unemployment rate. The first model was used in table D1 because it had a lower mean absolute percentage error value, a higher adjusted R-squared value, and a lower Akaike information criteria value than the other models. Even though this model provides the best fit, there is a substantial amount of statistical noise in the prediction that it provides. The mean absolute percentage error for model 1 is 1.9 percent (row 1, table D1), which is nearly half of the difference between the actual percentage change in enrollment between HBCUs and non-HBCUs serving students from low-income families (see row 1, table 7 in the main text).
Table D1. Measures of fit for prediction model 1 of undergraduate enrollment at four-year colleges
Model
Mean absolute percentage
errora Adjusted R squared
Akaike information
criteriab
Bayesian information
criteriab
Two lags of enrollment + unemployment + house price 1.9 0.9979 261 324
Lagged enrollment + unemployment + house price 2.2 0.9978 284 335
Lagged enrollment + unemployment 2.5 0.9976 285 323
Lagged enrollment 2.8 0.9972 287 312
Note: The sample in the model fit calculations includes 1,620 four-year universities.
a. Calculated using data from 2011/12 and prior years and weighted by the number of undergraduate students enrolled in each institution in each year.
b. Divided by 1,000 for display purposes.
Source: Authors’ calculations based on data from the Integrated Postsecondary Education Data System (U.S. Department of Education, National Center for Education Statistics, 2014).
D-2

-
=
- -
=
- -
=
Appendix E. Changes in PLUS loans and enrollment at two-year and for-profit institutions
The analytic sample described in the main body of the report includes only four-year nonprofit institutions. Although this sector includes most historically Black colleges and universities (HBCUs), a small number of HBCUs are in the two-year nonprofit sector, so the study team examined trends in Parent Loans for Undergraduate Students (PLUS) program loans at these institutions as well. There are 11 two-year nonprofit HBCUs in the country, but the study team dropped 7 from the analysis because of missing Title IV data. Given the small number of two-year HBCUs with financial aid data available, they were not analyzed separately. Instead, aggregate changes are presented for the two-year nonprofit, two-year for-profit, and four-year for-profit sectors.
PLUS loans decreased at two-year and for-profit institutions
Two-year nonprofit institutions experienced a drop of 27.4 percent in PLUS loan recipients and 24.1 percent in PLUS loan dollar amounts in 2012/13 (table E1). Two-year and four-year for-profit institutions also experienced a large decrease in PLUS loans in 2012/13. Overall, for-profit colleges experienced the largest decline in PLUS loans compared with other sectors after the tightening of PLUS credit standards. For further details about the decline in PLUS loans at for-profit colleges, see Fishman (2014).
Enrollment at two-year colleges and for-profit colleges declined, with for-profit colleges seeing the largest enrollment decrease of any sector
To provide a complete picture of changes in enrollment that occurred in conjunction with changes in PLUS credit standards, changes in enrollment for nonprofit two-year colleges, for-profit two-year colleges, and for-profit four-year colleges are presented in table E2.
Enrollment at two-year nonprofit colleges declined 1.2 percent in 2012/13. The sector that experienced the largest decline in enrollment was for-profit colleges. Enrollment at two-year for-profit colleges declined 12.9 percent, and enrollment at four-year for-profit colleges declined 4.7 percent.
Table E1. Changes in PLUS loan recipients and PLUS loan dollar amounts at two-year nonprofit, two-year for-profit, and four-year for-profit institutions between 2011/12 and 2012/13 (percent)
Category
Two year nonprofit institutions (n 626)
Two year for profit institutions (n 325)
Four year for profit institutions (n 182)
Change in PLUS loan recipients –27.4 –36.5 –31.2
Change in PLUS loan dollar amounts –24.1 –33.7 –26.9
PLUS is the federal Parent Loans for Undergraduate Students program.
Source: Authors’ calculations based on data from the Integrated Postsecondary Education Data System (U.S. Department of Education, National Center for Education Statistics, 2014) and Title IV Program Volume Reports (U.S. Department of Education, Federal Student Aid Office, 2014).
E-1
= = =

-
=
- -
=
- -
=
Table E2. Changes in undergraduate enrollment at two-year nonprofit, two-year for-profit, and four-year for-profit colleges between 2011/12 and 2012/13
Category
Two year nonprofit institutions (n 626)
Two year for profit institutions (n 325)
Four year for profit institutions (n 182)
Change in enrollment (percent) –1.2 –12.9 –4.7
Change in average number of students per institution –87 –141 –232
Source: Authors’ calculations based on data from the Integrated Postsecondary Education Data System (U.S. Department of Education, National Center for Education Statistics, 2014).
E-2
= = =

References
Akaike, H. (1974). A new look at the statistical model identification. IEEE Transactions on Automatic Control, 19(6), 716–723.
Anderson, N. (2013, June 22). Tighter federal lending standards yield turmoil for historically Black colleges. The Washington Post. Retrieved August 22, 2013, from http://www. washingtonpost.com/local/education/tighter-federal-lending-standards-yield-turmoil -for-historically-black-colleges/2013/06/22/6ade4acc-d9a5–11e2-a9f2–42ee3912ae0e_ story.html
Baum, S., & Payea, K. (2013). Trends in student aid 2013. New York, NY: College Board. Retrieved June 15, 2014, from http://trends.collegeboard.org/sites/default/files/student -aid-2013-full-report-140108.pdf
Belley, P., & Lochner, L. (2007). The changing role of family income and ability in determining educational achievement. Journal of Human Capital, 1(1), 37–89. http://eric. ed.gov/?id=ED502002
Betts, J. R., & McFarland, L. L. (1995). Safe port in a storm: The impact of labor market conditions on community college enrollments. Journal of Human Resources, 30(4), 741–765.
Board of Governors of the Federal Reserve System. (2007). Report to the Congress on credit scoring and its effects on the availability and affordability of credit. Retrieved June 23, 2014, from http://www.federalreserve.gov/boarddocs/rptcongress/creditscore/
Bureau of Labor Statistics. (2014a). Consumer price index – All urban consumers, 1990– 2013. Retrieved April 25, 2014, from http://www.bls.gov/cpi/data.htm
Bureau of Labor Statistics. (2014b). Employment status of the civilian noninstitutional population in states by sex, race, Hispanic or Latino ethnicity, marital status, and detailed age, 1999–2012. Retrieved April 30, 2014, from http://www.bls.gov/lau/
College Board. (2013). Total undergraduate student aid by source and type over time, Table 1A. Retrieved June 11, 2014, from http://trends.collegeboard.org/student-aid/ figures-tables/total-aid
Christian, M. S. (2007). Liquidity constraints and the cyclicality of college enrollment in the United States. Oxford Economic Papers, 59(1), 141–169.
Dellas, H., & Koubi, V. (2003). Business cycles and schooling. European Journal of Political Economy, 19(4), 843–859.
Doubleday, J. (2013). With parents denied loans, students scramble at HBCUs. Chronicle of Higher Education. Retrieved February 5, 2014, from http://chronicle.com/article/ Without-Federal-PLUS-Loans/142147/
Dynarski, S., & Scott-Clayton, J. (2013). Financial aid policy: Lessons from research. Cambridge, MA: National Bureau of Economic Research.
Ref-1

Federal Housing Finance Agency. (2014). House price index dataset. Retrieved April 25, 2014, from http://www.fhfa.gov/DataTools/Downloads/Pages/House-Price-Index.aspx
Field, K. (2014). Coming soon for PLUS loans: More eligible borrowers, new data on defaults. Chronicle of Higher Education. Retrieved October 27, 2014, from http://chronicle.com/article/Coming-Soon-for-PLUS-Loans-/149593/
Fishman, R. (2014). The parent trap: Parent PLUS loans and intergenerational borrowing. Washington, DC: New America Education Policy Program. Retrieved May 13, 2014, from http://education.newamerica.net/sites/newamerica.net/files/policydocs/Corrected -20140110-ParentTrap.pdf
Fry, R., & Lopez, M. H. (2012). Hispanic student enrollments reach new highs in 2011. Washington, DC: Pew Hispanic Center. Retrieved June 18, 2014, from http://www.pewhispanic. org/2012/08/20/hispanic-student-enrollments-reach-new-highs-in-2011/
Fry, R., & Taylor, P. (2013). Hispanic high school graduates pass Whites in rate of college enrollment. Washington, DC: Pew Hispanic Center. Retrieved June 18, 2014, from http://www.pewhispanic.org/2013/05/09/hispanic-high-school-graduates-pass-whites -in-rate-of-college-enrollment/
Gasman, M. (2009). Historically Black colleges and universities in a time of economic crisis. Academe, 95(6), 26–28. http://eric.ed.gov/?id=EJ867307
Gasman, M. (2013). The changing faces of historically Black colleges and universities. Philadelphia, PA: University of Pennsylvania Graduate School of Education, Center for Minority Serving Institutions. Retrieved September 5, 2013, from http://www.gse. upenn.edu/pdf/cmsi/Changing_Face_HBCUs.pdf
Ginder, S. A., & Kelly-Reid, J. E. (2013). Enrollment in postsecondary institutions, fall 2012; financial statistics, fiscal year 2012; graduation rates, selected cohorts, 2004–09; and employees in postsecondary institutions, fall 2012: First look (provisional data) (NCES No. 2013–183). Washington, DC: U.S. Department of Education, National Center for Education Statistics. http://eric.ed.gov/?id=ED544569
Hoxby, C. (Ed.). (2004). College choices: The economics of where to go, when to go, and how to pay for it. Chicago, IL: University of Chicago Press.
Huang, J., Guo, B., Kim, Y., & Sherraden, M. (2010). Parental income, assets, and borrowing constraints and children’s post-secondary education. Children and Youth Services Review, 32(4), 545–594.
Hussar, W. J., & Bailey, T. M. (2013). Projections of education statistics to 2021 (NCES No. 2013–008). Washington, DC: U.S. Department of Education Statistics, National Center for Education Statistics. http://eric.ed.gov/?id=ED538495
Johnson, M. T. (2013). Borrowing constraints, college enrollment, and delayed entry. Journal of Labor Economics, 31(4), 669–725.
Ref-2
Kane, T. J. (2006). Public intervention in post-secondary education. In E. A. Hanushek & F. Welch (Eds.), Handbook of the economics of education (Vol. 2, pp. 1370–1401). Washington, DC: Elsevier. http://eric.ed.gov/?id=ED527054
Keane, M. P., & Wolpin, K. I. (2001). The effect of parental transfers and borrowing constraints on educational attainment. International Economic Review, 42(4), 1051–1103.
Kienzl, G. S., Alfonso, M., & Melguizo, T. (2007). The effect of local labor market conditions in the 1990s on the likelihood of community college students’ persistence and attainment. Research in Higher Education, 48(7), 751–774. http://eric.ed.gov/?id=EJ785018
Kim, M. M., & Conrad, C. F. (2006). The impact of historically Black colleges and universities on the academic success of African-American students. Research in Higher Education, 47(4), 399–427. http://eric.ed.gov/?id=EJ735988
Kinsler, J., & Pavan, R. (2011). Family income and higher education choices: The importance of accounting for college quality. Journal of Human Capital, 5(4), 453–477.
Knapp, L. G., Kelly-Reid, J. E., & Ginder, S. A. (2012). Enrollment in postsecondary institutions, fall 2011; financial statistics, fiscal year 2011; and graduation rates, selected cohorts, 2003–2008: First look (provisional data) (NCES No. 2012–174). Washington, DC: U.S. Department of Education, National Center for Education Statistics. http://eric. ed.gov/?id=ED536025
Lovenheim, M. F. (2011). The effect of liquid housing wealth on college enrollment. Journal of Labor Economics, 29(4), 741–771.
Lovenheim, M. F., & Reynolds, C. L. (2013). The effect of housing wealth on college choice: Evidence from the housing boom. Journal of Human Resources, 48(1), 1–35.
Montgomery, M., & Montgomery, B. L. (2012). Graduation rates at historically Black colleges and universities: An underperforming performance measure for determining institutional funding policies. Journal of Continuing Higher Education, 60(2), 93–109. http://eric.ed.gov/?id=EJ972648
Nelson, L. A. (2012, October 12). Cracking down on PLUS loans. Inside Higher ED. Retrieved September 23, 2013, from http://www.insidehighered.com/news/2012/10/12/ standards-tightening-federal-plus-loans
Palmer, R. T., Davis, R. J., & Hilton, A. A. (2009). Exploring challenges that threaten to impede the academic success of academically underprepared Black males at an HBCU. Journal of College Student Development, 50(4), 429–445. http://eric.ed.gov/?id=EJ852899
Radwin, D., Wine, J., Siegel, P., & Bryan, M. (2013). 2011–12 National postsecondary student aid study (NPSAS:12): Student financial aid estimates for 2011–12 (NCES No. 2013–165). Washington, DC: U.S. Department of Education, National Center for Education Statistics. http://eric.ed.gov/?id=ED544184
Ref-3

Richards, D. A. R., & Awokoya, J. T. (2012). Understanding HBCU retention and completion. Fairfax, VA: United Negro College Fund, Frederick D. Patterson Research Institute.
Schwarz, G. (1978). Estimating the dimension of a model. Annals of Statistics, 6(2), 461–464.
Snyder, T. D., & Dillow, S. A. (2013). Digest of education statistics 2012 (NCES No. 2014– 015). Washington, DC: U.S. Department of Education, National Center for Education Statistics. http://eric.ed.gov/?id=ED544579
St. John, E. P., Paulsen, M. B., & Carter, D. F. (2005). Diversity, college costs, and postsecondary opportunity: An examination of the financial nexus between college choice and persistence for African Americans and Whites. Journal of Higher Education, 76(5), 545–569. http://eric.ed.gov/?id=EJ725288
United Negro College Fund. (2014). The parent PLUS loan crisis: An urgent crisis facing students at the nation’s HBCUs. Retrieved September, 26, 2014, from http://www.uncf.org/ sites/advocacy/SpecialInitiatives/ParentsPlus/MediaDocuments/UNCF-Report-THE -PARENT-PLUS-LOAN-CRISIS-3.25.14.pdf
U.S. Department of Education, Federal Student Aid Office. (2014). Title IV program volume reports, AY 2011–2012 and AY 2012–2013. Retrieved April 25, 2014, from https://studentaid.ed.gov/about/data-center/student/title-iv
U.S. Department of Education, National Center for Education Statistics. (2014). Integrated postsecondary education data system, 1997–1998 – 2012–2013. Retrieved June 4, 2014, from http://nces.ed.gov/ipeds/datacenter/
U.S. Department of Education, Office of Postsecondary Education. (2013). 2011–2012 Federal Pell Grant program end-of-year report. Retrieved February 5, 2014, from http:// www2.ed.gov/finaid/prof/resources/data/pell-2011–12/pell-eoy-2011–12.pdf
U.S. Department of Education. (2014). William D. Ford Federal Direct Loan Program: Final regulations (79 Federal Register 63317). Retrieved October 27, 2014, from http:// federalregister.gov/a/2014–25266
Wang, M., Supiano, B., & Fuller, A. (2012). The parent loan trap. Chronicle of Higher Education. Retrieved January 8, 2014, from https://chronicle.com/article/ The-Parent-Loan-Trap/134844/
Winter, C. (2014). Accounting for the changing role of family income in determining college entry. Scandinavian Journal of Economics, 116(4), 909–963.
Ref-4

The Regional Educational Laboratory Program produces 7 types of reports
Making Connections Studies of correlational relationships
Making an Impact Studies of cause and effect
What’s Happening Descriptions of policies, programs, implementation status, or data trends
What’s Known Summaries of previous research
Stated Briefly Summaries of research findings for specific audiences
Applied Research Methods Research methods for educational settings
Tools Help for planning, gathering, analyzing, or reporting data or research