Integrating Chemical and Non-Chemical Stressors in Cumulative Risk

Challenges for implementation of cumulative riskChallenges for implementation of cumulative risk assessments in practice
Hermine ReichSenior Scientific OfficerSenior Scientific Officer
Workshop on Cumulative Risk AssessmentWorkshop on Cumulative Risk Assessment
11 February 2014

Cumulative risk assessment:Cumulative risk assessment:
What has been done so far ?
Acropolis, Second Stakeholder Conference, Brussels, 15 October 2013 2

EFSA outputs on Cumulative Risk Assessment
2006 EFSA's 7th Scientific Colloquium ‐ Cumulative Risk Assessment2006 EFSA s 7th Scientific Colloquium Cumulative Risk Assessment of Pesticides to Human Health: The Way Forward http://www.efsa.europa.eu/en/supporting/pub/117e.htm
2008 Scientific Opinion to evaluate the suitability of existing h d l i d if i h id ifi i fmethodologies and, if appropriate, the identification of new
approaches to assess cumulative and synergistic risks from pesticides to human health with a view to set MRLs for thosepesticides to human health with a view to set MRLs for those pesticides in the frame of Regulation (EC) 396/2005http://www.efsa.europa.eu/en/efsajournal/pub/705.htmp // p / / j /p /
2009 Scientific Opinion for a selected group of pesticides from the triazole group to test possible methodologies to assess cumulative effects from exposure through food from these
ti id h h lthpesticides on human healthhttp://www.efsa.europa.eu/en/efsajournal/pub/1167.htm

EFSA outputs on Cumulative Risk Assessment
2012 Guidance on the use of probabilistic methodology for modeling dietary t ti id idexposure to pesticide residues
http://www.efsa.europa.eu/en/efsajournal/pub/2839.htm
2013 Scientific Opinion on the identification of pesticides to be included in cumulative assessment groups on the basis of their toxicological profile http://www.efsa.europa.eu/en/efsajournal/pub/3293.htm
2013 Public Consultation Report of the Scientific Opinion on the identification of pesticides to be included in cumulative assessment groups on the basis of their toxicological profilebasis of their toxicological profile
http://www.efsa.europa.eu/en/supporting/pub/538e.htm
2013 Scientific Opinion on the relevance of dissimilar mode of action and its appropriate application for cumulative risk assessment of pesticides residues in food
http://www.efsa.europa.eu/en/efsajournal/pub/3472.htm

Other activities of EFSA related to Cumulative Risk Assessment
Development of new format for reporting monitoring data on
Cumulative Risk Assessment
pesticide residues (SSD – Standard Sample Descriptor)
Increased quantity and quality of monitoring dataIncreased quantity and quality of monitoring data
Establishment of the comprehensive food consumption data
Development of EFSA PROFile (Pesticide Residue Overview File) to collect data in the framework of the MRL review in a structuredcollect data in the framework of the MRL review in a structured format
l f ( d d k d l) Development of EFSA PRIMo (Pesticide Residue Intake Model)
Indicative cumulative risk assessment for OP pesticides andIndicative cumulative risk assessment for OP pesticides and carbamates using PRIMo (deterministic approach) (see 2010 EU Report on Pesticide Residues)

Dietary risk assessment
Hazard
Exposure Exposure AssessmentAssessment
Chemical Chemical Food Food Chemical Chemical
OccurrenceOccurrence pp
Food Food
consumptionconsumption
Toxicological Toxicological Toxicological Toxicological reference valuereference value
6
Cumulative risk assessment: work packages
Developmentof Guidance
Collection ofEstablishment Collection of data
R id d
Establishment of CAG
Potency Residue dataPotency factors
ConsumptionConsumption
Other data
Development of a tool
ImplementationImplementation7

Toxicological dataWhere are we today?Where are we today?
287 active substances were screened287 active substances were screenedNo Active substance
1 1-Methylcyclopropene
2 1-Naphthylacetamide (1-NAD)
3 1-Naphthylacetic acid (1-NAA)
4 2,4-D
5 2,4-DB (metabolized to 2,4-D)
6 2-Phenylphenol (including sodium salt h h l h l)
7 6-Benzyladenine
8 Abamectin
9 Acetamiprid
10 Acibenzolar-S-methyl (benzothiadiazole)
11 Aclonifen11 Aclonifen
12 Alpha-Cypermethrin (aka alphamethrin)
13 Aluminium phosphide Nervous system
(65 substances) Thyroid system
(101 substances)
8
14 Aluminium ammonium sulphate
15 Amidosulfuron
16 A it l ( i t i l )
( )
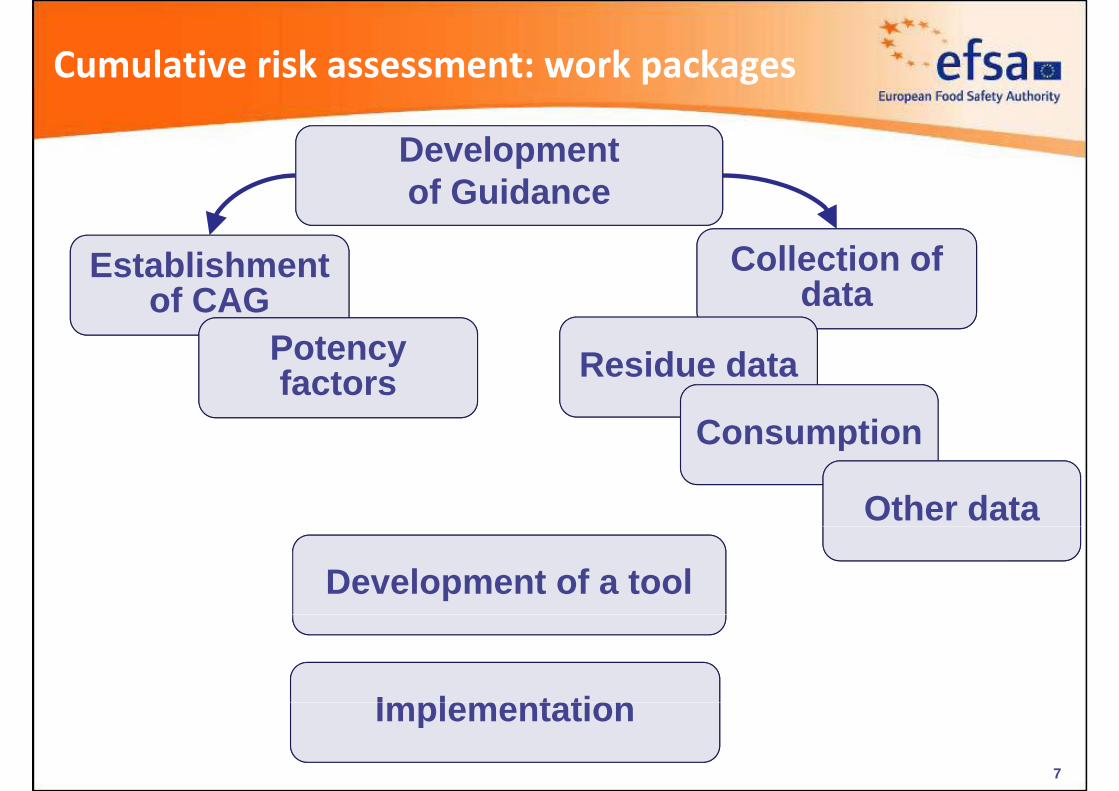
Pesticides allocated in one or more CAG
Pesticide allocated to one or more CAGs
N N Y Y N Y Y Y N N N Y Y Y N N N
N Y N Y N N N Y Y N N N Y Y Y N N
N Y N Y Y Y Y N Y N Y Y N N N Y Y
Y Y N N Y N N Y N N Y Y Y N N Y N
Y N Y N Y N N Y Y Y N Y Y Y N Y N
N N Y Y Y Y N N N N N N Y Y N Y N
N Y N N Y N Y Y Y Y N N N N N Y NN Y N N Y N Y Y Y Y N N N N N Y N
Y N N N Y Y Y N Y Y Y Y Y N N Y N
Y Y N N Y Y Y N Y N N Y Y Y Y Y N
N N Y Y N N N N N Y N Y Y N Y N N
Y N N Y N Y Y N N N N Y N Y N Y Y
Y N Y Y N N N Y N Y Y Y N Y N Y Y
N Y Y Y N Y N N Y Y Y Y N N N N N
N N Y Y N N N Y Y Y N N Y N Y Y Y
Y Y Y Y Y Y N N Y Y Y N N Y Y N Y
Y Y N Y N N N N N Y N N Y N N Y
N Y N Y N Y N Y Y N N Y N Y N Y
142 pesticides not relevant for the first 2 CAG (black squares)
N Y N Y N Y N Y Y N N Y N Y N Y
9
145 substances were allocated in one or more CAGs
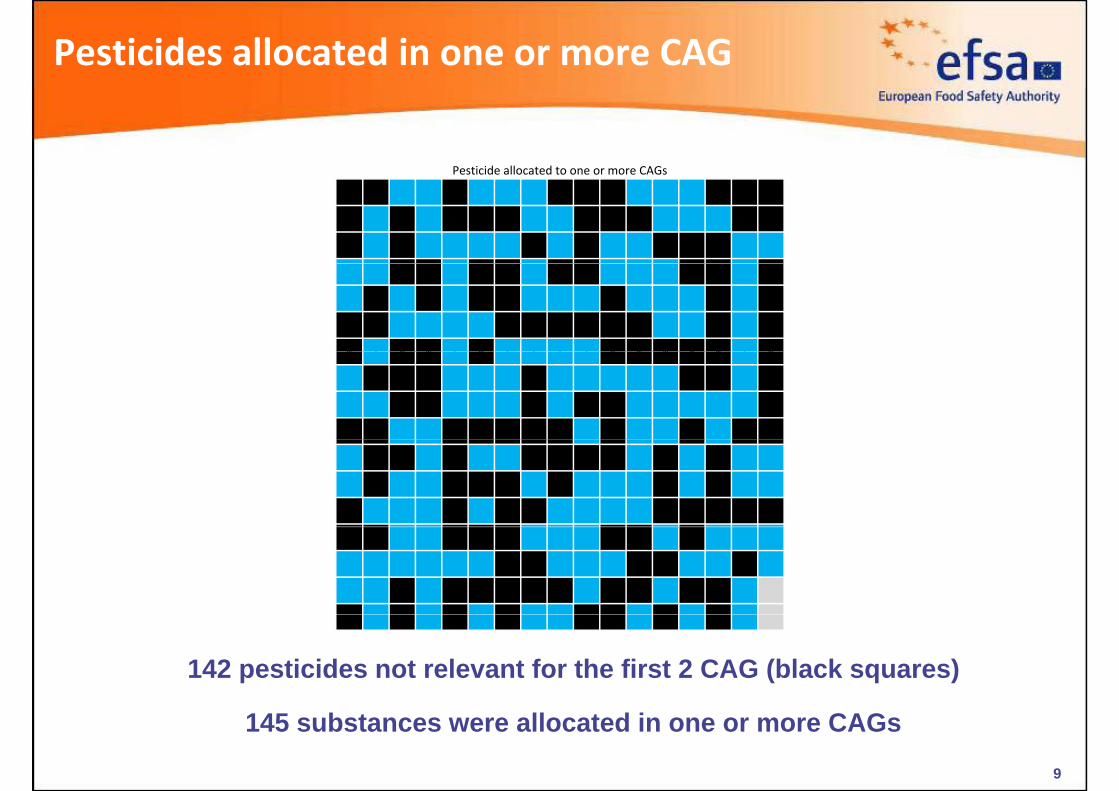
CAG level 1 – Nervous system
24-Functional effect/24-Functional effect/
Ch iCh i
Autonomic divisionAutonomic division
51-Functional effect/51-Functional effect/Chronic effectsChronic effects
51 Functional effect/Motor division
51 Functional effect/Motor division
21 F ti l Eff t/21 F ti l Eff t/
Nervous system
Nervous system
21-Functional Effect/sensory division
21-Functional Effect/sensory division
systemsystem 15-Neurochemical endpoint
15-Neurochemical endpoint28-Functional effect/
Autonomic division28-Functional effect/Autonomic division
18-Neuropathological endpoint
18-Neuropathological endpointAcute
effectsAcute effects
42-Functional effect/Motor division
42-Functional effect/Motor division
effectseffects 19-Functional Effect/sensory division
19-Functional Effect/sensory division
10
13-Neurochemical endpoint
13-Neurochemical endpoint

CAG level 1 – Thyroid group
22 substances: 22 substances: substa cesEffects on the
parafollicular (C-) cells or the calcitonin
substa cesEffects on the
parafollicular (C-) cells or the calcitoninor the calcitonin
systemor the calcitonin
system
Thyroid systemThyroid system
Chronic effectsChronic effectsyy
96 substances:Substances affecting
96 substances:Substances affecting gfollicular cells and/or
thyroid hormone (T3/T4) system
gfollicular cells and/or
thyroid hormone (T3/T4) system
11
Next steps: CAG
2
Nervous and thyroid system1 18 35 52 69 86 103 120 137 154 171 188 0
5222 239 256 273
2 19 36 53 70 87 104 121 138 155 172 189206
223 240 257 274
3 20 37 54 71 88 105 122 139 156 173 190207
224 241 258 275
24 21 38 55 72 89 106 123 140 157 174 191
208
225 242 259 276
5 22 39 56 73 90 107 124 141 158 175 192209
226 243 260 277
6 23 40 57 74 91 108 125 142 159 176 193210
227 244 261 278 Non-approved0
7 24 41 58 75 92 109 126 143 160 177 194211
228 245 262 279
8 25 42 59 76 93 110 127 144 161 178 195212
229 246 263 280
9 26 43 60 77 94 111 128 145 162 179 19621 230 247 264 281
Non-approved
and pending3
10 27 44 61 78 95 112 129 146 163 180 197214
231 248 265 282
11 28 45 62 79 96 113 130 147 164 181 198215
232 249 266 283
12 29 46 63 80 97 114 131 148 165 182 19921 233 250 267 284
substances12 29 46 63 80 97 114 131 148 165 182 199 1
6233 250 267 284
13 30 47 64 81 98 115 132 149 166 183 200217
234 251 268 285
14 31 48 65 82 99 116 133 150 167 184 201218
235 252 269 286
215 32 49 66 83 100 117 134 151 168 185 202
219
236 253 270 287
16 33 50 67 84 101 118 135 152 169 186 203220
237 254 271
17 34 51 68 85 102 119 136 153 170 187 204221
238 255 272
12
Liver, adrenal, eye reproduction and development system
Ongoing activities and next steps
Grant on “ Toxicological data collection and analysis to supportGrant on Toxicological data collection and analysis to support grouping of pesticide active substances for cumulative risk assessment of effects on the nervous system, liver, adrenal, eye y , , , yreproduction and development and thyroid system”• Final report publication by end 2015p p y
• Toxicological data collection for the liver, the nervous system, thethyroid and the reproductive and developmental system for pesticides
d h d ll happroved in the period 01‐01‐2012 to 31‐05‐2013 as well as those pending for approval and pesticide active substances that are not approved for use within EU, but are detected as residuesapproved for use within EU, but are detected as residues
• Toxicological data collection for the adrenal and eye for all pesticide active substances approved until 31‐05‐2013 as well as those pending for approval and those not approved in EU but detected as residues

Occurrence dataWhere are we today?Where are we today?
Monitoring dataMonitoring data Since 2009 the monitoring results are reported at detailed
level (individual determinations) using the SSD formatlevel (individual determinations) using the SSD format, including a lot of background informationR id d fi iti f f t Residue definition for enforcement
27 EU MS + NO, IC ca. 70.000 samples/year ca. 15 to 20 Mio determinations/yeary
14
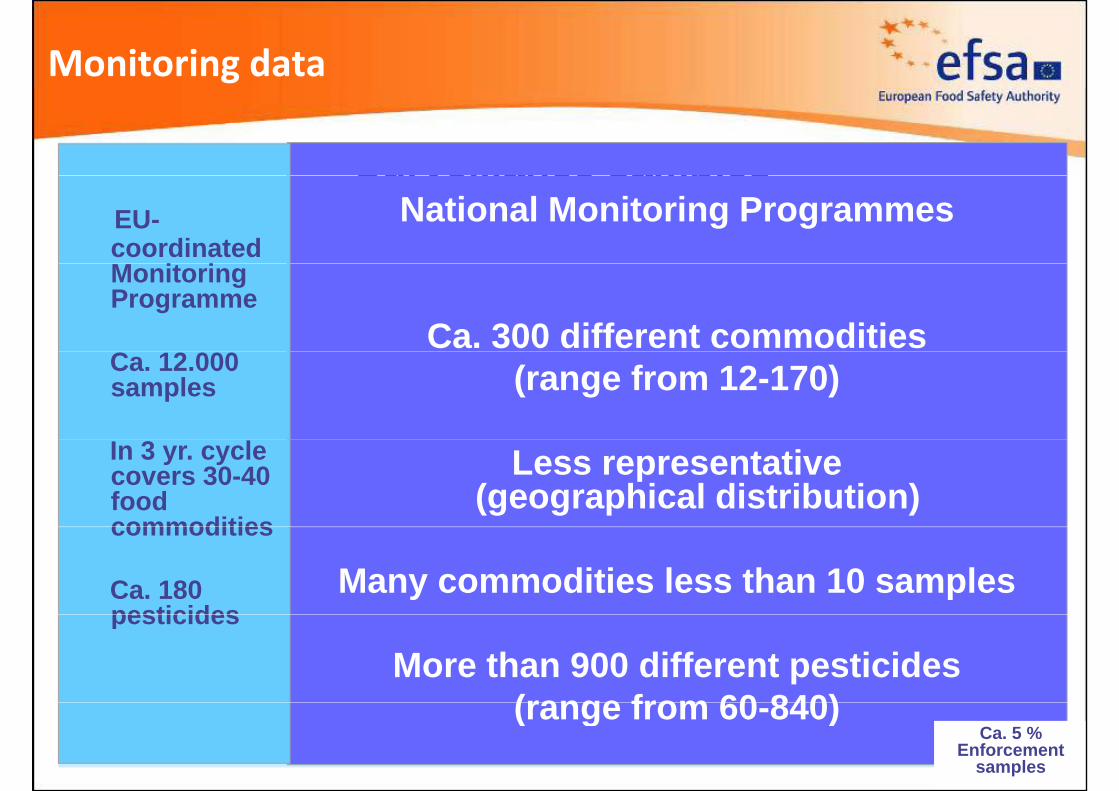
Monitoring data
Surveillance samplesSurveillance samplesNational Monitoring ProgrammesEU-
coordinated M i i
Ca. 300 different commodities
Monitoring Programme
(range from 12-170)Ca. 12.000 samples
Less representative (geographical distribution)
In 3 yr. cycle covers 30-40 food commodities
Many commodities less than 10 samplescommodities
Ca. 180 pesticides
More than 900 different pesticides(range from 60 840)
pesticides
(range from 60-840)15
Ca. 5 % Enforcement
samples

HintergrundinformationHintergrundinformation zuzu EU EU PestizidPestizidMonitoringprogrammMonitoringprogramm
Comparison of national monitoring programmes MonitoringprogrammMonitoringprogramm

Monitoring data – pesticides covered
Pesticide covered by EU coordinated monitoring programmey g p g
N Y Y N Y Y Y N N Y N N N Y N Y N
N N N N N N Y N Y Y N N N N N Y N
N N Y Y N N Y N N N Y N N N N Y N
Y N Y N Y N Y N N N Y* N Y N N N N
Y/Not sure
N N N N N Y N N N N Y N Y N N Y
N N N Y N N N N Y Y N N N N N Y N
N N N N N Y Y Y Y Y Y N N N N Y YN N N N N Y Y Y Y Y Y N N N N Y Y
Y N N N N Y Y N Y N N N Y N N Y N
Y N N N N Y*** Y N N Y N N Y Y Y Y N
N N Y* N Y N N N Y Y N N Y Y N N Y
N N Y N N Y*** N Y N N Y Y N N Y Y N
N N N Y N N N N Y Y Y N N Y N Y N
N Y Y N N Y*** N Y N N Y N Y*** Y N Y N
N N Y N N N N Y Y Y Y Y N N N Y Y
N N Y Y Y N Y N Y Y Y Y Y N Y N Y
Y*** Y N Y Y N N N N N N Y Y Y Y Y
N Y N Y N N Y Y N N N Y N N Y NN Y N Y N N Y Y N N N Y N N Y N
17

Monitoring data – pesticides covered
Pesticidein CAG and covered by EU coordinated monitoring programmey g p g
N N Y N N Y Y N N N N N N Y N N N
N N N N N N N N Y N N N N N N N N
N N N Y N N Y N N N Y N N N N Y N
Y N N N Y N N N N N N N Y N N N N
N N N N N N N N N N N Y N Y N N N
N N N Y N N N N N N N N N N N Y N
N N N N N N Y Y Y Y N N N N N Y NN N N N N N Y Y Y Y N N N N N Y N
Y N N N N Y Y N Y N N N Y N N Y N
Y N N N N N Y N N N N N Y Y Y Y N
N N N N N N N N N Y N N Y N N N N
N N N N N N N N N N N Y N N N Y N
N N N Y N N N N N Y Y N N Y N Y N
N Y Y N N N N N N N Y N N N N N N
N N Y N N N N Y Y Y N N N N N Y Y
N N Y Y Y N N N Y Y Y N N N Y N Y
N Y N Y N N N N N N N N Y N N Y
N Y N Y N N N Y N N N Y N N N N
Is there a need to adapt scope of EU coordinated monitoring programme,
N Y N Y N N N Y N N N Y N N N N
18
considering the potency of the active substance and the likelihoods to find
measurable residues (“significant contributors”)

Overlap thyroid group (T3/T4) – EU monitoring
Pesticide in thyoroid group (T3/T4) and covered by EU monitoringy g p ( / ) y g
N N Y M N Y N M N N N M M Y N N N
N M N M N N N M N N N N M M M N N
N M N Y M M Y N M N Y N N N N N M
Y M N N N N N M N N N N N N N M N
N N M N M N N M N M N Y N Y N M N
N N M N N N N N N N N N M M N Y N
N M N N N N Y Y Y N N N N N N Y NN M N N N N Y Y Y N N N N N N Y N
N N N N M N N N N M N M N N N Y N
N N N N M N N N M N N M N Y Y Y N
N N N M N N N N N Y N M Y N M N N
M N N M N N M N N N N N N M N Y M
N N N N N N N M N N N N N Y N N N
N Y Y M N M N N M M N M N N N N N
N N N N N N N Y Y Y N N M N N Y Y
M M N N N M N N N Y Y N N M N N Y
M Y N Y N N N N N M N N Y N N N
N Y N Y N M N Y M N N Y N M N N
Is there a need to adapt scope of EU coordinated monitoring programme,
N Y N Y N M N Y M N N Y N M N N
19
considering the potency of the active substance and the likelihoods to find
measurable residues (“significant contributors”)

Occurrence data – Food types
Cumulative exposureCumulative exposure Monitoring data Supervised field trials
reflecting realistic worst caseEU coordinated programme
reflecting realistic worst casesituation for critical GAPsSTMRs / HRs for RAC
National control programmes
STMRs / HRs for RAC,sometimes for edible portionD t fl ti id
Other data sources ?
Data reflecting residuedefinition for risk assessmentand enforcement (parentOther data sources ? and enforcement (parentcompound and metaboliteswhere relevant)where relevant)• Outdoor NEU / SEU /Third
t i20
countries• Indoor conditions

Monitoring data – Food types
Number of samples per commodity (EU coord + national programmes)(EU coord. + national programmes)
21

Monitoring data results: sample level
>LOQ
>MRL
<LOQ
All diti d b EU di t d22
All commodities covered by EU coordinated programme
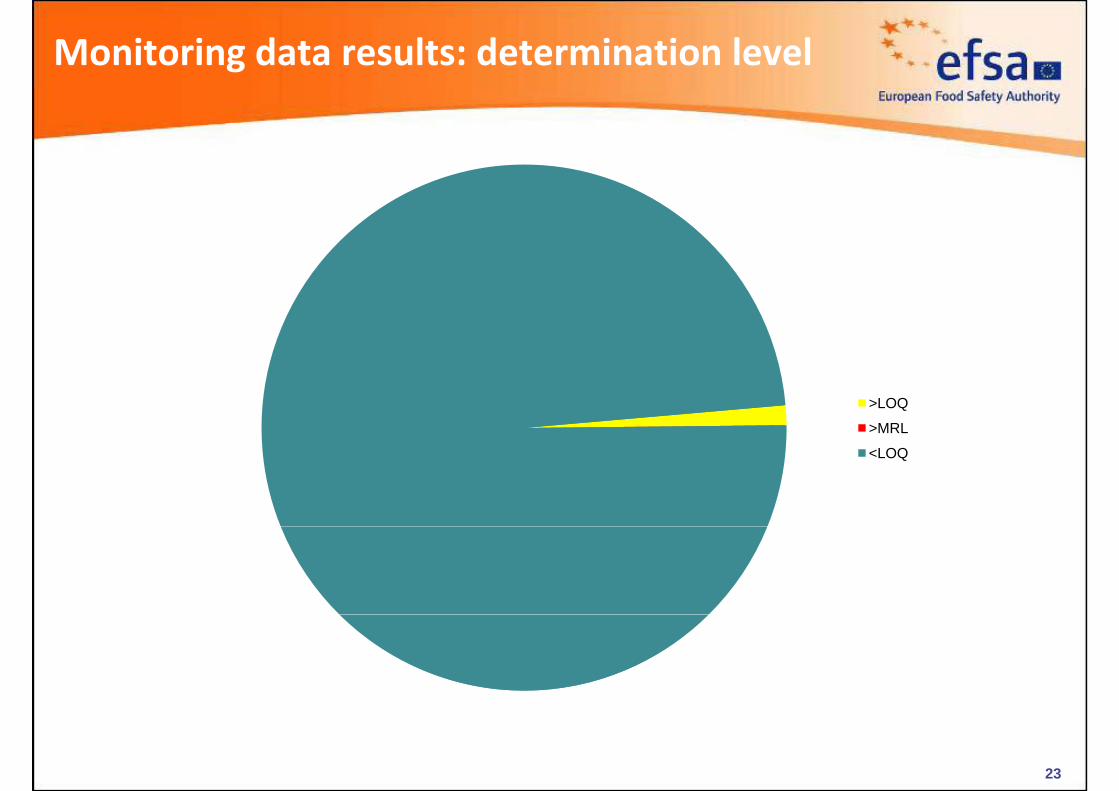
Monitoring data results: determination level
EU di t dEU-coordinated programme >LOQ
>MRL
Ca. 1.2 Mio d t i ti
<LOQ
determinations per year
23

Monitoring data results: sample level
How to handle resultsresults
exceeding the MRL ?
Illegal uses ?Illegal uses ?
>LOQ
>MRL
<LOQ
How to handle non-detects?
24Strawberries
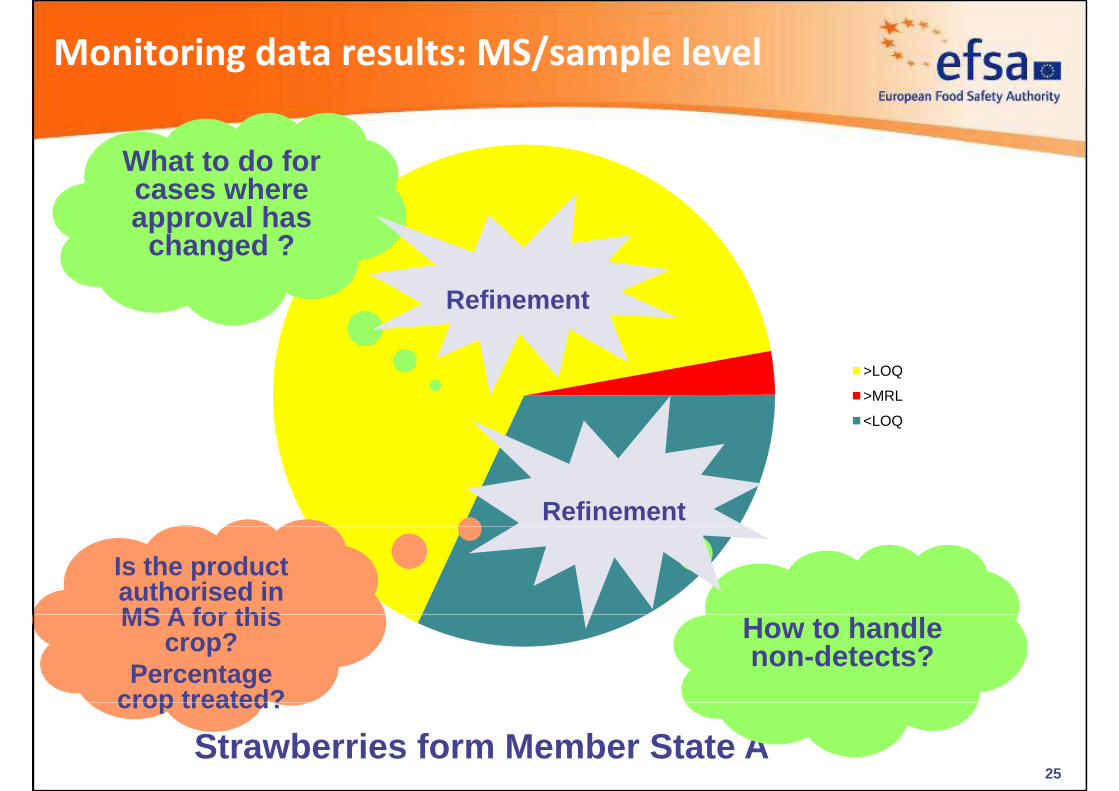
Monitoring data results: MS/sample level
What to do for cases where approval has
changed ?
Refinement
>LOQ
>MRL
<LOQ
Refinement
Is the product authorised in MS A for this How to handle
non-detects?MS A for this
crop?Percentage
crop treated?
25Strawberries form Member State A
crop treated?

LOQ of 0.01 mg/kg?
Olympic poollength 50 mwidth 25 m
Olympic pool
5 g 5 g 5 g 5 g 5 g
Depth 2.0 mp
Volume 2,500,000 LEquiv. 2500 t water
0 01 mg/kg = 25 g/2500 t0.01 mg/kg = 25 g/2500 t

Occurrence data
Which food commodities need to be considered?
Which occurrence data should be used ?• Monitoring data• Monitoring data
– EU coordinated programme
National monitoring programmes– National monitoring programmes
• Supervised field trials (in combination with market share information ?)information ?)
How to fill the gaps for pesticides not sufficiently covered by the monitoring programmes
How to trim the data ?How to trim the data ? • Non‐detects?
MRL d ?• MRL exceedences?
• Conversion factors for risk assessment ? 27

Monitoring data
Data trimming – replacement/complement occurrence dataoccurrence data
Identify need for further data collection • Authorisation status
• % crop treatmentp
• Processing data
Transparent handling of data documentation of Transparent handling of data, documentation of manipulation
Identify limitations of available data, uncertainty of estimations
28
Food consumption data
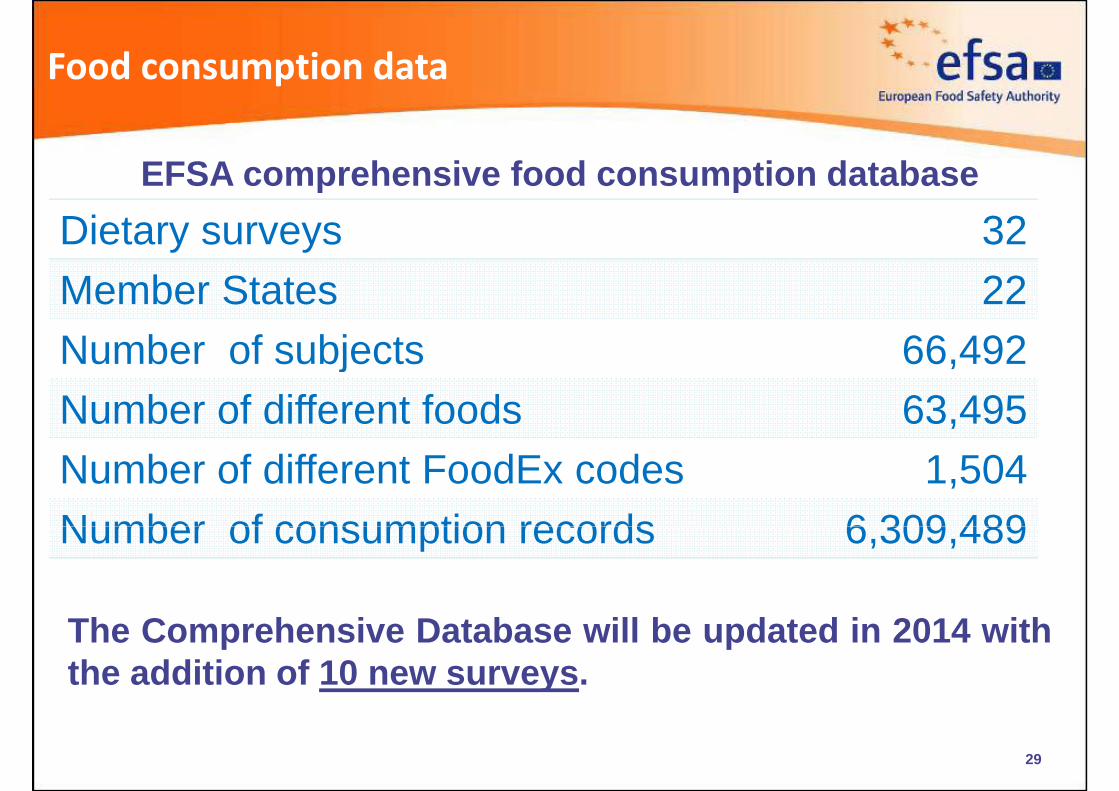
EFSA comprehensive food consumption databaseDietary surveys 32
EFSA comprehensive food consumption database
Member States 22Number of subjects 66 492Number of subjects 66,492Number of different foods 63,495Number of different FoodEx codes 1,504Number of consumption records 6 309 489Number of consumption records 6,309,489
The Comprehensive Database will be updated in 2014 withthe addition of 10 new surveys.
29
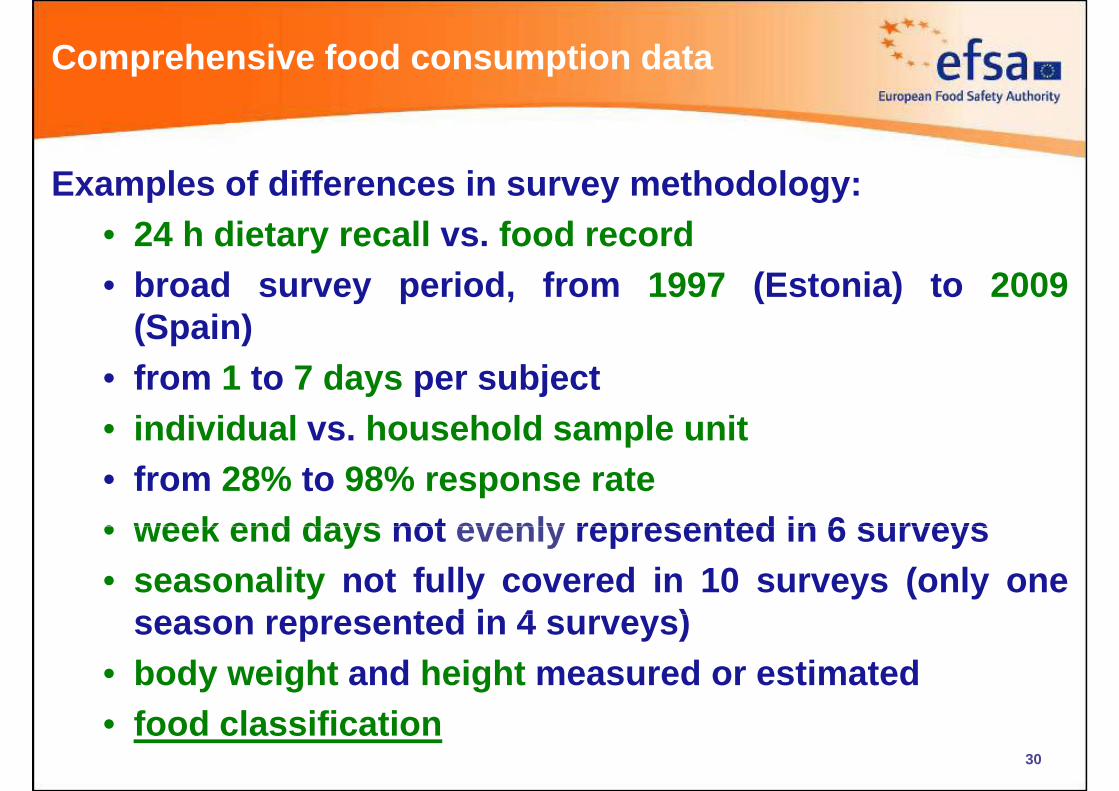
Comprehensive food consumption data
E l f diff i th d lExamples of differences in survey methodology:• 24 h dietary recall vs. food record• broad survey period, from 1997 (Estonia) to 2009
(Spain)• from 1 to 7 days per subject• individual vs. household sample unitindividual vs. household sample unit• from 28% to 98% response rate• week end days not evenly represented in 6 surveys• week end days not evenly represented in 6 surveys• seasonality not fully covered in 10 surveys (only one
t d i 4 )season represented in 4 surveys)• body weight and height measured or estimated• food classification
30
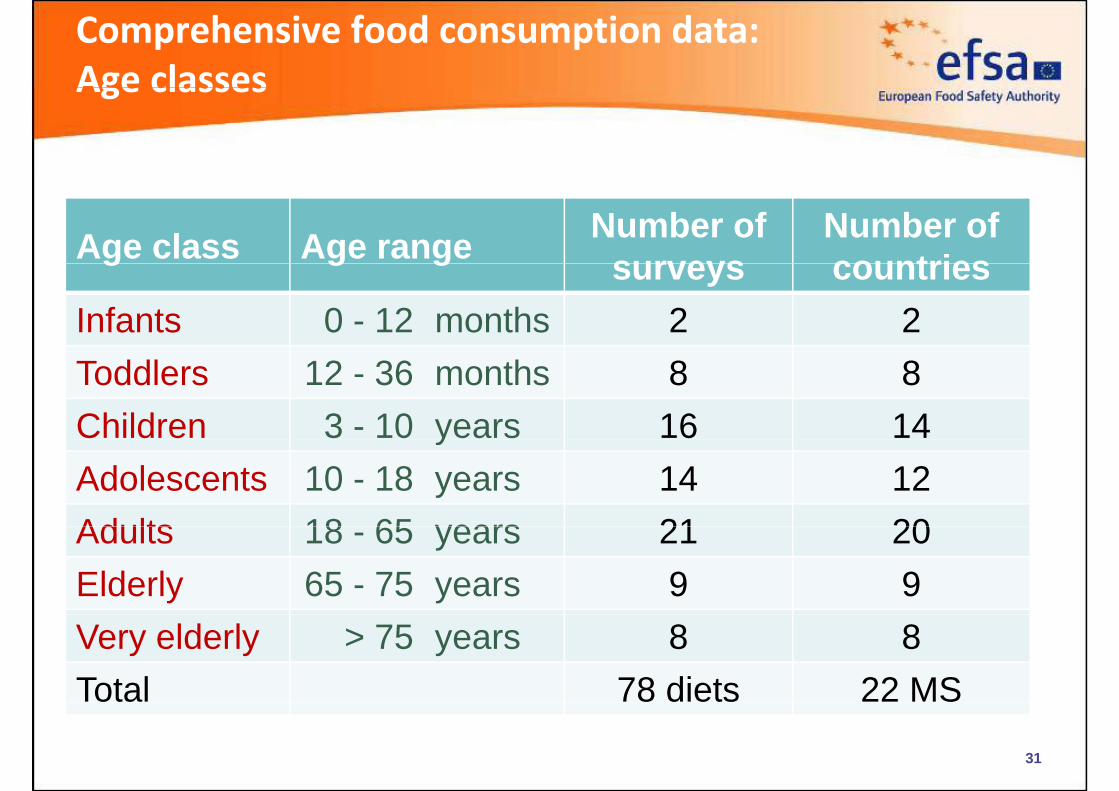
Comprehensive food consumption data: Age classesAge classes
Age class Age range Number of surveys
Number of countriesg g g surveys countries
Infants 0 - 12 months 2 2Toddlers 12 - 36 months 8 8Children 3 - 10 years 16 14yAdolescents 10 - 18 years 14 12Adults 18 65 years 21 20Adults 18 - 65 years 21 20Elderly 65 - 75 years 9 9Very elderly > 75 years 8 8Total 78 diets 22 MS
31

Do the consumption data match with the occurence data ?with the occurence data ?
Number of different FoodEx codes: 1,504,
‐ Unprocessed food
‐ Processed food edible portion
‐ Composite foodComposite food
Number of commodities for which monitoring data are available: ca. 300
- Mainly unprocessed food
- Results reported for commodity as described in Annex I of
R l ti (EC) N 396/2005 ( ith l)32
Regulation (EC) No 396/2005 (e.g. orange with peel)
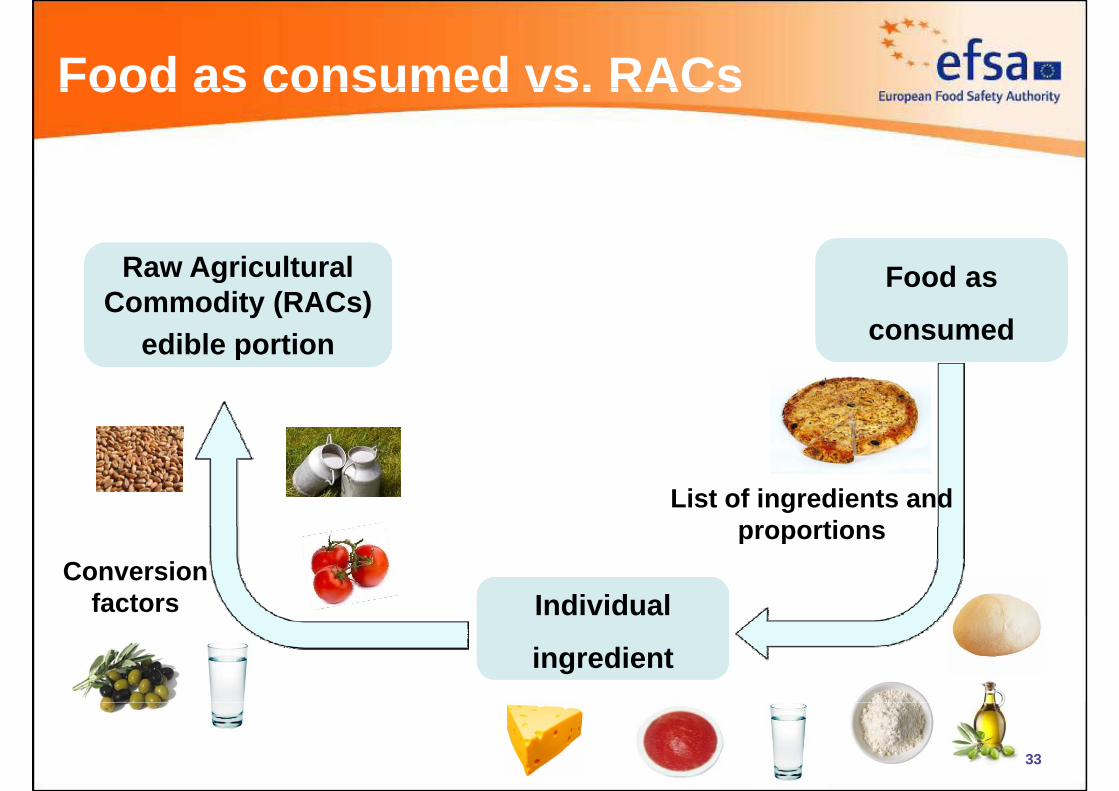
Food as consumed vs. RACsFood as consumed vs. RACs
Raw Agricultural Food as
consumed
Raw Agricultural Commodity (RACs)
edible portionedible portion
List of ingredients and proportions
Conversion factors Individual
proportions
Individual
ingredient
33
Conditions of use
• EFSA has the right to use raw individual foodconsumption data for carrying out risk assessmentsand other scientific analyses within the activitiesrelated to EFSA’s mandate.
• A formal authorization from the data provider must beA formal authorization from the data provider must berequested for any other use of the data.
34

Comprehensive food consumption data
Which are the representative diets to perform cumulative Which are the representative diets to perform cumulative exposure assessments ?
• Which age groups?• Which age groups?
• Which geographic regions?
• Specific groups (e.g. vegetarians, breastfeeding women) ?
Which recipe data to use for calculation of ingredients?
Can we use a standard conversion model to derive food consumption expressed in edible portion of raw agricultural p p p gcommodity for aggregation of the consumption data ?
How to do refined calculations for processed food ?How to do refined calculations for processed food ?
Legal questions: permission to use consumption data
35

Which tool should be used for the calculation ?
Which methodology ?Which data to use ? Which methodology ?
36Which tool can be used?

Which tool should be used for the calculation ?
Criteria
Performance of the tool:
• Number of pesticides in CAG• Number of pesticides in CAG
• Number of CAG
• Number of diets
• Number of commodities
Are the available tools capable to perform these calculations?
Tool should be accessible for risk assessors and stakeholdersTool should be accessible for risk assessors and stakeholders
Flexibility: possibility to adapt the tool for needs
Clarity documentation how the calculations are performed Clarity: documentation how the calculations are performed
Costs
37

Concluding remarks
Implementation of cumulative risk assessment is an iterative processprocess
Need to gain experience
d if h l i h h b l d Identify the relevant questions that have to be solved
Close dialogue with risk managers to address their needs• Protection goal
• Level of uncertainty
Need to be transparent how the calculations are performed ; uncertainties and limitations of calculation
Regular evaluation of guidance implementation is needed
38
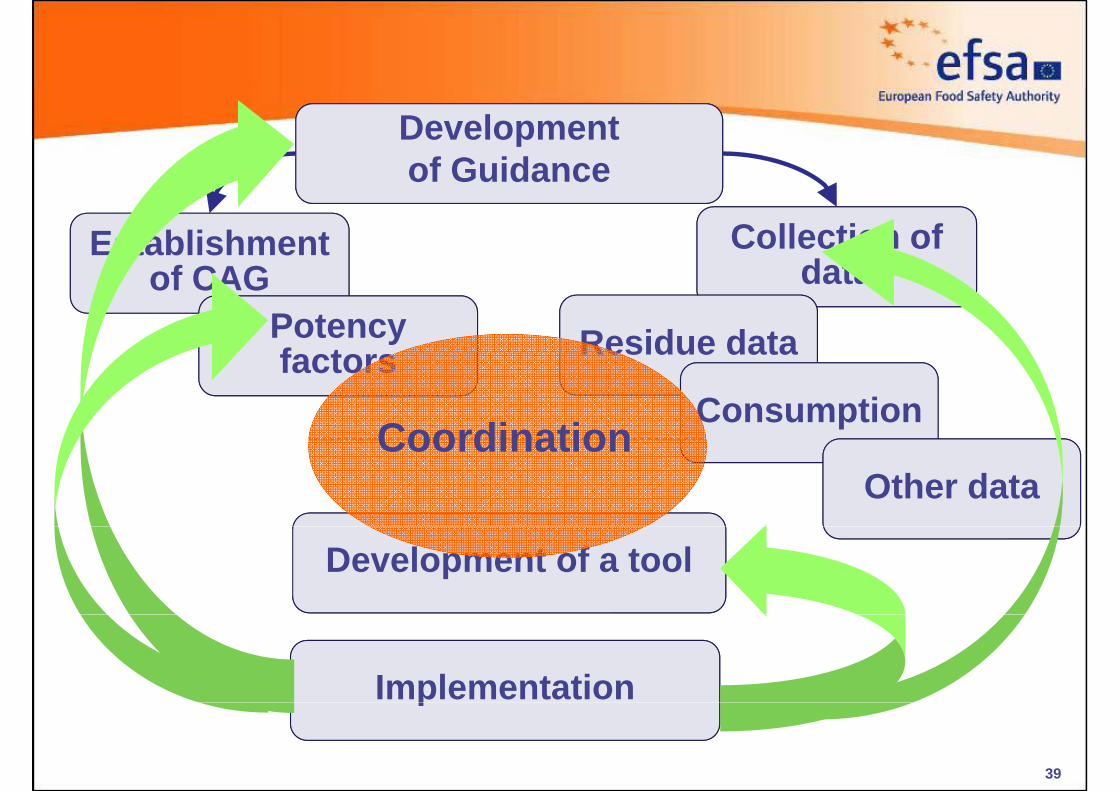
Developmentof Guidanceof Guidance
Collection of d t
Establishment data
Residue data
of CAGPotency f t Residue datafactors
ConsumptionCoordination
Other dataCoordination
Development of a tool
Implementationp
39

Thanks for your attention !
40