CPHA 2014 Estimating cumulative health risk from air ... · Estimating cumulative health risk from...
33
CPHA 2014 We live in a multi-pollutant world: Estimating cumulative health risk from air pollution in Toronto neighbourhoods Stephanie Gower Toronto Public Health September 18, 2014
Transcript of CPHA 2014 Estimating cumulative health risk from air ... · Estimating cumulative health risk from...

CPHA 2014
We live in a multi-pollutant
world:
Estimating cumulative health risk from
air pollution in Toronto
neighbourhoods
Stephanie Gower
Toronto Public Health
September 18, 2014
Conflict of Interest Declaration
I do not have any conflicts of interest to
disclose related to this presentation
Learning Objectives
1. Describe an approach for assessing cumulative health risk from mixtures of air pollutants
2. Discuss the study findings and their application to local public health policy
3. Discuss the benefits of using spatial techniques in communicating about health risk with the community

Background to the Study
History of contamination in the
neighbourhoods
Ashbridges Bay Treatment
Plant
• Largest point source in Toronto
(by mass of release)
2005 Studies
• ABTP air emission study
• Health status study
4 Source: http://worldneighborhoods.com

Concern at the neighbourhood level
5
Community concern about
• Impact of local sources
• Cumulative impacts
• Air toxics
Led to first in a series of
local air quality studies
Image: Google earth

Local Air Quality Studies: Partnership
Air Quality Modellers Model ambient
concentrations
Estimate sector
contributions to pollution
Public Health Staff Substance selection
Cumulative health impacts
calculations

Substances included in the studies
1. Acetaldehyde
2. Acrolein
3. Benzene
4. 1,3-Butadiene
5. Cadmium
6. Carbon tetrachloride
7. Chloroform
8. Chloromethane
9. Chromium
10. 1,4-Dichlorobenzene
11. 1,2-Dichloroethane
12. Dichloromethane
13. Ethylene dibromide
14. Formaldehyde
15. Lead
16. Manganese
17. Mercury
18. Nickel compounds
19. Nitrogen Oxides
20. PAHs (as B[a]Ps)
21. PM2.5
22. Tetrachloroethylene
23. Toluene
24. Trichloroethylene
25. Vinyl Chloride
26. Carbon Monoxide
27. PM10
28. Sulfur Dioxide
29. VOC (anthropogenic/Biogenic)
30. Ozone
7 Based on Substances in Toronto’s Chemtrac Program

Modelling Domains

Two Toronto Neighbourhoods (So far…)
Image: http://app.toronto.ca/wards/jsp/wards.jsp
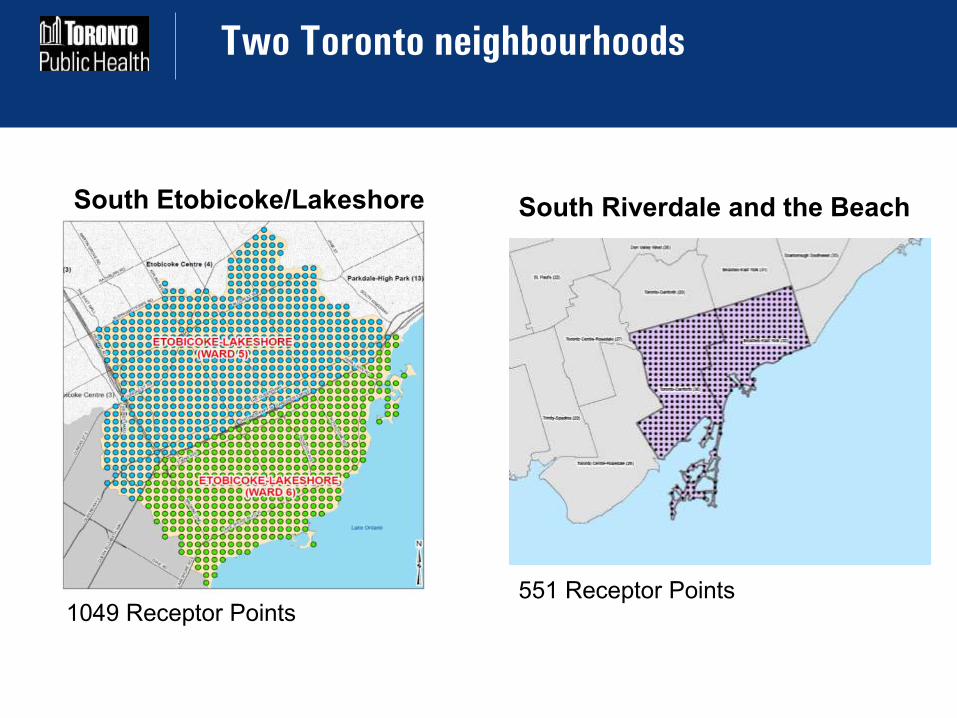
Two Toronto neighbourhoods
551 Receptor Points
South Riverdale and the Beach
1049 Receptor Points
South Etobicoke/Lakeshore

Findings: Sources of air pollution in Toronto
11
Northeast US39%
SouthernOntario
25%
16%
12%
4%
4%
Toronto36%
Residential + Commercial
Mobile
Non-Road Mobile
Industrial

Findings: NO2 as an example
12 South Riverdale and
Beaches
Etobicoke-Lakeshore

Findings: Ambient Concentrations
Most substances met Ontario’s ambient air quality criteria (AAQCs)
Five substances are present at levels that exceed air quality standards or guidelines:
• Nitrogen Oxides
• Benzene
• Benzo[a]pyrene*
• Particulate Matter < 10 microns (PM10)
• Particulate Matter < 2.5 microns (PM2.5)
13 *Results for benzo[a]pyrene require further validation
Image: Google earth

Air Pollution and Health
Estimating cumulative health impacts means considering the health risks of exposure to multiple pollutants at one time. But…
Different chemicals have different kinds of health impacts
• Eg, neurological, cancer, respiratory impacts
Different chemicals have different levels of toxicity • Some can be harmful at low levels of exposure,
while others are a concern at higher levels of exposure
14

Air Pollution and Health
Toronto Public Health assessed cumulative
health impacts for three types of substances:
• Non-carcinogens
• Carcinogens
• Criteria air pollutants
15
Key references: Department of Environmental Quality (DEQ). 2006. Portland Air Toxics Assessment. Portland,
OR. http://www.deq.state.or.us/aq/toxics/pata.htm.
Morello-Frosch, Rachel A., Tracey J. Woodruff, Daniel A. Axelrad, and Jane C. Caldwell. 2000.
Air Toxics and Health Risks in California: The Public Health Implications of Outdoor
Concentrations. Risk Analysis 20, no. 2: 273-292. doi:10.1111/0272-4332.202026.

Non-carcinogens
Non-carcinogens are toxic substances that may be associated with health effects such as
• Developmental
• Neurological
• Reproductive
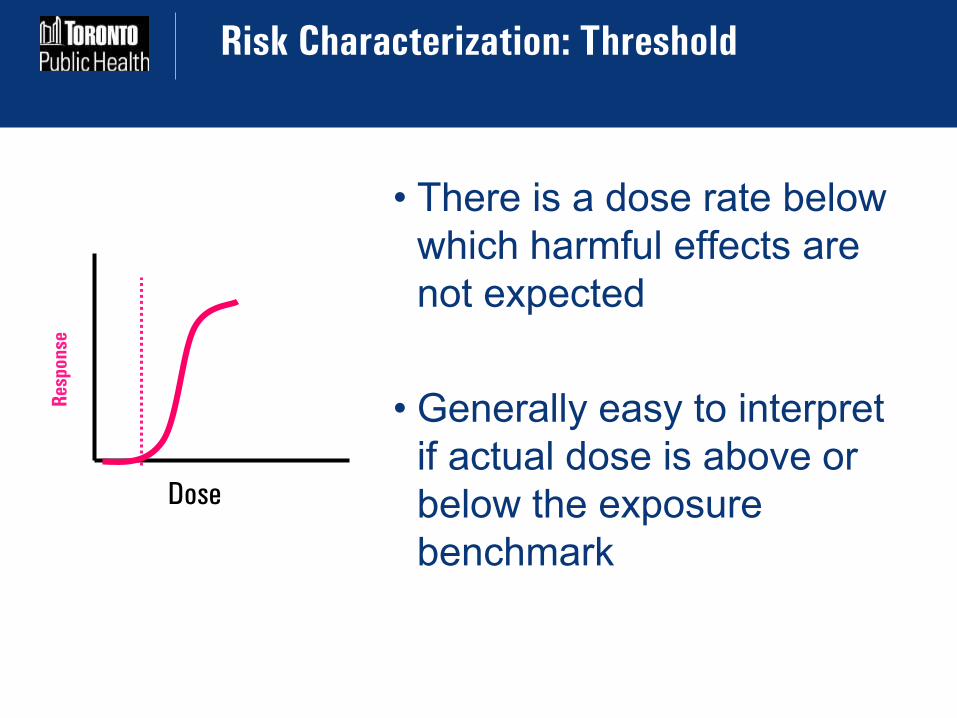
Non-carcinogens are assumed to have a threshold for effects
16
Risk Characterization: Threshold
• There is a dose rate below
which harmful effects are
not expected
• Generally easy to interpret
if actual dose is above or
below the exposure
benchmark
Dose
Res
po
nse

Cumulative Assessment: Non-cancer effects
(South Etobicoke/Lakeshore)
Cumulative
Hazard ratio
is 0.42
Below the
threshold for
concern
Average, maximum and minimum non-cancer risk values estimated
for each carcinogenic substance based on average annual
concentrations from the 1049 receptor sites.
Hazard ratios below 1 are considered acceptable

Non-carcinogens
Considered together,
the 22 non-
carcinogens included
in the study are not
expected to be present
at levels that pose a
health concern
19
Cumulative Hazard Ratio

Carcinogens
20
• Carcinogens are toxic substances that are associated with a risk of cancer
• There is some level of risk even at low levels of exposure
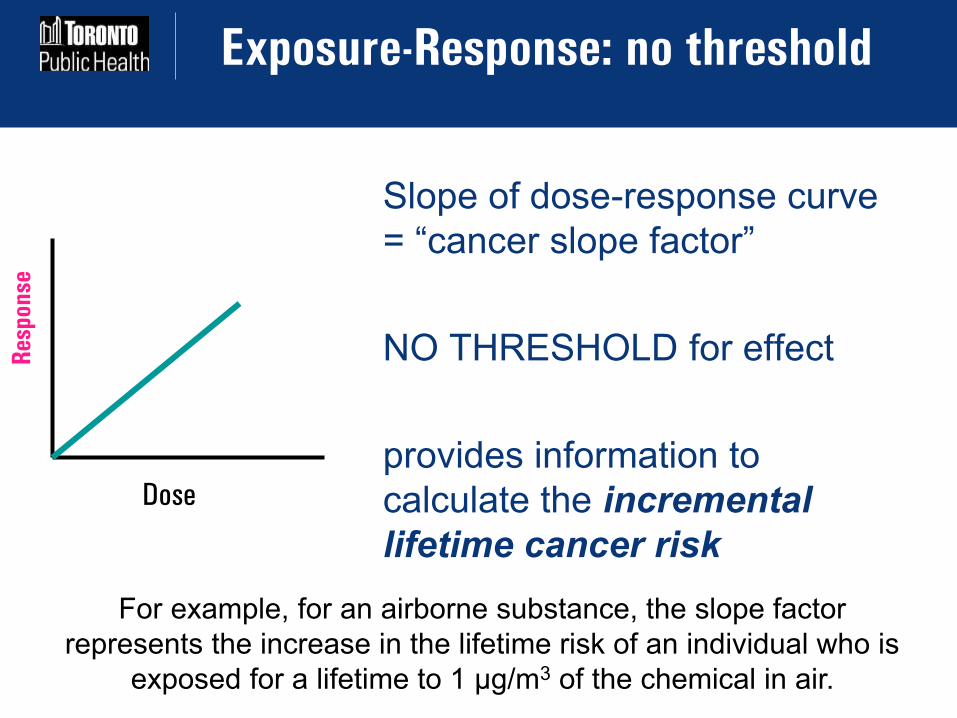
• Carcinogens are often considered not to have a threshold
Exposure-Response: no threshold
Slope of dose-response curve
= “cancer slope factor”
NO THRESHOLD for effect
provides information to
calculate the incremental
lifetime cancer risk
Dose
Res
po
nse
For example, for an airborne substance, the slope factor
represents the increase in the lifetime risk of an individual who is
exposed for a lifetime to 1 µg/m3 of the chemical in air.

Cumulative Assessment: Cancer risk
(South Riverdale/The Beach)
Average, maximum and minimum cancer risk values estimated based
on average annual concentrations from the 551 receptor sites.
1 in 1 million excess lifetime cancer risk is the de minimis risk level
Cumulative
cancer risk is
83 in 1 million
This is about 2
percent of the
total cancer
incidence rate
in Toronto
Carcinogens
23
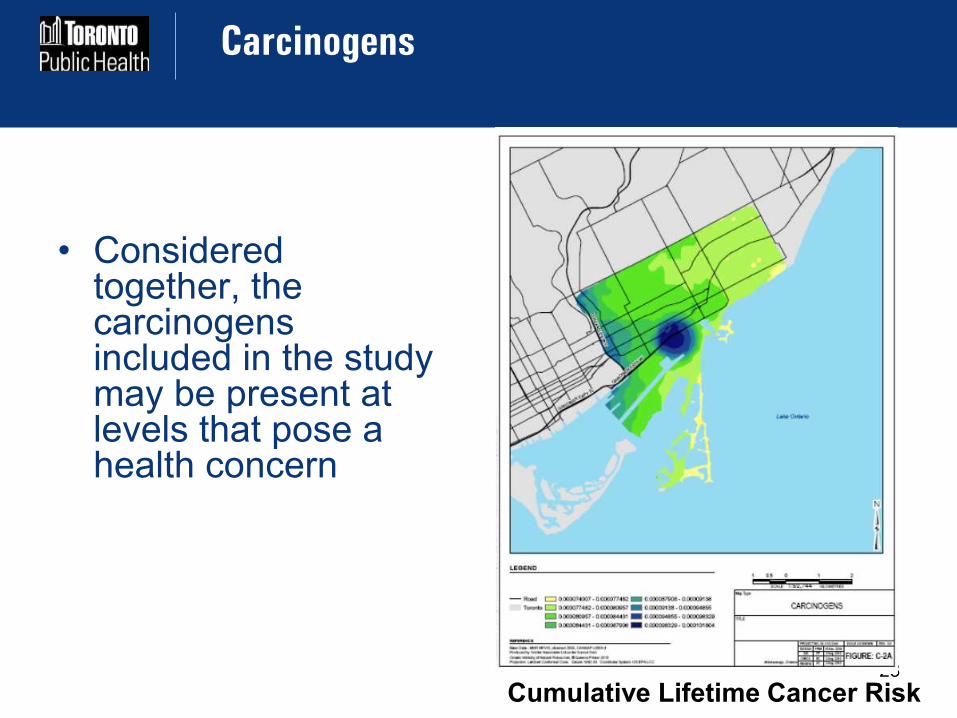
• Considered together, the carcinogens included in the study may be present at levels that pose a health concern
Cumulative Lifetime Cancer Risk

Criteria Air Contaminants
24
• Criteria Air Contaminants
are pollutants that are
associated mainly with
higher risks of heart and
lung diseases
• These effects can occur at
any level of exposure

Cumulative Assessment: Criteria Air
Contaminants (South Etobicoke/Lakeshore)
Cumulative
increased risk
of premature
death is 7.4
percent
Average, max and min risk of acute premature death estimated for each
CAC based on average annual concentrations at the 1049 receptor sites.
Any risk <10-6 (10-4 %) is considered tolerable

Criteria Air Contaminants
26
• Considered together, the criteria air contaminants may increase the risk of premature mortality by 7.4 per cent.
• This risk is consistent with Toronto Public Health’s estimate that air pollution is associated with about 1,300 premature deaths a year in Toronto.
• Transportation and industry are main sources of risk
Cumulative excess risk of premature death

Comparing the two studies completed so far
The same five substances exceed ambient air quality
criteria or standards
Health risks are of similar magnitude in both areas
In both, transportation is an important source of local
pollution and related health risk 27
Type of Health outcome
South Riverdale and Beach
Etobicoke-Lakeshore
Noncancer (immune,
neurological, development etc.) No risk No risk
Cancer 83 in one million 44 in one million* Respiratory and
Cardiovascular 8.9% increase 7.4% increase

Conclusions (1)
The non-carcinogenic contaminants occur below levels of concern to health, even when the combined exposure is taken into account
Most carcinogens are below the one in one million excess cancer risk benchmark
The cumulative risk from carcinogens is very low when compared to the total incidence rate of cancer in Toronto
Criteria air contaminants such as ozone, nitrogen dioxides, and particulate matter contribute to the burden of illness
28

Conclusions (2)
Levels of risk are consistent across the
first two studies
For many substances of greatest
concern, locally generated emissions are
mainly from transportation sources
Increased energy efficiency at home and
in businesses will also help improve local
air quality
Reductions in emissions outside Toronto
will also help improve air quality in the
city
29
© Ontario - Ontario Growth
Secretariat, Ministry of Infrastructure
Source: http://worldneighborhoods.com

Challenges
Communications: naming and explaining the categories of health risk
Input data quality: eg., concerns about background levels of B[a]P
Classic risk assessment approach vs. emerging evidence for nonthreshold mechanisms in noncarcinogens

Benefits and Next Steps
Benefits • Community Engagement
• Communication tool
• Prioritize sectors of interest for pollution prevention
• Can spur action from facilities
Next Steps
• Community Animators
• More neighbourhoods

Policy Recommendations (May, 2014)
• City Staff to investigate ways of reducing emissions from heavy trucks
• City Staff to conduct additional local air quality studies and report on ways the city is supporting residents in improving local air quality
• Request the OMOE to help with verifying findings and roadside air quality monitoring

Acknowledgments
Christopher Morgan
Ronald Macfarlane
Kate Bassil
Cecilia Fernandez
Ernestine Man
Marco Belmont
For more information:
www.toronto.ca/health/reports