Chalcopyrite Dissolution in Sulphate-Based - Simple...
82
LICENTIATE THESIS Chalcopyrite Dissolution in Sulphate-Based Leaching and Bioleaching Systems Mohammad Khoshkhoo
Transcript of Chalcopyrite Dissolution in Sulphate-Based - Simple...

LICENTIATE T H E S I S
Department of Civil, Environmental and Natural Resources EngineeringDivision of Minerals and Metallurgical Engineering
Chalcopyrite Dissolution in Sulphate-Based Leaching and Bioleaching Systems
Mohammad Khoshkhoo
ISSN 1402-1757ISBN 978-91-7439-921-9 (print)ISBN 978-91-7439-922-6 (pdf)
Luleå University of Technology 2014
Moham
mad K
hoshkhoo Chalcopyrite D
issolution in Sulphate-Based Leaching and B
ioleaching Systems
ISSN: 1402-1757 ISBN 978-91-7439-XXX-X Se i listan och fyll i siffror där kryssen är


Chalcopyrite dissolution in sulphate-based
leaching and bioleaching systems
Mohammad Khoshkhoo
Minerals and Metals Research Laboratory
Department of Civil, Environmental and Natural Resources Engineering
Luleå University of Technology
SE- 971 87 Luleå
Sweden
June 2014

Printed by Luleå University of Technology, Graphic Production 2014
ISSN 1402-1757 ISBN 978-91-7439-921-9 (print)ISBN 978-91-7439-922-6 (pdf)
Luleå 2014
www.ltu.se

I
Abstract
Chalcopyrite (CuFeS2) is the most abundant and the most economically important copper
mineral. Increasing worldwide demand for copper accompanied by exhaustion of copper
resources necessitate the development of new processes for treating lower-grade copper ores.
Heap (bio)leaching of copper oxides and secondary sulphides (covellite (CuS) and chalcocite
(Cu2S)) is a proven technology and a convenient process due to its simplicity and relatively
low capital investment requirement. As a result, the technology appears to be an attractive
process option for treatment of low-grade chalcopyrite ores as well. However, chalcopyrite is
recalcitrant to leaching and bioleaching in conventional heaps: its dissolution is slow and it
halts on a low level of copper extraction usually unacceptable for a commercial practice. Slow
dissolution of chalcopyrite is attributed to the formation of compounds on the surface of the
mineral during its oxidative dissolution, often termed “passivation”. There is still no
consensus about the nature of the passivation layer. There are, however, four proposed
candidates suggested in the literature: metal deficient sulphides, polysulphides, jarosite and
elemental sulphur. This project was aimed to further investigate the chalcopyrite dissolution
and its passivation.
In this thesis, dissolution of a pyritic and a pure chalcopyrite concentrate was studied in
stirred tank reactors in the absence and presence of moderately thermophilic microorganisms.
The abiotic experiments were performed under accurately controlled redox potential
conditions to reproduce the same oxidising conditions recorded during the bioleaching
experiments. The results showed that the microorganisms did not have any effect in the
copper leaching efficiency other than oxidation of ferrous ions to ferric ions. Comparing the
copper dissolution rates in the experiments where bulk elemental sulphur was formed with
those experiments where the elemental sulphur was oxidised to sulphate due to microbial
activity showed that the bulk elemental sulphur did not hinder the dissolution. The same
phenomenon was observed in case of bulk jarosite. Under otherwise identical leaching
conditions, the presence of bulk jarosite did not decrease the leaching efficiency compared to
those experiments were bulk jarosite was not formed.
It was also shown that surface spectroscopic methodologies such as X-ray photoelectron
spectroscopy (XPS) cannot be applied on powder leached samples due to interfering data
from the bulk precipitated species. As a result, massive natural chalcopyrite samples were

II
prepared and used in the leaching experiments for XPS measurements. Different samples in
different stages of leaching were extracted from the biotic and abiotic experiments and
analysed by XPS. Results indicated that the surface elemental sulphur was not oxidised by
bacterial activity. The data revealed that the common phases on the surface of the samples
leached biotically and abiotically for different durations were elemental sulphur and iron-
(oxy)hydroxides. The surface elemental sulphur was rigidly bound to the surface and did not
volatise in the room temperature XPS measurements. Jarosite was observed in only one
sample from the abiotic experiment, but no correlation between its presence and the slow
dissolution could be made. Other minor surface compounds such as iron-sulphate was also
observed in some samples with no contribution to the leaching behaviour. It was concluded
that a multi-component surface phase consisting of mainly sulphur and iron-hydroxides were
responsible for the slow chalcopyrite dissolution.

III
Acknowledgments
I wish to express my gratitude for the financial support from the Swedish Research Council
Formas (contract number 229-2009-657). Boliden Mineral AB is highly appreciated for
providing financial support, the mineral samples and the automatic redox potential control
system.
Prof. Åke Sandström has spent much time than what he had to on supervising me during this
project, both professionally and personally. He had showed that he is not only a great
supervisor, but also a very good friend whose office door is always open for a chat. I will
never be able to thank him properly. His support made it all much easier than it should be.
My co-supervisor Assoc. Prof. Mark Dopson is appreciated for his professionalism and
perspective. He has an extraordinary ability in making my amateur writings to something
looking professional. Andrei Shchukarev hosts me very kindly when I am at Umeå
University. He is also extremely efficient in running the XPS. Lots of credits for this work
should go to him. Lic. Andreas Lennartsson and Dr. Fredrick Engström had helped me a lot to
run the SEM. They are great colleagues and friends whose presence in the corridor (as we call
our division) makes a real difference. I am sincerely grateful to Dr. Nils-Johan Bolin and Jan-
Eric Sundkvist for the fruitful discussions I had with them time to time. Rolf Danielsson and
his team in pilotverket (Boliden) are acknowledged for the construction of the electrochemical
cell. I have to also appreciate their hospitality for the period I was working there.
On the personal front, I have a long list of people to thank. My present and former colleagues
in the division are only some of them. We had great “fikas” together and I have learnt a lot
from all of them, in one way or another. Ehsan, Roland, Saeid and many other friends who I
cannot list here, simply due to lack of space, will always be a part of my memories for the
great moments we had spent with each other during last few years. You all mean a lot to me.
And above all my family whom without I could not stand where I am standing today. This
thesis is dedicated to them.

IV
V
List of papers
I. Mohammad Khoshkhoo, Mark Dopson, Andrey Shchukarev and Åke Sandström,
“Electrochemical simulation of redox potential development in bioleaching of a pyritic
chalcopyrite concentrate”, Hydrometallurgy 144-145 (2014), p 7-14.
II. Mohammad Khoshkhoo, Mark Dopson, Andrey Shchukarev and Åke Sandström,
“Chalcopyrite leaching and bioleaching: An X-ray photoelectron spectroscopic (XPS)
investigation on the nature of hindered dissolution”, Submitted to Hydrometallurgy.
Contributions to the papers:
Running the leaching experiments, analyses, interpretation of data and writing of papers I and
II was carried out by M. Khoshkhoo. XPS analyses and peak fitting were performed by A.
Shchukarev. XPS data interpretation was done by M. Khoshkhoo with assistance of A.
Shchukarev. Å. Sandström and M. Dopson have contributed in a supervisory capacity and
assisted with revision of the manuscripts.
Published conference papers (not included in this thesis):
Mohammad Khoshkhoo, Mark Dopson and Åke Sandström, “Bioleaching and
electrochemical leaching of a pyritic chalcopyrite concentrate”, Advanced Materials Research
825 (2013), p 254-257. Presented at International Biohydrometallurgy Symposium (IBS)
2013, Antofagasta, Chile.

VI
Conference papers (not included in this thesis):
Mohammad Khoshkhoo and Åke Sandström, “An investigation on the role of
microorganisms on chalcopyrite leaching efficiency”, Presented at Mineralteknikkonferens
2014, Luleå, Sweden.
Other peer-reviewed journal papers (not included in this thesis):
Awe, S.A., Khoshkhoo, M., Kruger, P. and Sandström, Å., “Modelling and process
optimisation of antimony removal from a complex copper concentrate”, Nonferrous Metals
Society of China Transactions 22 (2012), p 675-685
Nathalie Pérez Rodríguez, Mohammad Khoshkhoo, Åke Sandström, Ilia Rodushkin, Lena
Alakangas and Björn Öhlander, “Isotopic signature of Cu and Fe during bioleaching and
electrochemical leaching of a chalcopyrite concentrate”, Submitted to International Journal of
Mineral Processing.

VII
Table of contents:
Abstract................................................................................................................................................................... I Acknowledgments ...............................................................................................................................................III List of papers .........................................................................................................................................................V 1. Introduction ................................................................................................................................................. 1
1.1. Copper ................................................................................................................................................... 1 1.2. Pyrometallurgical copper extraction...................................................................................................... 3 1.3. Hydrometallurgical copper extraction ................................................................................................... 4
1.3.1. Leaching of copper minerals......................................................................................................... 5 1.3.2. Chemistry of leaching ................................................................................................................... 7
1.4. Bioleaching............................................................................................................................................ 9 1.5. Chalcopyrite hydrometallurgy ............................................................................................................. 13
1.5.1. Chloride-based leaching processes ............................................................................................. 13 1.5.2. Sulphate-based leaching processes ............................................................................................. 15
1.6. Summary.............................................................................................................................................. 17 2. Chalcopyrite............................................................................................................................................... 19
2.1. Structure and surface ........................................................................................................................... 19 2.2. Dissolution of chalcopyrite.................................................................................................................. 20
2.2.1. Mechanisms and kinetics ............................................................................................................ 20 2.2.2. Passivation or hindered dissolution............................................................................................. 22 2.2.3. Reductive leaching...................................................................................................................... 24 2.2.4. Galvanic interactions .................................................................................................................. 25 2.2.5. Effect of microbial activity ......................................................................................................... 26
2.3. Aim and scope ..................................................................................................................................... 28 2.4. Summary.............................................................................................................................................. 28
3. Materials and methods.............................................................................................................................. 29 3.1. Materials .............................................................................................................................................. 29
3.1.1. Pyritic chalcopyrite concentrate.................................................................................................. 29 3.1.2. High-purity chalcopyrite concentrate.......................................................................................... 29 3.1.3. Massive chalcopyrite samples..................................................................................................... 30 3.1.4. Microorganisms .......................................................................................................................... 30
3.2. Bioleaching experiments ..................................................................................................................... 31 3.2.1. Bioleaching of the pyritic chalcopyrite concentrate.................................................................... 31 3.2.2. Bioleaching of the pure chalcopyrite concentrate ....................................................................... 31 3.2.3. Modelling of redox potential measurements............................................................................... 32
3.3. Abiotic experiments............................................................................................................................. 33 3.3.1. Abiotic leaching of the pyritic chalcopyrite concentrate............................................................. 33 3.3.2. Abiotic leaching of the pure chalcopyrite concentrate................................................................ 34 3.3.3. Constant redox potential experiments......................................................................................... 35
3.4. Summary of the experiments ............................................................................................................... 35 3.5. Analyses .............................................................................................................................................. 36 3.6. X-ray photoelectron spectroscopy (XPS) ............................................................................................ 37
4. Results and discussions ............................................................................................................................. 39 4.1. Ageing of chalcopyrite ........................................................................................................................ 39 4.2. Bioleaching vs. abiotic leaching experiments...................................................................................... 41
4.2.1. Redox potential control............................................................................................................... 41 4.2.2. Leaching results .......................................................................................................................... 43 4.2.3. XPS studies ................................................................................................................................. 48
5. Conclusions ................................................................................................................................................ 59 6. Future work ............................................................................................................................................... 61 7. References .................................................................................................................................................. 63

VIII

1
1. Introduction
1.1. Copper
Copper with atomic number 29 is one of the oldest metals used by humans and was used at
least 10 000 years ago in western Asia for items such as coins and ornaments. Since the
prehistoric Chalcolithic Period and Bronze Age, copper has had a prominent importance for
the development of human civilization. The discoveries and inventions by great scientists
such as Ampere, Faraday and Ohm in the late 18th and early 19th centuries in regards to
electricity and magnetism, which helped the onset of industrial revolution, propelled the
copper industry into a new era. Today, copper still plays an important role in our everyday
modern life and innovative applications for this metal are continuously being developed [1].
Amongst the physical and chemical properties of copper, its utility is mainly based on its
electrical and thermal conductivity (exceeded only by silver), its outstanding ductility and
thus excellent workability, as well as its corrosion resistance (a chemical behaviour making it
a half noble metal) [2]. Nowadays copper is used in a number of applications such as
electrical power cables, data cables, electrical equipment, automobile radiators, cooling and
refrigeration tubing, heat exchangers, artillery shell casings, small arms ammunition, water
pipes, and jewellery.
Copper is the 26th most abundant element in the accessible sphere of the earth with an average
content of 50 ppm [2]. It exists in more than 200 minerals out of which only around 20 are of
importance as copper ores. Table 1.1 summarises the most important copper minerals and
their respective copper content.
Since copper is a typical chalcophilic element, its major minerals are sulphides such as
chalcopyrite and bornite. There is no updated information on the current chalcopyrite reserves
but it is known that almost half of the total known copper in the world presents as
chalcopyrite [2, 3]. The major part of the copper produced worldwide comes from porphyry
ore deposits. In a typical porphyry ore deposit, the primary sulphides (chalcopyrite and
bornite) lie at the deepest level. Near the earth’s surface, secondary minerals are formed in
two levels. In the upper part (the oxidation zone), oxygen containing water forms copper
oxides, sub-carbonates and sub-sulphates. In the deeper cementation zone, above the primary
sulphide zone, copper bearing solution from the oxidation zone is transformed into secondary
copper sulphides; chalcocite and covellite.

2
Table 1.1. The most important copper minerals
Type Minerals Formula %Cu
Primary sulphide minerals
Hypogene sulphides Chalcopyrite CuFeS2 34.6
Bornite Cu5FeS4 63.3
Secondary minerals
Supergene sulphides Chalcocite Cu2S 79.9
Covellite CuS 66.5
Digenite Cu1.8S 78.1
Native copper Metal Cu 100.0
Carbonates Malachite CuCO3·Cu(OH)2 57.5
Azurite (CuCO3)2·Cu(OH)2 55.3
Hydroxy-silicates Chrysocolla CuO·SiO2·2H2O 36.2
Oxides Cuprite Cu2O 88.8
Tenorite CuO 79.9
Sulphates Antlerite CuSO4·2Cu(OH)2 53.7
Brochantite CuSO4·3Cu(OH)2 56.2
Open pit mining is the dominant mining method for copper production. After mining, copper
is mostly produced via pyrometallurgical methods which consist of roasting, smelting and
refining. According to International Copper Study Group (ICSG) around 60% of the total
copper produced in 2012 was via pyrometallurgical methods [1]. Beside this, 18% of the
worldwide production was from copper scrap treatment which is usually pyrometallurgical as
well. However, as the universal demand for copper is increasing and the average grade of
mined ores is decreasing; hydrometallurgical methods for economical handling of low grade
ores and wastes have been increasingly practiced during the last few years [1, 4].
Hydrometallurgical technologies stood at 22% of the copper produced in 2012. In the
following sections, a brief description of pyrometallurgical and hydrometallurgical methods is
given.

3
1.2. Pyrometallurgical copper extraction
After mining, the ore is crushed and ground. The ground ore is concentrated by flotation to a
final product that contains normally around 20-30% copper (for chalcopyrite concentrate). As
Fig. 1.1 illustrates, the dried concentrate mixed with silica and flux (as slag former) is fed to
the flash smelter where partial roasting and smelting happens simultaneously. Sulphur dioxide
gas is produced by oxidation reactions. This gas is captured and is used for production of
sulphuric acid. At around 1200° C the liquid matte and slag separate in the flash furnace. The
matte contains 50-70% copper mostly as sulphide and is tapped and transferred to the
converter for final conversion of copper sulphide to elemental copper. The product after the
converter is called blister copper and has a copper content of about 98-99%. In the next step,
the blister copper is fire refined for removal of remaining oxygen and cast into anodes for
electrorefining. The product of electrorefining is copper cathodes assaying over 99.99% of
copper [1, 2]. In addition to this flow-sheet, there can be other units for treatment of anode
slimes that contains precious metals, as well as units for treatment of scraps. Detailed unit
descriptions and different variations of processes can be found elsewhere [2, 4].
Fig. 1.1. A typical pyrometallurgical flow-sheet for copper production.

4
1.3. Hydrometallurgical copper extraction
Almost every modern hydrometallurgical method for copper extraction consists of three main
processes: leaching, solvent extraction (SX) and electrowinning (EW). Fig. 1.2 shows a
simplified hydrometallurgical flow-sheet for copper extraction.
Fig. 1.2. Simplified copper production from oxide ores by hydrometallurgy.
In the leaching stage, copper is solubilised from the ore by a lixiviant that usually contains
sulphuric acid. The presence of oxidising agents such as ferric ion and oxygen is also
necessary for sulphide mineral leaching. In Fig. 1.2, as an example, the dissolution of tenorite
is given. During the leaching stage, many other elements (e.g. Fe, Al, Co, Mn, Zn, Mg and
Ca) are leached into the solution besides copper. Pregnant leaching solution (PLS) proceeds to
SX typically with a copper concentration of 1-10 g/L. During SX, the PLS is mixed with an
organic solvent that contains a Cu-specific organic extractant (RH). Copper is selectively
loaded on the extractant leaving behind all the other impurities in the aqueous phase. The
barren aqueous phase, called raffinate, is recycled to the leaching stage to be used as the
lixiviant. Copper is then stripped from the loaded organic phase via a strong sulphuric acid
solution which is the spent electrolyte from EW. The solution after stripping contains around
45 g/L of copper and proceeds to the EW stage. The stripped organic solvent is returned to the
extraction stage. Finally in EW, copper is reduced by a DC current and is plated on cathodes
5
usually made of stainless steel. The impurity of copper cathodes is normally less than 20 ppm
[4].
1.3.1. Leaching of copper minerals
The majority of hydrometallurgically copper is produced via heap leaching. Treatment of
oxides and low-grade secondary sulphides containing up to 2% copper via heap leaching is a
convenient technology nowadays. In heap leaching the ore is crushed to a uniform size of 12-
50 mm and the fines are agglomerated in rotating drums. Acid and ferric curing (if needed) is
usually carried out during agglomeration. The ore is then stacked in large lifts normally
around 7 m high with a surface area of 0.01 up to 1 km2. Several lifts can be constructed on
top of each other to form a single large heap. The trickling sulphuric acid lixiviant solution is
applied by a series of irrigation pipes on the top of the heap. At the base, there is an
impermeable pad for collection of PLS that prevents it from penetrating to the environment.
In case of sulphide minerals, air is blown uniformly and gently through the heap via
perforated plastic pipes placed above the heap base. Important factors in maintaining an
optimum leaching condition are the permeability of the heap during its lifetime (obtained by
optimum particle size, curing and agglomeration), uniform lixiviant application without
pooling (~10 L/h/m2), a well-designed and impervious base, adequate heap temperature,
uniform air supply (in case of sulphide heaps) and heap height [4]. Selected data from a few
industrial heap leaching plants is given in Table 1.2.

6
Tabl
e 1.
2. S
elec
ted
indu
stria
l hea
p le
ach
data
from
201
0. A
dapt
ed fr
om S
chle
sing
eret
al.
(201
1) [4
].
Ope
ratio
nC
erro
Ver
de, (
Peru
)M
anto
verd
e (C
hile
)M
oren
ci (U
SA)
Spen
ce (C
hile
)
Cat
hode
Cap
acity
(t/y
)90
000
65 0
0036
6 00
020
0 00
0
H2S
O4
Con
sum
ptio
n(t/
t Cu)
1.5
3.5
NA
3.3
Pred
omin
ant C
u m
iner
als
Cha
lcoc
ite, c
ovel
lite,
ch
alco
pyrit
eB
roch
antit
e, c
hrys
ocol
laC
halc
ocite
, chr
ysoc
olla
Ata
cam
ite a
ndch
alco
cite
Ave
rage
Cu
grad
e (%
)0.
640.
760.
261.
18 a
nd1.
13
Ave
rage
leac
habl
e C
u (%
)0.
540.
670.
230.
88
Rec
over
y of
Cu
to P
LS (%
)85
8553
70–
75
Ore
size
on
heap
(mm
)d 7
0-75
< 9
.5d 9
5<
15d 8
0<
12, 3
00 (R
OM
)d 7
0-75
<12
.5, d
95<
19
Are
a un
der l
each
(m2 )
1 00
0 00
0N
A1
300
000
500
000
and
1 80
0 00
0
H2S
O4
in li
xivi
ant (
g/L)
4–
810
–12
and
12
–14
5–
813
and
8
Cu
in li
xivi
ant (
g/L)
0.3
0.3
–0.
100.
30.
3–
0.5
Irrig
atio
n ra
te (m
3 /h/m
2 )0.
012
–0.
065
0.01
20.
006
0.01
4
H2S
O4
in P
LS (g
/L)
3–
42
–3
2–
32
–4
Cu
in P
LS (g
/L)
35
–7
2–
45
–6
and
3 –
4
RO
M:(
run
of m
ine)
7
Depending on the type of copper mineral, grade, particle size, topography of the mine site,
location of the ore deposit, climate and economic conditions, other methods of leaching such
as dump leaching, vat leaching, agitation leaching and pressure oxidation leaching can be
used. Dump leaching is similar to heap leaching but is used for lower-grade ores (0.1-0.4%
Cu) without crushing or agglomeration. In vat leaching (used for oxides and carbonates), the
ore is loaded into concrete-made vats (~20 × 30 m) and the lixiviant is fed as up-flow from
the bottom of the vats. The lixiviant flows from one vat into the other and finally the PLS is
collected and sent for copper recovery. Agitation tank leaching for oxides and secondary
sulphides ground to a particle size of about 100 μm is also operated in a few plants around the
world. This method is a capital–intensive technique but copper recovery is usually very high
(100% for oxides and up to 98% for secondary sulphides). For chalcopyrite, pressure
oxidation leaching is used. Chalcopyrite is the most recalcitrant mineral in common leaching
systems of copper mentioned above. As a result extreme conditions of temperature and
pressure are needed for an economic dissolution of chalcopyrite. The leaching is carried out
on in autoclaves under high pressure of oxygen (up to 3000 kPa). High recovery of copper
(98%) at a residence time of 98 minutes is reported from Kansanshi plant in Zambia [4].
Leaching of chalcopyrite is reviewed more thoroughly in section 1.5.
1.3.2. Chemistry of leaching
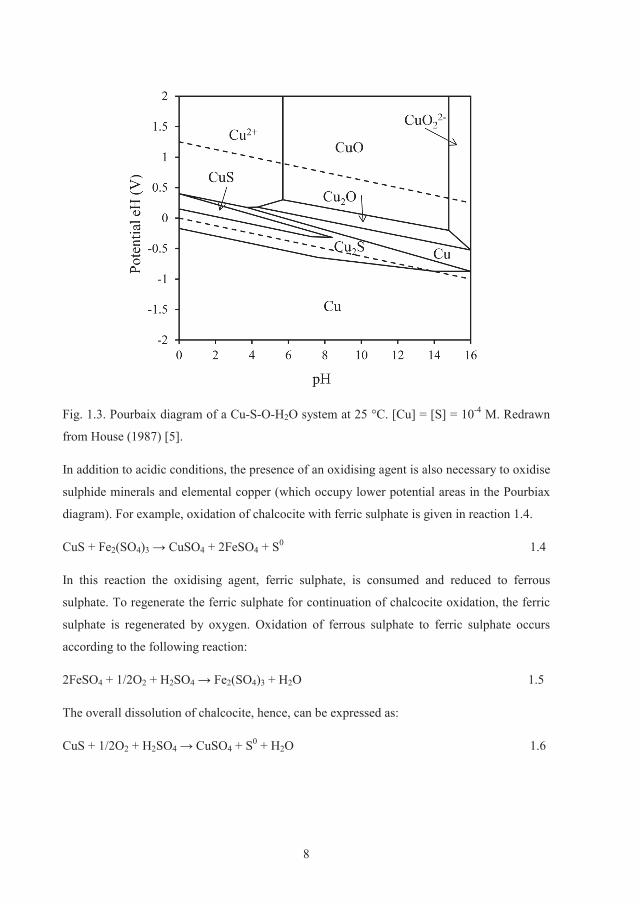
Chemistry-wise, dissolution of copper oxide minerals (including carbonates) is simpler than
the dissolution of sulphides. The reason can be found in the Pourbaix diagram of a Cu-S-O-
H2O system shown in Fig. 1.3. The stability area of copper oxides is already in the higher
oxidation potential areas of the diagram. As a result, lowering pH (via an acid) is sufficient to
solubilise copper from oxide minerals. Dissolution of azurite, malachite and cuprite with
sulphuric acid is given in reactions 1.1 to1.3, respectively.
(CuCO3)2·Cu(OH)2(s) + 3H2SO4 4(aq) + 2CO2(g) + 4H2O(l) 1.1
CuCO3·Cu(OH)2(s) + 2H2SO4(aq) 2CuSO4(aq) + CO2(g) + 3H2O(l) 1.2
Cu2O(s) + H2SO4(aq) CuSO4(aq) + Cu(s) + H2O(l) 1.3
8
Fig. 1.3. Pourbaix diagram of a Cu-S-O-H2O system at 25 °C. [Cu] = [S] = 10-4 M. Redrawn
from House (1987) [5].
In addition to acidic conditions, the presence of an oxidising agent is also necessary to oxidise
sulphide minerals and elemental copper (which occupy lower potential areas in the Pourbiax
diagram). For example, oxidation of chalcocite with ferric sulphate is given in reaction 1.4.
CuS + Fe2(SO4)3 4 + 2FeSO4 + S0 1.4
In this reaction the oxidising agent, ferric sulphate, is consumed and reduced to ferrous
sulphate. To regenerate the ferric sulphate for continuation of chalcocite oxidation, the ferric
sulphate is regenerated by oxygen. Oxidation of ferrous sulphate to ferric sulphate occurs
according to the following reaction:
2FeSO4 + 1/2O2 + H2SO4 2(SO4)3 + H2O 1.5
The overall dissolution of chalcocite, hence, can be expressed as:
CuS + 1/2O2 + H2SO4 4 + S0 + H2O 1.6

9
1.4. Bioleaching
Abiotic oxidation of iron from ferrous to ferric (reaction 1.5) is slow at low pH. The reaction
is catalysed in the presence of acidophilic microorganisms such as Acidithiobacillus
ferrooxidans. Employment of microorganisms in mining industry has opened a new category
of technology known as “biomining”. The term biomining covers both biooxidation and
bioleaching techniques. Biooxidation refers to processes where the bacterial activity is
employed to remove interfering metals from the ore, for instance in gold and silver processing
where the microorganisms activity assists in removing of the sulphide minerals prior to
cyanide leaching. However, in bioleaching the microbial activity is used directly for
extraction of the metal in question [6, 7].
The majority of the prokaryotic metal-sulphide dissolving microorganisms are acidophilic
which means they thrive at a pH range of 1-3. Microorganisms involved in biomining are a
mixture of autotrophs that are able to assimilate carbon from inorganic CO2 and heterotrophs
that assimilate organic carbon. These microorganisms gain energy by oxidising inorganic
compounds (mostly ferrous iron and/or reduced sulphur compounds) and/or organic carbon as
energy sources [8]. The microbial diversity of the acidophiles used in mining biotopes is
extremely vast with at least 11 putative prokaryotic divisions living at acid mine drainage
(AMD) sites [9].
Depending on the temperature range in which the microorganisms have their optimal growth,
they are divided into different classes namely psychrophiles (from around 4° C to 20° C),
mesophiles (20-44° C), moderate thermophiles (45-55° C) and thermophiles (>56° C).
Commonly found microorganisms in bioleaching systems collected from a number of
references [6, 8, 10-12] are listed in Table 1.3.

10
Table 1.3. Iron and sulphur oxidising acidophiles commonly found in bioleaching systems.
Mesophiles Moderate thermophiles Thermophiles
Acidithiobacillus ferrooxidans Acidimicrobium ferrooxidans Sulfolobus metallicus
Acidithiobacillus thiooxidans Acidithiobacillus caldus Metallosphaera sedula
Acidithiobacillus caldus Sulfobacillus thermosulfidooxidans
Leptospirillum ferrooxidans
Leptospirillum ferrodiazotrophum
Leptospirillum thermoferrooxidans
Leptospirillum ferriphilum
The mechanism of sulphide minerals dissolution in the presence of microorganisms has been,
and still is, the subject of much research and debate. The current definition for bioleaching
mechanisms are contact and non-contact mechanisms [7]. In contact mechanism the attached
bacteria to the mineral surface oxidise ferrous to ferric (or sulphur to sulphate) within a
biofilm and the ferric ions generated within this layer oxidise the mineral. In non-contact
mechanisms the planktonic bacteria oxidise ferrous to ferric and the ferric ions oxidise the
sulphide mineral. In both contact and non-contact mechanisms bacteria oxidise ferrous ions to
ferric. It was found that it is the type of the sulphide mineral which determines the dissolution
pathway. If the mineral is not prone to proton attack (acid-insoluble mineral) the dissolution
proceeds via the so called thiosulphate pathway [13]. In case of acid-soluble sulphides the
polysulphide pathway is applied. In both mechanisms oxygen is the primary oxidant. Fig. 1.4
schematically summarises the thiosulphate and polysulphide mechanisms.

11
Fig. 1.4. Mechanisms of sulphide mineral (MS) dissolution in presence of iron and sulphur
oxidising bacteria. Non-filled arrows indicate occurrence of intermediate sulphur compounds.
Re-drawn from Schippers and Sand (1999) [13].
In the thiosulphate pathway for acid-insoluble sulphides such as pyrite (FeS2), molybdenite
(MoS2) and tungstenite (WS2) the dissolution starts with oxidation of the mineral by ferric
ions. For instance, the dissolution of pyrite is given here:
FeS2 + 6Fe3+ + 3H2 2O32- + 7Fe2+ + 6H+ 1.7
In reaction 1.7, pyrite is oxidised and thiosulphate and ferric ions are produced. The
thiosulphate in turn is oxidised in presence of ferric ions:
S2O32- + 8Fe3+ + 5H2 4
2- + 8Fe2+ + 10H+ 1.8
The two reactions can be summarised as follow:
FeS2 + 14Fe3+ + 8H2 42- + 15Fe2+ + 16H+ 1.9
The main role of iron oxidising microorganisms such as Acidithiobacillus ferrooxidans and
Leptospirillum ferrooxidans is to catalyse the oxidation of ferrous ions to ferric ions (reaction

12
1.10) to regenerate the oxidising agent necessary for continuation of pyrite oxidation. The
presence of sulphur oxidising species such as Acidithiobacillus ferrooxidans and
Acidithiobacillus thiooxidans can increase the rate of thiosulphate oxidation (reaction 1.8).
14Fe2+ + 3.5O2 + 14H+ 3+ + 7H2O 1.10
Sum of the reactions 1.7 to 1.10 represents the overall dissolution of pyrite by the primary
oxidant which is oxygen:
FeS2 + 3.5O2 + H22+ + 2SO4
2- + 2H+ 1.11
On the other hand, acid-soluble sulphide minerals such as sphalerite (ZnS), galena (PbS),
arsenopyrite (FeAsS), chalcopyrite (CuFeS2) and hauerite (MnS2) are dissolved via the
polysulphide pathway. Dissolution of sphalerite is discussed as an example. The process starts
with attack of both ferric ions and protons on the mineral which results in formation of
hydrogen polysulphide:
8ZnS + 14Fe3+ + 2H+ 2+ + 14Fe2+ + H2S8 1.12
The polysulphide is further oxidised in presence of ferric ions to produce elemental sulphur:
H2S8 + 2Fe3+8 + 2Fe2+ + 2H+ 1.13
Reaction 1.13 explains the formation of elemental sulphur during dissolution of acid-soluble
sulphide minerals. The role of microorganisms in this pathway is again oxidation of ferrous
ions to ferric in case of iron oxidising bacteria. Sulphur oxidisers, if present, catalyse the
oxidation of elemental sulphur to regenerate sulphuric acid:
S8 + 12O2 + 8H2 42- + 16H+ 1.14
The overall dissolution with the primary oxidant (O2) in the presence of sulphur oxidising
microbes is then as follow:
ZnS + 2O2 2+ + SO4
2- 1.15
To summarise, the role of microorganisms in dissolution of sulphide minerals is to catalyse
the regeneration of the oxidising agent and sulphuric acid. There is no direct biological effect
from the microorganisms on the surface of the mineral to further increase the dissolution of
the mineral.

13
1.5. Chalcopyrite hydrometallurgy
Chalcopyrite is both the most economically important and the most difficult copper mineral to
(bio)leach. Conventional leaching processes described earlier cannot be economically used for
treatment of chalcopyrite due to its slow dissolution. As a result, the majority of copper is
produced from chalcopyrite by pyrometallurgical methods. However, some advantages of
(bio)hydrometallurgy motivate further research including: [4, 14]
Capital cost. The capital cost of smelter and refinery complexes is very high. In 2006,
the typical investment for a plant with a capacity of 300 000 tonne of copper per year
was $900 Million to $1.5 Billion (USD).
Impurity and grade tolerance. The ability of smelters for treatment of concentrates
with high content of deleterious impurities and low grade of copper is limited.
Limited availability of smelting capacity in some locations.
Transport costs. The construction of small leach plants at mine sites rather than
shipping concentrate to large, distant smelters would eliminate freight and transport
costs.
Most of the research on chalcopyrite leaching has been carried out in sulphate media, since
industrially and economically it is the most convenient option. However, leaching in other
media such as chloride-, ammonia- and nitrate-based systems have been investigated and put
into practise. Reviews of chalcopyrite hydrometallurgy in different media have been recently
published [15, 16]. In this section, some aspects of the chloride-based and sulphate-based
processes for chalcopyrite leaching are reviewed.
1.5.1. Chloride-based leaching processes
The leaching of chalcopyrite in acidic chloride media was extensively studied in the 1980s
and 1990s resulting in a number of proposed processes accompanied by suggested flowsheets
[16]. The characteristics of chloride-based leaching systems are: i. metal solubility is
significantly higher in chloride solutions; ii. redox properties in chloride-based systems are
enhanced because cupric and cuprous ions are stabilised as chloride complexes and the
Cu(I)/Cu(II) redox couple can contribute to sulphide oxidation reactions; iii. the kinetics of
chalcopyrite leaching is faster in chloride systems; iv. oxidation of elemental sulphur to
sulphuric acid is minimised and most of the generated elemental sulphur remains intact in the

14
residue; and v. pyrite reactivity in chloride systems is very low [16]. However, there are a
number of difficulties in processes based on chloride systems including: i. the corrosive
nature of chloride which necessitates the use of more expensive materials for construction of
reactors; ii. less selective leaching which results in co-leaching of multiple elements and
necessitates additional treatments and iii. the difficulty of the solvent extraction and
electrowinning high-grade copper from chloride solutions.
In chloride leaching systems, an acidic oxidising solution containing sodium or other chloride
salts is employed as lixiviant. Chloride is proposed to act as the active agent in the dissolution
process which occurs in different mechanisms depending on the composition of the chloride
lixiviant. In addition to ferric chloride which acts as oxidant for chalcopyrite, cupric chloride
(added as a reagent or generated during chalcopyrite dissolution) also participates in
chalcopyrite oxidation (reactions 1.16 and 1.17):
CuFeS2 + 4FeCl3 2 + 5FeCl2 + 2S0 1.16
CuFeS2 + 3CuCl2 2 + 2S0 1.17
Beside the reactions above, it is proposed that as the chloride concentration increases, cuprous
ion species such as CuCl2-, CuCl32-, CuCl4
3- are formed as chlorocuprate(I) ions, and the
standard potential between cupric and cuprous species also increases. This is claimed to be a
key parameter in faster chalcopyrite leaching rate, since these ions increase the critical redox
potential necessary for reductive leaching of chalcopyrite [17]. For a description of reductive
leaching see section 2.2.3.
In some chloride leaching processes such as the Hydrocopper Process, the iron is precipitated
as hematite (reaction 1.18) or goethite (reaction 1.19) by blowing oxygen into the solution,
either in the leaching stage or in a separate unit.
CuFeS2 + CuCl2 + 0.75O2 2O3 + 2S0 1.18
2FeCl2 + 4CuCl + 1.5O2 + H2 2 1.19
In the CYMET process, the produced sulphate from oxidation of elemental sulphur is rejected
along with jarosite (reaction 1.20) in the presence of KCl and NaCl in the lixiviant.
3Fe3+ + 2SO42- + 6H2O + M+
3(SO4)2(OH)6 + 6H+ 1.20

15
where M is K, Na, NH4 or H3O.
In the Intec Process, the halide complex BrCl2- is used to achieve higher redox potential
conditions for oxidation of gold. In the Sumitomo Process, chlorine gas is used in the second
stage of leaching after the chalcopyrite concentrate is partly leached in the first stage via
cupric and ferric chlorides. Employment of other compounds such as perchloric acid,
hypochlorous acid and sodium chlorate for leaching of chalcopyrite has also been reported
and reviewed [16].
Amongst all the chloride-based processes developed for chalcopyrite treatment, only the
Sumitomo process is known to be commercially utilised. The Duval CLEAR process was
active for a period of 6 years during 1980’s. Most of the other processes are either in
laboratory or pilot scale while the Intec and Hydrocopper processes are in the demonstration
stage [16].
1.5.2. Sulphate-based leaching processes
To overcome the slow dissolution of chalcopyrite in sulphate-based systems, leaching is
usually carried out at elevated temperature and pressure. Economic evaluation of the different
leaching systems indicates that sulphate-based systems are most likely the successful and the
long-term alternatives to smelting and refining [18]. The advantage of sulphate-based
leaching systems over non-sulphate systems can be summarised as follow:
It is possible to fully integrate concentrate leaching with other existing leaching
operations such as heap leaching.
The acid produced in pressure leaching can be used for heap leaching operations,
providing a credit to the concentrate leaching process.
Existing SX/EW capacity can be utilised for copper recovery.
Materials of construction are well proven for sulphate-based solution chemistry.
Generally, sulphate-based systems have comparable or superior overall economics.
Pressure leaching at high temperature
Pressure-leaching is carried out in autoclaves where the vessel is pressurized by oxygen up to
3000 kPa. The temperature is increased by steam injection on start-up. Pressure-leaching

16
processes are categorized on the basis of the process temperature. At high-temperature
processes (i.e. >200° C), leaching is rapid and more than 99% of the copper is typically
leached. All of the generated elemental sulphur is oxidised to sulphuric acid and the iron is
precipitated as hematite (reaction 1.21).
4CuFeS2 + 17O2 + 4H22+ + 4SO4
2- + 2Fe2O3 + 4H2SO4 1.21
If the generated acid cannot be made available for heap leaching or in other parts of the
flowsheet, a neutralisation stage is needed ahead of downstream processing. Oxidation of the
pyrite in the concentrate (reaction 1.22) would result in generation of ferric sulphate. The
majority of the ferric sulphate is hydrolysed to form hematite (reaction 1.23), hydronium
jarosite (reaction 1.24) or basic ferric sulphate (reaction 1.25) depending on the free acid
present in the solution [19]:
4FeS2 + 15O2 + 2H2 2(SO4)3 + 2H2SO4 1.22
Fe2(SO4)3 + 3H2 2O3 + 3H2SO4 1.23
3Fe2(SO4)3 + 14H2 3O)Fe3(SO4)2(OH)6 + 5H2SO4 1.24
Fe2(SO4)3 + 2H2 4 + H2SO4 1.25
The chemistry of copper concentrate oxidation at high-temperature and pressure are
thoroughly reviewed elsewhere [19, 20]. One of the commercial plants utilising this
technology is at Kansanshi, Zambia (30 000 t/y Cu) that commenced operations in 2007 [4].
The feed contains 70-80 wt% chalcopyrite and 3-10% chalcocite with a copper content of 23-
27 wt% and a particle size of d80 75 μm. Two carbon steel autoclaves (26.8 m in length and
3.35 m in diameter) each containing five compartments are operated at a total pressure of
3000 kPa and oxygen over pressure of 800 kPa. The solid content of the slurry is 45-50
%(wt/vol). The lixiviant contains 64-66 g/L sulphuric acid, <1.3 g/L copper and <3 g/L iron.
99% of the total copper is recovered into the PLS within 98 minutes of leaching time. The
PLS contains around 59 g/L sulphuric acid, 20-25 g/L copper and 7-12 g/L iron. The
predominant compound in the residue is basic ferric sulphate.
Pressure leaching at medium temperatures
Pressure leaching at medium temperatures (140-180° C) is also possible and has the
advantage of lower consumption of oxygen with less production of sulphuric acid [18].
17
However, due to higher viscosity of the molten elemental sulphur at this temperature range,
surfactants and other additives might be needed to avoid coverage of the chalcopyrite surface
by molten sulphur [4]. A commercial operation of medium temperature leaching was
demonstrated and commissioned with a capacity of 67 000 t/y copper in 2007 at Morenci,
Arizona [21].
Leaching at low temperature and atmospheric pressure
At atmospheric pressure, a process was developed at the University of British Columbia
(UBC) that takes advantage of the galvanic couple between pyrite and chalcopyrite to ensure
rapid and complete oxidation of chalcopyrite under mild conditions in acidic iron sulphate
solution [22]. There is no need for microbes, ultra-fine grinding or chemical additives such as
chloride, nitrate or surfactants. Copper recovery of 98% is achieved at 80° C with 4 hours of
leaching time. More than 95% of the total sulphur remains as elemental sulphur in the residue,
so the level of oxygen consumption is near the theoretical minimum for chalcopyrite
oxidation. The process is called GalvanoxTM and is based on the galvanic effect between
contacting minerals with different rest potentials (see section 2.2.4.). GalvanoxTM has been
demonstrated in pilot scale and preliminary economic calculations show a promising internal
rate of return (IRR) exceeding 20% [22].
1.6. Summary
In this chapter the important aspects of copper production were introduced. The main
production methods were concisely described and the chemistry of leaching systems was
presented. The most widely accepted mechanism in which the bacterial action assists the
dissolution of sulphide minerals was also given. The next chapter deals more specifically with
chalcopyrite. The available knowledge with regard to its dissolution in aqueous systems will
be reviewed briefly and the scope of the thesis will be introduced.

18
19
2. Chalcopyrite
2.1. Structure and surface
Chalcopyrite (CuFeS2) is a covalent copper sulphide with a similar crystal structure to that of
sphalerite. The difference is that the c-parameter of the tetragonal unit cell of chalcopyrite is
about twice the length of the unit cell of sphalerite. Each unit cell of chalcopyrite contains
four copper, four iron and eight sulphur atoms. Each sulphur atom is coordinated by a
tetrahedron of two copper and two iron atoms. The metal atoms are coordinated by a
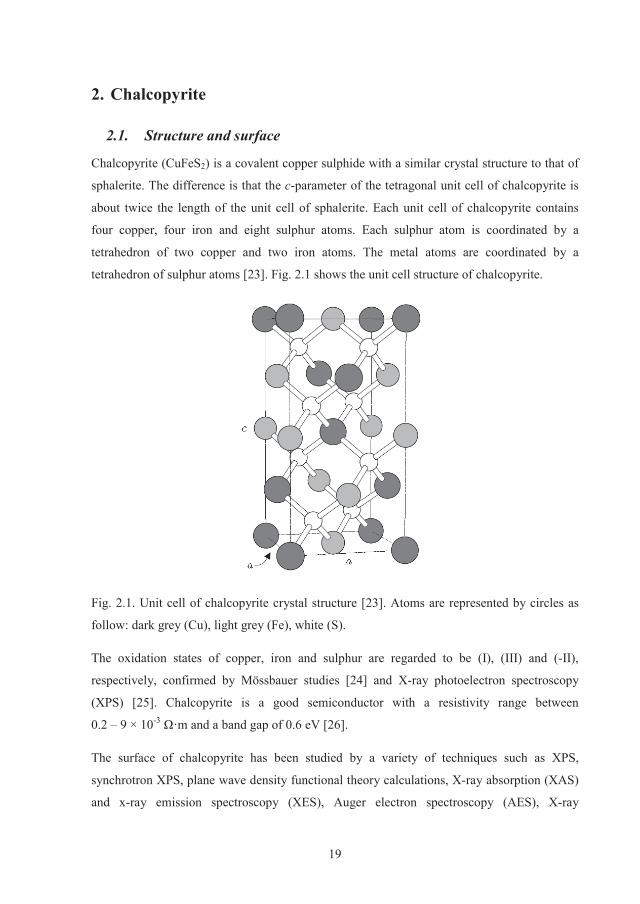
tetrahedron of sulphur atoms [23]. Fig. 2.1 shows the unit cell structure of chalcopyrite.
Fig. 2.1. Unit cell of chalcopyrite crystal structure [23]. Atoms are represented by circles as
follow: dark grey (Cu), light grey (Fe), white (S).
The oxidation states of copper, iron and sulphur are regarded to be (I), (III) and (-II),
respectively, confirmed by Mössbauer studies [24] and X-ray photoelectron spectroscopy
(XPS) [25]. Chalcopyrite is a good semiconductor with a resistivity range between
0.2 – 9 × 10⁻³ [26].
The surface of chalcopyrite has been studied by a variety of techniques such as XPS,
synchrotron XPS, plane wave density functional theory calculations, X-ray absorption (XAS)
and x-ray emission spectroscopy (XES), Auger electron spectroscopy (AES), X-ray

20
absorption near-edge structure (XANES) and synchrotron scanning photoemission
microscopy (SPEM) [27]. It was found that the chalcopyrite surface shows a different
characteristic from the bulk structure. The surface of chalcopyrite freshly fractured under
anaerobic conditions undergoes a reconstruction process in which a pyritic-type layer is
formed on the surface [25]. It is also shown that exposure to air and moisture results in
formation of oxidised species such as iron-(oxy)hydroxides and iron-sulphates on the surface
[28].
2.2. Dissolution of chalcopyrite
2.2.1. Mechanisms and kinetics
There is still no consensus about the dissolution mechanism of chalcopyrite. The polysulphide
mechanisms described in section 1.4 is considered as the most widely accepted mechanism
[29]. The valence band of chalcopyrite is derived from orbitals of metal atoms and sulphur.
Hence, chalcopyrite is an acid soluble sulphide and the polysulphide mechanism applies.
According to this mechanism, chalcopyrite is initially attacked by protons, releasing metallic
ions and hydrogen sulphide (reaction 2.1). Hydrogen sulphide is oxidised by ferric ions
(reaction 2.2) to produce H2S*+ radicals:
CuFeS2 + 4H+ 2+ + Fe2+ + 2H2S 2.1
H2S + Fe3+ 2+ + H2S*+ 2.2
The H2S*+ radicals decompose in water to form HS* radicals (reaction 2.3) which further react
with each other to generate hydrogen disulphide (reaction 2.4):
H2S*+ + H2 3O+ + HS* 2.3
2HS*2S2 2.4
The disulphide may further react with ferric ions or another HS* radical:
H2S2 + Fe3+2S2
*+ + Fe2+ 2.5
H2S2 + HS*2
* + H2S 2.6
21
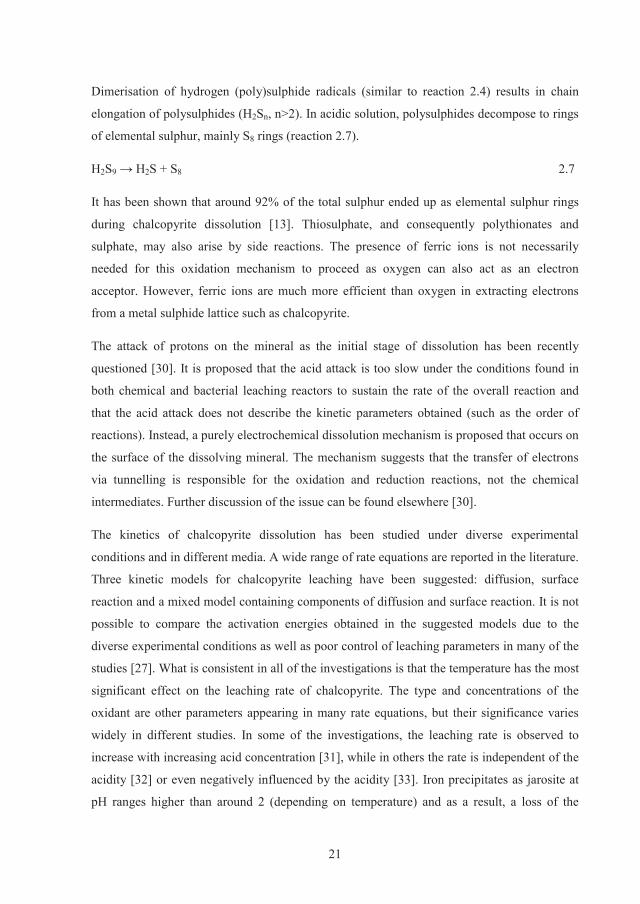
Dimerisation of hydrogen (poly)sulphide radicals (similar to reaction 2.4) results in chain
elongation of polysulphides (H2Sn, n>2). In acidic solution, polysulphides decompose to rings
of elemental sulphur, mainly S8 rings (reaction 2.7).
H2S9 2S + S8 2.7
It has been shown that around 92% of the total sulphur ended up as elemental sulphur rings
during chalcopyrite dissolution [13]. Thiosulphate, and consequently polythionates and
sulphate, may also arise by side reactions. The presence of ferric ions is not necessarily
needed for this oxidation mechanism to proceed as oxygen can also act as an electron
acceptor. However, ferric ions are much more efficient than oxygen in extracting electrons
from a metal sulphide lattice such as chalcopyrite.
The attack of protons on the mineral as the initial stage of dissolution has been recently
questioned [30]. It is proposed that the acid attack is too slow under the conditions found in
both chemical and bacterial leaching reactors to sustain the rate of the overall reaction and
that the acid attack does not describe the kinetic parameters obtained (such as the order of
reactions). Instead, a purely electrochemical dissolution mechanism is proposed that occurs on
the surface of the dissolving mineral. The mechanism suggests that the transfer of electrons
via tunnelling is responsible for the oxidation and reduction reactions, not the chemical
intermediates. Further discussion of the issue can be found elsewhere [30].
The kinetics of chalcopyrite dissolution has been studied under diverse experimental
conditions and in different media. A wide range of rate equations are reported in the literature.
Three kinetic models for chalcopyrite leaching have been suggested: diffusion, surface
reaction and a mixed model containing components of diffusion and surface reaction. It is not
possible to compare the activation energies obtained in the suggested models due to the
diverse experimental conditions as well as poor control of leaching parameters in many of the
studies [27]. What is consistent in all of the investigations is that the temperature has the most
significant effect on the leaching rate of chalcopyrite. The type and concentrations of the
oxidant are other parameters appearing in many rate equations, but their significance varies
widely in different studies. In some of the investigations, the leaching rate is observed to
increase with increasing acid concentration [31], while in others the rate is independent of the
acidity [32] or even negatively influenced by the acidity [33]. Iron precipitates as jarosite at
pH ranges higher than around 2 (depending on temperature) and as a result, a loss of the

22
oxidant occurs which might affect the dissolution rate. Hence, the assumption that acidity
directly influences the leaching rate might be incorrect since the increased acidity also
increases the solubility of the oxidant (ferric ions). Other parameters such as particle size,
aeration, stirring speed, diffusion, etc. are amongst other factors occasionally observed in
some of the investigations [27]. What is clear is that the kinetic studies are still an open
research field for chalcopyrite dissolution and development of reliable models capable of
describing all the observations in regards to different parameters is much needed.
2.2.2. Passivation or hindered dissolution
Generally, the dissolution rate in acidic ferric chloride media is linear while the rate in acidic
ferric sulphate media commonly presents a parabolic behaviour [29]. In ferric sulphate
medium the dissolution is controlled via diffusion through a layer (or layers) formed on the
chalcopyrite surface. Electrochemical studies show typical passive-active behaviour of
chalcopyrite dissolution in sulphate medium, confirming the presence of a coating which
decreases the speed of electron transfer [34]. This phenomenon is generally termed
“passivation” and is broadly considered to be responsible for the slow dissolution rate of
chalcopyrite. The term “passivation” in its classical context that comes from corrosion science
is usually understood as the formation of a surface film (usually a few atomic layers thick),
that completely inhibits further corrosion, such as formation of alumina on aluminium that
protects the rest of the metal from further oxidation. However, complete passivation of
chalcopyrite is not always observed. In many investigations, a slow linear increase of copper
dissolution over time is reported. In order to distinguish between these two phenomena, the
term “hindered dissolution” is suggested for the latter case [35].
A large number of investigations using surface analytical methods and/or electrochemical
investigations have been focused on identification of the layer responsible for passivation or
hindered dissolution. However, the nature of the layer(s) is still debated. Four candidates have
been proposed: metal-deficient sulphides, polysulphides, jarosite and elemental sulphur [29,
35]. Here, a brief review of these candidates is given:
Metal-deficient sulphides
Metal-deficient sulphide is considered as a transformed surface phase, unlike the other
candidates which are products of either chalcopyrite dissolution, or precipitation from the
resulting solution. It is usually observed that dissolution of chalcopyrite, especially at early

23
stages of leaching, is non-stoichiometric: more iron is released than copper to an extent of
Fe:Cu ratio of ~2:1 to as high as 4:1 or 5:1, and an iron-depleted phase rich in copper remains
on the surface. By surface spectrometry techniques and electrochemistry investigations, a
number of compounds such as Cu0.8S2 [36, 37], CuS2* [38] , Cu1-rFe1-sS2-t [39], amorphous
metal sulphides [40] and an alloyed mix of Cu2S, FeS and FeS2 [41] are suggested to impede
dissolution. In a review of the available data, the methodologies and data interpretation of
these works were critically examined, and the physical reality of the metal deficient sulphides
as a cause of passivation or hindered dissolution was questioned [35].
Polysulphides
Polysulphides, with a general formula of (Fe)(Cu)Sn (2<n<6), are basically the same as metal-
deficient sulphides: “polysulphide” emphasises a sulphur-rich remaining phase while “metal-
deficient sulphide” emphasises the removal of metal ions [42]. It has recently been suggested
that their formation and stability in chalcopyrite dissolution systems is highly unlikely [35]. In
addition, there is no evidence correlating the presence of polysulphides to the kinetics of the
dissolution and the slow reaction rate of chalcopyrite [30, 42].
Elemental Sulphur
Elemental sulphur is considered a systematic product of chalcopyrite oxidation in acidic ferric
solution (reactions 2.1 to 2.7). In bacterial systems where sulphur oxidising microbes are
present, sulphur is oxidised to sulphate according to reaction 1.14. But in abiotic leaching
systems at atmospheric pressure most of the generated elemental sulphur remains unoxidised
(see the mechanism described earlier in this section). Some investigations find a layer of bulk
elemental sulphur around the dissolving chalcopyrite particles and conclude that it is the mass
transport through this layer which inhibits dissolution [43-45]. Other investigations have
observed the presence of elemental sulphur but dismissed it as a passivation cause [46, 47]. It
seems that the morphology of the generated sulphur (dense or porous) and its coverage and
continuity around the mineral particles has an effect on whether the bulk elemental sulphur
impacts the dissolution rate or not. Usually when the redox potential of the system is high
(around 600 mV vs. Ag/AgCl) the produced bulk sulphur is dispersed instead of forming a
cloud around the particles [48, 49]. In these cases it has been found that the presence of bulk
elemental sulphur does not impede the dissolution [50]. Therefore, a distinction between the
bulk sulphur and surface sulphur should be made. Surface elemental sulphur cannot be found
using conventional microprobe analyses. It is only surface sensitive analyses such as XPS
24
which are able to detect the surface phases. Most of the XPS investigations detect elemental
sulphur as one of the surface species. However, only seeing a phase on the surface does not
necessarily mean that it also affects the dissolution. Hence, surface analytical methods should
be accompanied by proper kinetic studies to correlate the observed surface species to the
leaching behaviour. The case of elemental sulphur as a passivation candidate still remains
open and needs more investigation.
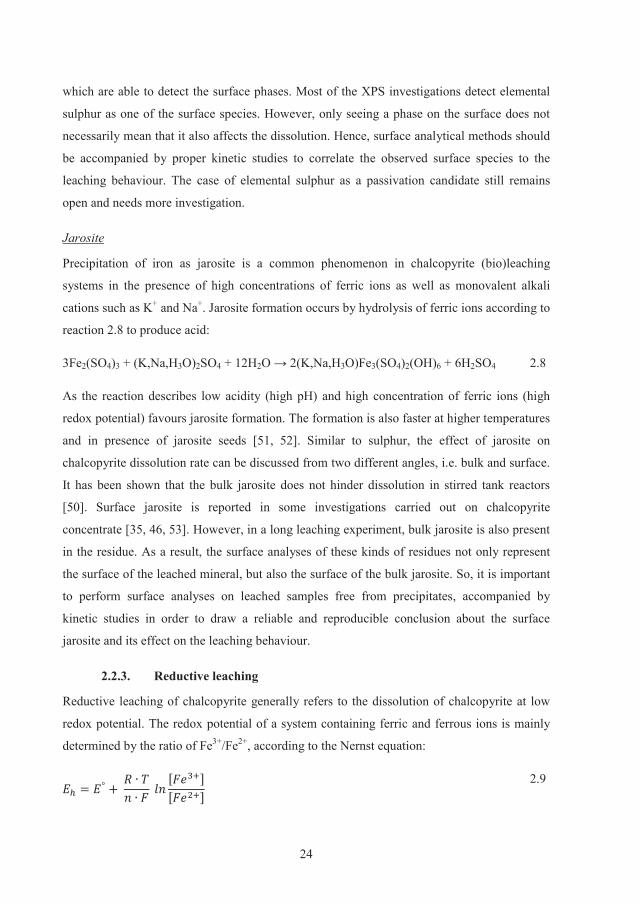
Jarosite
Precipitation of iron as jarosite is a common phenomenon in chalcopyrite (bio)leaching
systems in the presence of high concentrations of ferric ions as well as monovalent alkali
cations such as K+ and Na+. Jarosite formation occurs by hydrolysis of ferric ions according to
reaction 2.8 to produce acid:
3Fe2(SO4)3 + (K,Na,H3O)2SO4 + 12H2 3O)Fe3(SO4)2(OH)6 + 6H2SO4 2.8
As the reaction describes low acidity (high pH) and high concentration of ferric ions (high
redox potential) favours jarosite formation. The formation is also faster at higher temperatures
and in presence of jarosite seeds [51, 52]. Similar to sulphur, the effect of jarosite on
chalcopyrite dissolution rate can be discussed from two different angles, i.e. bulk and surface.
It has been shown that the bulk jarosite does not hinder dissolution in stirred tank reactors
[50]. Surface jarosite is reported in some investigations carried out on chalcopyrite
concentrate [35, 46, 53]. However, in a long leaching experiment, bulk jarosite is also present
in the residue. As a result, the surface analyses of these kinds of residues not only represent
the surface of the leached mineral, but also the surface of the bulk jarosite. So, it is important
to perform surface analyses on leached samples free from precipitates, accompanied by
kinetic studies in order to draw a reliable and reproducible conclusion about the surface
jarosite and its effect on the leaching behaviour.
2.2.3. Reductive leaching
Reductive leaching of chalcopyrite generally refers to the dissolution of chalcopyrite at low
redox potential. The redox potential of a system containing ferric and ferrous ions is mainly
determined by the ratio of Fe3+/Fe2+, according to the Nernst equation:
= ° + [ ][ ] 2.9

25
where E° is the standard equilibrium potential, R is the gas constant, n is the charge number
and F is the Faraday’s constant. From chalcopyrite oxidation by ferric ions (reaction 2.10), it
seems that higher ferric to ferrous ratios, i.e. higher redox potential, should favour the
dissolution. This is not what is observed and instead, dissolution increases with increasing
redox potential and then decreases after a critical potential is reached [54]. A two-step model
was proposed to support faster chalcopyrite leaching rates at lower oxidation potentials [55-
58]. The model suggests that in the first step chalcopyrite is reduced by ferrous ions in the
presence of cupric ions to form chalcocite (reaction 2.11). In the second step, chalcocite
which is more amenable to leaching than chalcopyrite is oxidised by ferric ions or oxygen
according to reactions 2.12 and 2.13.
CuFeS2 + 4Fe3+ 2+ + 5Fe2+ + 2S0 2.10
CuFeS2 + 3Cu2+ + 3Fe2+2S + 4Fe3+ 2.11
2Cu2S + 8Fe3+ 2+ + 2S0 + 8Fe2+ 2.12
2Cu2S + 8H+ + 2O22+ + 2S0 + 4H2O 2.13
This model suggests that the redox potential has to be low enough for reduction of
chalcopyrite in the first step and high enough for oxidation of chalcocite in the second step.
Consequently, there is a range of oxidation potential in which the chalcopyrite dissolution rate
is optimal [46]. Reported ranges vary widely but many studies place the optimum leaching
between 600 and 680 mV vs. SHE [59] although critical points as high as 680 to 720 mV vs.
SHE have been reported [22]. The wide variation in the optimum redox potential window is
dependent on the copper concentrate and arises due to differences in crystal orientation,
impurity content and mineral stoichiometry [60].
2.2.4. Galvanic interactions
The effect of different impurities on the dissolution of chalcopyrite is a relatively old
observation that goes back to 1973 [61]. It was shown for several sulphide minerals that when
they are in contact, the mineral with higher rest potential acts as a cathode and is preserved,
while the mineral with lower rest potential acts as an anode and is oxidised [62]. For
chalcopyrite, pyrite is one of the minerals which give rise to increased chalcopyrite
dissolution rate. Pyrite with higher rest potential acts as cathode and chalcopyrite with a lower
rest potential serves as anode and is oxidised. The overall reaction of chalcopyrite oxidation

26
via ferric ion (reaction 2.10) can be expressed as two half-cell reactions; an anodic half-cell
reaction (reaction 2.14) and a cathodic half-cell reaction (reaction 2.15).
CuFeS2 2+ + Fe2+ + 2S0 + 4e- 2.14
4Fe3+ + 4e- 2+ 2.15
The limiting step is reported to be the reduction of ferric iron (reaction 2.15) which is slow on
the surface of chalcopyrite [22, 60]. When pyrite and chalcopyrite are in contact, the iron
reduction takes place on the pyrite surface which is much faster (Fig. 2.2). As a result the
dissolution rate is increased. This principle has been used in developing the GalvanoxTM
process, described in section 1.5.2.
Fig. 2.2. Schematic diagram of galvanically-assisted electrochemical leaching, redrawn from
Dixon 2008 [22].
2.2.5. Effect of microbial activity
The bacterial leaching mechanism described in section 1.4 should also be valid for
bacterially-assisted leaching of chalcopyrite: ferric iron oxidises the chalcopyrite while
bacterial activity regenerates the ferric iron and oxidises the elemental sulphur to sulphuric
acid. However, there are studies showing that the presence of microorganisms in chalcopyrite
leaching systems can be either detrimental [63, 64] or beneficial [65] to the dissolution rate.
Those works that conclude a detrimental effect base their discussion on increased redox
potential of the system due to the bacterial activity: iron oxidising bacteria increase the redox
potential to values usually higher than that of the optimum window range of chalcopyrite
leaching (see section 2.2.3) and as a result a slower dissolution is observed. The investigations
supporting enhanced dissolution in the presence of microorganisms base their conclusions on
comparing the leaching rate in the presence and absence of microorganisms: almost all of
them observe a higher leaching rate with microorganisms. However, what seems to be
neglected in these studies is the significant effect of the system redox potential. Redox

27
potential is possibly the most important factor affecting chalcopyrite leaching [46, 54-58].
Oxidation of chalcopyrite (reaction 2.10), and regeneration of ferric ions catalysed by
microbial activity (reaction 1.10) both alter the ratio of Fe3+/Fe2+ and, consequently, the redox
potential (reaction 2.9). Thus, the solution redox potential is an outcome of the microbial
activity as well as the mineral reactivity and depending on the leaching conditions it varies
considerably during a batch bioleaching study. If the results of bioleaching experiments are
compared to the abiotic experiments, the abiotic experiments must be carried out under the
same redox potential conditions. However, most of the studies suffer from a lack of accurate
redox potential control in their abiotic experiments [66]. It is not an easy task to keep the ratio
Fe3+/Fe2+ on a specific value by using conventional chemical methods during a long leaching
experiment. This, however, can be achieved using an electrochemical cell equipped with an
automatic redox potential controller [67]. When chalcopyrite is oxidised (reaction 2.10) in the
cathode side of the vessel, the redox potential decreases while chemical (or bacterial)
oxidation (reaction 1.10) raises the redox potential. Conversely, if the redox potential is
higher than the set value, an electrical current is applied to reduce the ferric iron back to
ferrous (reaction 2.15). Water decomposes on the anode electrode (2.16) and protons migrate
to the working compartment through the cationic membrane to keep the charge balance in the
cell.
2H2+ + O2 + 4e- 2.16
Using this method to control the redox potential at a constant set value is reported for
bioleaching of pyrite [68] and sphalerite [49]. Investigations of this kind have not been
reported on chalcopyrite.

28
2.3. Aim and scope
The scope of this thesis is to investigate the effect of bacterial activity on the leaching
efficiency of chalcopyrite by reproducing the redox potential conditions in abiotic
experiments similar to the batch bioleaching experiments. This will be investigated on a
pyritic chalcopyrite concentrate and a pure chalcopyrite concentrate. To shed more light on
the questions of passivation/hindered dissolution, surface studies in conjunction with leaching
behaviour will be employed. Finally, bulk and surface elemental sulphur and jarosite, as
candidates for passivation/hindered dissolution, will be thoroughly examined.
2.4. Summary
In this chapter, dissolution of chalcopyrite was reviewed briefly. Suggested mechanisms were
presented and the candidates for passivation/hindered dissolution were introduced. The
important factor of redox potential was discussed and the role of microbes in assisting the
dissolution was reviewed. Some of the gaps in the methodologies were highlighted, and based
on them the scope of the thesis was defined. In the next two chapters, materials and
methodologies employed during this project will be given and the results of the experiments
will be discussed.

29
3. Materials and methods
3.1. Materials
3.1.1. Pyritic chalcopyrite concentrate
A copper concentrate with relatively high pyrite content from the Kristineberg mine owned by
Boliden Mineral AB was used. The concentrate contained 23.6% copper, 34.7% iron, 37.5%
sulphur, 2.1% zinc, 0.7% lead and 1.1% silica. X-ray diffraction analysis only revealed the
presence of chalcopyrite and pyrite (Fig. 4.6) since the other minerals were too low in
concentration. SEM photographs showed that the pyrite and chalcopyrite grains mostly
existed as separate grains. Calculated mineralogy gave an approximate composition of: 68%
chalcopyrite, 26% pyrite, 3.2% sphalerite and 0.8% galena.
In the experiments performed to investigate the effect of ageing (see section 4.1), the
concentrate was used as received from Boliden Mineral AB with a particle size of d80 minus
80 μm and a mean diameter of 45 μm. In the bioleaching and abiotic experiments, specific
amounts of the Kristineberg concentrate were ground for 10 seconds in a ring mill to give a
particle size with d80 of minus 45 μm and a mean diameter of 27 μm (Fig. 3.1). The grinding
was carried out immediately before addition of the concentrate into the reactors to minimise
surface oxidation by air and to provide more or less the same initial surface characteristics of
the concentrate in all experiments. In the abiotic experiments, the concentrate was kept at
110° C for two hours prior to grinding in order to prohibit the activity of microorganisms
possibly present in the concentrate.
3.1.2. High-purity chalcopyrite concentrate
In order to eliminate the effect of pyrite on the chalcopyrite dissolution rate in the bioleaching
and abiotic experiments, a high-purity chalcopyrite concentrate from the Aitik mine (Boliden
Mineral AB) was used. The concentrate was treated in several flotation stages (carried out by
Boliden), and a special Mo removal process. Chemical analyses revealed that the concentrate
contained 32.4% copper, 30.9% iron, 34.1% sulphur, 0.53% silica, 0.11% zinc and 0.05%
lead. X-ray diffraction analysis only showed the presence of chalcopyrite in the concentrate.
Chalcopyrite was also the only copper compound found in SEM photographs and EDS
analyses. By assuming that all copper was present as chalcopyrite, the concentrate had a
chalcopyrite grade of 94% and a pyrite grade of 3%.

30
Fig. 3.1. Particle size distribution of the original concentrates and after grinding for leaching
experiments.
A series of grinding tests were performed and it was found that grinding for 15 seconds in the
ring mill resulted in a particle size close to that of the Kristineberg pyritic concentrate ground
for 10 seconds (Fig. 3.1). Similarly, in the abiotic experiment the concentrate was kept at 110
°C for two hours prior to grinding in order to prohibit the activity of microorganisms.
3.1.3. Massive chalcopyrite samples
To produce leached chalcopyrite surfaces free of bulk precipitates for XPS measurements,
chalcopyrite pieces (from the Aitik mine) with an approximate dimension of 3 × 3 × 3 mm
and an average weight of 60 mg were made. Each cube was produced such that it had at least
two chalcopyrite faces verified by XPS measurements (see section 4.2.3). The samples were
polished and rinsed with ethanol immediately before being used in the experiments.
3.1.4. Microorganisms
A mixed culture of moderately thermophilic acidophiles was grown in mineral salt medium
(MSM) at pH 1.5 containing, per litre, 3 g (NH4)2SO4, 0.1 g KCl, 0.01 g CaNO3·4H2O, 0.5 g
MgSO4·7H2O, 0.05 g K2HPO4 and 3.3 g Na2SO4 at 45 °C. The moderately thermophilic

31
culture contained strains related to Acidithiobacillus ferrooxidans, Acidithiobacillus caldus C-
SH12, Sulfobacillus thermosulfidooxidans AT-1, ‘‘Sulfobacillus montserratensis’’ L15 and an
uncultured thermal soil bacterium YNP ([69], unpublished data). The corresponding copper
concentrates were gradually added to the adaptation bioreactors up to a solid content of 2.5%
(wt/vol).
3.2. Bioleaching experiments
3.2.1. Bioleaching of the pyritic chalcopyrite concentrate
A batch bioleaching experiment was performed in a 2 L baffled reactor at 45°C with a
working volume of 1 L. Air at a rate of 1 L/min was blown into the reactor. The reactor was
inoculated with 10% (vol/vol) of the active microbial culture giving a total initial
concentration of 140 mg/L Fe, 90 mg/L Cu and 21 mg/L Zn. In order to avoid excessive
precipitation during the experiment and to facilitate subsequent surface analysis a solid
content of 2.5% (wt/vol) was used. The redox potential was regularly recorded using a
platinum electrode with a Ag/AgCl reference electrode (Metrohm). All the reported redox
potential values in this document are versus the Ag/AgCl reference electrode, unless
otherwise specified. The pH was frequently checked and adjusted to 1.5 by addition of 5 M
sulphuric acid or 5 M sodium hydroxide solution. Samples were taken at intervals for analysis
of dissolved copper and iron as well as the iron which had been leached and subsequently
precipitated, termed “total iron” throughout this document. Before sampling, the volume of
the reactor was adjusted to 1 L by addition of distilled water (pH 1.5) to compensate for
evaporation. Every second day, the reactor was opened and the wall of the reactor was
cleaned from the accumulated particles by pushing them back to the reactor. At day 28, the
experiment was terminated and the pulp filtered. The residue was washed and then dried
overnight and saved for further analysis.
3.2.2. Bioleaching of the pure chalcopyrite concentrate
A batch bioleaching experiment similar to the experiment described for the pyritic concentrate
was carried out. The difference was that the reactor was inoculated with 5% (vol/vol) of the
active microbial culture to produce a similar initial iron concentration as in the pyritic
concentrate bioleaching. The total initial concentrations of copper and iron were 142 and 144
mg/L, respectively. Since the zinc content in the Aitik concentrate was low, the culture from
the adaptation reactor did not contain zinc in measurable levels.

32
XPS measurements on leaching residues proved to be problematic (see section 4.2.3). As a
result, massive chalcopyrite samples were used simultaneously in the experiments with the
pure chalcopyrite concentrate. Six pieces of massive chalcopyrite samples were restrained in a
small bag made of nylon net and immersed in the pulp. On day 3 (when the redox potential
reached 400 mV at the start of the microbial activity), day 7 (when the redox potential was
stable at 620 mV) and day 72 (when the dissolution had been hindered for a relatively long
time) (see Fig. 4.4b) massive chalcopyrite samples (each time 2 cubes) were removed for XPS
measurements. Table 4.1 summarises the samples and their conditions. The pulp was filtered
at the end of the experiment (day 94), washed, dried overnight, and saved for further analysis.
3.2.3. Modelling of redox potential measurements
The development of redox potential was recorded during the entire periods of bioleaching
experiments. The data were plotted against leaching time in Excel and were divided into
periods such that each period could be fitted by a third degree polynomial equation with an
acceptable R2 value. The procedure for fitting the redox potential data from the bioleaching of
the pyritic concentrate is shown in Fig. 3.2. A similar method was used to model the data
from the pure concentrate bioleaching experiment. The obtained equations were used to
program the redox potential controller in the abiotic experiments.
Fig. 3.2. Modelling of the redox potential data obtained during the pyritic concentrate
bioleaching experiment.

33
3.3. Abiotic experiments
3.3.1. Abiotic leaching of the pyritic chalcopyrite concentrate
Two controlled redox potential experiments were carried out in an electrochemical cell
described in section 2.2.5. The equations obtained after the modelling of the redox potential
data were used to program the set value in the redox controller of the electrochemical vessel.
Using this method, it was possible to accurately reproduce the same redox potential
conditions for the total duration of the bioleaching, but in the absence of microorganisms. The
leaching was performed at the cathode side of the vessel, where oxygen or hydrogen peroxide
was used as the oxidising agent. Fig. 3.3 shows a schematic of the electrochemical cell while
the setup of the reactor is shown in Fig. 3.4.
The electrical current, regulated by a computer, kept the redox potential on the set value by
reducing ferric ions to ferrous. LabView software (National Instruments) was used to write
the computer program that controlled the redox potential. In order to avoid the noisy reading
of the redox potential caused by the interfering electrical current in the working compartment,
the pump unit shown in Fig. 3.4 was used to pump the pulp from the working compartment to
a redox potential electrode installed on the top of the working compartment. The pulp was
then redirected to the working compartment through a funnel. This caused a 10 seconds delay
in reading the actual redox potential of the system, which was negligible due to being very
short compared to the leaching time which was in range of days. To improve the redox
potential regulation during the second electrochemical experiment, an additional program was
integrated into the system that enabled an automatic addition of the oxidising agent.
The working volume in the electrochemical cell was 1.5 L and the temperature was controlled
at 45° C via circulation of hot water in the jacket of the cell. The initial concentrations of iron,
copper and zinc were supplemented by the required amount of analytical grade ferric
sulphate, copper sulphate and zinc sulphate similar to the concentrations in the bioleaching
experiment. Other operating conditions including the MSM, acidity, stirring speed, solid
content, sampling and cleaning procedure were kept similar in the electrochemical
experiments as in the bioleaching experiment. At the end of the experiments, pulp samples
were visually inspected by a phase contrast microscope to ensure that there were no bacteria
in the system. The pulp was filtered and the residue was washed and dried before subsequent
analyses.

34
Fig. 3.3. Schematic of the electrochemical cell used for reproduction of redox potential data in
abiotic experiments.
Fig. 3.4. The setup of the electrochemical cell.
3.3.2. Abiotic leaching of the pure chalcopyrite concentrate
In a similar manner, the redox potential-time equations from the bioleaching of the pure
chalcopyrite concentrate were used to program the redox potential during the abiotic run. One
experiment was performed. All operating conditions were kept the same as in the
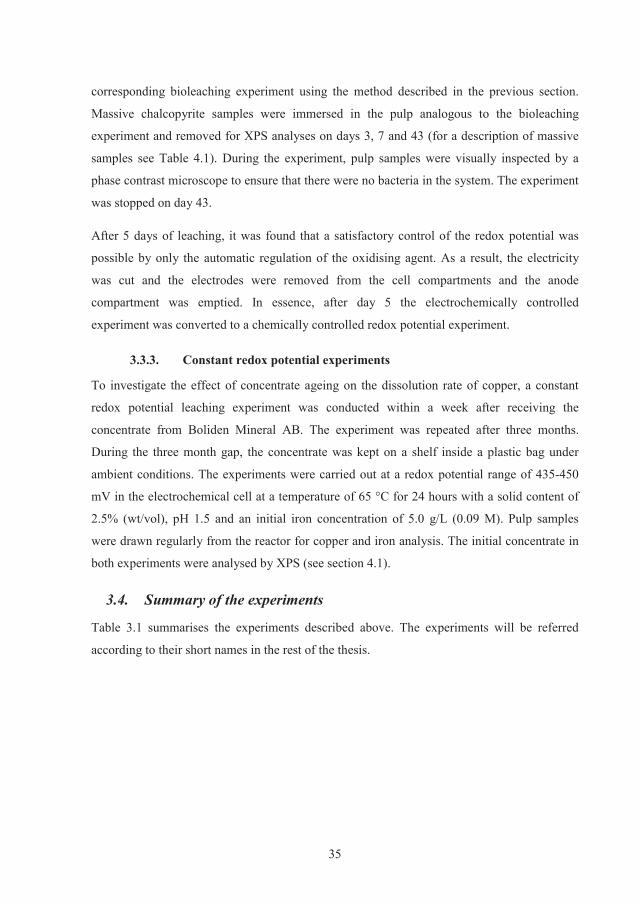
35
corresponding bioleaching experiment using the method described in the previous section.
Massive chalcopyrite samples were immersed in the pulp analogous to the bioleaching
experiment and removed for XPS analyses on days 3, 7 and 43 (for a description of massive
samples see Table 4.1). During the experiment, pulp samples were visually inspected by a
phase contrast microscope to ensure that there were no bacteria in the system. The experiment
was stopped on day 43.
After 5 days of leaching, it was found that a satisfactory control of the redox potential was
possible by only the automatic regulation of the oxidising agent. As a result, the electricity
was cut and the electrodes were removed from the cell compartments and the anode
compartment was emptied. In essence, after day 5 the electrochemically controlled
experiment was converted to a chemically controlled redox potential experiment.
3.3.3. Constant redox potential experiments
To investigate the effect of concentrate ageing on the dissolution rate of copper, a constant
redox potential leaching experiment was conducted within a week after receiving the
concentrate from Boliden Mineral AB. The experiment was repeated after three months.
During the three month gap, the concentrate was kept on a shelf inside a plastic bag under
ambient conditions. The experiments were carried out at a redox potential range of 435-450
mV in the electrochemical cell at a temperature of 65 °C for 24 hours with a solid content of
2.5% (wt/vol), pH 1.5 and an initial iron concentration of 5.0 g/L (0.09 M). Pulp samples
were drawn regularly from the reactor for copper and iron analysis. The initial concentrate in
both experiments were analysed by XPS (see section 4.1).
3.4. Summary of the experiments
Table 3.1 summarises the experiments described above. The experiments will be referred
according to their short names in the rest of the thesis.

36
Table 3.1. The summary of the experiments and their short names.
Type Short name Redox potential controlled?
Redox potential
Temp. (° C)
d80 (μm)
Kristineberg chalcopyrite concentrate (pyritic)
Bioleaching Kri-Bio No Varying due to bacterial action
45 45 Freshly ground
Abiotic Kri-Abio1 Chem./El.chem. Mimicked the Kri-Bio
45 45 Freshly ground
Abiotic Kri-Abio2 Chem./El.chem. Mimicked the Kri-Bio
45 45 Freshly ground
Abiotic Fresh Chem./El.chem. 435-450 mV 65 80 Fresh
Abiotic Aged Chem./El.chem. 435-450 mV 65 80 Aged
Aitik chalcopyrite concentrate (pure)
Bioleaching Ait-Bio No Varying due to bacterial action
45 45 Freshly ground
Abiotic Ait-Abio Chem./El.chem. Mimicked the Ait-Bio
45 45 Freshly ground
3.5. Analyses
Atomic absorption spectroscopy (AAS) was used to determine the concentrations of dissolved
copper and iron in the leaching solutions. Total iron was analysed by mixing equal volumes of
representative pulp samples with concentrated HCl for dissolution of precipitated iron. The
resulting pulp was filtered and then analysed by AAS. Solution samples were diluted to a
range of 0-24 mg/L of copper and 0-36 mg/L of iron. The diluted samples were then analysed
by a Perkin Elmer, Analyst 100 which was calibrated for the same ranges of copper and iron
concentrations.
A Siemens D5000 X-ray powder diffractometer was used to examine the mineral phases in
the concentrates and residues. Diffraction p 5–90°

37
the produced diffractograms.
A CILAS 1064 Liquid apparatus was used for particle size analyses. The data were recorded
in a range of 0.04 to 500 μm in 100 classes. The amount of analysed sample was kept similar
in all the measurements.
Backscattered electron detector on a Ziess (MERLIN HR) scanning electron microscopy was
used for producing SEM photographs and energy dispersive X-ray spectroscopic (EDS)
analyses. The concentrate or residue samples were pasted in an epoxy resin and polished
carefully to produce a surface suitable for SEM measurements. The surfaces were carbon
coated with a thickness of 15 nm. The acceleration voltage was set to 20 keV and the
emission current was 1.0 nA. The working distance was kept at 8.5 mm. The EDS analyser
was calibrated with the metallic copper that was taped on the samples to inhibit the charge
accumulation.
For analysis of elemental sulphur in the residues, the sulphur was extracted with acetone for at
least one week, to ensure the extraction of all the elemental sulphur in the sample. Cyanolysis
[70] was carried by addition of KCN solution to the acetone phase to form thiocyanate. The
amount of thiocyanate was then determined by addition of ferric nitrate solution followed by
spectrophotometry at 460 nm (Beckman Coulter DU® 730).
3.6. X-ray photoelectron spectroscopy (XPS)
XPS measurements were carried out on the final residue samples from Kri-Bio and Kri-
Abio1. 5 mL of representative samples from the bioleaching and electrochemical reactors
were taken for XPS analysis and were immediately transferred to a glove bag under an
oxygen-free nitrogen atmosphere. The samples were decanted and the solids were washed
twice by re-pulping with distilled water acidified to pH 1.5 (H2SO4) for removal of soluble
precipitates. The solids were then washed three times with distilled water to remove any
sulphate residues from the acid washing stage. Both acidified water and washing water were
purged with nitrogen for several hours in the glove bag for removal of dissolved oxygen
before being used. The samples were then sealed in special containers filled with nitrogen and
kept in an inert atmosphere until the XPS measurements were performed.

38
Massive samples from Ait-Bio and Ait-Abio experiments were also analysed with XPS. The
samples were removed from the reactors and immersed in distilled water acidified to pH 1.5
(H2SO4) for removal of bulk particles and soluble precipitates. The samples were then
immersed in distilled water to remove any sulphate residue from the acid washing stage.
Finally, the samples were sealed in special containers analogous to the powder samples until
the XPS measurements.
At the time of XPS measurements, samples were removed from their sealed containers and
placed in the sample holder. All the operations were performed under a flow of argon gas.
The sample holder was then loaded onto the sample transfer rod in the spectrometer air-lock.
All XPS spectra were recorded with a Kratos Axis Ultra DLD electron spectrometer. A
monochromated Al K source operated at 150 W, hybrid lens system with a magnetic lens,
providing an analysis area of 0.3 × 0.7 mm2, and a charge neutralizer were used for the
measurements. The binding energy (BE) scale was referenced to the C1s line of aliphatic
carbon contamination, set at 285.0 eV. To avoid loss of water and elemental sulphur, a liquid
nitrogen pre-cooling procedure was carried out before the measurements [71]. This procedure
included pre-cooling the end of the sample transfer rod (20 min at -170°C) and then waiting
45 s after sample loading before pumping of the introducing chamber. After pumping to 4–5 ×
10-5 Pa, the sample was transferred to the precooled (-155°C) manipulator where it was kept
until base vacuum of 4–6 × 10⁻⁷ Pa in the analysis chamber was reached. The room
temperature measurements were carried out after stopping the liquid nitrogen flow to the
apparatus and keeping the sample in the analysing chamber overnight. The measurements
were then repeated the day after on the same spot of the sample. Processing of the spectra was
accomplished with the Kratos software. The S 2p spectra were fitted with symmetric peaks
(70% Gaussian and 30% Lorentzian) using S 2p3/2–S 2p1/2 doublets. Each doublet was
constrained by fixed spin-orbital splitting of 1.18 eV, same width of both components, and the
3/2–1/2 theoretical intensity ratio of 2. Assignments of peaks in sulphur region were carried
out by following the procedure proposed by Parker (2003) [72].

39
4. Results and discussions
4.1. Ageing of chalcopyrite
Atmospheric oxidation of chalcopyrite has not been studied as often as its oxidation in other
media [27]. Surface characterisation of chalcopyrite concentrate due to air oxidation is
important because it might affect dissolution rates in subsequent aqueous leaching. Copper
dissolution during leaching of a relatively fresh and an aged concentrate under identical
leaching conditions gave almost equal rates at the start due to the initial leaching of fine
particles (Fig. 4.1). However, the dissolution rate in the aged concentrate leaching became
significantly slower, and the copper recovery after 24 hours was one third of that in the
experiment with the fresh concentrate.
Fig. 4.1. Copper dissolution curves in constant redox experiments using a fresh concentrate
and an aged concentrate. Leaching conditions: Temperature: 65 °C, pH 1.5, initial Fe
concentration: 5 g/L, redox potential: 435 – 450 mV.
The S 2p and Fe 2p3/2 XPS spectra of the fresh and aged concentrates are given in Fig. 4.2 and
Fig. 4.3. The S 2p3/2 peaks in both samples in the BE range from 160.0 to 166.0 eV appeared
to originate from chalcopyrite and pyrite surfaces. Efforts to assign the peaks individually
were not very successful. XPS analyses of materials containing both conductive and dielectric
phases are subject to charging effects [73]. Besides, it is very difficult to differentiate the
chalcopyrite peaks from pyrite peaks in heterogeneous samples by only XPS measurements
[74, 75]. Nevertheless, it was possible to identify peaks related to oxidised species in the

40
sulphur and iron spectra of aged and fresh samples: a very distinct sulphate component at a
BE of around 169.0 eV, a peak related to iron in sulphide lattice at 708.0 eV and an elevated
feature in the iron-oxy-hydroxide and iron-sulphate regions around 711 and 712 eV. It is clear
that both the fresh and the aged concentrates have an oxidised surface. However, the atomic
concentration ratios of the oxidised species in the aged concentrate were much higher. Atomic
ratio SSO42-/Stotal was 0.24 in the aged concentrate while it was 0.1 in the fresh concentrate. The
ratio of oxidised iron species to the total iron was also higher in the aged sample compared to
the fresh concentrate (0.83 versus 0.67). The copper spectra (data not shown) in both samples
were very similar, with no sign of oxidation and with lower concentrations of copper in the
aged sample due to the masked chalcopyrite surface by air oxidation products. There is no
proof whether these oxidised phases caused the slow dissolution directly or acted as a seed for
formation of other hindering layers. However, the data emphasise the prominent effect of
concentrate ageing on leaching efficiency.
Fig. 4.2. S 2p spectra of (a) fresh concentrate and (b) aged concentrate after subtraction of the
background and removal of spin-orbit splitting.

41
Fig. 4.3. 2p3/2 region of Fe spectra of the fresh and aged concentrate after removal of the
background.
Ageing would not be a concern in industrial scale chalcopyrite tank bioleaching as the ore is
treated in successive stages of grinding, flotation and leaching. However, chalcopyrite heap
bioleaching takes months to years and the surface oxidation may be a factor in the leaching
efficiency. In addition, in research laboratories, ground concentrate sometimes lies on shelves
for months before being used in experiments. Therefore, the concentrate should be ground
before addition to the leaching reactors or should be kept under a non-oxidising atmosphere
after the grinding. Unfortunately, the effect of concentrate ageing has been either
underestimated or completely ignored in many of the published literature.
4.2. Bioleaching vs. abiotic leaching experiments
4.2.1. Redox potential control
Fig. 4.4a shows the redox potential development in bioleaching experiment (Kri-Bio) as well
as its simulation in the abiotic leaching experiments (Kri-Abio1 and Kri-Abio2) of the pyritic
concentrate. In absence of microorganisms, ferrous oxidation by oxygen (reaction 1.5) is a
slow reaction. As a result, after 5 days in the Kri-Abio1 and Kri-Abio2 experiments where
rigorous oxidation of ferrous ions was needed, oxygen was not powerful enough to follow the
bioleaching profile. Hence, a dilute solution of hydrogen peroxide was pumped at defined
intervals. In the Kri-Abio1 experiment there were incidents in controlling the redox potential
on days 21 and 27 when the redox potential increased to around 680 mV. By integrating a
new program during the Kri-Abio2 experiment, the oxidising reagent pump was automatically
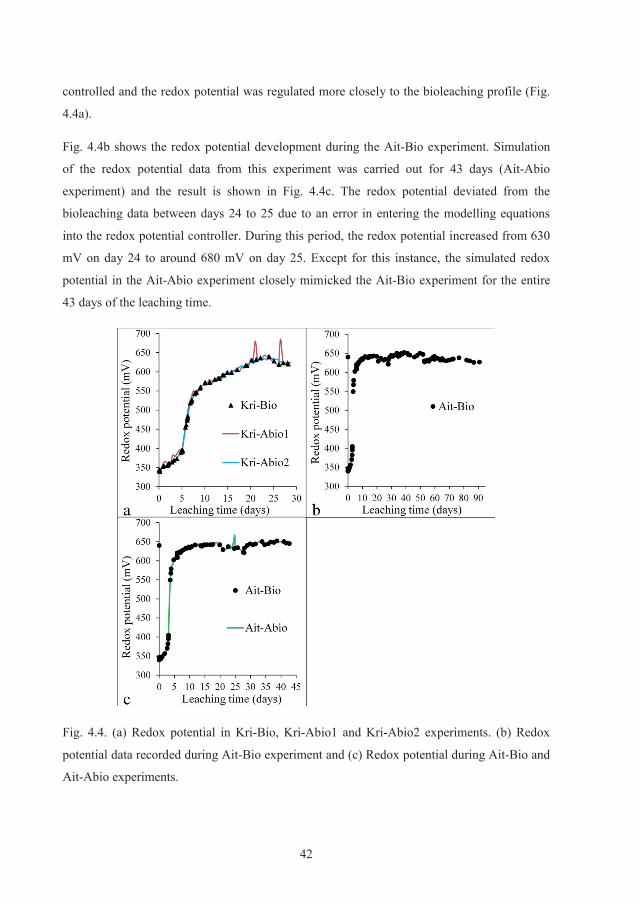
42
controlled and the redox potential was regulated more closely to the bioleaching profile (Fig.
4.4a).
Fig. 4.4b shows the redox potential development during the Ait-Bio experiment. Simulation
of the redox potential data from this experiment was carried out for 43 days (Ait-Abio
experiment) and the result is shown in Fig. 4.4c. The redox potential deviated from the
bioleaching data between days 24 to 25 due to an error in entering the modelling equations
into the redox potential controller. During this period, the redox potential increased from 630
mV on day 24 to around 680 mV on day 25. Except for this instance, the simulated redox
potential in the Ait-Abio experiment closely mimicked the Ait-Bio experiment for the entire
43 days of the leaching time.
Fig. 4.4. (a) Redox potential in Kri-Bio, Kri-Abio1 and Kri-Abio2 experiments. (b) Redox
potential data recorded during Ait-Bio experiment and (c) Redox potential during Ait-Bio and
Ait-Abio experiments.

43
4.2.2. Leaching results
All the copper and iron concentrations were calculated based on the amount of metal released
from the concentrate into solution. The initial concentrations and the amounts removed from
the system by sampling were compensated for in the calculations.
The final copper recoveries were within the experimental error in the Kri-Bio, Kri-Abio1 and
Kri-Abio2 experiments, varying from 47% to 50% (Fig. 4.5a).
Fig. 4.5. (a) Copper recoveries, (b) total iron concentrations and (c) dissolved iron
concentrations during bioleaching and abiotic experiments with pyritic concentrate.
Total iron concentrations were also comparable in all experiments with Kristineberg
concentrate. However, irreversible iron precipitation in the Kri-Abio1 experiment occurred
after day 21, when the redox potential reached 680 mV and stayed there for around half a day
(Fig. 4.4a). This was long enough for seeds of jarosite to form and grow and at the end of the

44
experiment 42% of the total iron had precipitated as jarosite (roughly 30% of the total weight
of the final residue was jarosite). The presence of jarosite was confirmed by XRD in the
residue from the Kri-Abio1 experiment while jarosite could not be detected in the residues
from the Kri-Bio and Kri-Abio experiments (Fig. 4.6).
Fig. 4.6. XRD patterns of the Kristineberg concentrate, Kri-Bio, Kri-Abio1 and Kri-Abio2
residues. Abbreviations: C, chalcopyrite; P, pyrite; J, jarosite and S, sulphur.
Despite the lower iron concentration in the Kri-Abio1 experiment after day 21, the copper
dissolution rate remained the same as in the other two experiments. This is in agreement with
the studies showing that chalcopyrite leaching rate is not influenced by ferric ion
concentration provided it exceeds 0.01 M [54]. Furthermore, the copper dissolution rate was
not affected by the presence or absence of bulk jarosite. In paper I, it was postulated that the
galvanic interaction induced by pyrite was the reason for continued copper recoveries, despite
the bulk jarosite precipitation. However, experiments on pure chalcopyrite concentrate (Fig.
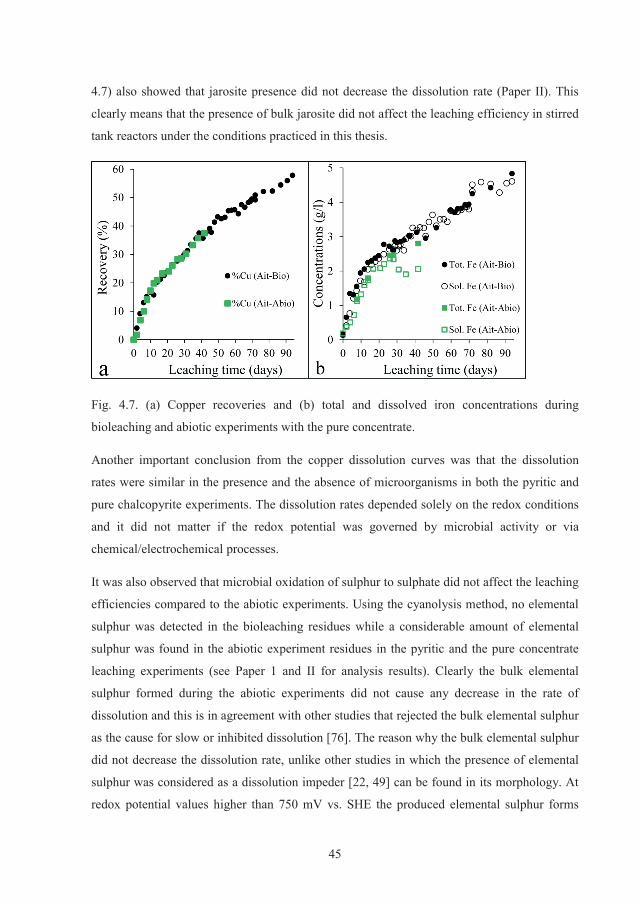
45
4.7) also showed that jarosite presence did not decrease the dissolution rate (Paper II). This
clearly means that the presence of bulk jarosite did not affect the leaching efficiency in stirred
tank reactors under the conditions practiced in this thesis.
Fig. 4.7. (a) Copper recoveries and (b) total and dissolved iron concentrations during
bioleaching and abiotic experiments with the pure concentrate.
Another important conclusion from the copper dissolution curves was that the dissolution
rates were similar in the presence and the absence of microorganisms in both the pyritic and
pure chalcopyrite experiments. The dissolution rates depended solely on the redox conditions
and it did not matter if the redox potential was governed by microbial activity or via
chemical/electrochemical processes.
It was also observed that microbial oxidation of sulphur to sulphate did not affect the leaching
efficiencies compared to the abiotic experiments. Using the cyanolysis method, no elemental
sulphur was detected in the bioleaching residues while a considerable amount of elemental
sulphur was found in the abiotic experiment residues in the pyritic and the pure concentrate
leaching experiments (see Paper 1 and II for analysis results). Clearly the bulk elemental
sulphur formed during the abiotic experiments did not cause any decrease in the rate of
dissolution and this is in agreement with other studies that rejected the bulk elemental sulphur
as the cause for slow or inhibited dissolution [76]. The reason why the bulk elemental sulphur
did not decrease the dissolution rate, unlike other studies in which the presence of elemental
sulphur was considered as a dissolution impeder [22, 49] can be found in its morphology. At
redox potential values higher than 750 mV vs. SHE the produced elemental sulphur forms

46
free aggregates [48, 49] instead of clouds surrounding the chalcopyrite particles. Fig. 4.8
shows the backscattered electron image of the residue at the end of the Ait-Abio experiment.
EDS analysis revealed that the bulk sulphur was dispersed in the residue and there was no
sulphur enriched layer around the chalcopyrite particles.
Fig. 4.8. Backscattered electron image of the residue from the Ait-Abio experiment showing
chalcopyrite (CPY), bulk sulphur (S) and potassium jarosite (J) particles in the residue.
To ease the comparison between the leaching results in the pyritic and the pure concentrate
bioleaching experiments, the redox potential data and copper recoveries are presented
together in Fig. 4.9a and Fig. 4.9b, respectively.
Fig. 4.9. Comparison of (a) the redox potential conditions and (b) the copper recoveries in
Kri-Bio and Ait-Bio experiments.

47
It took 5 days for the redox potential in the Kri-Bio experiment to enter the log phase, where it
increased from around 400 to 550 mV. Increasing from 550 to 600 mV took another 10 days.
In the Ait-Bio experiment, despite the lower initial cell density the log phase started after only
3 days and it reached to 600 mV already at day 5. This was due to the Kristineberg
concentrate being more reactive because of the presence of pyrite (galvanic interaction) as
well as dissolution of sphalerite in the presence of ferric ions. As a result, the redox potential
profile in the Kri-Bio experiment looked attenuated compared to the Ait-Bio experiment. Fig.
4.9b shows that the recoveries were almost equal up to day 7 due to the initial dissolution of
finer particles. Afterward the dissolution in the experiment with pure chalcopyrite became
more hindered. On day 28 the recovery of copper was 47% in the Kri-Bio experiment while it
was only 30% in the Ait-Bio experiment. This highlights the significant effect of the galvanic
interactions induced by the pyrite content in the higher recoveries obtained in leaching of the
pyritic concentrate.
It is clear that the dissolution curves shown in Fig. 4.5a and Fig. 4.7a do not resemble a
classical definition of passivation, i.e. a complete halt or close to zero copper dissolution rate.
After the experiments with pyritic concentrate, it was postulated that the presence of pyrite,
inducing galvanic dissolution of chalcopyrite, had a role in the linear increase of the copper
recoveries. However, after performing the experiments with the pure concentrate it became
apparent that the pyrite, as discussed, improved the final recoveries of copper but the slow
linear increasing of the copper dissolution still existed in absence of pyrite. Pyrite itself is
prone to oxidation in redox potential conditions higher than around 500 mV [54]. A detailed
calculation on the extent of pyrite dissolution during the pyritic concentrate leaching
experiments is given in Paper I. What is clear is that pyrite had no or a small role in the
resulting linear dissolution. Another reason for the absence of passivation could be the
production of fresh chalcopyrite surface as a result of collision of particles due to the stirring
action. This needs to be addressed in future work in carefully designed column (bio)leaching
experiments. Yet, another way of looking at passivation or hindered dissolution is that it is a
consequence of the thermodynamics/kinetics of the system and is impossible to avoid. This
issue also needs more investigation which is out of the scope of the data produced in this
thesis and should be considered in the future work.
For whatever reason the chalcopyrite leaching did not halt, the leaching was considered as
hindered instead of passivated. The definition of hindered dissolution which is a slow linear

48
increase of copper recovery versus time [35] fits to the observed leaching behaviours in this
study.
4.2.3. XPS studies
XPS measurements have been carried out on the leach residues of Kri-Bio and Kri-Abio1
experiments. Corresponding S2p spectra are shown in Fig. 4.10.
Fig. 4.10. S 2p spectra of (a) Kri-Bio residue and (b) Kri-Abio1 residue after subtraction of
the background and removal of spin-orbit splitting.
Unlike the S 2p spectra obtained for the concentrate (Fig. 4.2), all fitted S 2p doublets were in
good agreement with those in the literature [72]. The reason could be removal of pyrite during
the experiments which naturally resulted in very low concentrations of pyrite in the residues
and consequently, elimination of the surface charging effect allowing an improved peak
assignment in the obtained XPS spectra.
One clear feature in the S 2p spectra is the higher ratio SSO42-/Stotal in the Kri-Abio1 residue of
0.37 compared with 0.11 in the Kri-Bio residue. The atomic concentration of iron-sulphate
specie was also higher in the Kri-Abio1 residues. Furthermore, a K 2p doublet from
potassium jarosite was visible in spectra of Kri-Abio1 residue (not shown) at a binding energy
of 292.8 eV. All this indicated the presence of jarosite and elemental sulphur in the Kri-Abio1
residue surface. However, it is important to note that during the Kri-Abio1 experiment
considerable amounts of bulk elemental sulphur and jarosite were formed (see XRD results in
Fig. 4.6). Considering the analysis area in our XPS measurements (0.3 mm × 0.7 mm), bulk
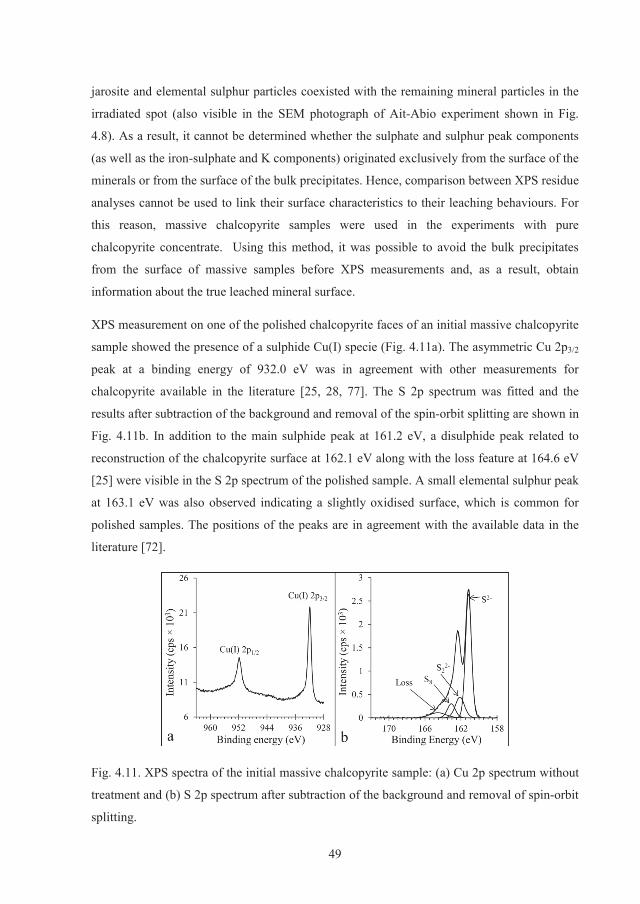
49
jarosite and elemental sulphur particles coexisted with the remaining mineral particles in the
irradiated spot (also visible in the SEM photograph of Ait-Abio experiment shown in Fig.
4.8). As a result, it cannot be determined whether the sulphate and sulphur peak components
(as well as the iron-sulphate and K components) originated exclusively from the surface of the
minerals or from the surface of the bulk precipitates. Hence, comparison between XPS residue
analyses cannot be used to link their surface characteristics to their leaching behaviours. For
this reason, massive chalcopyrite samples were used in the experiments with pure
chalcopyrite concentrate. Using this method, it was possible to avoid the bulk precipitates
from the surface of massive samples before XPS measurements and, as a result, obtain
information about the true leached mineral surface.
XPS measurement on one of the polished chalcopyrite faces of an initial massive chalcopyrite
sample showed the presence of a sulphide Cu(I) specie (Fig. 4.11a). The asymmetric Cu 2p3/2
peak at a binding energy of 932.0 eV was in agreement with other measurements for
chalcopyrite available in the literature [25, 28, 77]. The S 2p spectrum was fitted and the
results after subtraction of the background and removal of the spin-orbit splitting are shown in
Fig. 4.11b. In addition to the main sulphide peak at 161.2 eV, a disulphide peak related to
reconstruction of the chalcopyrite surface at 162.1 eV along with the loss feature at 164.6 eV
[25] were visible in the S 2p spectrum of the polished sample. A small elemental sulphur peak
at 163.1 eV was also observed indicating a slightly oxidised surface, which is common for
polished samples. The positions of the peaks are in agreement with the available data in the
literature [72].
Fig. 4.11. XPS spectra of the initial massive chalcopyrite sample: (a) Cu 2p spectrum without
treatment and (b) S 2p spectrum after subtraction of the background and removal of spin-orbit
splitting.

50
A conventional peak fitting method typically applied on S 2p spectra cannot be used in the
case of Fe 2p spectra due to the possible presence of several iron species with peaks in a
narrow window of binding energies as well as a complex Fe 2p multiplet structure. A
principal component analysis (PCA) method is reported that employs the Fe spectra of a
number of standard compounds as the principal components to fit the entire Fe 2p spectrum of
the sample via non-linear least squares [72]. Using this method was not an option in the
present study due to the lack of suitable standards. As a result, all the acquired iron spectra of
the samples were examined visually. By visual examination, it was possible to find the main
iron-sulphide peak in chalcopyrite at around 708 eV. The presence of iron-
oxides/oxyhydroxides can also be examined since they appear as a peak around 711 eV.
However, it was not possible to distinguish between oxides and (oxy)hydroxides [78]. Iron-
sulphate usually gives rise to a peak at binding energies around 712 eV and higher. The
vicinities of iron-sulphide (around 708 eV), iron-oxide/oxyhydroxides (around 711 eV) and
iron-sulphates (around 712 eV) are shown along with all the Fe 2p spectra of the samples
(Fig. 4.12). The spectrum acquired from a potassium jarosite standard is also presented for
comparison.

51
Fig. 4.12. Fe 2p spectra of the leached samples as well as a potassium jarosite standard after
removal of the background. Sample short names is given in Table 4.1.

52
Tabl
e 4.
1. A
sum
mar
y of
the
sam
ples
and
thei
r lea
chin
g hi
stor
y w
ith th
e qu
antit
ativ
e su
rfac
e su
lphu
r spe
ciat
ion
afte
r res
olvi
ng th
e S
2p s
pect
ra.
Obs
erva
tions
in th
e Fe
2p
spec
tra a
re a
lso
sum
mar
ised
. Pre
senc
e or
abs
ence
of t
he K
2p 3
/2pe
ak o
f pot
assi
um ja
rosi
te a
t aro
und
292.
6 eV
is a
lso
show
n fo
r eac
h sa
mpl
e.V
alue
s in
pare
nthe
sis r
epre
sent
the
ratio
s obt
aine
d af
ter X
PS m
easu
rem
ents
in ro
om te
mpe
ratu
re.
Sam
ple
Expe
rimen
t
Res
iden
ce
time
(day
s)
OR
P
(mV
)S2-
/Sto
tS 2
2-/S
tot
S 8/S
tot
SO42-
/Sto
t
Iron
com
poun
ds
Kja
rosi
teox
ide/
oxyh
ydro
xide
sulp
hate
Initi
tal
--
-0.
670.
170.
100.
00
B3
Ait-
Bio
340
00.
450.
180.
250.
10
A3
Ait-
Abi
o3
400
0.54
0.10
0.26
0.00
B7
Ait-
Bio
762
00.
410.
090.
320.
11
A7
Ait-
Abi
o7
620
0.50
(0.5
5)
0.07
(0.0
9)
0.40
(0.3
1)
0.03
(0.0
5)
B72
Ait-
Bio
7263
00.
43
(0.5
0)
0.08
(0.0
7)
0.46
(0.4
0)
0.00
(0.0
0)
A43
Ait-
Abi
o43
645
0.02
0.01
0.52
0.44

53
For the initial sample, a second Fe 2p3/2 peak at around 711 eV was also visible alongside the
main peak of the iron in the chalcopyrite lattice just below 708.0 eV. This peak indicated the
presence of iron-oxides formed on the surface of polished chalcopyrite [25, 78]. The intensity
of this peak decreased significantly after the sample was treated for 5 minutes in 0.5 M HCl
solution at room temperature (Fig. 4.12; spectra marked HCl). Fading of the iron peak was
accompanied by removal of an O 1s peak at 529.7 eV related to bulk metal oxides [78]. As a
result, it can be concluded that the oxidised iron specie on the surface of the initial polished
sample was most probably iron-oxide.
Quantitative analyses gave the atomic ratios S/Cu = 2.26, S/Fe = 1.94 and Cu/Fe = 0.86 for
the initial polished sample. Although close to the theoretical values of chalcopyrite, the ratios
indicated the presence of extra iron on the surface, most likely in the form of iron oxide. Wide
scan measurements showed the presence of minor amounts of other impurities such as Si, Ca,
Na and Pb in some of the samples. In addition, there are always variations of impurities from
one natural sample to another. However, the chalcopyrite cubes in this study provided a
chalcopyrite surface free of leaching precipitates for XPS measurements. For this purpose, the
presence of minor impurities did not matter (as they also exist in the concentrate) and the
samples were considered to be suitable to be used in the experiments.
Cu 2p spectra acquired for all the leached samples (Fig. 4.13) were similar to the initial
sample (in terms of the positions of the peaks) with only a Cu(I) peak assigned to the sulphide
lattice. The S 2p spectra were fitted (similar to the procedure shown in Fig. 4.11b) and the
atomic ratios of sulphur species including sulphide (S2-), disulphide (S22-), elemental sulphur
(S8), loss (S[ +]) and sulphate (SO42-) relative to the total amount of sulphur (Stot) on the
surface were calculated (Table 4.1).
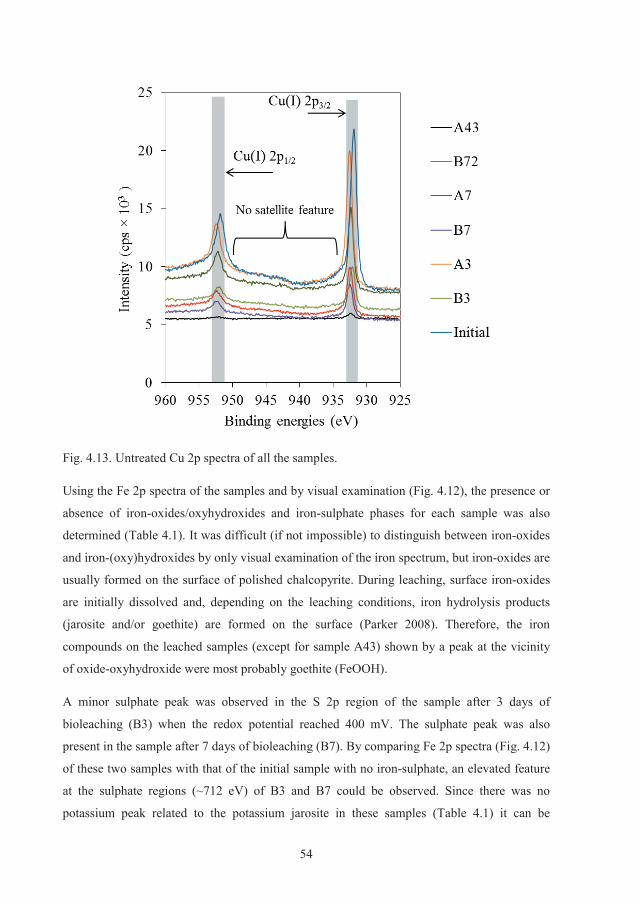
54
Fig. 4.13. Untreated Cu 2p spectra of all the samples.
Using the Fe 2p spectra of the samples and by visual examination (Fig. 4.12), the presence or
absence of iron-oxides/oxyhydroxides and iron-sulphate phases for each sample was also
determined (Table 4.1). It was difficult (if not impossible) to distinguish between iron-oxides
and iron-(oxy)hydroxides by only visual examination of the iron spectrum, but iron-oxides are
usually formed on the surface of polished chalcopyrite. During leaching, surface iron-oxides
are initially dissolved and, depending on the leaching conditions, iron hydrolysis products
(jarosite and/or goethite) are formed on the surface (Parker 2008). Therefore, the iron
compounds on the leached samples (except for sample A43) shown by a peak at the vicinity
of oxide-oxyhydroxide were most probably goethite (FeOOH).
A minor sulphate peak was observed in the S 2p region of the sample after 3 days of
bioleaching (B3) when the redox potential reached 400 mV. The sulphate peak was also
present in the sample after 7 days of bioleaching (B7). By comparing Fe 2p spectra (Fig. 4.12)
of these two samples with that of the initial sample with no iron-sulphate, an elevated feature
at the sulphate regions (~712 eV) of B3 and B7 could be observed. Since there was no
potassium peak related to the potassium jarosite in these samples (Table 4.1) it can be

55
concluded that the sulphate peak was related to some other iron-sulphate compound. The
sulphate peaks disappeared from the S 2p and Fe 2p spectra of the sample bioleached for 72
days (B72). This can be explained by accumulation of other species such as elemental sulphur
on the surface making the sulphate phase disappear. It is also probable that the iron-sulphate
had been present on the surface from the beginning as a result of air oxidation of chalcopyrite.
Clearly, sulphate compound accumulation on the chalcopyrite surface was not steady as the
bioleaching progressed. On the other hand, the sulphate compound did not show up on the
surface of chalcopyrite leached abiotically as early as it did in the bioleaching experiment:
sample A3 had no sulphate while sample A7 had a small sulphate peak. It is difficult to
imagine that the sulphate phase played an important role in affecting the copper dissolution
rate for a number of reasons. Firstly, despite the inconsistent presence of the sulphate peak in
the bioleaching and abiotic experiments, similar copper recoveries (14.5 ± 0.5% after 8 days)
in both experiments were obtained; secondly, the accumulation of the phase was unsteady as
the bioleaching progressed from day 7 to 72; and lastly, the intensities of this peak were
relatively small.
The final sample from the abiotic experiment (A43) showed a completely different surface
compared to the other samples (Table 4.1). The presence of a huge sulphate peak was
observed in this sample. Only 3 at% of the total sulphur was in the sulphide mineral lattice.
Presence of copper (I) in the sulphide lattice, although very small (Fig. 4.13), showed that the
analysed volume on the surface of the sample still contained minor amounts of chalcopyrite.
The sulphate compound on the surface was assigned to jarosite because of a distinct K 2p3/2
peak at 292.6 eV. By using the intensity of this peak and based on the atomic ratios of
potassium jarosite, calculations showed that around 47 at% of the analysed surface was
potassium jarosite. The Fe 2p spectra also resembled that of potassium jarosite standard with
an additional peak in the iron-oxides/oxyhydroxides region (710.8 eV). Since jarosite or any
other sulphate compound was absent from the surface of the bioleached sample at day 72
(B72), it can be concluded that the formation of bulk jarosite from day 25 in the abiotic
experiment provided seeding sites for jarosite on the surface of sample A43. By comparing
the surface of the samples B72 (no jarosite) and A43 (covered with jarosite), and considering
the equal copper dissolutions in the bioleaching and abiotic experiments between days 25 and
43, it became clear that not only the bulk jarosite but also the surface jarosite did not have any
negative effect on the copper dissolution.

56
Sulphur speciation in all the leached samples showed that the S8/Stot ratio increased as the
leaching progressed and its value was similar in the samples from bioleaching and abiotic
experiments. It seems that the growth of the elemental sulphur layer on the surface of
chalcopyrite over time was consistent and independent of the presence of sulphur oxidising
microorganisms. Despite the effective bio-oxidation of bulk elemental sulphur to sulphuric
acid in the bioleaching experiment, the surface elemental sulphur was unaffected by the
microbial activity. To investigate further, the XPS measurements on samples B72 and A7
were repeated in room temperature to allow volatilisation of the elemental sulphur. The
quantitative speciation results of S 2p spectra acquired in room temperature (given in
parenthesis in Table 4.1) showed that the majority of the elemental sulphur in both samples
remained on the surface. This shows that the surface elemental sulphur was protected by other
surface compounds. Given that there was so little of a sulphate compound in sample A7 and
no sulphate compound at all in sample B72, it was not possible that the iron-sulphate
compound solely provided effective protection of elemental sulphur. Since there was more
elemental sulphur loss in the abiotic sample compared to the bioleaching sample in the room
temperature measurements, it seems that the attachment of organic compounds originating
from the microbes on the surface played a minor role in protecting the elemental sulphur from
volatilisation in sample B72. Another surface compound that was persistently present in all
the samples was iron-hydroxide phase (probably goethite). However, the goethite on the
surfaces of samples B72 and A7 seemed to be too small (estimated at < 6 at%) for formation
of a uniform protective layer over the elemental sulphur. Therefore, it seems that there was
not a uniform layer on the surface solely responsible for sulphur preservation. The most
viable scenario was that as the leaching progressed, elemental sulphur was gradually trapped
within all the other surface compounds (including the microbial residue, surface oxidation
products and secondary compounds precipitating from the solution) in a way that it resulted in
a multi-component phase that could effectively withstand the ultra-high vacuum conditions in
the XPS analysing chamber.
To summarise, the XPS data coupled with the leaching behaviour suggests that a surface
multi-component layer composed of mainly elemental sulphur and iron-oxyhydroxide was
responsible for the hindered dissolution of chalcopyrite samples. Presence of other phases
such as iron-sulphates and jarosite depended on the leaching conditions, but their presence
(even in huge amounts in case of jarosite) did not affect the leaching efficiency. Factors
questioning this conclusion lie mostly in the reproducibility of the XPS data in regards to the

57
surface cracks, faults and impurities that locally could have promoted (or demoted) the
formation of the surface products observed in each sample and to be proven correct, more
investigation is needed. Nevertheless, the current data conclusively reject jarosite from the list
of candidates responsible for hindered chalcopyrite dissolution and considers the elemental
sulphur as the main component of the hindering layer.

58
59
5. Conclusions
The leaching experiments of the aged and fresh concentrate under identical conditions shows
that copper dissolution was significantly lower in the leaching of the aged concentrate.
Appropriate measures must be taken in laboratory investigations to produce similar initial
surface characteristics during a campaign of experiments.
Redox potential development during moderately thermophilic bioleaching experiments of a
pyritic chalcopyrite concentrate and a relatively pure chalcopyrite concentrate were
chemically/electrochemically mimicked in the absence of microorganisms for the first time. It
was shown that independent of the pyrite content, both the recovery and rate of copper
dissolution in the presence of microorganisms were the same as in their absence. The leaching
curves did not show any sign of passivation, rather they indicated a hindered dissolution.
In some of the abiotic experiments, jarosite precipitated due to a loss of control of the redox
potential. However, presence of bulk jarosite did not hamper copper recovery compared to the
bioleaching experiments where there was no bulk jarosite formation. This was observed in
experiments with the pyritic and the pure chalcopyrite concentrate.
Bio-oxidation of elemental sulphur did not have a positive effect on the leaching behaviour
compared to the abiotic experiments where bulk elemental sulphur accumulated. This might
be due to the morphology of the produced bulk elemental sulphur which existed as free
aggregates and was evenly dispersed in the residue.
It was also shown that residue containing bulk elemental sulphur and jarosite cannot be used
for XPS measurements or other surface analytical methods. Massive samples of chalcopyrite
should be used instead accompanied by measurements of copper and iron dissolution.
XPS measurements carried out on massive chalcopyrite samples revealed that common
phases on the surface of the samples leached for different durations of time were elemental
sulphur and iron-oxyhydroxides. The elemental sulphur on the surface of the samples was
bound to the surface rigidly in a way that it did not sublimate in the ultra-high vacuum
environment of the XPS spectrometer at room temperature.
Surface jarosite was observed in only one sample but no correlation between its presence and
the hindered leaching behaviour could be made. A multi-component surface layer consisting

60
of mainly elemental sulphur and iron-oxyhydroxides is considered to be responsible for the
hindered dissolution.

61
6. Future work
Proper kinetic studies in controlled redox potential conditions are missing in the literature.
Experiments on pure chalcopyrite concentrate with a specific particle size and fresh surface
should be performed in different temperatures at different levels of redox potential for
calculations of activation energies under different redox potential conditions. Accompanied
by XPS measurements, it will be possible to postulate if the passivation or hindered
dissolution is an inherent property of chalcopyrite or could be avoided under certain leaching
conditions.
It is also important to investigate chalcopyrite dissolution in conditions similar to real heap
leaching operations. Thus, laboratory scale column bioleaching experiments will be
performed to test the effect of different treatments on the extent and nature of the hindered
dissolution.
The possibility of other surface analytical methods such as AES and XANES will be
considered on samples obtained from the kinetic and column leaching experiments.

62

63
7. References
[1] ICSG. The World Copper Factbook 2013.
[2] Habashi, F. 1997. Handbook of Extractive Metallurgy (Vol. 2). WILEY-VCH. Germany.
[3] Lazaro, I. 2001. Electrochemicstry of the leaching of chalcopyrite. [PhD thesis] Murdoch University.
[4] Schlesinger, M. E., King, M. J., Sole, K. C., Davenport, W. G. 2011. Extractive Metallurgy of Copper. 5th ed. Oxford. Elsevier.
[5] House C. I. 1987. Potential-pH diagrams and their application to hydrometallurgical systems. In: Davies G. A., editor. Separation processes in hydrometallurgy. Chichester: Ellis Horwood.
[6] Rohwerder, T., Gehrke, T., Kinzler, K., Sand, W. 2003. Bioleaching review part A: Progress in bioleaching: fundamentals and mechanisms of bacterial metal sulfide oxidation. Applied Microbiology and Biotechnology 63, 239-248.
[7] Vera, M., Schippers, A., Sand, W. 2013. Progress in bioleaching: fundamentals and mechanisms of bacterial metal sulfide oxidation - Part A. Applied Microbiology and Biotechnology 97, 7529-7541.
[8] Johnson, D. B. 1998. Biodiversity and ecology of acidophilic microorganisms. FEMS Microbiology Ecology 27, 307-317.
[9] Baker, B. J., Banfield, J. F. 2003. Microbial communities in acid mine drainage. FEMS Microbiology Ecology 44, 139-152.
[10] Olson, G. J., Brierley, J. A., Brierley, C. L. 2003. Bioleaching review part B: Progress in bioleaching: applications of microbial processes by the minerals industries. Applied Microbiology and Biotechnology 63, 249-257.
[11] Watling, H. R. 2006. The bioleaching of sulphide minerals with emphasis on copper sulphides — A review. Hydrometallurgy 84, 81-108; 81.
[12] Brierley, C. L., Brierley, J. A. 2013. Progress in bioleaching: part B: applications of microbial processes by the minerals industries. Applied Microbiology and Biotechnology 97,7543-7552.
[13] Schippers, A., Sand, W. 1999. Bacterial leaching of metal sulfides proceeds by two indirect mechanisms via thiosulfate or via polysulfides and sulfur. - Applied and Environmental Microbiology 65, 319-321.
[14] Dreisinger, D. 2006. Copper leaching from primary sulfides: Options for biological and chemical extraction of copper. Hydrometallurgy 83, 10-20.

64
[15] Watling, H. R. 2013. Chalcopyrite hydrometallurgy at atmospheric pressure: 1. Review of acidic sulfate, sulfate–chloride and sulfate–nitrate process options. Hydrometallurgy 140, 163-180.
[16] Watling, H. R. 2014. Chalcopyrite hydrometallurgy at atmospheric pressure: 2. Review of acidic chloride process options. Hydrometallurgy 146, 96-110.
[17] Yoo, K., Kim, S., Lee, J., Ito, M., Tsunekawa, M., Hiroyoshi, N. 2010. Effect of chloride ions on leaching rate of chalcopyrite. Minerals Engineering 23, 471-477.
[18] Marsden, J. 2007. Medium-temperature pressure leaching of copper concentrates - Part 1: Chemistry and initial process development. Minerals and Metallurgical Processing 24, 193-204.
[19] McDonald, R. G., Muir, D. M. 2007. Pressure oxidation leaching of chalcopyrite. Part I. Comparison of high and low temperature reaction kinetics and products. Hydrometallurgy 86, 191-205.
[20] Hydrometallurgical processing of copper concentrates by Phelps Dodge at the Bagdad mine in Arizona. 2003. In ALTA copper 2003. Melbourne, Australia: ALTA Metallurgical Services.
[21] Marsden, J. 2007. Medium-temperature pressure leaching of copper concentrates - Part IV: Application at Morenci, Arizona. Minerals and Metallurgical Processing 24, 226-236.
[22] Dixon, D. G., Mayne, D. D., Baxter, K. G. 2008. Galvanox – a novel galvanically-assisted atmospheric leaching technology for copper concentrate. Canadian Metallurgical Quarterly 47, 327-336.
[23] Jones, R. T. 2006. Electronic structures of the sulfide minerals sphalerite, wurtzite, pyrite, marcasite and chalcopyrite. [PhD thesis] University of South Auustralia.
[24] Raj, D., Chandra, K., Puri, S. P. 1968. Mössbauer studies of chalcopyrite. Journal of the Physical Society of Japan 24, 39-41.
[25] Klauber, C. 2003. Fracture-induced reconstruction of a chalcopyrite (CuFeS2) surface. Surface and Interface Analysis 35, 415-428.
[26] Crundwell, F. K. 1988. The influence of the electronic structure of solids on the anodic dissolution and leaching of semiconducting sulphide minerals. Hydrometallurgy 21, 155-190.
[27] Li, Y., Kawashima, N., Li, J., Chandra, A. P., Gerson, A. R. 2013. A review of the structure, and fundamental mechanisms and kinetics of the leaching of chalcopyrite. Advances in Colloid and Interface Science 197–198, 1-32.
[28] Brion, D. 1980. Etude par spectroscopie de photoelectrons de la degradation superficielle de FeS2, CuFeS2, ZnS et PbS a l'air et dans l'eau. Applications of Surface Science 5, 133-152.
[29] Debernardi, G., Carlesi, C. 2013. Chemical-electrochemical approaches to the study passivation of chalcopyrite. Mineral Processing and Extractive Metallurgy Review 34, 10-41.
65
[30] Crundwell, F. K. 2013. The dissolution and leaching of minerals: Mechanisms, myths and misunderstandings. Hydrometallurgy 139, 132-148.
[31] Kimball, B. E., Rimstidt, J. D., Brantley, S. L. 2010. Chalcopyrite dissolution rate laws. Applied Geochemistry 25, 972-983.
[32] Dutrizac, J. 1978. The kinetics of dissolution of chalcopyrite in ferric ion media. Metallurgical Transactions B 9B, 431-439.
[33] Li, J., Kawashima, N., Kaplun, K., Absolon, V. J., Gerson, A. R. 2010. Chalcopyrite leaching: The rate controlling factors. Geochimica et Cosmochimica Acta 74, 2881-2893.
[34] Gómez, C., Figueroa, M., Muñoz, J., Blázquez, M. L., Ballester, A. 1996. Electrochemistry of chalcopyrite. Hydrometallurgy 43, 331-344.
[35] Klauber, C. 2008. A critical review of the surface chemistry of acidic ferric sulphate dissolution of chalcopyrite with regards to hindered dissolution. International Journal of Mineral Processing 86, 1-17.
[36] Buckley, A., Woods, R. 1984. An X-ray photoelectron spectroscopic study of the oxidation of chalcopyrite. Australian Journal of Chemistry 37, 2403.
[37] Holliday, R. I., Richmond, W. R. 1990. An electrochemical study of the oxidation of chalcopyrite in acidic solution. Journal of Electroanalytical Chemistry and Interfacial Electrochemistry 288, 83-98.
[38] Yin, Q., Kelsall, G. H., Vaughan, D. J., England, K. E. R. 1995. Atmospheric and electrochemical oxidation of the surface of chalcopyrite (CuFeS2). Geochimica et Cosmochimica Acta 59, 1091-1100.
[39] Nava, D., González, I. 2006. Electrochemical characterization of chemical species formed during the electrochemical treatment of chalcopyrite in sulfuric acid. Electrochimica Acta 51, 5295-5303.
[40] Mikhlin, Y. L., Tomashevich, Y. V., Asanov, I. P., Okotrub, A. V., Varnek, V. A., Vyalikh, D. V. 2004. Spectroscopic and electrochemical characterization of the surface layers of chalcopyrite (CuFeS2) reacted in acidic solutions. Applied Surface Science 225, 395-409.
[41] The mechanism of the dissolution and passivation of chalcopyrite - an electrochemical study. 2003. In Hydrometallurgy 2003: 5th International Symposium Honoring Professor Ian M. Ritchie.
[42] Holmes, P. R., Crundwell, F. K. 2013. Polysulfides do not cause passivation: Results from the dissolution of pyrite and implications for other sulfide minerals. Hydrometallurgy 139, 101-110.
[43] Hirato, T., Majima, H., Awakura, Y. 1987. The leaching of chalcopyrite with ferric sulfate. Metallurgical and Materials Transactions B 18, 489-496.

66
[44] Munoz, P., Miller, J., Wadsworth, M. 1979. Reaction mechanism for the acid ferric sulfate leaching of chalcopyrite. Metallurgical and Materials Transactions B 10, 149-158.
[45] Dutrizac, J. E. 1989. Elemental sulphur formation during the ferric sulphate leaching of chalcopyrite. Canadian Metallurgical Quarterly 28, 337-344.
[46] Sandström, Å, Shchukarev, A., Paul, J. 2004. XPS characterisation of chalcopyrite chemically and bio-leached at high and low redox potential. Minerals Engineering 18, 505-515.
[47] Parker, A. J., Paul, R. L., Power, G. P. 1981. Electrochemistry of the oxidative leaching of copper from chalcopyrite. Journal of Electroanalytical Chemistry and Interfacial Electrochemistry 118, 305-316.
[48] Fowler, T. A., Crundwell, F. K. 1998. Leaching of zinc sulfide by Thiobacillus ferrooxidans: Experiments with a controlled redox potential indicate no direct bacterial mechanism. Applied and Environmental Microbiology 64, 3570-3575.
[49] Fowler, T. A., Crundwell, F. K. 1999. Leaching of zinc sulfide by Thiobacillus ferrooxidans: Bacterial oxidation of the sulfur product layer increases the rate of zinc sulfide dissolution at high concentrations of ferrous ions. Applied and Environmental Microbiology 65, 5285-5292.
[50] Khoshkhoo, M., Dopson, M., Shchukarev, A., Sandström, Å. 2014. Electrochemical simulation of redox potential development in bioleaching of a pyritic chalcopyrite concentrate. Hydrometallurgy 144–145, 7-14.
[51] Dutrizac, J. E. 1983. Factors affecting alkali jarosite precipitation. Metallurgical Transactions B 14, 531-539.
[52] Dutrizac, J. E. 1996. The effect of seeding on the rate of precipitation of ammonium jarosite and sodium jarosite. Hydrometallurgy 42, 293-312.
[53] Parker, A. D. 2008. Oxidative dissolution of chalcopyrite in ferric Media: An X-ray photoelectron spectroscopy study. [PhD thesis] Curtin University of Technology.
[54] Kametani, H., Aoki, A. 1985. Effect of suspension potential on the oxidation rate of copper concentrate in a sulfuric acid solution. Metallurgical and Materials Transactions B 16, 695-705.
[55] Hiroyoshi, N., Miki, H., Hirajima, T., Tsunekawa, M. 2000. A model for ferrous-promoted chalcopyrite leaching. Hydrometallurgy 57, 31-38.
[56] Hiroyoshi, N., Miki, H., Hirajima, T., Tsunekawa, M. 2001. Enhancement of chalcopyrite leaching by ferrous ions in acidic ferric sulfate solutions. Hydrometallurgy 60, 185-197.
[57] Hiroyoshi, N., Kuroiwa, S., Miki, H., Tsunekawa, M., Hirajima, T. 2004. Synergistic effect of cupric and ferrous ions on active-passive behavior in anodic dissolution of chalcopyrite in sulfuric acid solutions. Hydrometallurgy 74, 103-116.

67
[58] Hiroyoshi, N., Tsunekawa, M., Okamoto, H., Nakayama, R., Kuroiwa, S. 2008.Improved chalcopyrite leaching through optimization of redox potential. Canadian Metallurgical Quarterly 47, 253-258.
[59] Koleini, S. M. J., Aghazadeh, V., Sandström, A. 2011. Acidic sulphate leaching of chalcopyrite concentrates in presence of pyrite. Minerals Engineering 24, 381-386.
[60] Tshilombo, A. F. 2004. Mechanism and kinetics of chalcopyrite passivation and depassivation during ferric and microbial leaching. [PhD Thesis] UBC.
[61] Dutrizac, J. E., MacDonald, R. J. C. 1973. The effect of some impurities on the rate of chalcopyrite dissolution. Canadian Metallurgical Quarterly 12, 409-420.
[62] Mehta, A. P., Murr, L. E. 1983. Fundamental studies of the contribution of galvanic interaction to acid-bacterial leaching of mixed metal sulfides. Hydrometallurgy 9, 235-256.
[63] Hiroyoshi, N., Hirota, M., Hirajima, T., Tsunekawa, M. 1997. A case of ferrous sulfate addition enhancing chalcopyrite leaching. Hydrometallurgy 47, 37-45.
[64] Hiroyoshi, N., Hirota, M., Hirajima, T., Tsunekawa, M. 1999. Inhibitory effect of iron-oxidizing bacteria on ferrous-promoted chalcopyrite leaching. Biotechnology and Bioengineering 64, 478-483.
[65] Gómez, E., Blázquez, M. L., Ballester, A., González, F. 1996. Study by SEM and EDS of chalcopyrite bioleaching using a new thermophilic bacteria. Minerals Engineering 9, 985-999.
[66] Crundwell, F. K. 2003. How do bacteria interact with minerals? Hydrometallurgy 71, 75-81.
[67] Harvey, P. I., Crundwell, F. K. 1997. Growth of Thiobacillus ferrooxidans: a novel experimental design for batch growth and bacterial leaching studies. Applied and Environmental Microbiology 63, 2586-2592.
[68] Fowler, T. A., Holmes, P. R., Crundwell, F. K. 1999. Mechanism of pyrite dissolution in the presence of Thiobacillus ferrooxidans. Applied and Environmental Microbiology 65, 2987-2993.
[69] Dopson, M., Lindström, E. B. 2004. Analysis of community composition during moderately thermophilic bioleaching of pyrite, arsenical pyrite, and chalcopyrite. Microbial Ecology 48, 19-28.
[70] Hazeu, W., Batenburg-van, d. V., Bos, P., Pas, R. K., Kuenen, J. G. 1988. The production and utilization of intermediary elemental sulfur during the oxidation of reduced sulfur compounds by Thiobacillus ferrooxidans. Archives of Microbiology 150, 574-579.
[71] Shchukarev, A. 2006. XPS at solid–aqueous solution interface. Advances in Colloid and Interface Science 122, 149-157.

68
[72] Parker, A., Klauber, C., Kougianous, A., Watling, H. R., van Bronswijk, W. 2003. An X-ray photoelectron spectroscopy study of the mechanism of oxidative dissolution of chalcopyrite. Hydrometallurgy 71, 265-276.
[73] Baer, D. R., Engelhard, M. H., Gaspar, D. J., Lea, A. S., Windisch, C. F. 2002. Use and limitations of electron flood gun control of surface potential during XPS: two non-homogeneous sample types. Surface and Interface Analysis 33, 781-790.
[74] Acres, R. G., Harmer, S. L., Shui, H. W., Chen, C., Beattie, D. A. 2011. Synchrotron scanning photoemission microscopy of homogeneous and heterogeneous metal sulfide minerals. Journal of Synchrotron Radiation 18, 649-657.
[75] Smart R. C., Amarantidis J., Skinner W., Prestidge C., Vanier L., Grano S. 2003. Surface Analytical Studies of Oxidation and Collector Adsorption in Sulfide Mineral Flotation. In: Wandelt K., Thurgate S., editors. Solid-Liquid Interfaces. : Springer Berlin Heidelberg.
[76] Córdoba, E. M., Muñoz, J. A., Blázquez, M. L., González, F., Ballester, A. 2009. Passivation of chalcopyrite during its chemical leaching with ferric ion at 68 °C. Minerals Engineering 22, 229-235.
[77] Mielczarski, J. A., Cases, J. M., Alnot, M., Ehrhardt, J. 1996. XPS characterization of chalcopyrite, tetrahedrite, and tennantite surface products after different conditioning. 1. Aqueous solution at pH 10. Langmuir 12, 2519-2530.
[78] Farquhar, M. L., Wincott, P. L., Wogelius, R. A., Vaughan, D. J. 2003. Electrochemical oxidation of the chalcopyrite surface: an XPS and AFM study in solution at pH 4. Applied Surface Science 218, 34-43.

Paper I
Electrochemical simulation of redox potential development in bioleaching of a pyritic
chalcopyrite concentrate
Mohammad Khoshkhoo, Mark Dopson, Andrey Shchukarev and Åke Sandström
Hydrometallurgy 144-145 (2014), p 7-14

Paper II
Chalcopyrite leaching and bioleaching: An X-ray photoelectron spectroscopic (XPS)
investigation on the nature of hindered dissolution
Mohammad Khoshkhoo, Mark Dopson, Andrey Shchukarev and Åke Sandström
Submitted to Hydrometallurgy