The dissolution of chalcopyrite in chloride solutions ...
26
The dissolution of chalcopyrite in chloride solutions. Part 1. The effect of solution potential Lilian Vel´ asquez-Y´ evenes, Michael Nicol, Hajime Miki PII: S0304-386X(10)00058-7 DOI: doi: 10.1016/j.hydromet.2010.03.001 Reference: HYDROM 3149 To appear in: Hydrometallurgy Received date: 26 January 2010 Revised date: 2 March 2010 Accepted date: 3 March 2010 Please cite this article as: Vel´asquez-Y´ evenes, Lilian, Nicol, Michael, Miki, Hajime, The dissolution of chalcopyrite in chloride solutions. Part 1. The effect of solution potential, Hydrometallurgy (2010), doi: 10.1016/j.hydromet.2010.03.001 This is a PDF file of an unedited manuscript that has been accepted for publication. As a service to our customers we are providing this early version of the manuscript. The manuscript will undergo copyediting, typesetting, and review of the resulting proof before it is published in its final form. Please note that during the production process errors may be discovered which could affect the content, and all legal disclaimers that apply to the journal pertain. brought to you by CORE View metadata, citation and similar papers at core.ac.uk provided by Research Repository
Transcript of The dissolution of chalcopyrite in chloride solutions ...
�������� ����� ��
The dissolution of chalcopyrite in chloride solutions. Part 1. The effect ofsolution potential
Lilian Velasquez-Yevenes, Michael Nicol, Hajime Miki
PII: S0304-386X(10)00058-7DOI: doi: 10.1016/j.hydromet.2010.03.001Reference: HYDROM 3149
To appear in: Hydrometallurgy
Received date: 26 January 2010Revised date: 2 March 2010Accepted date: 3 March 2010
Please cite this article as: Velasquez-Yevenes, Lilian, Nicol, Michael, Miki, Hajime, Thedissolution of chalcopyrite in chloride solutions. Part 1. The effect of solution potential,Hydrometallurgy (2010), doi: 10.1016/j.hydromet.2010.03.001
This is a PDF file of an unedited manuscript that has been accepted for publication.As a service to our customers we are providing this early version of the manuscript.The manuscript will undergo copyediting, typesetting, and review of the resulting proofbefore it is published in its final form. Please note that during the production processerrors may be discovered which could affect the content, and all legal disclaimers thatapply to the journal pertain.
brought to you by COREView metadata, citation and similar papers at core.ac.uk
provided by Research Repository
ACC
EPTE
D M
ANU
SCR
IPT
ACCEPTED MANUSCRIPT
The dissolution of chalcopyrite in chloride solutions. Part 1. The effect of solution potential
Lilian Velásquez-Yévenes a, Michael Nicol b, Hajime Miki b
a Department of Metallurgical Engineering, Universidad Católica del Norte, Antofagasta, Chile b Parker Centre, Faculty of Minerals and Energy, Murdoch University, Perth, WA 6150, Australia Abstract A study of the dissolution of several copper concentrates under controlled
potential conditions in chloride solutions has demonstrated that the rate of dissolution
of chalcopyrite is strongly dependent on the potential of the solution. Linear rates
were obtained for the dissolution of chalcopyrite in solutions containing 0.2 M HCl
and 0.5 g L-1 Cu(II) at 35 °C. The rate is enhanced within a range of potentials of 550
to 620 mV (versus SHE) and the presence of dissolved oxygen is essential for
enhanced rates within this potential window. Even though dissolved oxygen is
important in order to achieve acceptable rates of dissolution, excessive oxidation can
increase the potential into a region in which passivation is possible.
Reduction of the potential into the optimum region results in restoration of
enhanced rates of dissolution. On the other hand, dissolution at low potentials (< 540
mV) results in reduced rates of copper dissolution which increase significantly when
the potential is subsequently increased to above 580 mV. Mineralogical studies have
shown that chalcopyrite remains un-leached and small amounts of covellite appear to
be formed on the surface of the chalcopyrite at low potentials. All concentrates appear
to dissolve at roughly the same rate under the same conditions, despite differences in
the composition and mineralogy of the samples.
Keywords: Chalcopyrite; Chloride leaching rates; Controlled potential, Mineralogy; Passivation
ACC
EPTE
D M
ANU
SCR
IPT
ACCEPTED MANUSCRIPT
1. Introduction The dissolution of sulfide minerals and, in particular, that of chalcopyrite are
potential-dependent reactions and many studies have been carried out in order to
establish the relationship between the solution potential and the leaching rate. In the
context of leaching under ambient conditions that are appropriate to heap or dump
leaching, it is now well known that the leaching rate of chalcopyrite in sulfate
solutions is dependent on the potential and that the rate is enhanced in a certain
potential range (Nicol and Lazaro, 2002). Conventional mixed-potential theory for
dissolution does not appear to apply to the leaching of chalcopyrite under these
conditions.
Several studies have been devoted to the elucidation of the potentials at which
dissolution is possible and that at which apparent passivation occurs. Thus, Nicol and
Lázaro (2002) used electrochemical and chemical experiments to establish the
relevant leaching potential region as being 0.45 to 0.75 V under appropriate
experimental conditions. However, few actual dissolution studies have been
conducted under controlled potential conditions, particularly in chloride media
(Hiroyoshi et al., 2000; Rivera-Velasquez et al., 2006; Third et al., 2002). In addition,
several studies have focused on enhanced dissolution at low redox potentials (Hackl et
al., 1995; Hiroyoshi et al., 2000) and a reaction model to explain the phenomenon has
been proposed (Hiroyoshi et al., 1997; 2001; 2000).
Preliminary experiments showed that it is not possible to maintain constant
potential conditions throughout the duration of a leach test due to continuous changes
in variables such as pH, chloride and iron and copper concentrations. In order to
develop an ambient temperature process for successful heap leaching of chalcopyrite

ACC
EPTE
D M
ANU
SCR
IPT
ACCEPTED MANUSCRIPT
in a chloride or chloride–sulfate system it is not only appropriate to establish the
boundaries of the potential range required for adequate leaching but it is also
necessary to develop and implement strategies for the control of the potential if
required.
This paper, which is the first of three, starts by defining the conditions and the
potential range for optimum chalcopyrite leaching using three different potential
control systems i.e. electrochemical, chemical and gaseous. The results of
experiments to establish whether chalcopyrite concentrates from different localities
leach at different rates under the same conditions will be presented without any
detailed interpretation or discussion. The second paper will deal with the effects of
various parameters on the rate of dissolution of chalcopyrite under controlled
potential conditions. The final paper will discuss the experimental results obtained in
the first two parts and will present additional information in support of a novel
interpretation of all the data and will suggest alternative mechanisms for the enhanced
leaching process which are consistent with the experimental observations.
2. Experimental
2.1. Materials and procedures
Chalcopyrite concentrates were obtained by flotation from several operations in
Chile and the USA and a relatively pure massive sample of chalcopyrite was obtained
from the OK Tedi mine. Because of the fact that dry screening of the concentrates
produced significant amounts of agglomerated fine material that made comparisons of
the relative leach rates difficult, the procedure included wet screening of each
concentrate to obtain a well-defined chalcopyrite size fraction. Most experiments

ACC
EPTE
D M
ANU
SCR
IPT
ACCEPTED MANUSCRIPT
were carried out with -38+25 µm or -38 µm size fractions. The chemical analyses of
the screened samples are shown in Table 1 and mineralogical data obtained from
mineral liberation analyses (MLA) for three of the four concentrates are presented in
Table 2.
2.2. Leaching experiments
Agitated leaching experiments were carried out in instrumented reactors
constructed at Murdoch University. The baffled cylindrical glass reactors have a
volume of 1000 cm3 and are sealed with a multi-port PVC lid on which is mounted a
stirrer motor with a titanium impeller. The lid has ports for ORP and chalcopyrite
electrodes and nitrogen or oxygen gas inlets. The reactor is enclosed in a temperature-
controlled PVC surround. Unless stated otherwise, the leach experiments were
conducted with several concentrates and the mass of material used was adjusted to
provide approximately 3 g of copper in 900 cm3 of a solution containing 0.2 M HCl
and 0.5 g L-1 of Cu (II) at 35 °C at a stirring speed of 800 rpm. As will be shown in
the second paper of this series, these conditions were selected as being an appropriate
compromise between optimum conditions and those most likely to be economically
possible in a heap leach process.
During each test, liquid samples were withdrawn periodically after compensating
for evaporation by the addition of distilled water and settling of suspended solids for
approximately 30 min. An equal volume of the lixiviant was added to replace that
removed in the sample. The samples were filtered (0.2 µm) prior to analysis for
copper, total iron and in some cases silver using atomic absorption spectrometry
(AAS). When solid samples were required, a slurry sample was collected from the

ACC
EPTE
D M
ANU
SCR
IPT
ACCEPTED MANUSCRIPT
reactor and vacuum filtered. The solid was washed and dried in air. The dried solid
samples were sent to the Newcastle Technology Centre of BHP Billiton for MLA
analysis and microscopic examination.
The solution potentials were monitored using a platinum ring electrode with a
combined Ag/AgCl reference electrode (3 M KCl). In some cases the mixed potential
was also measured using a chalcopyrite electrode/reference electrode combination.
The electrodes were connected to high impedance analogue input channels on a
National Instruments data acquisition board controlled by LabviewTM software. A
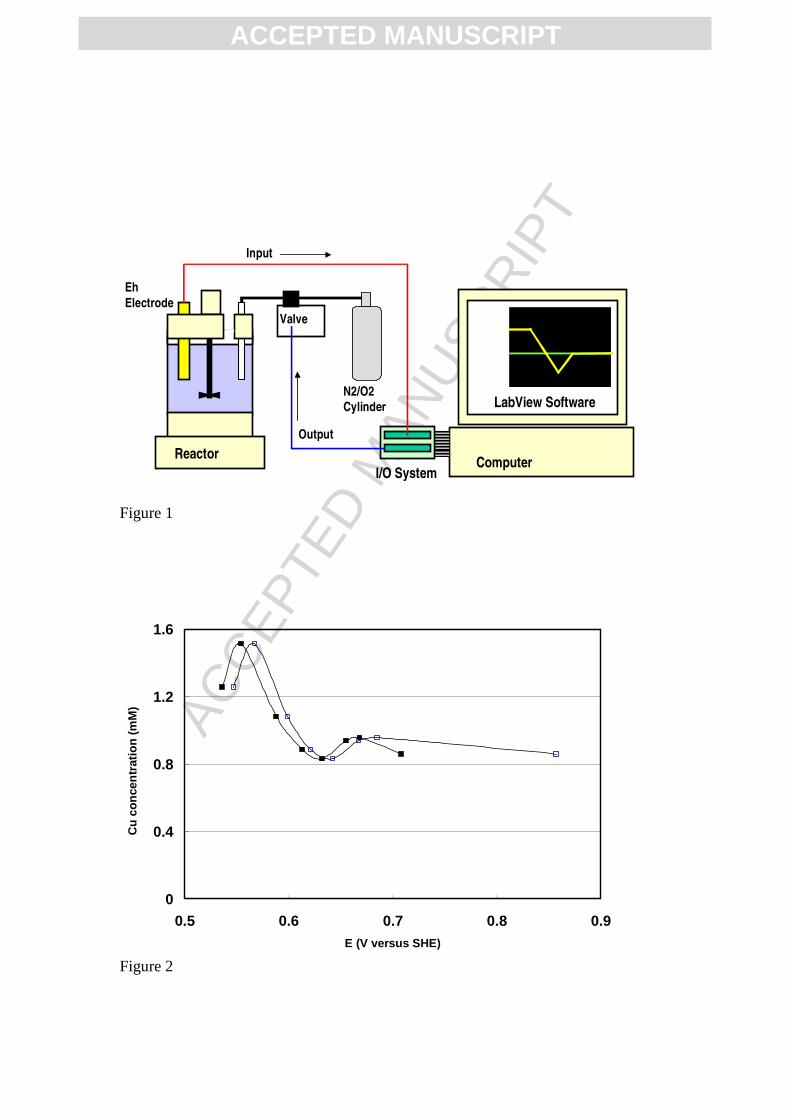
schematic of the potential control system used with injection of nitrogen or oxygen
gas is shown in Figure 1. A similar system was used for electrochemical control
which consisted of two platinum electrodes in the slurry. The anode is used to oxidise
copper(I) and/or iron(II) and the cathode is separated from the leaching solution by a
fritted glass disk sealed into the bottom of the cathode compartment which initially
only contained acid. Passage of an appropriate current between these electrodes
enabled the potential of the ORP electrode to be controlled to a set value. An
alternative potential control system involving the addition of an oxidant, in this case,
0.2 M permanganate to the reactor using a Metrohm titration unit linked to the
measured solution potential was also used.
Daily measurements of pH and the dissolved oxygen concentration in the reactor
were made manually. In most experiments with those concentrates that contained
predominantly chalcopyrite, the fraction of copper dissolved at any time was very
similar to that of iron except at pH values above about 1.5 in which case precipitation
of some iron was observed.
ACC
EPTE
D M
ANU
SCR
IPT
ACCEPTED MANUSCRIPT
3. Results and discussion
Preliminary experiments were based on a published (Hiroyoshi et al, 2001) simple
experimental technique in which small amounts of the mineral sample were leached in
aerated shake flasks without any attempt to control the potential, other than the initial
value which was varied by changing the iron(II)/iron(III) ratio. The results shown in
Figure 2 confirmed the potential dependence of the rate of dissolution of chalcopyrite
in that greater rates are observed at potentials between about 530 and 580 mV. These
experiments were conducted over a short term, during which only a small fraction of
the mineral was dissolved, and the results do not reflect the relative rates under more
appropriate conditions.
Several additional experiments were therefore conducted with Concentrate 1 in
aerated agitated reactors without control of the potential. In particular, the effect of
the addition of ferric ions on the rate of dissolution was investigated. The results of
two such experiments are shown in Figure 3. It is apparent that the rate of dissolution
in a dilute chloride solution at low pH is significantly greater than that in the presence
of ferric ions. The measured potentials of the solution during these experiments are
also shown and confirm the detrimental effect of high (greater than about 650mV)
potentials on the rate. Thus, conventional wisdom that ferric ions are suitable as an
oxidant in this system and that increased potentials are desirable under these
conditions is not correct.
ACC
EPTE
D M
ANU
SCR
IPT
ACCEPTED MANUSCRIPT
3.1. Electrochemical control of the potential
The electrochemical control system was used to investigate the effect of potential
on the rate of dissolution of Concentrate1. Four experiments were carried out in the
instrumented reactors using de-aerated solutions at various potential set-points under
otherwise standard conditions. The results are shown in Figure 4. It is apparent that
the rate of dissolution of chalcopyrite is low by comparison with the results of Figure
3 with a maximum of about 10% dissolved after 600 h.
Three further experiments were conducted in which the potential was
electrochemically controlled at 580 mV while the slurry was sparged with nitrogen,
air or oxygen. The results are shown in Figure 5. The dissolved oxygen concentrations
were maintained approximately constant at about 12 mg L-1 in the oxygen case and 5
mg L-1 in the case of the air-sparged reactor. The rate of dissolution is obviously
strongly dependent on the presence of dissolved oxygen but is relatively insensitive to
the concentration in the range 5 to 12 mg L-1. As a result of this observation, the use
of electrochemical control was discontinued and control of the potential by injection
of the appropriate gas was subsequently employed.
3.2. Control of the potential by addition of oxygen
As a result of the need to have some dissolved oxygen present in the leach
solution, it was decided to modify the control system to one which varies the amount
of air or oxygen injected into the leach pulp. Experiments were carried out at various
potentials on Concentrate 1 under standard conditions. The results presented in Figure
6 confirm the importance of dissolved oxygen in that, at the appropriate potentials,
over 90% dissolution was achieved after 1200 h. The results also demonstrate that
ACC
EPTE
D M
ANU
SCR
IPT
ACCEPTED MANUSCRIPT
enhanced rates of leaching can be achieved in the potential window of about 560-600
mV with significantly lower rates at 540 and 620 mV. The reduction in rate at the low
potential is due to the enhanced stability of covellite (CuS) at potentials below about
550 mV under these conditions while passivation of chalcopyrite occurs at potentials
above about 620 mV - as will be discussed in a subsequent paper. Of interest is the
relatively constant rate of dissolution that is observed in most experiments even up to
80% dissolution. It should be noted that the initial relatively rapid dissolution of about
5-7% of the copper in these and subsequent experiments with Concentrate1 is due to
the greater reactivity of small amounts of bornite in the concentrate (Table 2).
3.3. Chemical control of the potential
One experiment was conducted in which the potential was controlled by injection
of permanganate into the leach slurry of Concentrate 3 which was de-aerated by
sparging with nitrogen. The results are shown in Figure 7 which also shows the
corresponding curve for the dissolution of this concentrate under conditions of oxygen
control. This result reconfirms the importance of dissolved oxygen and also that the
phenomenon also applies to chalcopyrite from a different source. The role of
dissolved oxygen will be discussed in a subsequent paper but it should be pointed out
that enhanced rates are only observed when dissolved oxygen is present together with
an oxidant such as copper(II) or iron(II) ions.
ACC
EPTE
D M
ANU
SCR
IPT
ACCEPTED MANUSCRIPT
3.4. Reversibility of operation outside the potential window
3.4.1. Effect of high potentials
The above results have shown that at potentials above about 620 mV, the rate of
dissolution decreases substantially. It is probable that this is due to the so-called
passivation of chalcopyrite which has been previously observed from both dissolution
and electrochemical studies (Nicol and Lazaro, 2003). In a practical implementation
of controlled potential leaching, it would be desirable if passivation could be reversed
by reduction of the potential into the operating window. Experiments were therefore
conducted during which the potential was controlled initially at 650 mV and, after a
period at this potential, it was reduced to 580 mV.
The results for experiments carried out with Concentrate 3 at both 25 and 50 oC
are shown in Figure 8. The significantly higher rate at 580 mV at 50oC than at 25oC
suggests a large activation energy for the dissolution reaction. It is apparent that slow
passivation occurs at a potential of 650 mV even at 50 oC with the rate becoming
almost zero after about 500 h. Reduction of the potential after 700 h results in
restoration of the rate normally observed within the potential window. Similarly, the
much slower rate at 25 oC at 650 mV increases to the normal rate at 580 mV when the
potential is reduced after 1400 h. These results have shown that the reactions
responsible for passivation are reversible. The relatively slow onset of passivation at
elevated temperatures is at least a partial explanation for the fact that finely milled
chalcopyrite can be effectively leached under relatively mild conditions.
3.4.2. Effect of low potentials Two tests were carried in order to establish the extent to which chalcopyrite
dissolves at low potentials (450 mV) and whether a subsequent increase in potential
ACC
EPTE
D M
ANU
SCR
IPT
ACCEPTED MANUSCRIPT
results in similar or enhanced rates over those observed in the optimum potential
window. The tests were carried out under otherwise standard conditions using
nitrogen to maintain the low potentials. The results are shown in Figure 9 from which
it is apparent that the test at low potential showed negligible dissolution of copper
until the potential was increased to 550 mV after 940 h. It is clear that the rate on
increasing the potential is similar to that observed under standard conditions i.e. there
does not appear to be any net advantage in carrying out a 2-stage process with the first
involving reducing conditions. Solid samples for mineralogical analysis were taken
just before increasing the potential and on completion of the tests.
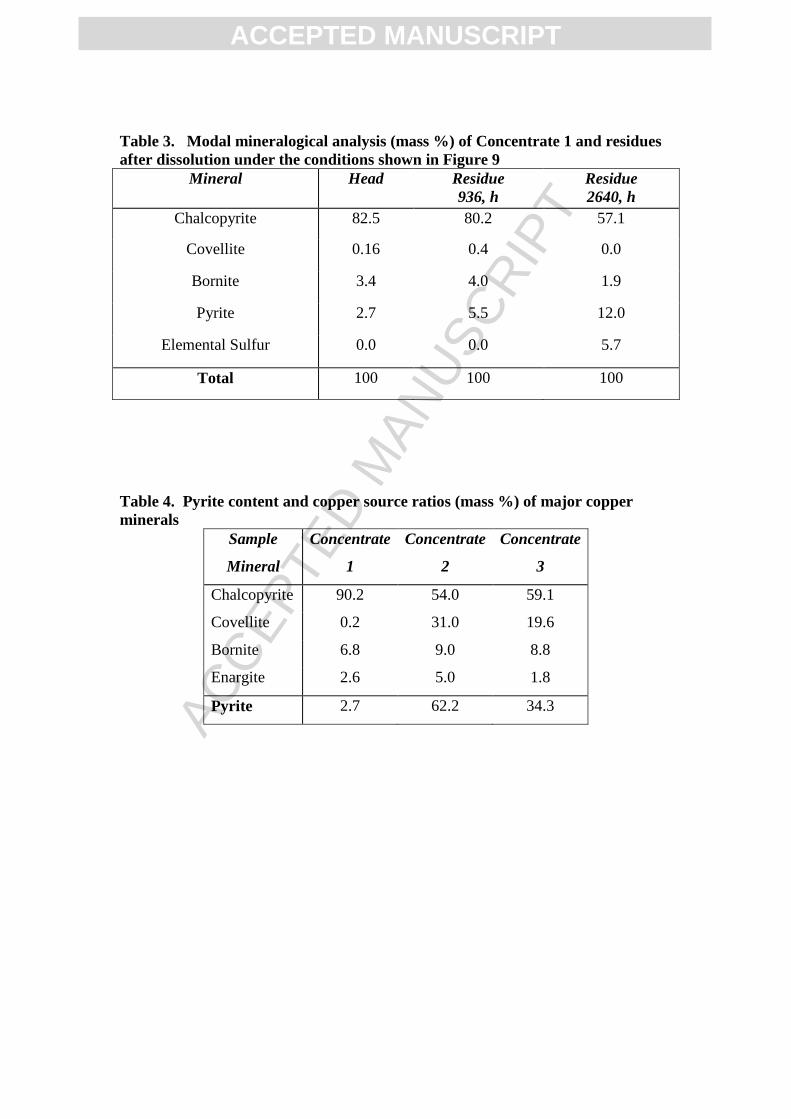
Figure 10 shows an optical micrograph of a reacted chalcopyrite particle removed
after 936 h in this experiment. There is obvious conversion of chalcopyrite to covellite
and small amounts of chalcocite. The results of mineralogical analyses of the head
and residue samples from this test as estimated from a MLA investigation are
presented in Table 3. As shown, the chalcopyrite content is slightly reduced after 936
h at low potential while there appears to be an increase in the content of covellite and
bornite suggesting that chalcopyrite could have been reduced to these copper sulfides.
After 2640 h, the amount of chalcopyrite and bornite has decreased while there is a no
detectable covellite, but increased amounts of sulfur in the residue. It should be
pointed out that the method of preparation of the polished sections can result in
significant losses of elemental sulfur globules and that the amounts analyzed are
therefore lower limits only.
The mineral maps (not shown) show that most of the un-reacted chalcopyrite is
present as liberated particles with a few particles rimmed by elemental sulfur. In
addition, it was interesting to observe the occurrence of sulfur as isolated and
relatively large globules suggesting that the formation of elemental sulfur occurs by
ACC
EPTE
D M
ANU
SCR
IPT
ACCEPTED MANUSCRIPT
precipitation from a dissolved sulfur species as has been previously suggested
(Dutrizac, 1990; Schippers and Sand, 1999). This aspect will be dealt with in more
detail in a later paper in this series.
3.5. Dissolution of chalcopyrite concentrates from different sources
A number of leach experiments were carried out using each of the
concentrates described in Tables 1 and 2. The experiments were conducted with the
+25-38 µm size fraction for Concentrate 1 and with the -38 µm fraction with the other
samples due to the limited amounts of these concentrates available.
3.5.1. Mineralogy
The various samples of screened concentrates were analyzed chemically and
mineralogically with the results given in Tables 1 and 2. The silver content of the
various samples ranged from 50 to 10 ppm and this is of potential interest since
soluble silver is known to accelerate the dissolution of chalcopyrite (Hiroyoshi et al.,
2002; Hiroyoshi et al., 2007; Parker et al., 2003; Yuehua et al., 2002). It is apparent
that the Concentrate1 is the highest grade with respect to chalcopyrite and although
data for Concentrate 4 was limited to chemical analysis for copper and iron only,
mineralogical analyses of another sample from the same source indicated the presence
of chalcopyrite and pyrite as the only measurable sulfide minerals. The other two
materials contained significant proportions of the copper as other copper sulfides, as
shown by the copper source ratios (percentage of copper present in the form of each
mineral) in Table 4. The MLA analyses showed that the chalcopyrite particles are
ACC
EPTE
D M
ANU
SCR
IPT
ACCEPTED MANUSCRIPT
mostly liberated in all samples with only small amounts associated with other
minerals.
3.5.2. Leaching experiments
Each of the chalcopyrite samples was leached at a controlled potential of 580
mV using the nitrogen/air control system under standard conditions i.e., 0.2 M HCl
and 0.5 g L-1 Cu(II) at 35 °C. Figure 11 summarizes the leaching curves, which are
approximately linear with remarkably similar rates for all concentrates. This confirms
other work conducted under different conditions (Dutrizac, 1982). The initial
relatively rapid rate of dissolution in some cases is due to the greater reactivity of the
secondary copper sulfide minerals present mainly in Concentrates 2 and 3.
Chemical analyses of some of the residues gave values of the extent of
dissolution of copper that were consistent with those calculated from the
corresponding solution concentrations. In some cases, depending on the pH during the
latter stages of leaching, precipitation of iron was observed which resulted in lower
extraction of iron into solution. However, this did not appear to affect the rate of
dissolution of copper.
4. Conclusions
Leaching experiments under controlled potential and standard conditions have
demonstrated that the rate of dissolution of chalcopyrite is potential dependent and the
presence of dissolved oxygen is essential for enhanced rates. However, it appears that
the rate is not strongly dependent on the oxygen concentration in the range 5 to 15 mg
L-1. The linear rate of dissolution of chalcopyrite from several concentrates in chloride

ACC
EPTE
D M
ANU
SCR
IPT
ACCEPTED MANUSCRIPT
solutions under standard conditions with a solution of 0.2 M HCl with 0.5 g L-1
copper(II) at 35 °C is enhanced within a range of potentials of 550 to 620 mV
(potential window).
Even though dissolved oxygen is important in order to achieve acceptable
rates of dissolution, an excess of oxygen can increase the potential into a region in
which passivation is possible. Initial leaching at potentials above 630 mV for
extended periods results in low rates that are increased when the potential is
subsequently reduced to 580 mV. Therefore, it appears that the “passivation” is
reversible.
On the other hand, leaching at low potential (<540 mV) results in reduced
rates of copper dissolution which increase significantly when the potential is
subsequently increased to above 580 mV. Mineralogical studies have shown that
chalcopyrite remains un-leached and small amounts of covellite and chalcocite appear
to be formed on the surface of the chalcopyrite under these conditions suggesting the
possibility of a two stage process in which chalcopyrite is converted to a more
reactive secondary copper sulfide. However, the overall rate in this two-stage process
appears to be similar to that achieved by operation as a single stage within the
potential window.
All concentrates studied appear to dissolve at roughly the same rate under the
same conditions, despite differences in the composition and mineralogy of the
concentrate samples.
ACC
EPTE
D M
ANU
SCR
IPT
ACCEPTED MANUSCRIPT
5. Acknowledgements
The authors would like to acknowledge the financial support from BHP Billiton,
Universidad Católica del Norte and the Parker Centre. Thanks also to Dr Puru Shrestha
and his mineralogy team at BHP Billiton for their excellent mineralogical support of
this project.
6. References
Dutrizac, J.E., 1982. Ferric ion leaching of chalcopyrite from different localities.
Metallurgical Transactions B, 13B: 303-309.
Dutrizac, J.E., 1990. Elemental sulphur formation during the ferric chloride leaching
of chalcopyrite. Hydrometallurgy, 23: 153-176.
Elsherief, A.E., 2002. The influence of cathodic reduction, Fe2+ and Cu2+ ions on the
electrochemical dissolution of chalcopyrite in acidic solution. Minerals
Engineering, 15: 215-223.
Hackl, R.P., Dreisinger, D.B., Peters, E., King, J.A., 1995. Passivation of chalcopyrite
during oxidative leaching in sulfate media. Hydrometallurgy, 39: 25-48.
Hiroyoshi, N., Hirota, M., Hirajima, T., Tsunekawa, M., 1997. A case of ferrous
sulfate addition enhancing chalcopyrite leaching. Hydrometallurgy, 47, 37-45
Hiroyoshi, N., Miki, H., Hirajima, T., Tsunekawa, M., 2000. A model for ferrous-
promoted chalcopyrite leaching. Hydrometallurgy, 57: 31-38.
Hiroyoshi, N., Maeda, H., Miki, H., Hirajima, T., Tsunekawa, M., 2001.
Enhancement of chalcopyrite leaching by ferrous ions in acidic ferric sulfate
solutions. Hydrometallurgy, 60: 185-197.
ACC
EPTE
D M
ANU
SCR
IPT
ACCEPTED MANUSCRIPT
Hiroyoshi, N., Arai, M., Miki, H., Tsunekawa, M., Hirajima, T., 2002. A new reaction
model for the catalytic effect of silver ions on chalcopyrite leaching in sulfuric
acid solutions. Hydrometallurgy, 63: 257-267.
Hiroyoshi, N., Kuroiwa, S., Miki, H., Tsunekawa, M., Hirajima, T., 2007. Effects of
co-existeing metal ions on the redox potential dependence of chalcopyrite
leaching in sulfuric acid solutions. Hydrometallurgy, 87(1-2): 1-10.
Nicol, M.J., Lazaro, I., 2002. The role of Eh measurements in the interpretation of the
kinetics and mechanism of the oxidation and leaching of sulphide minerals.
Hydrometallurgy, 63: 15-22.
Parker, A., Klauber, C., Kougianos, A., Watling, H.R., van Bronswijk, W., 2003. An
X-ray photoelectron spectroscopy study of the mechanism of oxidative
dissolution of chalcopyrite. Hydrometallurgy, 71: 265-276.
Rivera-Vasquez , B., Viramontes-Gamboa, G., Dixon, D.G., 2006. Leaching of
chalcopyrite concentrates in acid ferric sulfate media at controlled redox
potential. In: E.M. Domic and J.M. Casas de Prada (Editors), HydroProcess
2006, International Workshop on Process Hydrometallurgy. GEGAMIN,
Santiago, Chile, pp. 287-299.
Schippers, A., Sand, W., 1999. Bacterial leaching of metal sulfides proceeds by two
indirect mechanisms via thiosulfate or via polysulfides and sulfur. Applied and
Environmental Microbiology, 65: 319-321
Third, K.A., Cord-Ruwisch, R., Watling, H.R., 2002. Control of the redox potential
by oxygen limitation improves bacterial leaching of chalcopyrite.
Biotechnology and Bioengineering, 78: 433-441.
Yuehua, H., Guanzhou, Q., Jun, W., Dianzuo, W., 2002. The effect of silver-bearing
catalysts on bioleaching of chalcopyrite. Hydrometallurgy, 64: 81-88.

ACC
EPTE
D M
ANU
SCR
IPT
ACCEPTED MANUSCRIPT
Figures
Figure 1 Schematic of the potential control system
Figure 2 The effect of solution potential on the extent of copper dissolution
from the mineral sample after 24 h in a solution of 1 M chloride, 0.1 M H2SO4 and
0.01 M Fe(III). (�) Initial potential, (�) Final potential
Figure 3 Copper dissolution from Concentrate 1 in a solution of 10g/L chloride
at pH 0.5 and 20oC in the absence (�) of iron(III) and in the presence (�) of 10g/L
iron(III). Also shown are the corresponding potentials(----) during the experiment.
Figure 4 Copper dissolution from Concentrate 1 in a solution of 0.2 M HCl and
0.5 g L-1 copper(II) under electrochemical control. (�) 560 mV, (•) 580 mV, (�) 600
mV and (♦) 610 mV.
Figure 5 Copper dissolution from Concentrate 1 in a solution of 0.2 M HCl and
0.5 g L-1 copper(II) at 35 oC under electrochemical control with sparging of (�)
nitrogen, (•) oxygen, (�) air.
Figure 6 Copper dissolution from Concentrate 1 in a solution of 0.2M HCl and
0.5 g L-1 copper(II) at 35 °C under air control. (�) 540 mV (•) 560 mV, (×) 580 mV,
(♦) 600 mV and (�) 620 mV.
ACC
EPTE
D M
ANU
SCR
IPT
ACCEPTED MANUSCRIPT
Figure 7 Copper dissolution from Concentrate 1 in a solution of 0.2 M HCl and
0.5 g L-1 copper(II) at 35 °C at a controlled potential of 580 mV using (�) oxygen
and (•) permanganate.
Figure 8. Reversibility of passivation of copper dissolution from Concentrate 3
under air control. (∆) 1 M HCl + 0.5 g L-1 copper(II) at 50 oC and 580 mV, (�) 1 M
HCl + 0.5 g L-1 copper(II) at 50 oC and 650 mV/550 mV, (�) 0.2 M HCl + 0.5 g L-1
copper(II) at 25 oC and 650 mV/550 mV.
Figure 9. Dissolution of copper from Concentrate 1 in a solution of 0.2 M HCl
and 0.5 g L-1 copper(II) at 35 oC and (�) 580 mV and (�) 450 mV with potential
increased to 550 mV after 936 h.
Figure 10. Optical micrograph showing the conversion of chalcopyrite (yellow) in
Concentrate 1 to covellite and chalcocite after 936 h at 450 mV. Conditions as in
Figure 9.
Figure 11. Dissolution of copper from chalcopyrite concentrates from different
localities in 0.2 M HCl and 0.5 g L-1 copper(II) at 35 oC. (�) Conc. 1, (�) Conc. 2,
(×) Conc. 3, (•) Conc. 4
ACC
EPTE
D M
ANU
SCR
IPT
ACCEPTED MANUSCRIPT
LabView Software
Eh
Electrode
ComputerReactor
I/O System
Valve
N2/O2
Cylinder
Input
Output
Figure 1
0
0.4
0.8
1.2
1.6
0.5 0.6 0.7 0.8 0.9E (V versus SHE)
Cu
co
nce
ntr
atio
n (
mM
)
Figure 2

ACC
EPTE
D M
ANU
SCR
IPT
ACCEPTED MANUSCRIPT
Figure 3
0
4
8
12
16
20
0 100 200 300 400 500 600
Time (h)
Cu
dis
solu
tio
n (
%)
Figure 4

ACC
EPTE
D M
ANU
SCR
IPT
ACCEPTED MANUSCRIPT
0
20
40
60
80
100
0 200 400 600 800 1000 1200
Time (h)
Cu
dis
solu
tio
n (
%)
Figure 5
0
20
40
60
80
100
0 200 400 600 800 1000 1200 1400Time (h)
Cu
dis
solu
tio
n (
%)
Figure 6

ACC
EPTE
D M
ANU
SCR
IPT
ACCEPTED MANUSCRIPT
0
20
40
60
80
100
0 500 1000
Time (h)
Cu
Dis
solu
tio
n (
%)
Figure 7
0
20
40
60
80
100
0 500 1000 1500 2000 2500
Time (h)
Cu
dis
solu
tio
n (
%)
Figure 8.

ACC
EPTE
D M
ANU
SCR
IPT
ACCEPTED MANUSCRIPT
0
20
40
60
80
100
0 500 1000 1500 2000 2500 3000
Time (h)
Cu
Dis
solu
tio
n (
%)
Figure 9.
Figure 10.

ACC
EPTE
D M
ANU
SCR
IPT
ACCEPTED MANUSCRIPT
0
20
40
60
80
100
0 200 400 600 800 1000 1200
Time (h)
Cu
dis
solu
tio
n (
%)
Figure 11.

ACC
EPTE
D M
ANU
SCR
IPT
ACCEPTED MANUSCRIPT
Table 1. Chemical composition (element, mass %) Sample Size (µm) Cu Fe S Ag (ppm)
Mineral +25-38 20.7 30.5 35.4 - Concentrate 1 +25-38 30.8 28.3 32.4 50
Concentrate 2 -38 8.1 30 35.3 20
Concentrate 3 -38 13.2 21.8 23.3 30
Concentrate 4
-38 28.0 27.3 NA NA
Table 2. Mineralogical composition of concentrates (mass, %) Mineral Mineral
+25-38 µm
Conc. 1 +25-38
µm
Conc. 2 -38 µm
Conc. 3 -38 µm
Chalcocite 0.00 0.00 0.0 2.49 Chalcopyrite 77.90 82.50 17.6 32.98
Covellite 0.00 0.16 5.0 5.65
Bornite 0.01 3.40 1.7 2.68
Native_Cu 0.00 0.00 0.0 0.00
Enargite 0.00 1.70 1.2 0.73
Brochantite 0.00 0.00 0.0 0.23
Chrysocolla 0.00 0.00 0.0 0.04
Other Cu 0.00 0.00 0.0 0.05
Pyrite 17.9 2.70 62.2 34.33
Quartz 0.02 5.00 3.4 5.33
Galena 0.41 0.47 0.1 0.1
Gangue 4.02 4.03 8.8 15.39
ACC
EPTE
D M
ANU
SCR
IPT
ACCEPTED MANUSCRIPT
Table 3. Modal mineralogical analysis (mass %) of Concentrate 1 and residues after dissolution under the conditions shown in Figure 9
Mineral Head
Residue 936, h
Residue 2640, h
Chalcopyrite 82.5 80.2 57.1
Covellite 0.16 0.4 0.0
Bornite 3.4 4.0 1.9
Pyrite 2.7 5.5 12.0
Elemental Sulfur 0.0 0.0 5.7
Total 100 100 100
Table 4. Pyrite content and copper source ratios (mass %) of major copper minerals
Sample
Mineral
Concentrate
1
Concentrate
2
Concentrate
3
Chalcopyrite 90.2 54.0 59.1
Covellite 0.2 31.0 19.6
Bornite 6.8 9.0 8.8
Enargite 2.6 5.0 1.8
Pyrite 2.7 62.2 34.3