![Synthesis of Novel Electrically Conducting Polymers: Potential ... · PPh3 + Br(CH2). CO2Me ..... > [Ph3P--CH2(CH2). i CO2Me]*Br* [phaP--CH2(CH2)n__CO2Mel*Br -Z--BuL>_phaP=CH (C H2)n_i](https://static.fdocuments.us/doc/165x107/5ebc39ab077be8135d1c1d2a/synthesis-of-novel-electrically-conducting-polymers-potential-pph3-brch2.jpg)
ch2&3practice test 1) 265.9. - mike's web pageleemath3000.org/227sp2012/ch2prac.pdf ·...
13
ch2&3practice test Provide an appropriate response. 1) The frequency distribution below summarizes the home sale prices in the city of Summerhill for the month of June. Determine the class midpoint for class 235.0 - 265.9. (Sale price in thousand $) Frequency 80.0 - 110.9 2 111.0 - 141.9 5 142.0 - 172.9 7 173.0 - 203.9 10 204.0 - 234.9 3 235.0 - 265.9 1 1) A) 250.40 B) 250.45 C) 250.55 D) 250.50 2) The frequency distribution below summarizes the home sale prices in the city of Summerhill for the month of June. Find the class boundaries for class 80.0 - 110.9. (Sale price in thousand $) Frequency 80.0 - 110.9 2 111.0 - 141.9 5 142.0 - 172.9 7 173.0 - 203.9 10 204.0 - 234.9 3 235.0 - 265.9 1 2) A) 80.00, 110.95 B) 79.95, 110.95 C) 79.90, 110.95 D) 79.90, 111.0 Construct the cumulative frequency distribution that corresponds to the given frequency distribution. 3) Speed Number of cars 0 - 29 4 30 - 59 16 60 - 89 60 90 - 119 20 3) A) Speed Cumulative Frequency Less than 30 100 Less than 60 80 Less than 90 82 Less than120 4 B) Speed Cumulative Frequency Less than 30 4 Less than 60 20 Less than 90 80 Less than120 100 C) Speed Cumulative Frequency Less than 30 0.04 Less than 60 0.20 Less than 90 0.80 Less than120 1.00 D) Speed Cumulative Frequency 0 - 29 4 30 - 59 20 60 - 89 80 90 - 119 100 1
Transcript of ch2&3practice test 1) 265.9. - mike's web pageleemath3000.org/227sp2012/ch2prac.pdf ·...

ch2&3practice test
Provide an appropriate response.1) The frequency distribution below summarizes the home sale prices in the city of Summerhill for the
month of June. Determine the class midpoint for class 235.0-265.9.
(Sale price in thousand $) Frequency80.0 - 110.9 2111.0 - 141.9 5142.0 - 172.9 7173.0 - 203.9 10204.0 - 234.9 3235.0 - 265.9 1
1)
A) 250.40 B) 250.45 C) 250.55 D) 250.50
2) The frequency distribution below summarizes the home sale prices in the city of Summerhill for themonth of June. Find the class boundaries for class 80.0-110.9.
(Sale price in thousand $) Frequency80.0 - 110.9 2111.0 - 141.9 5142.0 - 172.9 7173.0 - 203.9 10204.0 - 234.9 3235.0 - 265.9 1
2)
A) 80.00, 110.95 B) 79.95, 110.95 C) 79.90, 110.95 D) 79.90, 111.0
Construct the cumulative frequency distribution that corresponds to the given frequency distribution.3)
Speed Number of cars
0-29 430-59 1660-89 6090-119 20
3)
A)
Speed Cumulative
FrequencyLess than 30 100Less than 60 80Less than 90 82
Less than120 4
B)
Speed Cumulative
FrequencyLess than 30 4Less than 60 20Less than 90 80
Less than120 100C)
Speed Cumulative
FrequencyLess than 30 0.04Less than 60 0.20Less than 90 0.80
Less than120 1.00
D)
Speed Cumulative
Frequency0-29 430-59 2060-89 8090-119 100
1

Provide an appropriate response.4) The frequency distribution for the weekly incomes of students with part-time jobs is given below.
Construct the corresponding relative frequency distribution. Round relative frequencies to thenearest hundredth of a percent if necessary.
Income ($) Frequency200-300 60301-400 73401-500 91501-600 89
More than 600 15
4)
A)
Income ($) Relative
Frequency201-300 15.5%301-400 22.1%401-500 31.3%501-600 16.2%
More than600 14.9%
B)
Income ($)Relative
Frequency200-300 18.29%301-400 22.26%401-500 27.74%501-600 27.13%
More than 600 4.57%C)
Income ($) Relative
Frequency200-300 12.5%301-400 20.1%401-500 37.3%501-600 15.2%
More than 600 14.9%
D)
Income ($) Relative
Frequency200-300 27.33%301-400 27.38%401-500 4.60%501-600 18.07%
More than 600 27.41%
SHORT ANSWER. Write the word or phrase that best completes each statement or answers the question.
Use the given data to construct a frequency distribution.5) Lori asked 24 students how many hours they had spent doing homework during the
previous week. The results are shown below.10 11 10 8 10 10 14 13 10 9 13 1111 13 10 11 13 10 11 13 11 13 13 8
Construct a frequency distribution. Use 4 classes, a class width of 2 hours, and a lower limitof 8 for
Hours Frequency
5)
2

Provide an appropriate response.6) A nurse measured the blood pressure of each person who visited her clinic. Following is a
relative-frequency histogram for the systolic blood pressure readings for those people agedbetween 25 and 40. The blood pressure readings were given to the nearest whole number.Approximately what percentage of the people aged 25-40 had a systolic blood pressure readingbetween 110 and 139 inclusive?
6)
A) 59% B) 39% C) 89% D) 75%
Construct the dotplot for the given data.7) Attendance records at a school show the number of days each student was absent during the year.
The days absent for each student were as follows.0 2 3 4 2 3 4 6 7 2 3 4 6 9 8
7)
A) B)
C) D)
3

Use the data to create a stemplot.8) The following data show the number of laps run by each participant in a marathon.
46 65 55 43 51 48 57 30 43 49 32 568)
A)3456
0 2 3 3 6 8 9 1 5 6 7 5
B)3446
0 2 3 6 8 9 1 3 5 6 7 5
9) The midterm test scores for the seventh-period typing class are listed below.85 77 93 91 74 65 68 97 88 59 74 83 85 72 63 79
9)
A)56789
9 3 5 8 3 5 5 8 2 4 4 7 9 1 3 7
B)56789
9 3 5 8 2 4 4 7 9 3 5 5 8 1 3 7
Provide an appropriate response.10) The table contains data from a study of daily study time for 40 students from Statistics 101.
Construct an ogive from the data.
Minutes onhomework
Number of students
Relative frequency
Cumulative frequency
0-15 2 0.05 2 16-30 4 0.10 6 31-45 8 0.20 14 46-60 18 0.45 32 61-75 4 0.10 36 76-90 4 0.10 40
504540353025201510
50
15.5 30.5 45.5 60.5 75.5 90.5Homework Time (minutes)
10)
A) B)
100908070605040302010
015.5 30.5 45.5 60.5 75.5 90.5Homework Time (minutes)
4

C)
100908070605040302010
015.5 30.5 45.5 60.5 75.5 90.5Homework Time (minutes)
D)
100908070605040302010
015.5 30.5 45.5 60.5 75.5 90.5Homework Time (minutes)
Solve the problem.11) 200 casino patrons, were interviewed as they left the casino. 60 of them said they spent most of the
time playing the slots. 60 of them said they played blackjack. 30 said they played craps. 10 saidroulette. 10 said poker. The rest were not sure what they played the most. Construct a Pareto chartto depict the gaming practices of the group of casino goers. Choose the vertical scale so that therelative frequencies are represented.
11)
A) B)
5
C) D)
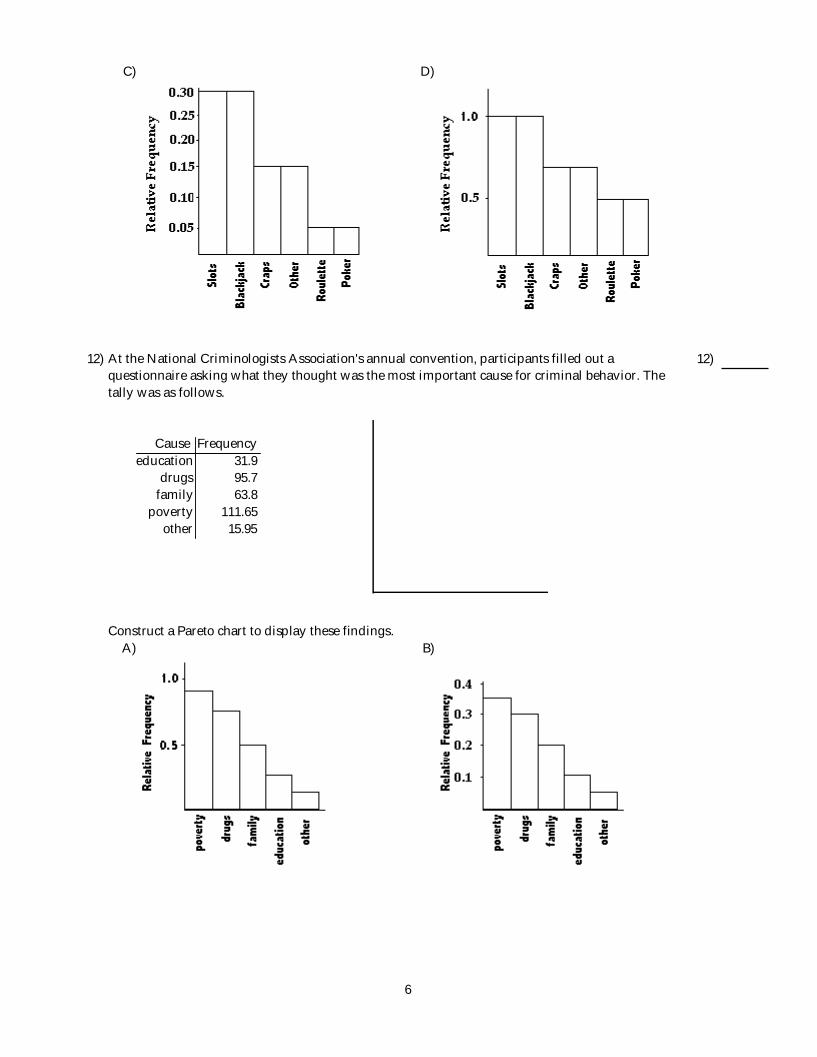
12) At the National Criminologists Association's annual convention, participants filled out aquestionnaire asking what they thought was the most important cause for criminal behavior. Thetally was as follows.
Cause Frequencyeducation 31.9
drugs 95.7family 63.8
poverty 111.65other 15.95
Construct a Pareto chart to display these findings.
12)
A) B)
6

C) D)
Construct a pie chart representing the given data set.13) After reviewing a movie, 300 people rated the movie as excellent, good, or fair. The following data
give the rating distribution.Excellent Good Fair
60 150 90
13)
A) B)
7

Use the pie chart to solve the problem.14) A survey of the 3367 vehicles on the campus of State University yielded the following pie chart.
10%
15% 32%
8%
6%
29%
Find the number of vans. Round your result to the nearest whole number.
14)
A) 269 B) 3098 C) 8 D) 101
SHORT ANSWER. Write the word or phrase that best completes each statement or answers the question.
Provide an appropriate response.15) The mean of a data set is always/sometimes/never (select one) one of the data points in a
set of data. Explain your answer with brief examples.15)
Find the mean for the given sample data. Unless indicated otherwise, round your answer to one more decimal place thanis present in the original data values.
16) The amount of time (in hours) that Sam studied for an exam on each of the last five days is givenbelow. Find the mean study time.
1.7 7.7 8.3 1.6 5.1
16)
A) 4.96 hr B) 4.88 hr C) 5.45 hr D) 24.40 hr
Find the median for the given sample data.17) The distances (in miles) driven in the past week by each of a company's sales representatives are
listed below.107 114 214 230 436 445
Find the median distance driven.
17)
A) 220.50 mi B) 214 mi C) 222 mi D) 230 mi
18) A store manager kept track of the number of newspapers sold each week over a seven-weekperiod. The results are shown below.
80 39 214 152 264 239 232Find the median number of newspapers sold.
18)
A) 232 newspapers B) 174 newspapersC) 152 newspapers D) 214 newspapers
Find the mode(s) for the given sample data.19) 7.11 7.41 7.56 7.11 7.88 7.99 7.62 19)
A) 7.56 B) 7.526 C) 7.11 D) 7.41
8
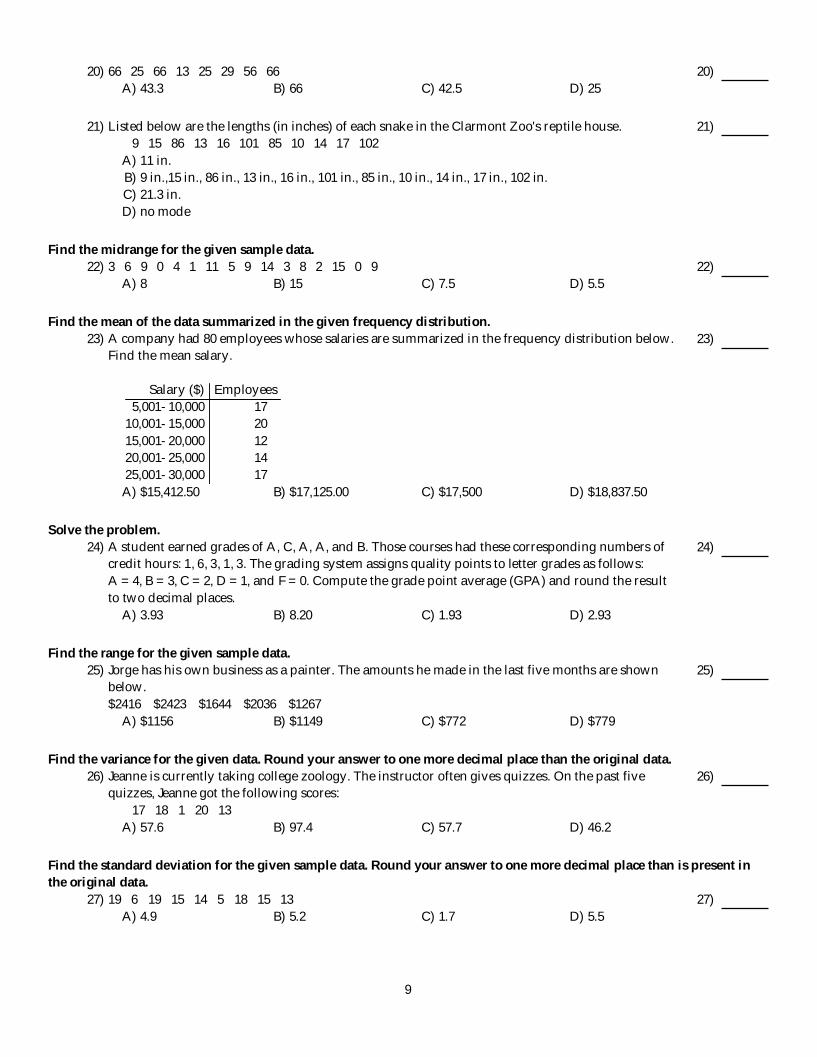
20) 66 25 66 13 25 29 56 66 20)A) 43.3 B) 66 C) 42.5 D) 25
21) Listed below are the lengths (in inches) of each snake in the Clarmont Zoo's reptile house.9 15 86 13 16 101 85 10 14 17 102
21)
A) 11 in.B) 9 in.,15 in., 86 in., 13 in., 16 in., 101 in., 85 in., 10 in., 14 in., 17 in., 102 in.C) 21.3 in.D) no mode
Find the midrange for the given sample data.22) 3 6 9 0 4 1 11 5 9 14 3 8 2 15 0 9 22)
A) 8 B) 15 C) 7.5 D) 5.5
Find the mean of the data summarized in the given frequency distribution.23) A company had 80 employees whose salaries are summarized in the frequency distribution below.
Find the mean salary.
Salary ($) Employees5,001-10,000 17
10,001-15,000 2015,001-20,000 1220,001-25,000 1425,001-30,000 17
23)
A) $15,412.50 B) $17,125.00 C) $17,500 D) $18,837.50
Solve the problem.24) A student earned grades of A, C, A, A, and B. Those courses had these corresponding numbers of
credit hours: 1, 6, 3, 1, 3. The grading system assigns quality points to letter grades as follows:A = 4, B = 3, C = 2, D = 1, and F = 0. Compute the grade point average (GPA) and round the resultto two decimal places.
24)
A) 3.93 B) 8.20 C) 1.93 D) 2.93
Find the range for the given sample data.25) Jorge has his own business as a painter. The amounts he made in the last five months are shown
below.$2416 $2423 $1644 $2036 $1267
25)
A) $1156 B) $1149 C) $772 D) $779
Find the variance for the given data. Round your answer to one more decimal place than the original data.26) Jeanne is currently taking college zoology. The instructor often gives quizzes. On the past five
quizzes, Jeanne got the following scores:17 18 1 20 13
26)
A) 57.6 B) 97.4 C) 57.7 D) 46.2
Find the standard deviation for the given sample data. Round your answer to one more decimal place than is present inthe original data.
27) 19 6 19 15 14 5 18 15 13 27)A) 4.9 B) 5.2 C) 1.7 D) 5.5
9

28) The manager of an electrical supply store measured the diameters of the rolls of wire in theinventory. The diameters of the rolls (in meters) are listed below.
0.402 0.23 0.569 0.317 0.23 0.543 0.492
28)
A) 0.1427 m B) 1.2286 m C) 1.1064 m D) 0.317 m
Find the range, variance, and standard deviation for each of the two samples, then compare the two sets of results.29) When investigating times required for drive-through service, the following results (in seconds)
were obtained.Restaurant A 120 67 89 97 124 68 72 96Restaurant B 115 126 49 56 98 76 78 95
29)
A) Restaurant A: 75 sec; 493.98 sec2; 22.23 secRestaurant B: 70 sec; 727.98 sec2; 26.98 secThere is more variation in the times for restaurant B.
B) Restaurant A: 57 sec; 493.98 sec2; 22.23 secRestaurant B: 56 sec; 727.98 sec2; 32.89 secThere is more variation in the times for restaurant B.
C) Restaurant A: 57 sec; 793.98 sec2; 28.18 secRestaurant B: 77 sec; 727.98 sec2; 26.98 secThere is more variation in the times for restaurant A.
D) Restaurant A: 57 sec; 493.98 sec2; 22.23 secRestaurant B: 77 sec; 727.98 sec2; 26.98 secThere is more variation in the times for restaurant B.
Find the standard deviation of the data summarized in the given frequency distribution.30) The test scores of 40 students are summarized in the frequency distribution below. Find the
standard deviation.Score Students50-59 560-69 1370-79 580-89 890-99 9
30)
A) 13.3 B) 12.6 C) 14.7 D) 14
Use the range rule of thumb to estimate the standard deviation. Round results to the nearest tenth.31) The race speeds for the top eight cars in a 200-mile race are listed below.
185.9 179.5 189.2 176.7 175.6 188.7 186.3 177.931)
A) 1.1 B) 3.4 C) 7.5 D) 6.8
Use the empirical rule to solve the problem.32) The systolic blood pressure of 18-year-old women is normally distributed with a mean of 120
mmHg and a standard deviation of 12 mmHg. What percentage of 18-year-old women have asystolic blood pressure between 96 mmHg and 144 mmHg?
32)
A) 68% B) 99.7% C) 95% D) 99.99%
33) At one college, GPA's are normally distributed with a mean of 2.9 and a standard deviation of 0.6.What percentage of students at the college have a GPA between 2.3 and 3.5?
33)
A) 84.13% B) 99.7% C) 68% D) 95%
10

34) The amount of Jen's monthly phone bill is normally distributed with a mean of $70 and a standarddeviation of $9. What percentage of her phone bills are between $43 and $97?
34)
A) 99.99% B) 95% C) 68% D) 99.7%
Solve the problem.35) The heights of the adults in one town have a mean of 67.5 inches and a standard deviation of 3.4
inches. What can you conclude from Chebyshev's theorem about the percentage of adults in thetown whose heights are between 57.3 and 77.7 inches?
35)
A) The percentage is at least 88.9% B) The percentage is at most 88.9%C) The percentage is at least 99.7% D) The percentage is at most 99.7%
36) The ages of the members of a gym have a mean of 48 years and a standard deviation of 11 years.What can you conclude from Chebyshev's theorem about the percentage of gym members agedbetween 19.4 and 76.6?
36)
A) The percentage is at least 85.2% B) The percentage is approximately 61.5%C) The percentage is at most 85.2% D) The percentage is at least 61.5%
Solve the problem. Round results to the nearest hundredth.37) Scores on a test have a mean of 70 and a standard deviation of 11. Michelle has a score of 48.
Convert Michelle's score to a z-score.37)
A) -2 B) 22 C) -22 D) 2
38) The mean of a set of data is 5.73 and its standard deviation is 3.44. Find the z score for a value of13.87.
38)
A) 2.37 B) 2.67 C) 2.61 D) 2.13
39) A department store, on average, has daily sales of $29,876.76. The standard deviation of sales is $1000. On Tuesday, the store sold $34,893.71 worth of goods. Find Tuesday's z score. Was Tuesdayan unusually good day?
39)
A) 5.27, no B) 5.02, yes C) 4.01, no D) 5.33, yes
Find the number of standard deviations from the mean. Round your answer to two decimal places.40) Mario's weekly poker winnings have a mean of $344 and a standard deviation of $51. Last week he
won $178. How many standard deviations from the mean is that?40)
A) 1.63 standard deviations below the mean B) 1.63 standard deviations above the meanC) 3.25 standard deviations below the mean D) 3.25 standard deviations above the mean
41) The number of assists per match for the setter on your school's volleyball team has a mean of 58and a standard deviation of 7. How many standard deviations from the mean is an outing with 77assists?
41)
A) 2.71 standard deviations below the mean B) 1.36 standard deviations above the meanC) 2.71 standard deviations above the mean D) 1.36 standard deviations below the mean
Find the z-score corresponding to the given value and use the z-score to determine whether the value is unusual.Consider a score to be unusual if its z-score is less than -2.00 or greater than 2.00. Round the z-score to the nearest tenthif necessary.
42) A test score of 50.0 on a test having a mean of 69 and a standard deviation of 10. 42)A) -19; unusual B) 1.9; not unusualC) -1.9; not unusual D) -1.9; unusual
11
43) A weight of 110 pounds among a population having a mean weight of 164 pounds and a standarddeviation of 25.6 pounds.
43)
A) -53.8; unusual B) 2.1; not unusualC) -2.1; unusual D) -2.1; not unusual
Determine which score corresponds to the higher relative position.44) Which is better: a score of 82 on a test with a mean of 70 and a standard deviation of 8, or a score of
82 on a test with a mean of 75 and a standard deviation of 4?44)
A) The first 82B) The second 82C) Both scores have the same relative position.
45) Which score has a higher relative position, a score of 327.6 on a test for which x = 280 and s = 28, ora score of 22.2 on a test for which x = 20 and s = 2?
45)
A) A score of 22.2B) Both scores have the same relative position.C) A score of 327.6
Find the percentile for the data value.46) Data set: 4 6 14 10 4 10 18 18 22 6 6 18 12 2 18;
data value: 1446)
A) 52 B) 70 C) 60 D) 35
47) Data set: 122 134 126 120 128 130 120 118 125 122 126 136 118 122 124 119;data value: 128
47)
A) 85 B) 70 C) 62 D) 75
Find the indicated measure.48) Use the given sample data to find Q3.
49 52 52 52 74 67 55 5548)
A) 55.0 B) 61.0 C) 6.0 D) 67.0
49) The weights (in pounds) of 30 newborn babies are listed below. Find P16.5.5 5.7 5.8 5.9 6.1 6.1 6.4 6.4 6.5 6.66.7 6.7 6.7 6.9 7.0 7.0 7.0 7.1 7.2 7.27.4 7.5 7.7 7.7 7.8 8.0 8.1 8.1 8.3 8.7
49)
A) 6.0 lb B) 4.8 lb C) 6.1 lb D) 5.9 lb
12

Construct a modified boxplot for the data. Identify any outliers.50) The weights (in ounces) of 27 tomatoes are listed below.
1.7 2.0 2.2 2.2 2.4 2.5 2.5 2.5 2.62.6 2.6 2.7 2.7 2.7 2.8 2.8 2.8 2.92.9 2.9 3.0 3.0 3.1 3.1 3.3 3.6 4.2
50)
A) Outliers: 1.7 oz, 3.6 oz, 4.2 oz
B) Outliers: 1.7 oz, 4.2 oz
C) Outlier: 4.2 oz
D) No outliers
13