CH 3 - Industry Analysis
28
“Planning and Strategic Management” Course a.a. 2019/2020 Beatrice Valente Covino “La Sapienza” University of Rome – Department of Economics Lesson 3
Transcript of CH 3 - Industry Analysis

“Planning and Strategic Management” Course a.a. 2019/2020
Beatrice Valente Covino
“La Sapienza” University of Rome – Department of Economics
Lesson 3

Agenda
Planning and strategic management 2
• Industry analysis: the fundamentals/objectives
• Industry profitability: determinants/US Industries
• The spectrum of industry structures
• Porter’s Five Forces Competition Framework
• Competition: determinants, substitutions, threats
• Rivalry with Competitors
• Bargaining Power of Buyers/Suppliers
• Industry Boundaries and Key Success Factors
• The Industry Evolution Life Cycle and driving forces
• Product and Process Innovation
• Portfolio Planning Models
• Technology diffusion: S‐curves
• Need for change…
• High‐road Strategy

Industry Analysis: fundamentals
3
OUTLINE
• Industry Analysis objectives• From Environmental Analysis to Industry Analysis• Analyzing Industry Attractiveness • Applying industry analysis to Forecasting Industry Profitability• Using Industry Analysis to Develop Strategy • Defining Industries: Where to Draw the Boundaries• From Industry Attractiveness to Competitive Advantage:
Identifying Key Success Factors
Planning and strategic management

4
• To understand how industry structure drives competition,which then determines the level of industry profitability
• To assess industry attractiveness
• To use evidence on the changes in industry structure,formulate strategies, and then forecast or improve futureprofitability
• To identify key success factors.
Industry Analysis: objectives
Planning and strategic management

5
Industry to Environmental Analysis
THE INDUSTRY ENVIRONMENT• Suppliers• Competitors• Customers
The national/ international economy
Technology
Government & politics
The natural environment
Demographic structure
Social structure
• The Industry Environment lies at the core of the Macro environment
• The Macro Environment impacts the firm through its effect on the Industry Environment.
Planning and strategic management

6
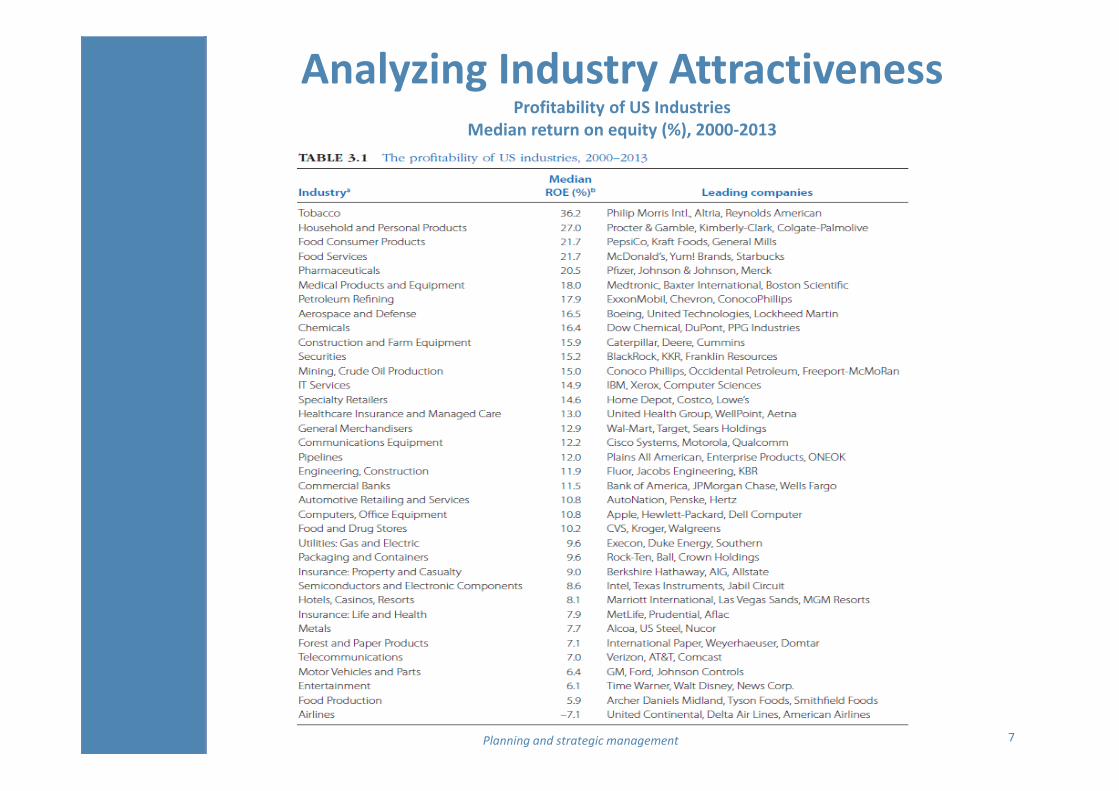
Customer Value does not necessarily yield profit. The value created is distributed between customers and producers by the forces of competition.
The profits earned by the firms in an industry are determined by three factors:
1. The value of the product to customers
2. The intensity of competition
3. Relative bargaining power at different stages of the valuechain.
Industry Profitability: determinants
Planning and strategic management
7
Profitability of US IndustriesMedian return on equity (%), 2000‐2013
Planning and strategic management
Analyzing Industry Attractiveness
8
Analyzing Industry Attractiveness
• Basic premise that underlies industry analysis is that the level of industry profitability is neither random nor the result of entirely industry‐specific influences: it is determined by the systematic influences of the industry’s structure.
• The underlying theory of how industry structure drives competitive behavior and determines industry profitability is provided by industrial organization (IO) economics. The two reference points are the:
o the theory of monopoly (high entry barriers)o the theory of perfect competition (no entry barriers)

9
Analyzing Industry Attractiveness
Perfect Competition Oligopoly Duopoly Monopoly
Concentration Many firms A few firms Two firms One firm
Entry and Exit Barriers No barriers Significant barriers High barriers
Product Differentiation
Homogeneous product Potential for product differentiation
InformationPerfect information flow
Imperfect availability of information
Planning and strategic management
The Spectrum of Industry Structures

10Planning and strategic management
Porter’s Five Forces Competition Framework (1/2)
INDUSTRY COMPETITORS
Rivalry among existing firms
SUPPLIERS
NEW ENTRANTS
SUBSTITUTES
BUYERS
Threat of substitutes
Threat of new entrants
Bargaining power of suppliers
Bargaining power of buyers
11Planning and strategic management
Porter’s Five Forces Competition Framework (2/2)
Michael Porter's interview for the "Harvard Business Review"…
https://www.youtube.com/watch?v=mYF2_FBCvXw

12Planning and strategic management
Competition: structural determinants
INDUSTRY RIVALRY• Concentration• Diversity of competitors• Product differentiation• Excess capacity and exit
barriers• Cost conditions
SUPPLIER POWER• Buyer’s price sensitivity• Relative bargaining
power
SUBSTITUTE COMPETITION
• Buyer’s propensity to substitute
• Relative prices and performances of substitutes
THREAT OF ENTRY• Capital
requirements• Economies of
scale• Absolute cost
advantage• Product
differentiation• Access to
distribution channels
• Legal/regulatory barriers
• Retaliation
BUYER POWER• Buyer’s price sensitivity• Relative bargaining
power

13
Extent of competitive pressure from producers ofsubstitutes depends on:
• Buyer’s propensity to substitute
• The price‐performance characteristics of substitutes(The extent to which substitutes depress prices and profits depends on the propensity of buyers to substitute between alternatives)
The more complex a product and the more differentiated arebuyers’ preferences, the lower the extent of substitution bycustomers on the basis of price differences
Threat of Substitutes
Planning and strategic management

14
• The threat of entrants in industry profitability depends uponthe entry barriers.
• The principle sources of barriers to entry are:o Capital requirementso Economies of scaleo Absolute cost advantageo Product differentiationo Access to channels of distributiono Legal and regulatory barrierso Retaliationo The Effectiveness of Barriers to Entry
Threat of New Entrants
Planning and strategic management

15
The extent to which industry profitability is depressed byaggressive price competition depends upon:
o Concentration (number and size distribution of firms)o Diversity of competitors (difference in goal, cost
strategies, etc.)o Product differentiationo Excess capacity and exit barrierso Cost conditions: Extent of sale economies Ratio of fixed to variable costs.
Rivalry Between Established Competitors
Planning and strategic management

16
• The extent to which buyers are able to depress profitabilitydepends on:o Buyer’s price sensitivity Does the item comprise a big percentage of the
buyer’s total costs? Is a purchased item a commodity or differentiated? How intense is the competition between buyers? Is the item critical to the quality of the buyer’s own
output?
o Relative bargaining power Size and concentration of buyers relative to sellers Buyer’s information Ability to integrate backwards
• Note: The analysis of supplier power is symmetric.
Bargaining Power of Buyers
Planning and strategic management

17
Bargaining Power of Suppliers
Planning and strategic management
• Suppliers of commodities often try to increase theirbargaining power through the creation of organizations (eg.OPEC, the International Coffee Organization and farmer’ssales cooperation).
• Suppliers of technically sophisticated and complexcomponents may be able to release considerable bargainingpower (ex. personal computers sector).
• High switching costs make it more difficult for buyers tochange supply source so giving suppliers an higher bargainingpower.

18
Economists define an industry "as a group of firms that suppliesa market"• What industry is Ferrari in:
o The motor vehicle industry (SIC 371)*o The automobile industry (SIC 3712)*o The luxury car industry?o Global, regional (EU) or national (IT)?
• Key criterion: SUBSTITUTABILITYo On the demand side: Are buyers willing to substitute
between types of cars and across countries?o On the supply side: Are manufacturers able to switch
production between types of cars and across countries?
• We may need to draw different industry boundaries fordifferent types of decisions.
Industry Boundaries:what is the relevant market?
Planning and strategic management *Standard industry Classification

19
Key Success Factors (1/3)Pre‐requisites for success
What do customers want? How does the firm survive competition?
Analysis of demand
• Who are our customers?• What do they want?
Analysis of competition
• What drives competition?• What are the main
dimensions of competition?• How intense is competition?• How can we obtain a
superior competitive position?
Key success factors
Planning and strategic management

© 2013 Robert M. Grantwww.contemporarystrategyanalysis.com 20
Key Success Factors:Steel, Fashion Clothing & Supermarkets (2/3)
What do customers want? How do firms survive competition? Key success factors
Steel
Low priceProduct consistencyReliability of supplySpecific technical specifications for special steels.
Strong price competition and cyclical profitability necessitates cost efficiency and strong financial resources.
Cost efficiency through: large‐scale plants, low‐cost location, speedy capacity adjustmentOr hi‐tech mini‐mills can achieve low costs through flexibility and high productivityQuality and service differentiation
Fashion clothing
Demand segmented by garment type, style, quality, color.Customers pay price premium for brand, style, exclusivity and quality.
Intensely competitive due to low entry barriers, low seller concentration and strong retail buying powerDifferentiation can yield substantial price premium but imitation rapid.
Combining differentiation with low‐costsKey differentiation variables:design, speedy to fashion trends, brand reputation, qualityCost efficiency requires manufacture in low wage countries.
Super‐markets
Low priceConvenient locationWide range of productsadapted to local preferencesFreshness of produce, good service, pleasant ambience, easy parking.
Market localizedIntensity of price competition depends on number and proximityof competitorsBargaining power a critical determinant of cost of bought‐in‐goods.
Low‐cost operation requiresoperational efficiency, scale‐efficient stores, strong buying power, low wage costsDifferentiation requires wide product range (hence, large stores), convenient location, easy parking.

21
Key Success Factors: analyzing profit drivers (3/3)
Return On Capital
Employed
Return on Sales
Sales/Capital Employed
Sales mix of products
Avoiding markdowns through tight inventory control
Maximum buying power to minimize cost of goods purchased
Maximum sales/sq. foot through location, customer service,
product mix & quality control
Max. inventory turnover through electronic data interchange, close vendor relationships, fast delivery
Minimize capital deployment through outsourcing and leasing
Planning and strategic management
22
Introduction
Indu
stry Sales
Time
Growth DeclineMaturity
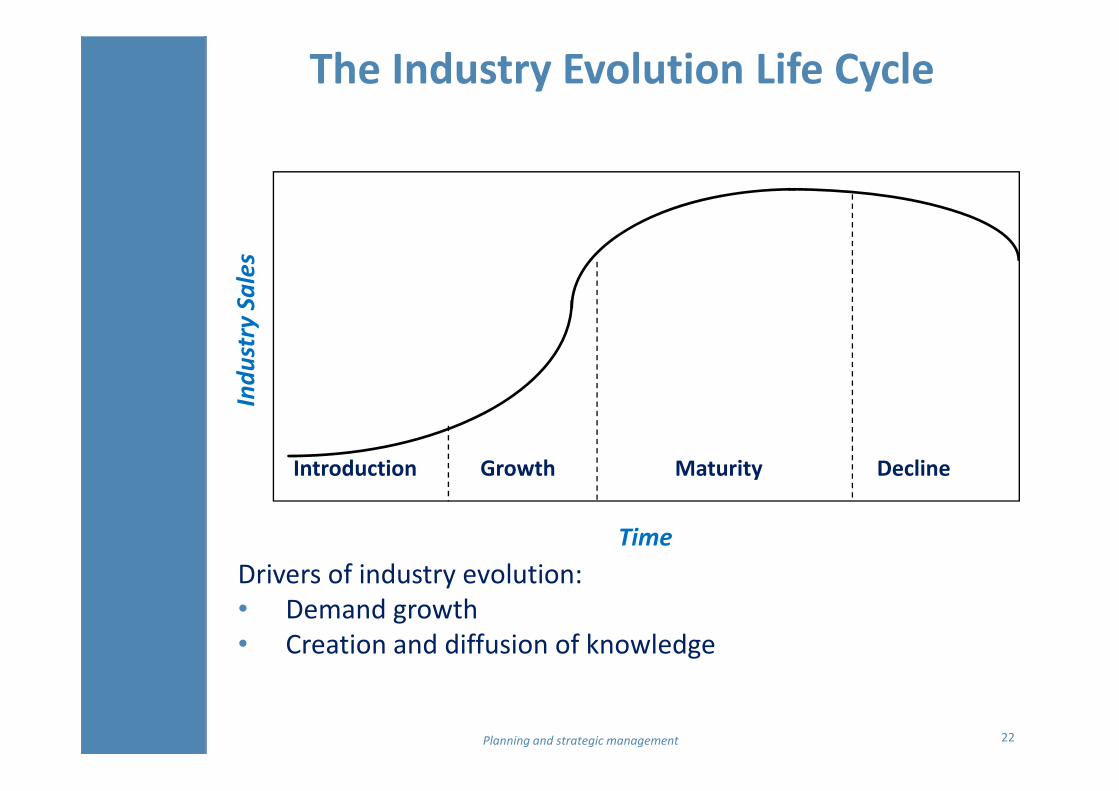
Drivers of industry evolution:• Demand growth• Creation and diffusion of knowledge
Planning and strategic management
The Industry Evolution Life Cycle
23
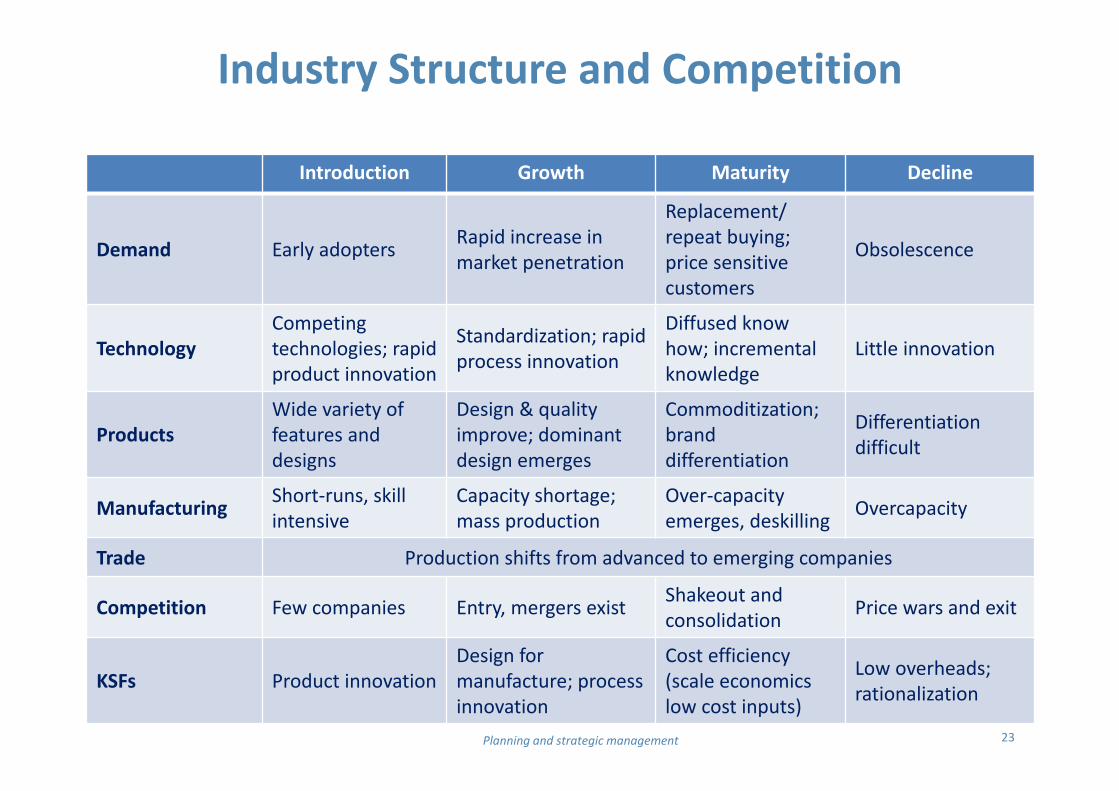
Industry Structure and Competition
Introduction Growth Maturity Decline
Demand Early adopters Rapid increase in market penetration
Replacement/ repeat buying; price sensitive customers
Obsolescence
TechnologyCompeting technologies; rapidproduct innovation
Standardization; rapid process innovation
Diffused know how; incremental knowledge
Little innovation
ProductsWide variety of features and designs
Design & quality improve; dominant design emerges
Commoditization; brand differentiation
Differentiation difficult
Manufacturing Short‐runs, skill intensive
Capacity shortage;mass production
Over‐capacity emerges, deskilling Overcapacity
Trade Production shifts from advanced to emerging companies
Competition Few companies Entry, mergers exist Shakeout and consolidation Price wars and exit
KSFs Product innovationDesign for manufacture; process innovation
Cost efficiency (scale economics low cost inputs)
Low overheads; rationalization
Planning and strategic management

24
Product and Process Innovation: rate/time
Time
Rate of inn
ovation
Product Innovation
Process Innovation
Planning and strategic management

Performance
Time
Physical limit?
Performance is ultimately constrainedby physical limits
Performance
Time
Who buys a technologywhen it is first introduced?
New technologies sell to:‐ New customers‐ With new needs‐ Often at lower margins
Planning and strategic management
Technology diffusion: S‐curves (1/2)
25
It depicts how a product, service, technology or business progressesevolves over time.
It can be viewed on an incremental level to map product evolutionsand opportunities, or on a macro‐scale to describe the evolution ofbusinesses and industries.
On a product, service, or technology level, S‐curves are usuallyconnected to “market adoption” since the beginning of a curve relatesto the birth of a new market opportunity, while the end of the curverepresents the death, or obsolescence of the product, service, ortechnology in the market.
Usually the end of one S‐curve marks the emergence of a new S‐curve(e.g., video cassette tapes versus DVDs etc…).
Some industries and technologies move along S‐curves faster thanothers.
High tech S‐curves tend to cycle more quickly than other consumers.
Technology diffusion: S‐curves (2/2)
Planning and strategic management 26

27Planning and strategic management
Portfolio Planning Models:BCG Growth‐Share Matrix
HIGHLOW
Annu
al re
al ra
te of m
arket g
rowth (%
)
Relative market share
Earnings: high, stable
Cash flow: high, stable
Strategy: milk
Earnings: low, unstable
Cash flow: neutral or negative
Strategy: divest
Earnings: high, stable, growing
Cash flow: neutral
Strategy: invest for growth
Earnings: low, unstable, growing
Cash flow: negative
Strategy: analyze to determine likelihood of the business becoming a “star” or a “dog”
HIGH ?
LOW

CASE STUDY
28
Adapt Porter's Five Forces scheme to these world wide firms operating in twocompletely different industries.