CF3Br agust,www,....cf3br/PPT-081210ak agust,heima,....Sept10/XLS-081210ak.xls
16
3Br ust,www,....cf3br/PPT-081210ak.ppt ust,heima,....Sept10/XLS-081210ak.xls ust, heima,...PXP-291110ks/Leiðrétt-291110ks-081210ak.pxp (CF3+) ust,heima,... PXP-291110ks/Br 1D-REMPImW-291110ks-081210ak.pxp (Br+
-
Upload
myra-christian -
Category
Documents
-
view
48 -
download
0
description
CF3Br agust,www,....cf3br/PPT-081210ak.ppt agust,heima,....Sept10/XLS-081210ak.xls agust, heima,...PXP-291110ks/Leiðrétt-291110ks-081210ak.pxp (CF3+) agust,heima,... PXP-291110ks/Br 1D-REMPImW-291110ks-081210ak.pxp (Br+). Bond dissociation for CF 3 Br revisited: - PowerPoint PPT Presentation
Transcript of CF3Br agust,www,....cf3br/PPT-081210ak agust,heima,....Sept10/XLS-081210ak.xls

CF3Br
agust,www,....cf3br/PPT-081210ak.pptagust,heima,....Sept10/XLS-081210ak.xlsagust, heima,...PXP-291110ks/Leiðrétt-291110ks-081210ak.pxp (CF3+)agust,heima,... PXP-291110ks/Br 1D-REMPImW-291110ks-081210ak.pxp (Br+)

Bond dissociation for CF3Br revisited:
The value used in http://notendur.hi.is/agust/rannsoknir/rempi/cf3br/PPT-090910ak.ppt (25 986.80 cm-1)is based on a paper from 1966 (see slide 3 in http://notendur.hi.is/agust/rannsoknir/rempi/cf3br/PPT-090910ak.ppt)
The value used by Suto and Lee (JCP, 79(3), 1127, (´83) (see: http://notendur.hi.is/agust/rannsoknir/papers/jcp79-1127-83.pdf page 1131), based on Thermochemical data (Okabe, “Photochemistry of small molecules”, (1978)) is 2.98 eV (*8065.54093 cm-1/eV) = 24035.31 cm-1 which is is significantly lower.
CF3+ + Br- threshold revisited:
This affects the estimate of the CF3+ + Br- threshold:
agust,heima,....Sept10/XLS-081210ak.xls
E(CF3+ + Br-) = 24035.31 + 72912.48 - 27129.17 = 69818.62197 cm-1

CF3* + Br thresholds:
Suto and Lee (JCP, 79(3), 1127, (´83) (see: http://notendur.hi.is/agust/rannsoknir/papers/jcp79-1127-83.pdf page 1132):
UV spectrum: 6.38 + 2.98 eV =.... 75493.46 cm-1 Vis spectrum: 6.36 + 2.98 eV = ....75332.15 cm-1
400
300
200
100
0
Rel
ativ
e In
tens
ity
84x1038280787674Energy (cm-1)
agust, heima,...PXP-291110ks/Leiðrétt-291110ks-081210ak.pxp
UV spectrum: 75493.46 cm-1 Vis spectrum: 75332.15 cm-1
CF3* + Br thresholds

500
400
300
200
100
0
828078767472x103
UV spectrum: 75493.46 cm-1 Vis spectrum: 75332.15 cm-1
CF3* + Br thresholds
agust,heima,... PXP-291110ks/Br 1D-REMPImW-291110ks-081210ak.pxp

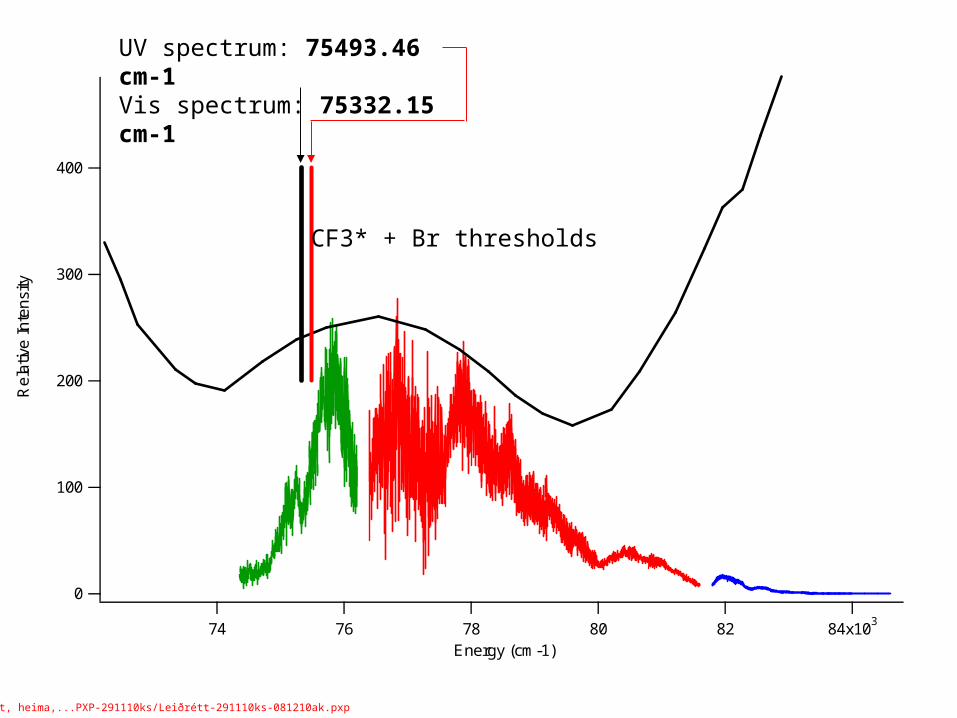
Now let´s look at the energetics with respect to CF3+ formation via CF3* formation(see fig. Next slide)
100
90
80
70
60
50
40
30
20
10
0
x103
R(CF3 –Br)
CF3 + Br
CF3 + + Br
CF3Br(?)
CF3Br+ + e-
CF3 + + Br-
E/cm -1
ca. 24035.31 cm-1
96947.79 cm-191980 cm-1
69818.62 cm-1
80 000 cm-1
(Semi) schematic energy figure:
{CF3+Br-}?
Ion-pair state?
CF3 * + Br
75493.46/75332.15 cm-1
Agust,heima,...CF3Br/Sept10/PXP-081210ak.pxp; Layout::0, Graph: 0, Table::0

100
90
80
70
60
50
40
30
20
10
0
x103
R(CF3 –Br)
CF3 + Br
CF3 + + Br
CF3Br(?)
CF3Br+ + e-
CF3 + + Br-
E/cm -1
ca. 24035.31 cm-1
96947.79 cm-191980 cm-1
69818.62 cm-1
80 000 cm-1
Possible dissociation mechanism(1):Ry -> Ion-pair -> CF3+ + Br- formation
{CF3+Br-}?
Ion-pair state?
CF3 * + Br
75493.46/75332.15 cm-1
Agust,heima,...CF3Br/Sept10/PXP-081210ak.pxp; Layout::0, Graph: 0, Table::0
CF3 + + Br-
(1)

100
90
80
70
60
50
40
30
20
10
0
x103
R(CF3 –Br)
CF3 + Br
CF3 + + Br
CF3Br(?)
CF3Br+ + e-
CF3 + + Br-
E/cm -1
ca. 24035.31 cm-1
96947.79 cm-191980 cm-1
69818.62 cm-1
80 000 cm-1
Possible dissociation mechanism(2):Ry -> CF3* + Br dissociation
{CF3+Br-}?
Ion-pair state?
CF3 * + Br
75493.46/75332.15 cm-1
Agust,heima,...CF3Br/Sept10/PXP-081210ak.pxp; Layout::0, Graph: 0, Table::0
(2)
400
300
200
100
Rel
ativ
e In
tens
ity
75.8x10375.675.475.275.074.874.674.4Energy (cm-1)
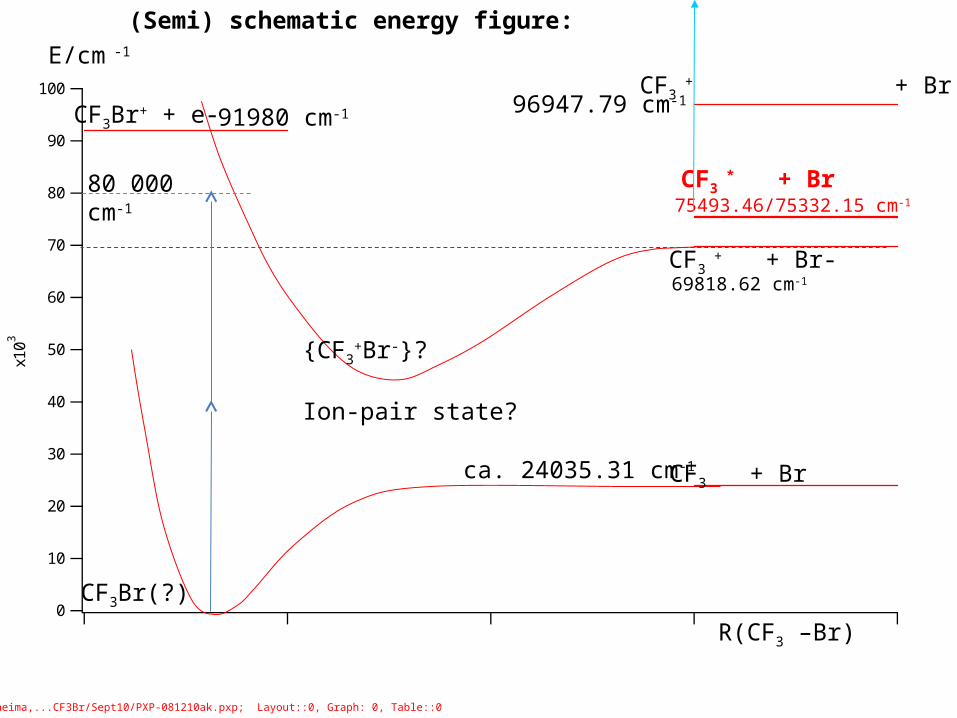
CF3* + Br thresholds
UV spectrum: 75493.46 cm-1 Vis spectrum: 75332.15 cm-1
This brake in CF3+ intensity could bebecausea) -for 2hv < 75332 cm-1 only channels (1) occurs (i.e. CF3Br** ->-> CF3+ + Br-)b) for hv > 75332 cm-1, competitionBetween (1)(direct CF3+ formation) and (2)(CF3* formation)
However based on PD data the observedCF3+ signal all over most probably is mainly due to (1) (i.e. direct CF3+ formation)
agust, heima,...PXP-291110ks/Leiðrétt-291110ks-081210ak.pxp

Now let´s compare the “spin-orbit splitting” structure observed in the fluorescenecSpectrum for CF3Br and mentionedby Suto and Lee (JCP, 79(3), 1127, (´83) (see: http://notendur.hi.is/agust/rannsoknir/papers/jcp79-1127-83.pdf page 1132), i.e.
600
400
200
0
Rel
ativ
e In
tens
ity
85x1038075Energy (cm-1)
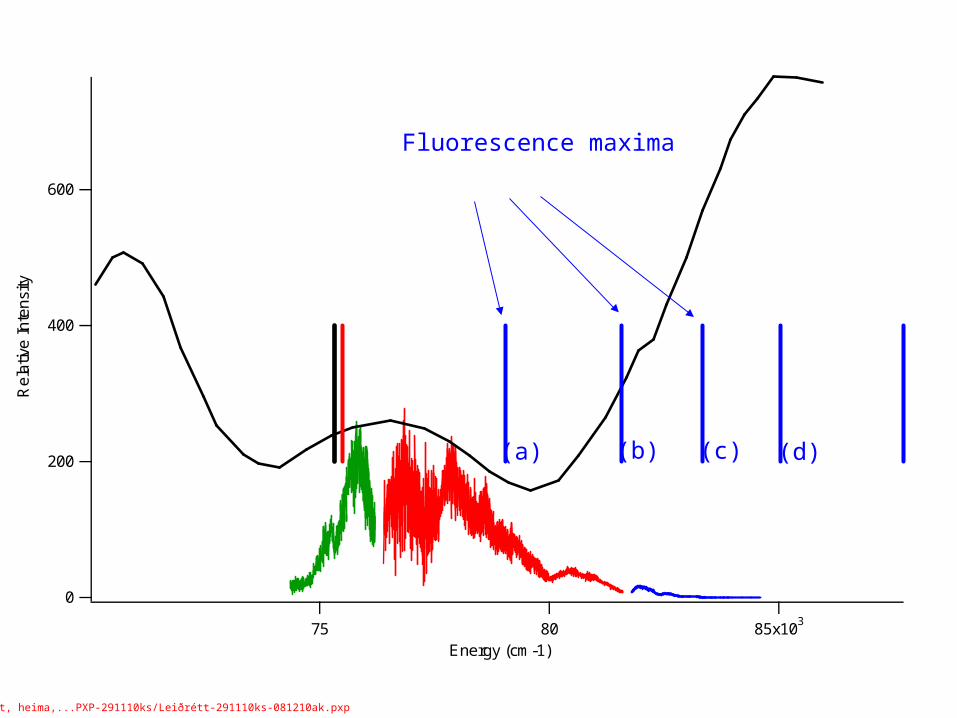
Fluorescence maxima
(a) (b) (c) (d)
agust, heima,...PXP-291110ks/Leiðrétt-291110ks-081210ak.pxp

The fluorescenec maxima do not match CF3+ signal maxima. On the contraryIt looks more as if the maxima are in between peaks or close to minima in CF3+ signals (peaks (a)- (c). This could further indicate that there is a competition between channels (1) and (2)!
Try to search for systematic spacing between peaks close to 0.3 and 0.46 eV:
1) 11.4 eV
2) 11.7 eV
http://notendur.hi.is/agust/rannsoknir/papers/jcp101-2069-94.pdf :

Now let´s look at quantum defects:
500
400
300
200
100
0
Rel
ativ
e In
tens
ity
82x10380787674Energy (cm-1)
0.2 eV
0.3 eV
0.46 eV
0.264 eV 0.35 eV
1) En = 74546.9 cm-1 =9.24 eV
2) En = 9.24+0.3 =9.24 eVagust, heima,...PXP-291110ks/Leiðrétt-291110ks-081210ak.pxp

= n – sqrt(R/(EI-En)); n = 5, R = 13.61 eV
1) = 2.52) = 2.5
Which is what one might expect for for R-Br, p orbitals (and better value than that given by Eden et al. (http://notendur.hi.is/agust/rannsoknir/papers/cp323-313-06.pdf )of 2.71) :
See: http://notendur.hi.is/agust/rannsoknir/papers/jpcA112-7170-08.pdf (CH3Br) andhttp://notendur.hi.is/agust/rannsoknir/papers/CP148-315-90.pdf (Br2)
Ergo: I conclude that the peaks at 1) just below 76000 cm-1 and 2) ca 78000 cm-1 are due to transitions to the Rydberg states:1) [CF3Br+ (X 2E3/2)]c 5p and2) [CF3Br+ (X 2E1/2)]c 5p
Possibly the peak near 80500 cm-1 is due to transition to [CF3Br+ (A 2E1/2)]c 5p

...but what about the “peak” just below 77000 cm-1, i.e ca 1000 cm-1 aboveThe peak for [CF3Br+ (X 2E3/2)]c 5p . Could that be a vibrational Band?
NIST =>
ERGO: yes it could indeed be a vibrational band such as CF3 stretching(?)