CERTIFICATE OF COMPLIANCE R&D SAR EVALUATION · for uncontrolled environment/general exposure...
71
© 2016 RF Exposure Lab, LLC This report shall not be reproduced except in full without the written approval of RF Exposure Lab, LLC. 802 N. Twin Oaks Valley Road, Suite 105 • San Marcos, CA 92069 • U.S.A. TEL (760) 471-2100 • FAX (760) 471-2121 http://www.rfexposurelab.com CERTIFICATE OF COMPLIANCE R&D SAR EVALUATION Lif3 Americas Dates of Test: August 10-12, 2016 39 Wellington Drive Test Report Number: R&D.20160802 Long Valley, NJ 07853 This wireless mobile and/or portable device has been tested for localized specific absorption rate (SAR) for uncontrolled environment/general exposure limits specified in ANSI/IEEE Std. C95.1-1992 and had been tested in accordance with the measurement procedures specified in IEEE 1528-2013 and IEC 62209-2:2010 (See test report). I attest to the accuracy of the data. All measurements were performed by myself or were made under my supervision and are correct to the best of my knowledge and belief. I assume full responsibility for the completeness of these measurements and vouch for the qualifications of all persons taking them. Jay M. Moulton Vice President Certificate # 2387.01 Model(s): Radi-Chip with iPhone 5se Test Sample: Engineering Unit Same as Production Equipment Type: RF Radiation Reducing Chip Classification: Portable Transmitter Next to Head TX Frequency Range: 824 – 849 MHz; 1850 – 1910 MHz Frequency Tolerance: ± 2.5 ppm Maximum RF Output: Not Measured Signal Modulation: WCDMA Antenna Type: Internal Application Type: Evaluation FCC Rule Parts: Part 2, 22, 24 KDB Test Methodology: KDB 447498 D01 v06, KDB 648474 D01 v01r05, KDB 941225 D01 v03r01 Max. Measured SAR Value: 0.789 W/kg Separation Distance: 0 mm Head
Transcript of CERTIFICATE OF COMPLIANCE R&D SAR EVALUATION · for uncontrolled environment/general exposure...

© 2016 RF Exposure Lab, LLC This report shall not be reproduced except in full without the written approval of RF Exposure Lab, LLC.
802 N. Twin Oaks Valley Road, Suite 105 • San Marcos, CA 92069 • U.S.A. TEL (760) 471-2100 • FAX (760) 471-2121 http://www.rfexposurelab.com
CERTIFICATE OF COMPLIANCE R&D SAR EVALUATION Lif3 Americas Dates of Test: August 10-12, 2016 39 Wellington Drive Test Report Number: R&D.20160802 Long Valley, NJ 07853
This wireless mobile and/or portable device has been tested for localized specific absorption rate (SAR) for uncontrolled environment/general exposure limits specified in ANSI/IEEE Std. C95.1-1992 and had been tested in accordance with the measurement procedures specified in IEEE 1528-2013 and IEC 62209-2:2010 (See test report). I attest to the accuracy of the data. All measurements were performed by myself or were made under my supervision and are correct to the best of my knowledge and belief. I assume full responsibility for the completeness of these measurements and vouch for the qualifications of all persons taking them.
Jay M. Moulton Vice President
Certificate # 2387.01
Model(s): Radi-Chip with iPhone 5se Test Sample: Engineering Unit Same as Production Equipment Type: RF Radiation Reducing Chip Classification: Portable Transmitter Next to Head TX Frequency Range: 824 – 849 MHz; 1850 – 1910 MHz Frequency Tolerance: ± 2.5 ppm
Maximum RF Output: Not Measured Signal Modulation: WCDMA Antenna Type: Internal Application Type: Evaluation FCC Rule Parts: Part 2, 22, 24 KDB Test Methodology: KDB 447498 D01 v06, KDB 648474 D01 v01r05, KDB 941225 D01 v03r01 Max. Measured SAR Value: 0.789 W/kg Separation Distance: 0 mm Head

Report Number: R&D.20160802
© 2016 RF Exposure Lab, LLC Page 2 of 71 This report shall not be reproduced except in full without the written approval of RF Exposure Lab, LLC.
Table of Contents 1. Introduction ................................................................................................................................... 3
SAR Definition [5] .............................................................................................................................. 4 2. SAR Measurement Setup .............................................................................................................. 5
Robotic System ................................................................................................................................. 5 System Hardware .............................................................................................................................. 5 System Electronics ............................................................................................................................ 6 Probe Measurement System ............................................................................................................. 6
3. Probe and Dipole Calibration ....................................................................................................... 13 4. Phantom & Simulating Tissue Specifications ............................................................................... 14
Head & Body Simulating Mixture Characterization .......................................................................... 14 5. ANSI/IEEE C95.1 – 1992 RF Exposure Limits [2] ........................................................................ 15
Uncontrolled Environment ............................................................................................................... 15 Controlled Environment ................................................................................................................... 15
6. Measurement Uncertainty............................................................................................................ 16 7. System Validation ........................................................................................................................ 17
Tissue Verification ........................................................................................................................... 17 Test System Verification .................................................................................................................. 17
8. SAR Test Data Summary ............................................................................................................ 18 Procedures Used To Establish Test Signal ..................................................................................... 18 Device Test Condition ..................................................................................................................... 18
9. FCC 3G Measurement Procedures ............................................................................................. 19 9.1 Procedures Used to Establish RF Signal for SAR ................................................................ 19 9.2 SAR Measurement Conditions for WCDMA/HSDPA/HSUPA ............................................... 19 SAR Data Summary – 850 MHz ...................................................................................................... 20 SAR Data Summary – 1900 MHz .................................................................................................... 21
10. Test Equipment List ................................................................................................................. 22 11. Conclusion ............................................................................................................................... 23 12. References .............................................................................................................................. 24 Appendix A – System Validation Plots and Data ................................................................................. 25 Appendix B – SAR Test Data Plots ..................................................................................................... 30 Appendix C – Test Photos ................................................................................................................... 39 Appendix D – Probe Calibration Data Sheets ...................................................................................... 41 Appendix E – Dipole Calibration Data Sheets ..................................................................................... 53 Appendix F – Phantom Calibration Data Sheets.................................................................................. 70

Report Number: R&D.20160802
© 2016 RF Exposure Lab, LLC Page 3 of 71 This report shall not be reproduced except in full without the written approval of RF Exposure Lab, LLC.
1. Introduction
This measurement report shows the results of the Lif3 Americas Model Radi-Chip with iPhone 5se with FCC Part 2, 1093, ET Docket 93-62 Rules for mobile and portable devices. The FCC has adopted the guidelines for evaluating the environmental effects of radio frequency radiation in ET Docket 93-62 on August 6, 1996 to protect the public and workers from the potential hazards of RF emissions due to FCC regulated portable devices. [1], [6]
The test results recorded herein are based on a single type test of Lif3 Americas Model Radi-Chip with iPhone 5se and therefore apply only to the tested sample.
The test procedures, as described in ANSI C95.1 – 1999 Standard for Safety Levels with Respect to Human Exposure to Radio Frequency Electromagnetic Fields, 3 kHz to 300 GHz [2], ANSI C95.3 – 2002 Recommended Practice for the Measurement of Potentially Hazardous Electromagnetic Fields [3], and IEC 62209 Human exposure to radio frequency fields from hand-held and body-mounted wireless communication devices - Human models, instrumentation, and procedures[5] were employed.

Report Number: R&D.20160802
© 2016 RF Exposure Lab, LLC Page 4 of 71 This report shall not be reproduced except in full without the written approval of RF Exposure Lab, LLC.
SAR Definition [5]
Specific Absorption Rate is defined as the time derivative (rate) of the incremental energy (dW) absorbed by (dissipated in) an incremental mass (dm) contained in a volume element (dV) of a
given density (ρ).
=
=
dV
dW
dt
d
dm
dW
dt
dSAR
ρ
SAR is expressed in units of watts per kilogram (W/kg). SAR can be related to the electric field at a point by
ρσ 2|| E
SAR =
where:
σ = conductivity of the tissue (S/m)
ρ = mass density of the tissue (kg/m3)
E = rms electric field strength (V/m)

Report Number: R&D.20160802
© 2016 RF Exposure Lab, LLC Page 5 of 71 This report shall not be reproduced except in full without the written approval of RF Exposure Lab, LLC.
2. SAR Measurement Setup
Robotic System These measurements are performed using the DASY52 automated dosimetric assessment system. The DASY52 is made by Schmid & Partner Engineering AG (SPEAG) in Zurich, Switzerland and consists of high precision robotics system (Staubli), robot controller, Intel Core2 computer, near-field probe, probe alignment sensor, and the generic twin phantom containing the brain equivalent material. The robot is a six-axis industrial robot performing precise movements to position the probe to the location (points) of maximum electromagnetic field (EMF) (see Fig. 2.1).
System Hardware A cell controller system contains the power supply, robot controller teach pendant (Joystick), and a remote control used to drive the robot motors. The PC consists of the HP Intel Core2 computer with Windows XP system and SAR Measurement Software DASY52, A/D interface card, monitor, mouse, and keyboard. The Staubli Robot is connected to the cell controller to allow software manipulation of the robot. A data acquisition electronic (DAE) circuit that performs the signal amplification, signal multiplexing, AD-conversion, offset measurements, mechanical surface detection, collision detection, etc. is connected to the Electro-optical coupler (EOC). The EOC performs the conversion from the optical into digital electric signal of the DAE and transfers data to the PC plug-in card.
Figure 2.1 SAR Measurement System Setup

Report Number: R&D.20160802
© 2016 RF Exposure Lab, LLC Page 6 of 71 This report shall not be reproduced except in full without the written approval of RF Exposure Lab, LLC.
System Electronics The DAE4 consists of a highly sensitive electrometer-grade preamplifier with auto-zeroing, a channel and gain-switching multiplexer, a fast 16 bit AD-converter and a command decoder and control logic unit. Transmission to the PC-card is accomplished through an optical downlink for data and status information and an optical uplink for commands and clock lines. The mechanical probe mounting device includes two different sensor systems for frontal and sidewise probe contacts. They are also used for mechanical surface detection and probe collision detection. The robot uses its own controller with a built in VME-bus computer. The system is described in detail in.
Probe Measurement System
The SAR measurements were conducted with the dosimetric probe EX3DV4, designed in the classical triangular configuration (see Fig. 2.2) and optimized for dosimetric evaluation. The probe is constructed using the thick film technique; with printed resistive lines on ceramic substrates. The probe is equipped with an optical multi fiber line ending at the front of the probe tip. (see Fig. 2.3) It is connected to the EOC box on the robot arm and provides an automatic detection of the phantom surface. Half of the fibers are connected to a pulsed infrared transmitter, the other half to a synchronized receiver. As the probe approaches the surface, the reflection from the surface produces a coupling from the transmitting to the receiving fibers. This reflection increases first during the approach, reaches maximum and then decreases. If the probe is flatly touching the surface, the coupling is zero. The distance of the coupling maximum to the surface is independent of the surface reflectivity and largely independent of the surface to probe angle. The DASY52 software reads the reflection during a software approach and looks for the maximum using a 2nd order fitting. The approach is stopped at reaching the maximum. DAE System

Report Number: R&D.20160802
© 2016 RF Exposure Lab, LLC Page 7 of 71 This report shall not be reproduced except in full without the written approval of RF Exposure Lab, LLC.
Probe Specifications
Calibration: In air from 10 MHz to 6.0 GHz In brain and muscle simulating tissue at Frequencies of 450 MHz, 835 MHz, 1750 MHz, 1900 MHz, 2450 MHz, 2600 MHz, 3500 MHz, 5200 MHz, 5300 MHz, 5600 MHz, 5800 MHz
Frequency: 10 MHz to 6 GHz Linearity: ±0.2dB (30 MHz to 6 GHz) Dynamic: 10 mW/kg to 100 W/kg Range: Linearity: ±0.2dB Dimensions: Overall length: 330 mm Tip length: 20 mm Body diameter: 12 mm Tip diameter: 2.5 mm Distance from probe tip to sensor center: 1 mm Application: SAR Dosimetry Testing
Compliance tests of wireless device
Figure 2.2 Triangular Probe Configurations
Figure 2.3 Probe Thick-Film Technique
Report Number: R&D.20160802
© 2016 RF Exposure Lab, LLC Page 8 of 71 This report shall not be reproduced except in full without the written approval of RF Exposure Lab, LLC.
Probe Calibration Process
Dosimetric Assessment Procedure Each probe is calibrated according to a dosimetric assessment procedure described in with accuracy better than +/- 10%. The spherical isotropy was evaluated with the procedure described in and found to be better than +/-0.25dB. The sensitivity parameters (Norm X, Norm Y, Norm Z), the diode compression parameter (DCP) and the conversion factor (Conv F) of the probe is tested.
Free Space Assessment
The free space E-field from amplified probe outputs is determined in a test chamber. This is performed in a TEM cell for frequencies below 1 GHz, and in a waveguide above 1GHz for free space. For the free space calibration, the probe is placed in the volumetric center of the cavity at the proper orientation with the field. The probe is then rotated 360 degrees until the three channels show the maximum reading. The power density readings equates to 1 mW/cm2.
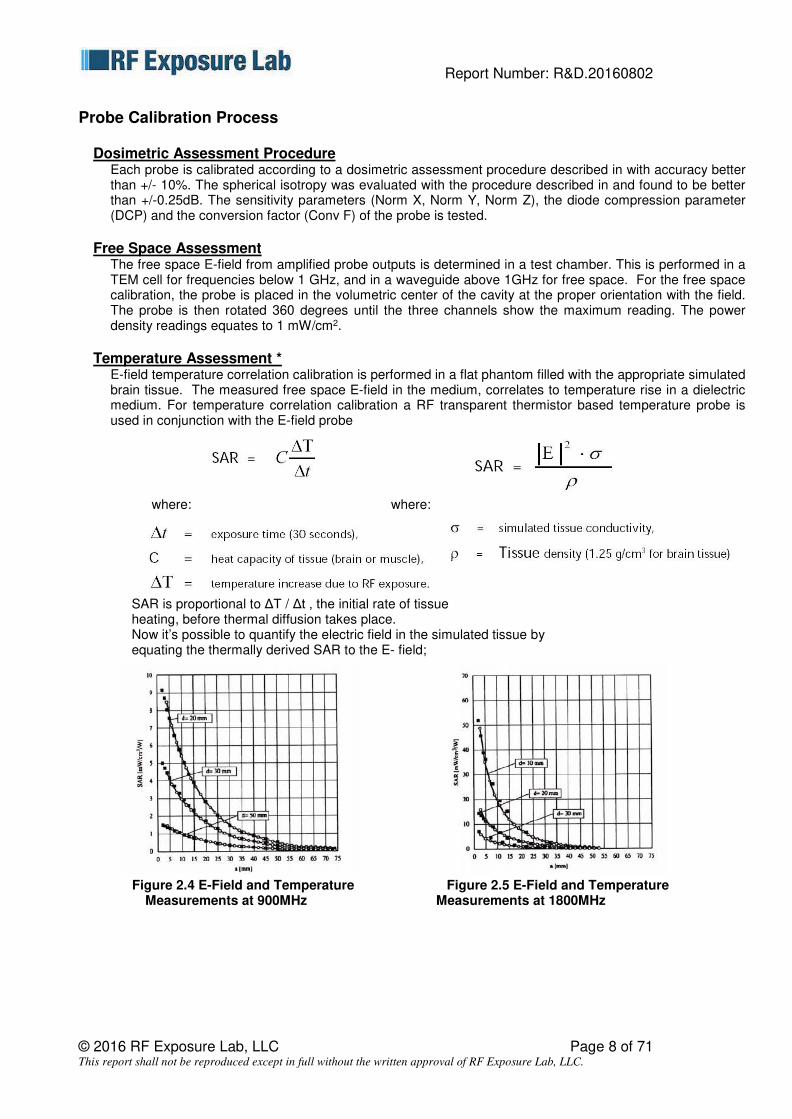
Temperature Assessment *
E-field temperature correlation calibration is performed in a flat phantom filled with the appropriate simulated brain tissue. The measured free space E-field in the medium, correlates to temperature rise in a dielectric medium. For temperature correlation calibration a RF transparent thermistor based temperature probe is used in conjunction with the E-field probe
where: where:
SAR is proportional to ΔT / Δt , the initial rate of tissue heating, before thermal diffusion takes place. Now it’s possible to quantify the electric field in the simulated tissue by equating the thermally derived SAR to the E- field;
Figure 2.4 E-Field and Temperature Figure 2.5 E-Field and Temperature Measurements at 900MHz Measurements at 1800MHz
Report Number: R&D.20160802
© 2016 RF Exposure Lab, LLC Page 9 of 71 This report shall not be reproduced except in full without the written approval of RF Exposure Lab, LLC.
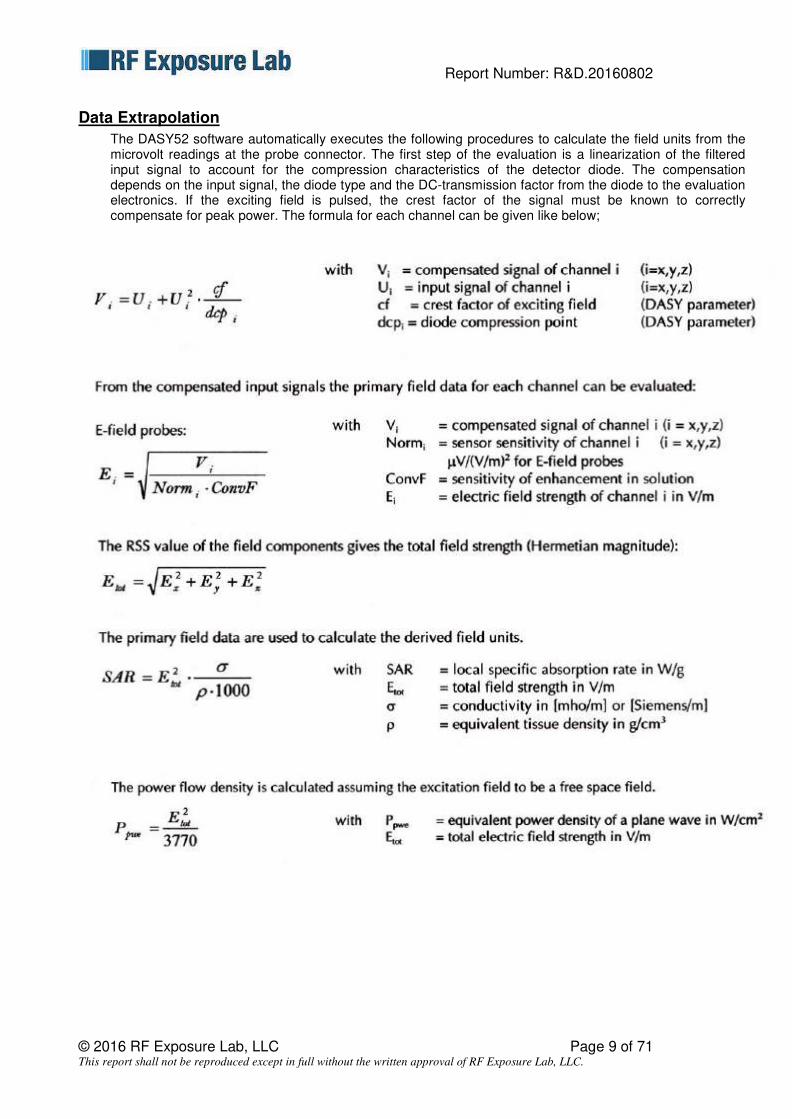
Data Extrapolation
The DASY52 software automatically executes the following procedures to calculate the field units from the microvolt readings at the probe connector. The first step of the evaluation is a linearization of the filtered input signal to account for the compression characteristics of the detector diode. The compensation depends on the input signal, the diode type and the DC-transmission factor from the diode to the evaluation electronics. If the exciting field is pulsed, the crest factor of the signal must be known to correctly compensate for peak power. The formula for each channel can be given like below;
Report Number: R&D.20160802
© 2016 RF Exposure Lab, LLC Page 10 of 71 This report shall not be reproduced except in full without the written approval of RF Exposure Lab, LLC.
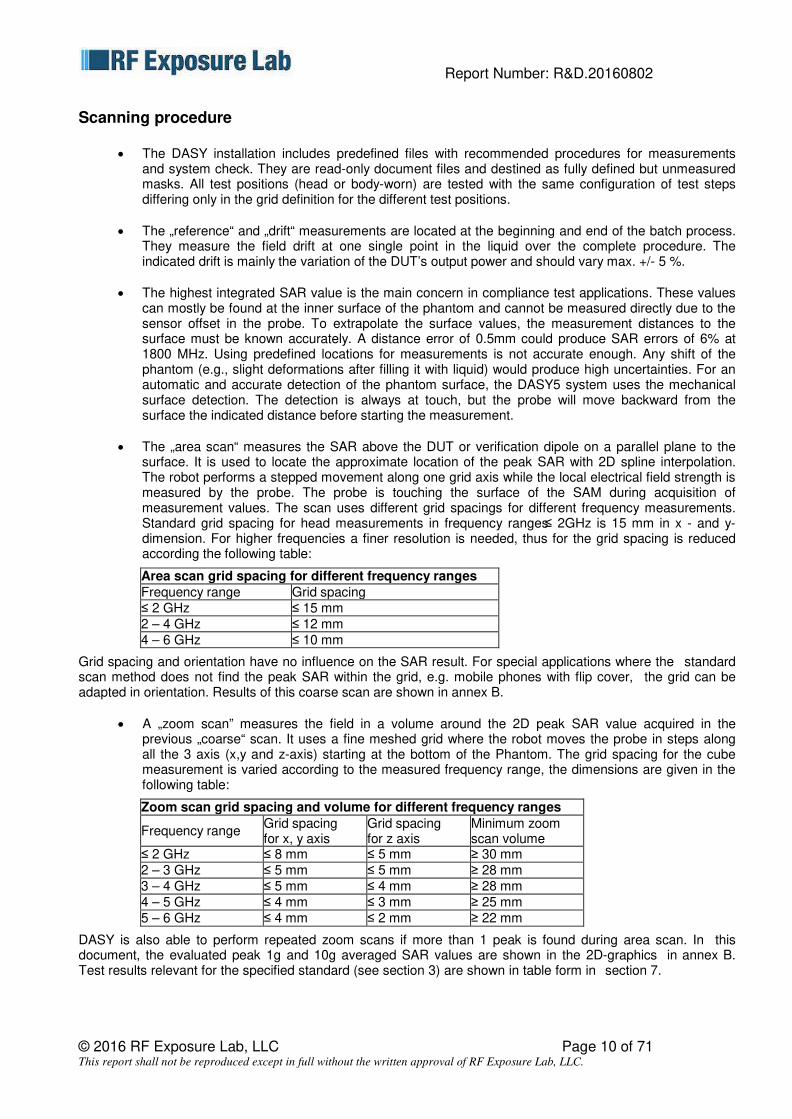
Scanning procedure
• The DASY installation includes predefined files with recommended procedures for measurements and system check. They are read-only document files and destined as fully defined but unmeasured masks. All test positions (head or body-worn) are tested with the same configuration of test steps differing only in the grid definition for the different test positions.
• The „reference“ and „drift“ measurements are located at the beginning and end of the batch process. They measure the field drift at one single point in the liquid over the complete procedure. The indicated drift is mainly the variation of the DUT’s output power and should vary max. +/- 5 %.
• The highest integrated SAR value is the main concern in compliance test applications. These values can mostly be found at the inner surface of the phantom and cannot be measured directly due to the sensor offset in the probe. To extrapolate the surface values, the measurement distances to the surface must be known accurately. A distance error of 0.5mm could produce SAR errors of 6% at 1800 MHz. Using predefined locations for measurements is not accurate enough. Any shift of the phantom (e.g., slight deformations after filling it with liquid) would produce high uncertainties. For an automatic and accurate detection of the phantom surface, the DASY5 system uses the mechanical surface detection. The detection is always at touch, but the probe will move backward from the surface the indicated distance before starting the measurement.
• The „area scan“ measures the SAR above the DUT or verification dipole on a parallel plane to the surface. It is used to locate the approximate location of the peak SAR with 2D spline interpolation. The robot performs a stepped movement along one grid axis while the local electrical field strength is measured by the probe. The probe is touching the surface of the SAM during acquisition of measurement values. The scan uses different grid spacings for different frequency measurements. Standard grid spacing for head measurements in frequency ranges≤ 2GHz is 15 mm in x - and y- dimension. For higher frequencies a finer resolution is needed, thus for the grid spacing is reduced according the following table:
Area scan grid spacing for different frequency ranges
Frequency range Grid spacing
≤ 2 GHz ≤ 15 mm
2 – 4 GHz ≤ 12 mm
4 – 6 GHz ≤ 10 mm
Grid spacing and orientation have no influence on the SAR result. For special applications where the standard scan method does not find the peak SAR within the grid, e.g. mobile phones with flip cover, the grid can be adapted in orientation. Results of this coarse scan are shown in annex B.
• A „zoom scan” measures the field in a volume around the 2D peak SAR value acquired in the previous „coarse“ scan. It uses a fine meshed grid where the robot moves the probe in steps along all the 3 axis (x,y and z-axis) starting at the bottom of the Phantom. The grid spacing for the cube measurement is varied according to the measured frequency range, the dimensions are given in the following table:
Zoom scan grid spacing and volume for different frequency ranges
Frequency range Grid spacing for x, y axis
Grid spacing for z axis
Minimum zoom scan volume
≤ 2 GHz ≤ 8 mm ≤ 5 mm ≥ 30 mm
2 – 3 GHz ≤ 5 mm ≤ 5 mm ≥ 28 mm
3 – 4 GHz ≤ 5 mm ≤ 4 mm ≥ 28 mm
4 – 5 GHz ≤ 4 mm ≤ 3 mm ≥ 25 mm
5 – 6 GHz ≤ 4 mm ≤ 2 mm ≥ 22 mm
DASY is also able to perform repeated zoom scans if more than 1 peak is found during area scan. In this document, the evaluated peak 1g and 10g averaged SAR values are shown in the 2D-graphics in annex B. Test results relevant for the specified standard (see section 3) are shown in table form in section 7.

Report Number: SAR.20160802
© 2016 RF Exposure Lab, LLC Page 11 of 71 This report shall not be reproduced except in full without the written approval of RF Exposure Lab, LLC.
Spatial Peak SAR Evaluation
The spatial peak SAR - value for 1 and 10 g is evaluated after the Cube measurements have been done. The basis of the evaluation are the SAR values measured at the points of the fine cube grid consisting of all points in the three directions x, y and z. The algorithm that finds the maximal averaged volume is separated into three different stages.
• The data between the dipole center of the probe and the surface of the phantom are extrapolated. This data cannot be measured since the center of the dipole is 1 to 2.7 mm away from the tip of the probe and the distance between the surface and the lowest measuring point is about 1 mm (see probe calibration sheet). The extrapolated data from a cube measurement can be visualized by selecting ‘Graph Evaluated’.
• The maximum interpolated value is searched with a straight-forward algorithm. Around this maximum the SAR - values averaged over the spatial volumes (1g or 10 g) are computed using the 3d-spline interpolation algorithm. If the volume cannot be evaluated (i.e., if a part of the grid was cut off by the boundary of the measurement area) the evaluation will be started on the corners of the bottom plane of the cube.
• All neighbouring volumes are evaluated until no neighbouring volume with a higher average value is found.
Extrapolation
The extrapolation is based on a least square algorithm [W. Gander, Computermathematik, p.168-180]. Through the points in the first 3 cm along the z-axis, polynomials of order four are calculated. These polynomials are then used to evaluate the points between the surface and the probe tip. The points, calculated from the surface, have a distance of 1 mm from each other.
Interpolation
The interpolation of the points is done with a 3d-Spline. The 3d-Spline is composed of three one-dimensional splines with the "Not a knot"-condition [W. Gander, Computermathematik, p.141-150] (x, y and z -direction) [Numerical Recipes in C, Second Edition, p.123ff ].
Volume Averaging
At First the size of the cube is calculated. Then the volume is integrated with the trapezoidal algorithm. 8000 points (20x20x20) are interpolated to calculate the average.
Advanced Extrapolation
DASY uses the advanced extrapolation option which is able to compensate boundary effects on E-field probes.

Report Number: SAR.20160802
© 2016 RF Exposure Lab, LLC Page 12 of 71 This report shall not be reproduced except in full without the written approval of RF Exposure Lab, LLC.
SAM PHANTOM The SAM Twin Phantom V4.0 is constructed of a fiberglass shell integrated in a wooden table. The shape of the shell is based on data from an anatomical study designed to determine the maximum exposure in at least 90% of all users. It enables the dosimetric evaluation of left and right hand phone usage as well as body mounted usage at the flat phantom region. A cover prevents the evaporation of the liquid. Reference markings on the Phantom allow the complete setup of all predefined phantom positions and measurement grids by manually teaching three points in the robot. (see Fig. 2.6)
Phantom Specification
Phantom: SAM Twin Phantom (V4.0) Shell Material: Vivac Composite Thickness: 2.0 ± 0.2 mm
Device Holder for Transmitters
In combination with the SAM Twin Phantom V4.0 the Mounting Device (see Fig. 2.7), enables the rotation of the mounted transmitter in spherical coordinates whereby the rotation point is the ear opening. The devices can be easily, accurately, and repeat ably be positioned according to the FCC, CENELEC, IEC and IEEE specifications. The device holder can be locked at different phantom locations (left head, right head, flat phantom).
Note: A simulating human hand is not used due to the complex anatomical and geometrical structure of the hand that may produce infinite number of configurations. To produce the worst-case condition (the hand absorbs antenna output power), the hand is omitted during the tests.
Figure 2.6 SAM Twin Phantom
Figure 2.7 Mounting Device

Report Number: SAR.20160802
© 2016 RF Exposure Lab, LLC Page 13 of 71 This report shall not be reproduced except in full without the written approval of RF Exposure Lab, LLC.
3. Probe and Dipole Calibration See Appendix D and E.
Report Number: SAR.20160802
© 2016 RF Exposure Lab, LLC Page 14 of 71 This report shall not be reproduced except in full without the written approval of RF Exposure Lab, LLC.
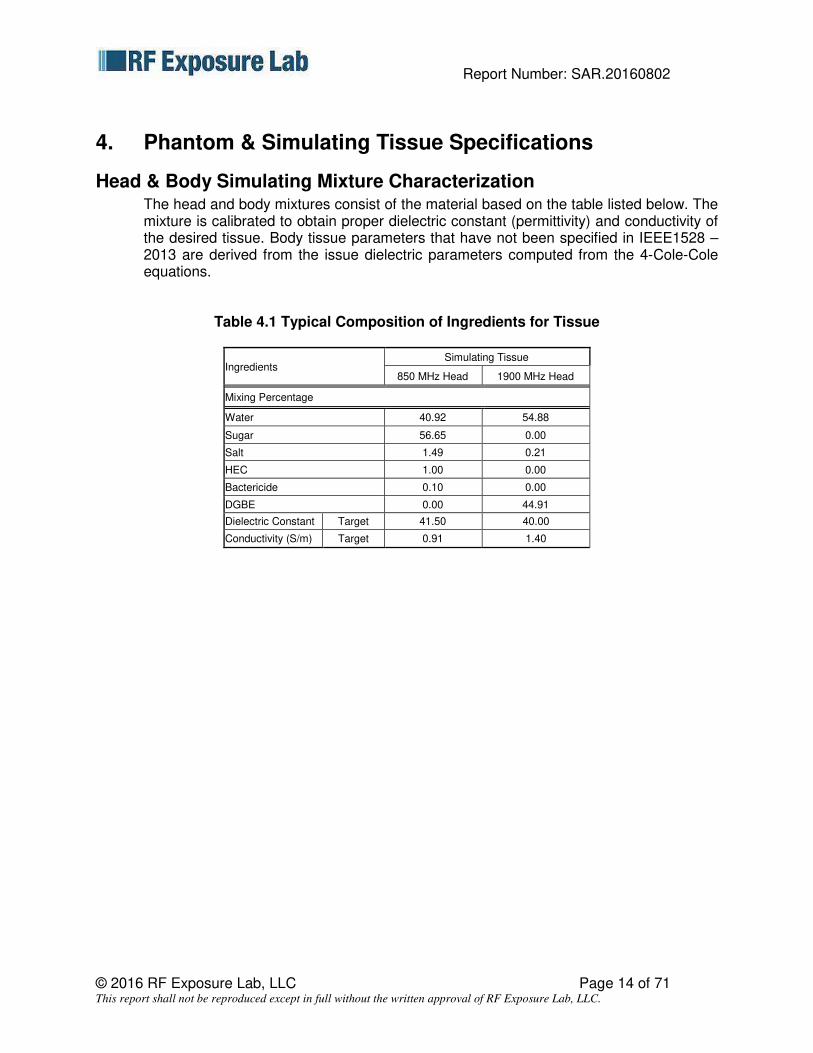
4. Phantom & Simulating Tissue Specifications
Head & Body Simulating Mixture Characterization The head and body mixtures consist of the material based on the table listed below. The mixture is calibrated to obtain proper dielectric constant (permittivity) and conductivity of the desired tissue. Body tissue parameters that have not been specified in IEEE1528 – 2013 are derived from the issue dielectric parameters computed from the 4-Cole-Cole equations.
Table 4.1 Typical Composition of Ingredients for Tissue
Ingredients Simulating Tissue
850 MHz Head 1900 MHz Head
Mixing Percentage
Water 40.92 54.88
Sugar 56.65 0.00
Salt 1.49 0.21
HEC 1.00 0.00
Bactericide 0.10 0.00
DGBE 0.00 44.91
Dielectric Constant Target 41.50 40.00
Conductivity (S/m) Target 0.91 1.40
Report Number: SAR.20160802
© 2016 RF Exposure Lab, LLC Page 15 of 71 This report shall not be reproduced except in full without the written approval of RF Exposure Lab, LLC.
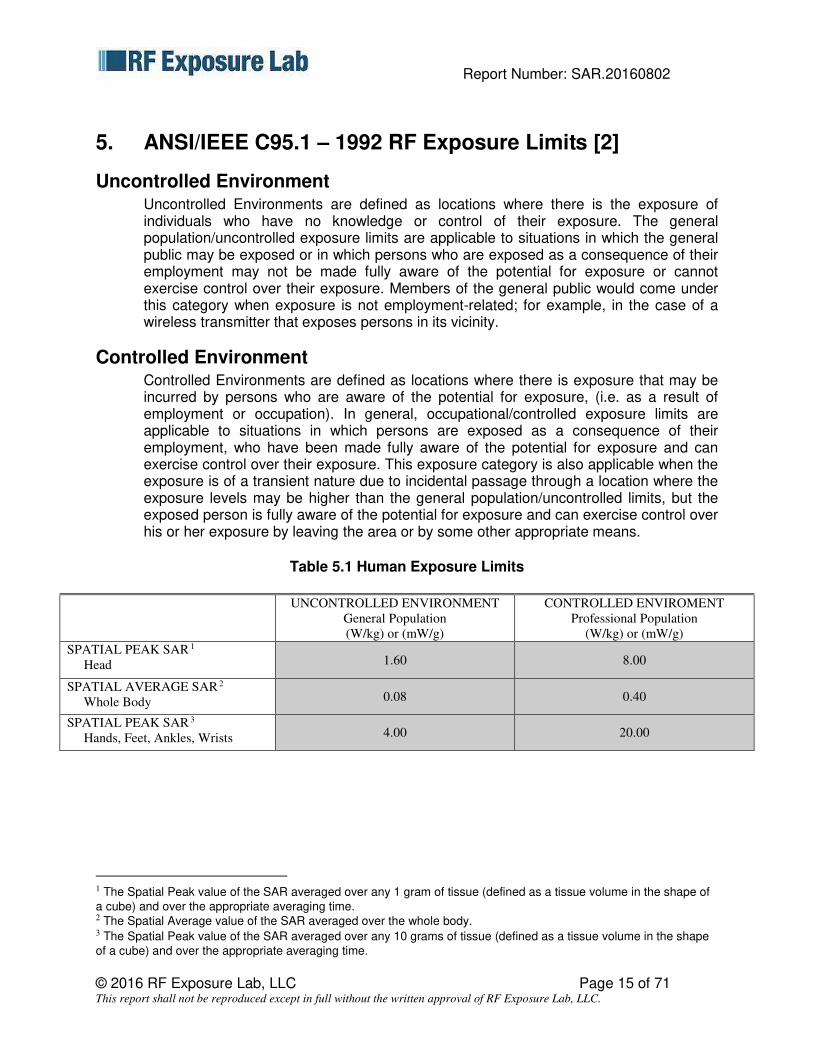
5. ANSI/IEEE C95.1 – 1992 RF Exposure Limits [2]
Uncontrolled Environment Uncontrolled Environments are defined as locations where there is the exposure of individuals who have no knowledge or control of their exposure. The general population/uncontrolled exposure limits are applicable to situations in which the general public may be exposed or in which persons who are exposed as a consequence of their employment may not be made fully aware of the potential for exposure or cannot exercise control over their exposure. Members of the general public would come under this category when exposure is not employment-related; for example, in the case of a wireless transmitter that exposes persons in its vicinity.
Controlled Environment Controlled Environments are defined as locations where there is exposure that may be incurred by persons who are aware of the potential for exposure, (i.e. as a result of employment or occupation). In general, occupational/controlled exposure limits are applicable to situations in which persons are exposed as a consequence of their employment, who have been made fully aware of the potential for exposure and can exercise control over their exposure. This exposure category is also applicable when the exposure is of a transient nature due to incidental passage through a location where the exposure levels may be higher than the general population/uncontrolled limits, but the exposed person is fully aware of the potential for exposure and can exercise control over his or her exposure by leaving the area or by some other appropriate means.
Table 5.1 Human Exposure Limits
UNCONTROLLED ENVIRONMENT General Population (W/kg) or (mW/g)
CONTROLLED ENVIROMENT Professional Population
(W/kg) or (mW/g) SPATIAL PEAK SAR 1 Head 1.60 8.00
SPATIAL AVERAGE SAR 2 Whole Body 0.08 0.40
SPATIAL PEAK SAR 3 Hands, Feet, Ankles, Wrists 4.00 20.00
1 The Spatial Peak value of the SAR averaged over any 1 gram of tissue (defined as a tissue volume in the shape of
a cube) and over the appropriate averaging time. 2 The Spatial Average value of the SAR averaged over the whole body. 3 The Spatial Peak value of the SAR averaged over any 10 grams of tissue (defined as a tissue volume in the shape
of a cube) and over the appropriate averaging time.

Report Number: SAR.20160802
© 2016 RF Exposure Lab, LLC Page 16 of 71 This report shall not be reproduced except in full without the written approval of RF Exposure Lab, LLC.
6. Measurement Uncertainty
Measurement uncertainty table is not required per KDB 865664 D01 v01 section 2.8.2 page 12. SAR measurement uncertainty analysis is required in the SAR report only when the highest measured SAR in a frequency band is ≥ 1.5 W/kg for 1-g SAR. The equivalent ratio (1.5/1.6) should be applied to extremity and occupational exposure conditions. The highest reported value is less than 1.5 W/kg. Therefore, the measurement uncertainty table is not required.

Report Number: SAR.20160802
© 2016 RF Exposure Lab, LLC Page 17 of 71 This report shall not be reproduced except in full without the written approval of RF Exposure Lab, LLC.
7. System Validation
Tissue Verification Table 7.1 Measured Tissue Parameters
835 MHz Head 1900 MHz Head
Date(s) Aug. 11, 2016 Aug. 10, 2016
Liquid Temperature (˚C) 20.0 Target Measured Target Measured
Dielectric Constant: ε 41.50 41.40 40.00 39.56
Conductivity: σ 0.91 0.93 1.40 1.44
See Appendix A for data printout.
Test System Verification Prior to assessment, the system is verified to the ±10% of the specifications at the test frequency by using the system kit. Power is normalized to 1 watt. (Graphic Plots Attached)
Table 7.2 System Dipole Validation Target & Measured
Test
Frequency
Targeted SAR1g (W/kg)
Measure SAR1g (W/kg)
Tissue Used for
Verification Deviation (%) Plot Number
11-Aug-2016 835 MHz 9.23 9.27 Head + 0.43 1
10-Aug-2016 1900 MHz 41.50 41.70 Head + 0.48 2
See Appendix A for data plots.
PM1
Att1
x
Dipole
3D Probe positioner
Flat Phantom Field probe
Signal Generato
Amp Low Pass
3dB
Att3
Dir.Coupler
Att2
PM2
Cable
PM3
s
Spacer
y z
x
Figure 7.1 Dipole Validation Test Setup

Report Number: SAR.20160802
© 2016 RF Exposure Lab, LLC Page 18 of 71 This report shall not be reproduced except in full without the written approval of RF Exposure Lab, LLC.
8. SAR Test Data Summary
See Measurement Result Data Pages See Appendix B for SAR Test Data Plots. See Appendix C for SAR Test Setup Photos.
Procedures Used To Establish Test Signal The device was either placed into simulated transmit mode using the manufacturer’s test codes or the actual transmission is activated through a base station simulator or similar equipment. See data pages for actual procedure used in measurement.
Device Test Condition In order to verify that the device was tested at full power, conducted output power measurements were performed before and after each SAR measurement to confirm the output power unless otherwise noted. If a conducted power deviation of more than 5% occurred, the test was repeated. The power drift of each test is measured at the start of the test and again at the end of the test. The drift percentage is calculated by the formula ((end/start)-1)*100 and rounded to three decimal places. The drift percentage is calculated into the resultant SAR value on the data sheet for each test. Positioning of the Radi-Chip was determined by the client for all testing.

Report Number: SAR.20160802
© 2016 RF Exposure Lab, LLC Page 19 of 71 This report shall not be reproduced except in full without the written approval of RF Exposure Lab, LLC.
9. FCC 3G Measurement Procedures Power measurements were performed using a base station simulator under average power.
9.1 Procedures Used to Establish RF Signal for SAR The device was placed into a simulated call using a base station simulator in a screen room. Such test signals offer a consistent means for testing SAR and recommended for evaluating SAR. The SAR measurement software calculates a reference point at the start and end of the test to check for power drifts. If conducted power deviations of more than 5% occurred, the tests were repeated.
9.2 SAR Measurement Conditions for WCDMA/HSDPA/HSUPA Configure the call box 8960 to support all WCDMA tests in respect to the 3GPP 34.121 (listed in Table below). Measure the power at Ch4132, 4182 and 4233 for US cell; Ch9262, 9400 and 9538 for US PCS band. For Rel99
• Set a Test Mode 1 loop back with a 12.2kbps Reference Measurement Channel (RMC).
• Set and send continuously Up power control commands to the device
• Measure the power at the device antenna connector using the power meter with average detector.
For HSDPA Rel 6
• Establish a Test Mode 1 look back with both 1 12.2kbps RMC channel and a H-Set1 Fixed Reference Channel (FRC). With the 8960 this is accomplished by setting the signal Channel Coding to “Fixed Reference Channel” and configuring for HSET-1 QKSP.
• Set beta values and HSDPA settings for HSDPA Subtest1 according to Table below.
• Send continuously Up power control commands to the device
• Measure the power at the device antenna connector using the power meter with modulated average detector.
• Repeat the measurement for the HSDPA Subtest2, 3 and 4 as given in Table below.
For HSUPA Rel 6
• Use UL RMC 12.2kbps and FRC H-Set1 QPSK, Test Mode 1 loop back. With the 8960 this is accomplished by setting the signal Channel Coding to “E-DCH Test Channel” and configuring the equipment category to Cat5_10ms.
• Set the Absolute Grant for HSUPA Subtest1 according to Table below.
• Set the device power to be at least 5dB lower than the Maximum output power
• Send power control bits to give one TPC_cmd = +1 command to the device. If device doesn’t send any E-DPCH data with decreased E-TFCI within 500ms, then repeat this process until the decreased E-TFCI is reported.
• Confirm that the E-TFCI transmitted by the device is equal to the target E-TFCI in Table below. If the E-TFCI transmitted by the device is not equal to the target E-TFCI, then send power control bits to give one TPC_cmd = -1 command to the UE. If UE sends any E-DPCH data with decreased E-TFCI within 500 ms, send new power control bits to give one TPC_cmd = -1 command to the UE. Then confirm that the E-TFCI transmitted by the UE is equal to the target E-TFCI in Table below.
• Measure the power using the power meter with modulated average detector.

Report Number: SAR.20160802
© 2016 RF Exposure Lab, LLC Page 20 of 71 This report shall not be reproduced except in full without the written approval of RF Exposure Lab, LLC.
SAR Data Summary – 850 MHz
MEASUREMENT RESULTS
Gap Plot Frequency
Mod. Phone Pos. Config. RMC/RB Test Setup/
Offset
Measured SAR
(W/kg)
% Reduced MHz Ch.
0 mm
1 836.6 4183 WCDMA
iPhone 5se
Right Baseline 12.2 kbps Test Loop 1 0.490
-80.35 2 836.6 4183 WCDMA With Chip 12.2 kbps Test Loop 1 0.0963
3 836.6 4183 WCDMA Left
Baseline 12.2 kbps Test Loop 1 0.609 -80.30
4 836.6 4183 WCDMA With Chip 12.2 kbps Test Loop 1 0.120
Body
1.6 W/kg (mW/g) averaged over 1 gram
1. Battery is fully charged for all tests. Power Measured Conducted ERP EIRP
2. SAR Measurement Phantom Configuration Left Head Eli4 Right Head SAR Configuration Head Body
3. Test Signal Call Mode Test Code Base Station Simulator 4. Test Configuration With Belt Clip Without Belt Clip N/A 5. Tissue Depth is at least 15.0 cm
Jay M. Moulton Vice President

Report Number: SAR.20160802
© 2016 RF Exposure Lab, LLC Page 21 of 71 This report shall not be reproduced except in full without the written approval of RF Exposure Lab, LLC.
SAR Data Summary – 1900 MHz
MEASUREMENT RESULTS
Gap Plot Frequency
Mod. Phone Pos. Config. RMC/RB Test Setup/
Offset
Measured SAR
(W/kg)
% Reduced MHz Ch.
0 mm
5 1880 9400 WCDMA
iPhone 5se
Right Baseline 12.2 kbps Test Loop 1 0.789
-93.35 6 1880 9400 WCDMA With Chip 12.2 kbps Test Loop 1 0.0525
7 1880 9400 WCDMA Left
Baseline 12.2 kbps Test Loop 1 0.559 -96.40
8 1880 9400 WCDMA With Chip 12.2 kbps Test Loop 1 0.0201
Body
1.6 W/kg (mW/g) averaged over 1 gram
1. Battery is fully charged for all tests. Power Measured Conducted ERP EIRP
2. SAR Measurement Phantom Configuration Left Head Eli4 Right Head SAR Configuration Head Body
3. Test Signal Call Mode Test Code Base Station Simulator 4. Test Configuration With Belt Clip Without Belt Clip N/A 5. Tissue Depth is at least 15.0 cm
Jay M. Moulton Vice President

Report Number: SAR.20160802
© 2016 RF Exposure Lab, LLC Page 22 of 71 This report shall not be reproduced except in full without the written approval of RF Exposure Lab, LLC.
10. Test Equipment List
Table 10.1 Equipment Specifications
Type Calibration Due Date Calibration Done Date Serial Number Staubli Robot TX60L N/A N/A F07/55M6A1/A/01
Measurement Controller CS8c N/A N/A 1012 Twin Phantom N/A N/A 1416
Device Holder N/A N/A N/A
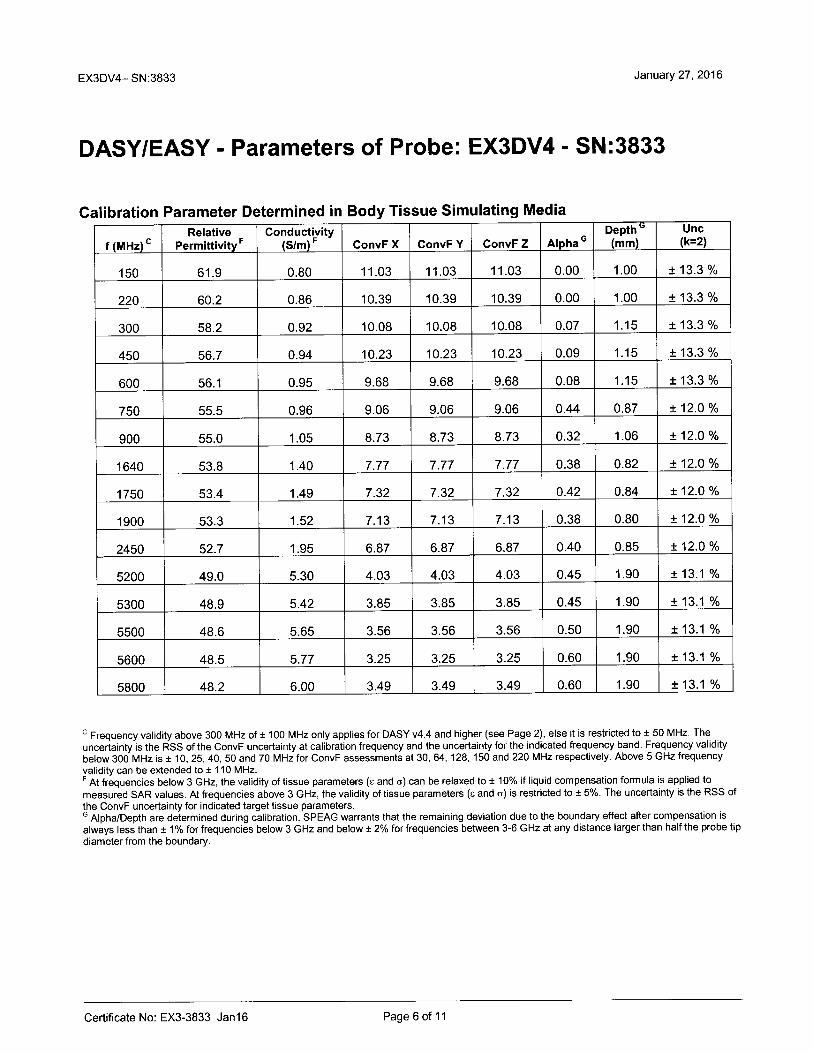
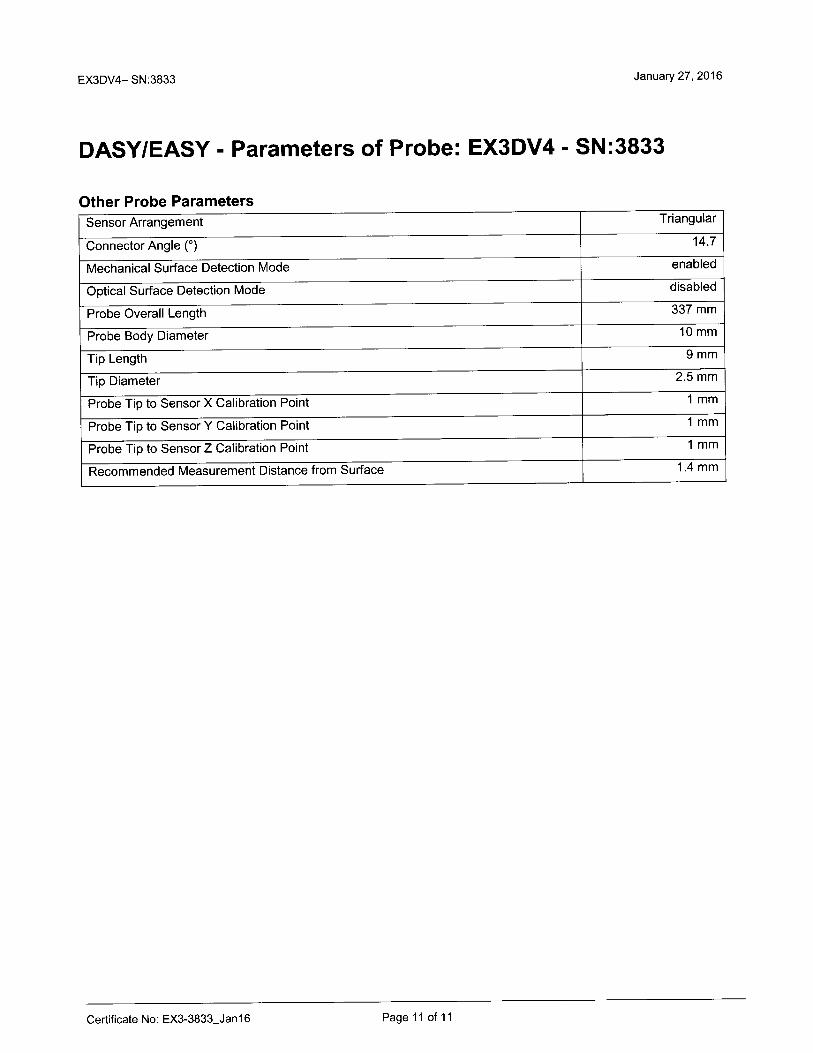
Data Acquisition Electronics 4 01/14/2017 01/14/2016 1321 SPEAG E-Field Probe EX3DV4 01/27/2017 01/27/2016 3833
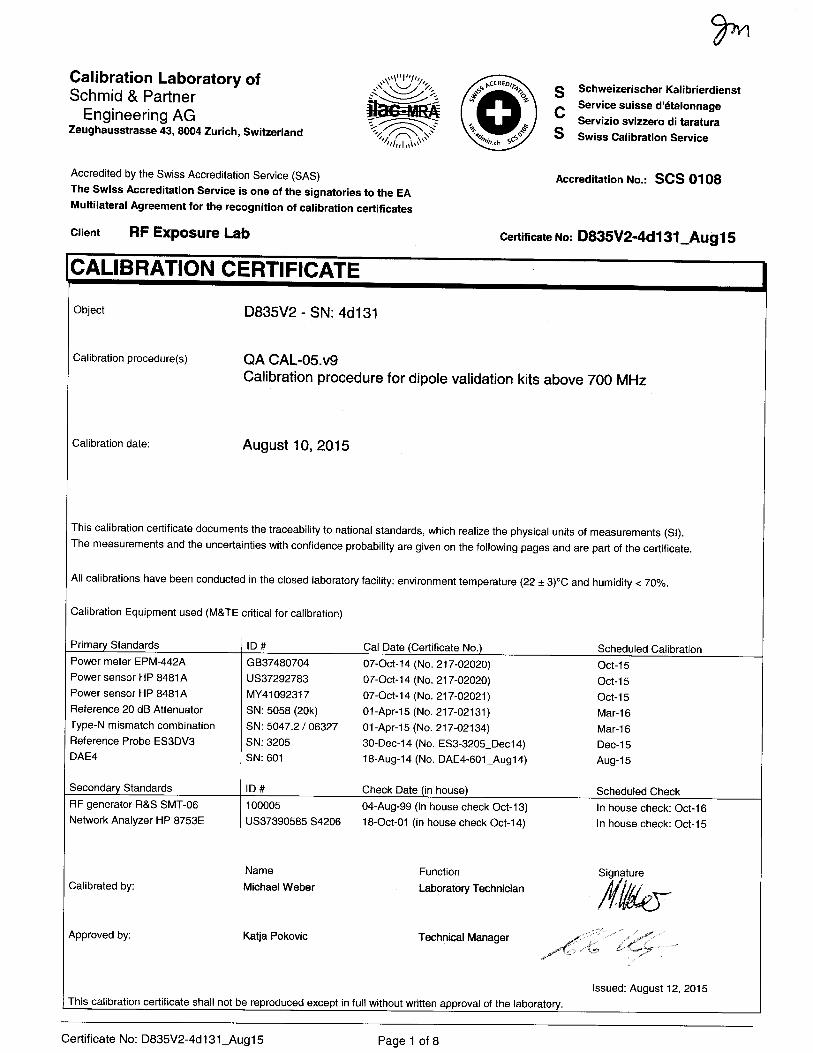
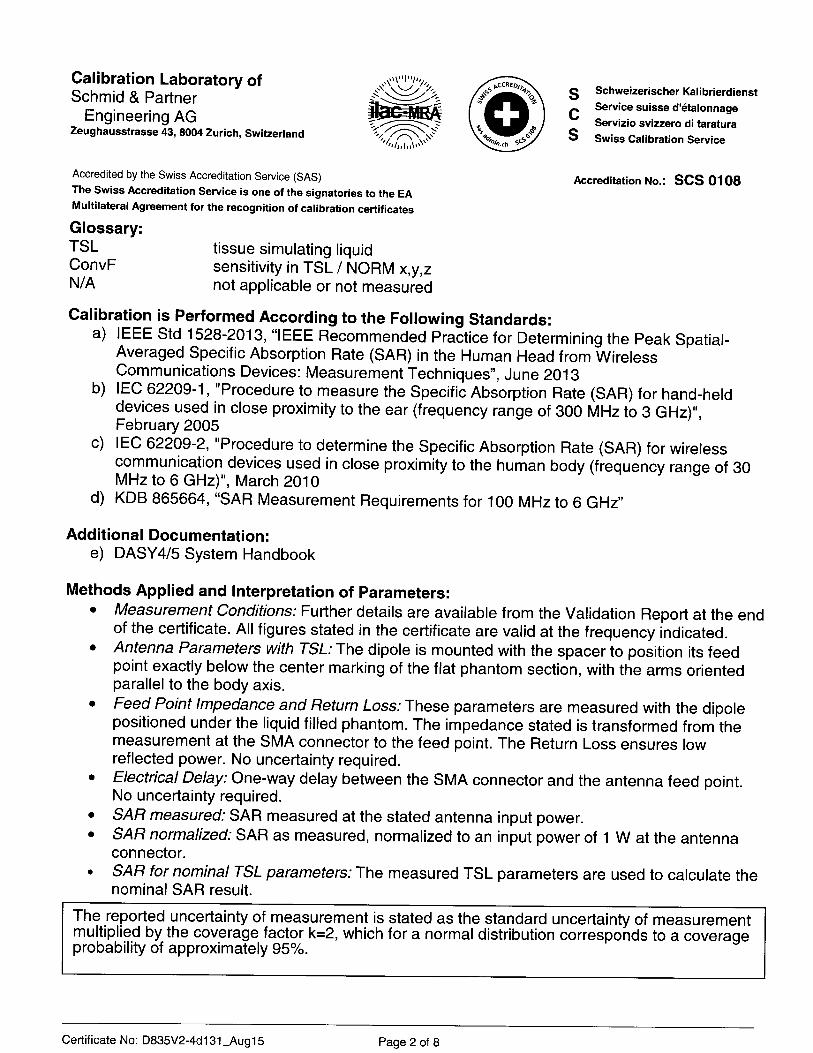
Speag Validation Dipole D835V2 08/10/2016 08/10/2015 4d131 Speag Validation Dipole D1900V2 08/13/2016 08/13/2015 5d147
Agilent N1911A Power Meter 05/20/2017 05/20/2015 GB45100254 Agilent N1922A Power Sensor 06/25/2017 06/25/2015 MY45240464 Advantest R3261A Spectrum Analyzer 03/26/2017 03/26/2015 31720068
Agilent (HP) 8350B Signal Generator 03/26/2017 03/26/2015 2749A10226
Agilent (HP) 83525A RF Plug-In 03/26/2017 03/26/2015 2647A01172
Agilent (HP) 8753C Vector Network Analyzer 03/26/2017 03/26/2015 3135A01724
Agilent (HP) 85047A S-Parameter Test Set 03/26/2017 03/26/2015 2904A00595 Agilent (HP) 8960 Base Station Sim. 03/31/2017 03/31/2015 MY48360364
Anritsu MT8820C 07/28/2017 07/28/2015 6201176199 Agilent 778D Dual Directional Coupler N/A N/A MY48220184
MiniCircuits BW-N20W5+ Fixed 20 dB Attenuator
N/A N/A N/A
MiniCircuits SPL-10.7+ Low Pass Filter N/A N/A R8979513746
Aprel Dielectric Probe Assembly N/A N/A 0011
Head Equivalent Matter (835 MHz) N/A N/A N/A
Head Equivalent Matter (1900 MHz) N/A N/A N/A

Report Number: SAR.20160802
© 2016 RF Exposure Lab, LLC Page 23 of 71 This report shall not be reproduced except in full without the written approval of RF Exposure Lab, LLC.
11. Conclusion The SAR measurement indicates that the EUT complies with the RF radiation exposure limits of the FCC. These measurements are taken to simulate the RF effects exposure under worst-case conditions. Precise laboratory measures were taken to assure repeatability of the tests. The tested device complies with the requirements in respect to all parameters subject to the test. The test results and statements relate only to the item(s) tested. Please note that the absorption and distribution of electromagnetic energy in the body is a very complex phenomena that depends on the mass, shape, and size of the body; the orientation of the body with respect to the field vectors; and, the electrical properties of both the body and the environment. Other variables that may play a substantial role in possible biological effects are those that characterize the environment (e.g. ambient temperature, air velocity, relative humidity, and body insulation) and those that characterize the individual (e.g. age, gender, activity level, debilitation, or disease). Because innumerable factors may interact to determine the specific biological outcome of an exposure to electromagnetic fields, any protection guide shall consider maximal amplification of biological effects as a result of field-body interactions, environmental conditions, and physiological variables.
Report Number: SAR.20160802
© 2016 RF Exposure Lab, LLC Page 24 of 71 This report shall not be reproduced except in full without the written approval of RF Exposure Lab, LLC.
12. References [1] Federal Communications Commission, ET Docket 93-62, Guidelines for Evaluating the Environmental Effects of Radio Frequency Radiation, August 1996 [2] ANSI/IEEE C95.1 – 1992, American National Standard Safety Levels with respect to Human Exposure to Radio Frequency Electromagnetic Fields, 300kHz to 100GHz, New York: IEEE, 1992. [3] ANSI/IEEE C95.3 – 1992, IEEE Recommended Practice for the Measurement of Potentially Hazardous Electromagnetic Fields – RF and Microwave, New York: IEEE, 1992. [4] International Electrotechnical Commission, IEC 62209-2 (Edition 1.0), Human Exposure to radio frequency fields from hand-held and body mounted wireless communication devices – Human models, instrumentation, and procedures – Part 2: Procedure to determine the specific absorption rate (SAR) for wireless communication devices used in close proximity to the human body (frequency range of 30 MHz to 6 GHz), March 2010. [5] IEEE Standard 1528 – 2013, IEEE Recommended Practice for Determining the Peak-Spatial Average Specific Absorption Rate (SAR) in the Human Head from Wireless Communication Devices: Measurement Techniques, June 2013. [6] Industry Canada, RSS – 102 Issue 5, Radio Frequency Exposure Compliance of Radiocommunication Apparatus (All Frequency Bands), March 2015. [7] Health Canada, Safety Code 6, Limits of Human Exposure to Radiofrequency Electromagnetic Fields in the Frequency Range from 3kHz to 300 GHz, 2009.

Report Number: SAR.20160802
© 2016 RF Exposure Lab, LLC Page 25 of 71 This report shall not be reproduced except in full without the written approval of RF Exposure Lab, LLC.
Appendix A – System Validation Plots and Data ************************************************************
Test Result for UIM Dielectric Parameter
Thu 11/Aug/2016
Freq Frequency(GHz)
FCC_eH Limits for Head Epsilon
FCC_sH Limits for Head Sigma
Test_e Epsilon of UIM
Test_s Sigma of UIM
************************************************************
Freq FCC_eH FCC_sH Test_e Test_s
0.8050 41.66 0.90 41.53 0.90
0.8150 41.60 0.90 41.48 0.91
0.8250 41.55 0.90 41.44 0.92
0.8350 41.50 0.90 41.40 0.93
0.8366 41.50 0.902 41.395 0.932*
0.8450 41.50 0.91 41.37 0.94
0.8550 41.50 0.92 41.35 0.95
0.8650 41.50 0.93 41.33 0.96
* value interpolated
************************************************************
Test Result for UIM Dielectric Parameter
Wed 10/Aug/2016
Freq Frequency(GHz)
FCC_eH Limits for Head Epsilon
FCC_sH Limits for Head Sigma
Test_e Epsilon of UIM
Test_s Sigma of UIM
************************************************************
Freq FCC_eH FCC_sH Test_e Test_s
1.8700 40.00 1.40 39.62 1.41
1.8800 40.00 1.40 39.59 1.42
1.8900 40.00 1.40 39.58 1.43
1.9000 40.00 1.40 39.56 1.44
1.9100 40.00 1.40 39.54 1.44
1.9200 40.00 1.40 39.52 1.45
1.9300 40.00 1.40 38.49 1.46

Report Number: SAR.20160802
© 2016 RF Exposure Lab, LLC Page 26 of 71 This report shall not be reproduced except in full without the written approval of RF Exposure Lab, LLC.
RF Exposure Lab
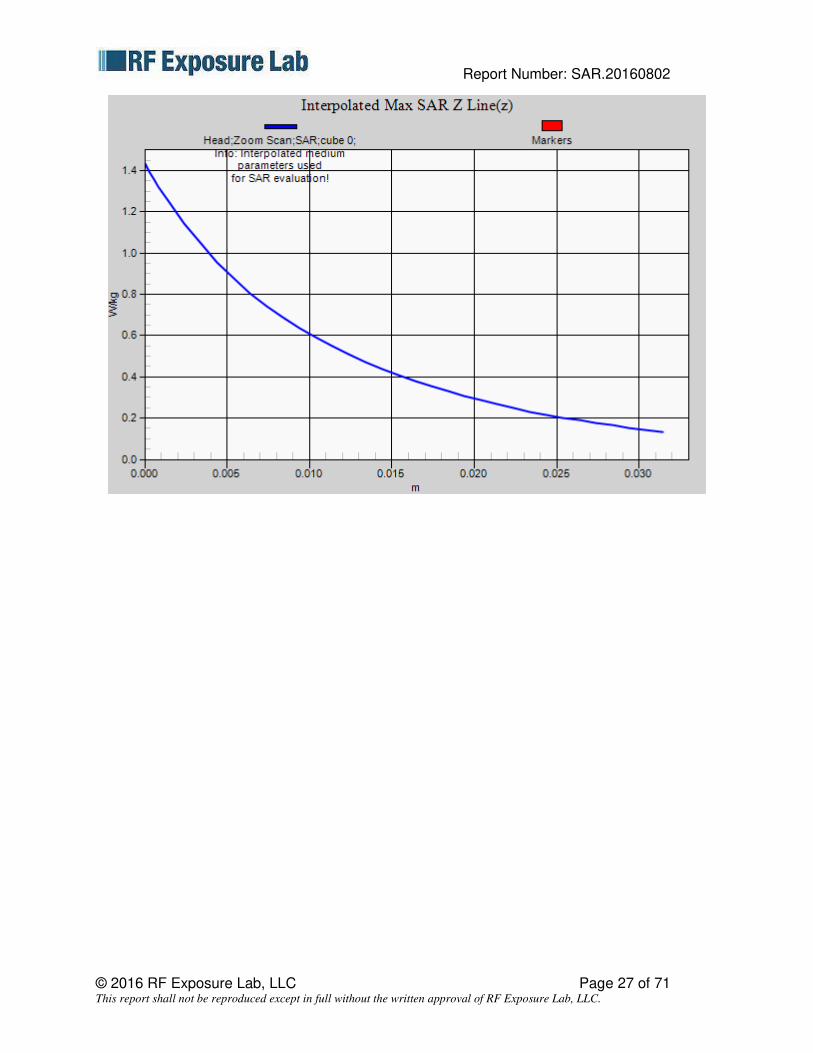
Plot 1 DUT: Dipole 835 MHz D835V2; Type: D835V2; Serial: D835V2 - SN:4d131 Communication System: CW; Frequency: 835 MHz; Duty Cycle: 1:1 Medium: HSL835; Medium parameters used: f = 835 MHz; σ = 0.93 mho/m; εr = 41.4; ρ = 1000 kg/m3 Phantom section: Flat Section Test Date: Date: 8/11/2016; Ambient Temp: 23 °C; Tissue Temp: 21 °C Probe: EX3DV4 - SN3833; ConvF(8.72, 8.72, 8.72); Calibrated: 1/27/2016; Sensor-Surface: 2mm (Mechanical Surface Detection) Electronics: DAE4 Sn1321; Calibrated: 1/14/2016 Phantom: SAM with CRP; Type: SAM; Serial: 1554 Measurement SW: DASY52, Version 52.8 (8); SEMCAD X Version 14.6.10 (7331)
Procedure Notes: 835 MHz Verification/Head/Area Scan (61x101x1): Interpolated grid: dx=1.500 mm, dy=1.500 mm Info: Interpolated medium parameters used for SAR evaluation. Maximum value of SAR (interpolated) = 0.973 W/kg 835 MHz Verification/Head/Zoom Scan (5x5x7)/Cube 0: Measurement grid: dx=8mm, dy=8mm, dz=5mm Reference Value = 55.385 V/m; Power Drift = -0.01 dB Peak SAR (extrapolated) = 1.432 mW/g SAR(1 g) = 0.927 mW/g; SAR(10 g) = 0.605 mW/g Info: Interpolated medium parameters used for SAR evaluation. Maximum value of SAR (measured) = 1.25 W/kg
Report Number: SAR.20160802
© 2016 RF Exposure Lab, LLC Page 27 of 71 This report shall not be reproduced except in full without the written approval of RF Exposure Lab, LLC.

Report Number: SAR.20160802
© 2016 RF Exposure Lab, LLC Page 28 of 71 This report shall not be reproduced except in full without the written approval of RF Exposure Lab, LLC.
RF Exposure Lab
Plot 2 DUT: Dipole 1900 MHz D1900V2; Type: D1900V2; Serial: 5d147 Communication System: CW; Frequency: 1900 MHz; Duty Cycle: 1:1 Medium: HSL1900; Medium parameters used: f = 1900 MHz; σ = 1.44 mho/m; εr = 39.56; ρ = 1000 kg/m3 Phantom section: Flat Section Test Date: Date: 8/10/2016; Ambient Temp: 23 °C; Tissue Temp: 21 °C Probe: EX3DV4 - SN3833; ConvF(7.27, 7.27, 7.27); Calibrated: 1/27/2016; Sensor-Surface: 2mm (Mechanical Surface Detection) Electronics: DAE4 Sn1321; Calibrated: 1/14/2016 Phantom: SAM with CRP; Type: SAM; Serial: 1554 Measurement SW: DASY52, Version 52.8 (8); SEMCAD X Version 14.6.10 (7331)
Procedure Notes: 1900 MHz Verification/Head/Area Scan (61x81x1): Interpolated grid: dx=1.500 mm, dy=1.500 mm Maximum value of SAR (interpolated) = 4.56 W/kg 1900 MHz Verification/Head/Zoom Scan (5x5x7)/Cube 0: Measurement grid: dx=8mm, dy=8mm, dz=5mm Reference Value = 55.385 V/m; Power Drift = -0.01 dB Peak SAR (extrapolated) = 7.437 mW/g SAR(1 g) = 4.17 mW/g; SAR(10 g) = 2.19 mW/g Maximum value of SAR (measured) = 6.14 W/kg

Report Number: SAR.20160802
© 2016 RF Exposure Lab, LLC Page 29 of 71 This report shall not be reproduced except in full without the written approval of RF Exposure Lab, LLC.

Report Number: SAR.20160802
© 2016 RF Exposure Lab, LLC Page 30 of 71 This report shall not be reproduced except in full without the written approval of RF Exposure Lab, LLC.
Appendix B – SAR Test Data Plots

Report Number: SAR.20160802
© 2016 RF Exposure Lab, LLC Page 31 of 71 This report shall not be reproduced except in full without the written approval of RF Exposure Lab, LLC.
RF Exposure Lab
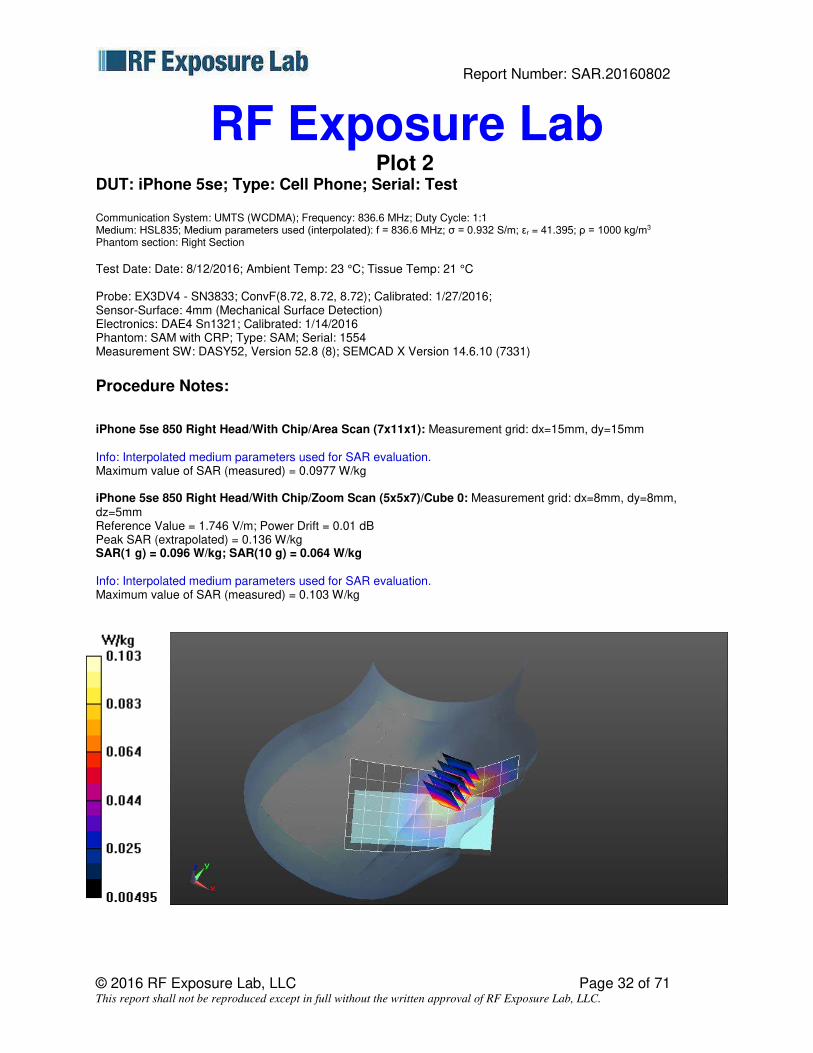
Plot 1 DUT: iPhone 5se; Type: Cell Phone; Serial: Test Communication System: UMTS (WCDMA); Frequency: 836.6 MHz; Duty Cycle: 1:1 Medium: HSL835; Medium parameters used (interpolated): f = 836.6 MHz; σ = 0.932 S/m; εr = 41.395; ρ = 1000 kg/m3 Phantom section: Right Section Test Date: Date: 8/12/2016; Ambient Temp: 23 °C; Tissue Temp: 21 °C
Probe: EX3DV4 - SN3833; ConvF(8.72, 8.72, 8.72); Calibrated: 1/27/2016; Sensor-Surface: 4mm (Mechanical Surface Detection) Electronics: DAE4 Sn1321; Calibrated: 1/14/2016 Phantom: SAM with CRP; Type: SAM; Serial: 1554 Measurement SW: DASY52, Version 52.8 (8); SEMCAD X Version 14.6.10 (7331)
Procedure Notes: iPhone 5se 850 Right Head/Baseline/Area Scan (7x11x1): Measurement grid: dx=15mm, dy=15mm Info: Interpolated medium parameters used for SAR evaluation. Maximum value of SAR (measured) = 0.537 W/kg iPhone 5se 850 Right Head/Baseline/Zoom Scan (5x5x7)/Cube 0: Measurement grid: dx=8mm, dy=8mm, dz=5mm Reference Value = 8.421 V/m; Power Drift = 0.03 dB Peak SAR (extrapolated) = 0.597 W/kg SAR(1 g) = 0.490 W/kg; SAR(10 g) = 0.373 W/kg Info: Interpolated medium parameters used for SAR evaluation. Maximum value of SAR (measured) = 0.514 W/kg
Report Number: SAR.20160802
© 2016 RF Exposure Lab, LLC Page 32 of 71 This report shall not be reproduced except in full without the written approval of RF Exposure Lab, LLC.
RF Exposure Lab
Plot 2 DUT: iPhone 5se; Type: Cell Phone; Serial: Test Communication System: UMTS (WCDMA); Frequency: 836.6 MHz; Duty Cycle: 1:1 Medium: HSL835; Medium parameters used (interpolated): f = 836.6 MHz; σ = 0.932 S/m; εr = 41.395; ρ = 1000 kg/m3 Phantom section: Right Section Test Date: Date: 8/12/2016; Ambient Temp: 23 °C; Tissue Temp: 21 °C
Probe: EX3DV4 - SN3833; ConvF(8.72, 8.72, 8.72); Calibrated: 1/27/2016; Sensor-Surface: 4mm (Mechanical Surface Detection) Electronics: DAE4 Sn1321; Calibrated: 1/14/2016 Phantom: SAM with CRP; Type: SAM; Serial: 1554 Measurement SW: DASY52, Version 52.8 (8); SEMCAD X Version 14.6.10 (7331)
Procedure Notes: iPhone 5se 850 Right Head/With Chip/Area Scan (7x11x1): Measurement grid: dx=15mm, dy=15mm Info: Interpolated medium parameters used for SAR evaluation. Maximum value of SAR (measured) = 0.0977 W/kg iPhone 5se 850 Right Head/With Chip/Zoom Scan (5x5x7)/Cube 0: Measurement grid: dx=8mm, dy=8mm, dz=5mm Reference Value = 1.746 V/m; Power Drift = 0.01 dB Peak SAR (extrapolated) = 0.136 W/kg SAR(1 g) = 0.096 W/kg; SAR(10 g) = 0.064 W/kg Info: Interpolated medium parameters used for SAR evaluation. Maximum value of SAR (measured) = 0.103 W/kg

Report Number: SAR.20160802
© 2016 RF Exposure Lab, LLC Page 33 of 71 This report shall not be reproduced except in full without the written approval of RF Exposure Lab, LLC.
RF Exposure Lab
Plot 3 DUT: iPhone 5se; Type: Cell Phone; Serial: Test Communication System: UMTS (WCDMA); Frequency: 836.6 MHz; Duty Cycle: 1:1 Medium: HSL835; Medium parameters used (interpolated): f = 836.6 MHz; σ = 0.932 S/m; εr = 41.395; ρ = 1000 kg/m3 Phantom section: Left Section Test Date: Date: 8/12/2016; Ambient Temp: 23 °C; Tissue Temp: 21 °C
Probe: EX3DV4 - SN3833; ConvF(8.72, 8.72, 8.72); Calibrated: 1/27/2016; Sensor-Surface: 4mm (Mechanical Surface Detection) Electronics: DAE4 Sn1321; Calibrated: 1/14/2016 Phantom: SAM with CRP; Type: SAM; Serial: 1554 Measurement SW: DASY52, Version 52.8 (8); SEMCAD X Version 14.6.10 (7331)
Procedure Notes: iPhone 5se 850 Left Head/Baseline/Area Scan (7x11x1): Measurement grid: dx=15mm, dy=15mm Info: Interpolated medium parameters used for SAR evaluation. Maximum value of SAR (measured) = 0.596 W/kg iPhone 5se 850 Left Head/Baseline/Zoom Scan (5x5x7)/Cube 0: Measurement grid: dx=8mm, dy=8mm, dz=5mm Reference Value = 10.34 V/m; Power Drift = 0.01 dB Peak SAR (extrapolated) = 0.745 W/kg SAR(1 g) = 0.609 W/kg; SAR(10 g) = 0.462 W/kg Info: Interpolated medium parameters used for SAR evaluation. Maximum value of SAR (measured) = 0.638 W/kg

Report Number: SAR.20160802
© 2016 RF Exposure Lab, LLC Page 34 of 71 This report shall not be reproduced except in full without the written approval of RF Exposure Lab, LLC.
RF Exposure Lab
Plot 4 DUT: iPhone 5se; Type: Cell Phone; Serial: Test Communication System: UMTS (WCDMA); Frequency: 836.6 MHz; Duty Cycle: 1:1 Medium: HSL835; Medium parameters used (interpolated): f = 836.6 MHz; σ = 0.932 S/m; εr = 41.395; ρ = 1000 kg/m3 Phantom section: Left Section Test Date: Date: 8/12/2016; Ambient Temp: 23 °C; Tissue Temp: 21 °C
Probe: EX3DV4 - SN3833; ConvF(8.72, 8.72, 8.72); Calibrated: 1/27/2016; Sensor-Surface: 4mm (Mechanical Surface Detection) Electronics: DAE4 Sn1321; Calibrated: 1/14/2016 Phantom: SAM with CRP; Type: SAM; Serial: 1554 Measurement SW: DASY52, Version 52.8 (8); SEMCAD X Version 14.6.10 (7331)
Procedure Notes: iPhone 5se 850 Left Head/With Chip/Area Scan (7x11x1): Measurement grid: dx=15mm, dy=15mm Info: Interpolated medium parameters used for SAR evaluation. Maximum value of SAR (measured) = 0.128 W/kg iPhone 5se 850 Left Head/With Chip/Zoom Scan (5x5x7)/Cube 0: Measurement grid: dx=8mm, dy=8mm, dz=5mm Reference Value = 2.578 V/m; Power Drift = 0.02 dB Peak SAR (extrapolated) = 0.172 W/kg SAR(1 g) = 0.120 W/kg; SAR(10 g) = 0.083 W/kg Info: Interpolated medium parameters used for SAR evaluation. Maximum value of SAR (measured) = 0.127 W/kg

Report Number: SAR.20160802
© 2016 RF Exposure Lab, LLC Page 35 of 71 This report shall not be reproduced except in full without the written approval of RF Exposure Lab, LLC.
RF Exposure Lab
Plot 5 DUT: iPhone 5se; Type: Cell Phone; Serial: Test Communication System: UMTS (WCDMA); Frequency: 1880 MHz; Duty Cycle: 1:1 Medium: HSL1900; Medium parameters used: f = 1880 MHz; σ = 1.42 S/m; εr = 39.59; ρ = 1000 kg/m3 Phantom section: Right Section Test Date: Date: 8/10/2016; Ambient Temp: 23 °C; Tissue Temp: 21 °C
Probe: EX3DV4 - SN3833; ConvF(7.27, 7.27, 7.27); Calibrated: 1/27/2016; Sensor-Surface: 4mm (Mechanical Surface Detection) Electronics: DAE4 Sn1321; Calibrated: 1/14/2016 Phantom: SAM with CRP; Type: SAM; Serial: 1554 Measurement SW: DASY52, Version 52.8 (8); SEMCAD X Version 14.6.10 (7331)
Procedure Notes: iPhone 5se 1900 Right Head/Baseline/Area Scan (7x11x1): Measurement grid: dx=15mm, dy=15mm Maximum value of SAR (measured) = 0.863 W/kg iPhone 5se 1900 Right Head/Baseline/Zoom Scan (5x5x7)/Cube 0: Measurement grid: dx=8mm, dy=8mm, dz=5mm Reference Value = 10.60 V/m; Power Drift = 0.03 dB Peak SAR (extrapolated) = 1.21 W/kg SAR(1 g) = 0.789 W/kg; SAR(10 g) = 0.476 W/kg Maximum value of SAR (measured) = 0.869 W/kg

Report Number: SAR.20160802
© 2016 RF Exposure Lab, LLC Page 36 of 71 This report shall not be reproduced except in full without the written approval of RF Exposure Lab, LLC.
RF Exposure Lab
Plot 6 DUT: iPhone 5se; Type: Cell Phone; Serial: Test Communication System: UMTS (WCDMA); Frequency: 1880 MHz; Duty Cycle: 1:1 Medium: HSL1900; Medium parameters used: f = 1880 MHz; σ = 1.42 S/m; εr = 39.59; ρ = 1000 kg/m3 Phantom section: Right Section Test Date: Date: 8/11/2016; Ambient Temp: 23 °C; Tissue Temp: 21 °C
Probe: EX3DV4 - SN3833; ConvF(7.27, 7.27, 7.27); Calibrated: 1/27/2016; Sensor-Surface: 4mm (Mechanical Surface Detection) Electronics: DAE4 Sn1321; Calibrated: 1/14/2016 Phantom: SAM with CRP; Type: SAM; Serial: 1554 Measurement SW: DASY52, Version 52.8 (8); SEMCAD X Version 14.6.10 (7331)
Procedure Notes: iPhone 5se 1900 Right Head/With Chip/Area Scan (7x11x1): Measurement grid: dx=15mm, dy=15mm Maximum value of SAR (measured) = 0.0525 W/kg iPhone 5se 1900 Right Head/With Chip/Zoom Scan (5x5x7)/Cube 0: Measurement grid: dx=8mm, dy=8mm, dz=5mm Reference Value = 3.346 V/m; Power Drift = -0.02 dB Peak SAR (extrapolated) = 0.0760 W/kg SAR(1 g) = 0.052 W/kg; SAR(10 g) = 0.033 W/kg Maximum value of SAR (measured) = 0.0577 W/kg
Report Number: SAR.20160802
© 2016 RF Exposure Lab, LLC Page 37 of 71 This report shall not be reproduced except in full without the written approval of RF Exposure Lab, LLC.
RF Exposure Lab
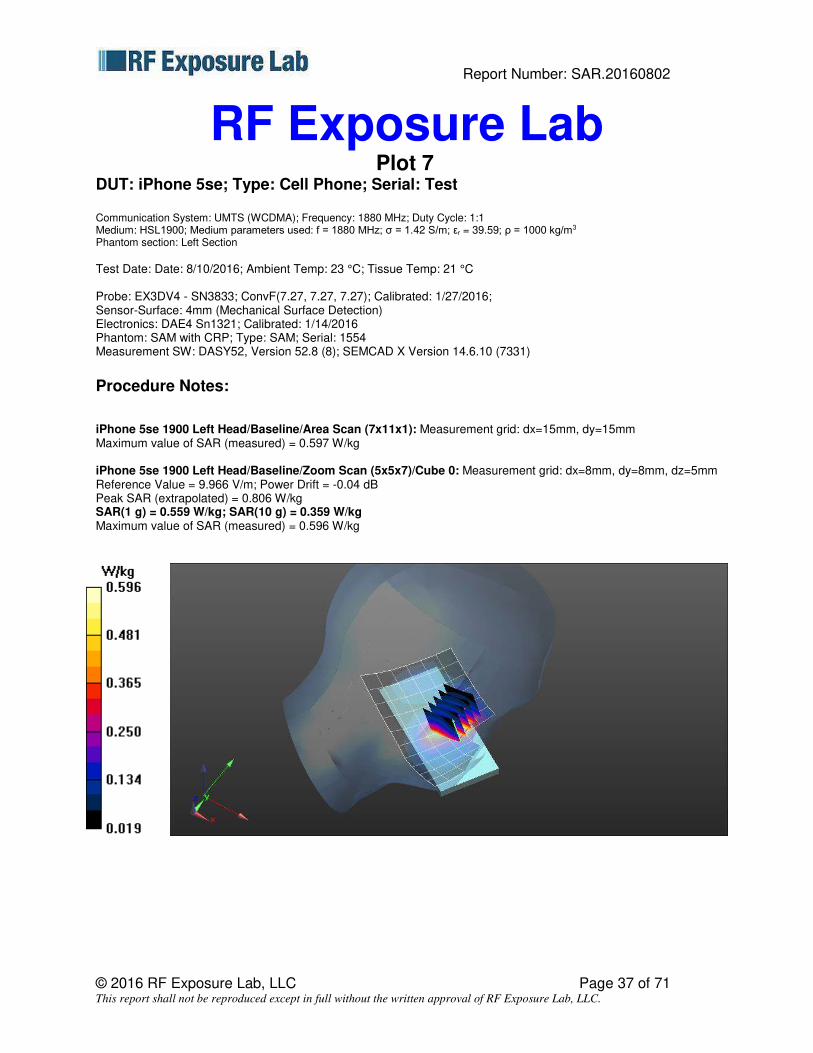
Plot 7 DUT: iPhone 5se; Type: Cell Phone; Serial: Test Communication System: UMTS (WCDMA); Frequency: 1880 MHz; Duty Cycle: 1:1 Medium: HSL1900; Medium parameters used: f = 1880 MHz; σ = 1.42 S/m; εr = 39.59; ρ = 1000 kg/m3 Phantom section: Left Section Test Date: Date: 8/10/2016; Ambient Temp: 23 °C; Tissue Temp: 21 °C
Probe: EX3DV4 - SN3833; ConvF(7.27, 7.27, 7.27); Calibrated: 1/27/2016; Sensor-Surface: 4mm (Mechanical Surface Detection) Electronics: DAE4 Sn1321; Calibrated: 1/14/2016 Phantom: SAM with CRP; Type: SAM; Serial: 1554 Measurement SW: DASY52, Version 52.8 (8); SEMCAD X Version 14.6.10 (7331)
Procedure Notes: iPhone 5se 1900 Left Head/Baseline/Area Scan (7x11x1): Measurement grid: dx=15mm, dy=15mm Maximum value of SAR (measured) = 0.597 W/kg iPhone 5se 1900 Left Head/Baseline/Zoom Scan (5x5x7)/Cube 0: Measurement grid: dx=8mm, dy=8mm, dz=5mm Reference Value = 9.966 V/m; Power Drift = -0.04 dB Peak SAR (extrapolated) = 0.806 W/kg SAR(1 g) = 0.559 W/kg; SAR(10 g) = 0.359 W/kg Maximum value of SAR (measured) = 0.596 W/kg
Report Number: SAR.20160802
© 2016 RF Exposure Lab, LLC Page 38 of 71 This report shall not be reproduced except in full without the written approval of RF Exposure Lab, LLC.
RF Exposure Lab
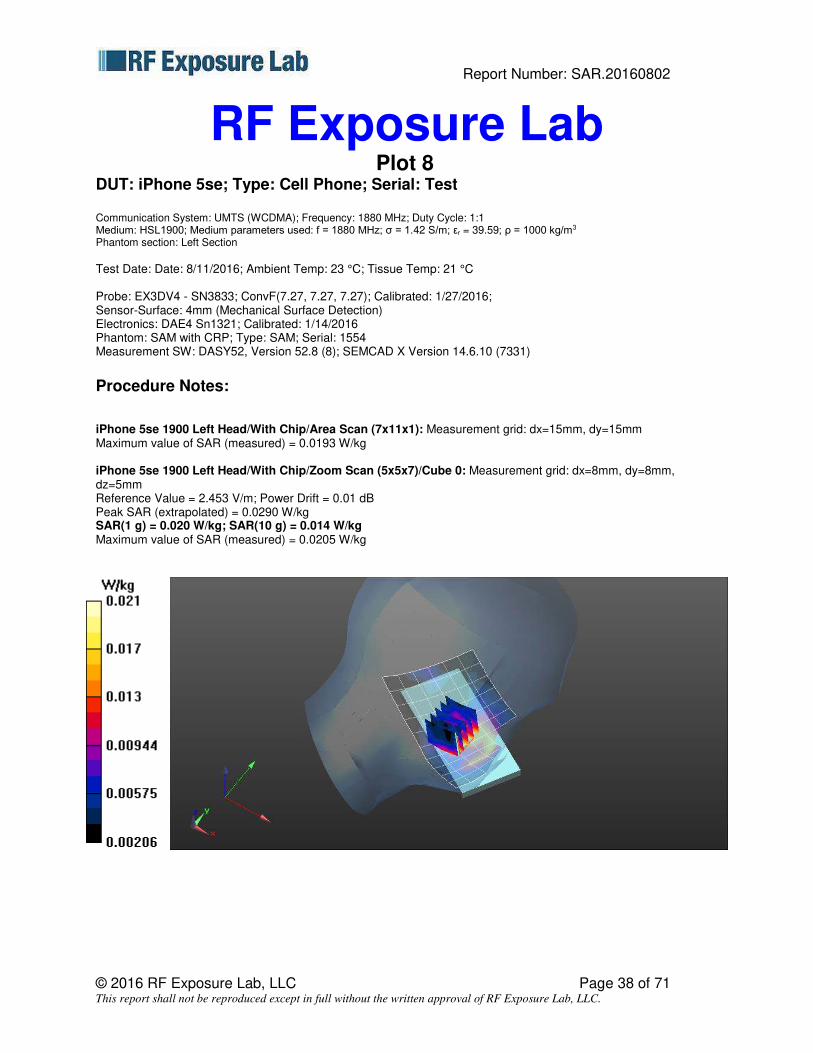
Plot 8 DUT: iPhone 5se; Type: Cell Phone; Serial: Test Communication System: UMTS (WCDMA); Frequency: 1880 MHz; Duty Cycle: 1:1 Medium: HSL1900; Medium parameters used: f = 1880 MHz; σ = 1.42 S/m; εr = 39.59; ρ = 1000 kg/m3 Phantom section: Left Section Test Date: Date: 8/11/2016; Ambient Temp: 23 °C; Tissue Temp: 21 °C
Probe: EX3DV4 - SN3833; ConvF(7.27, 7.27, 7.27); Calibrated: 1/27/2016; Sensor-Surface: 4mm (Mechanical Surface Detection) Electronics: DAE4 Sn1321; Calibrated: 1/14/2016 Phantom: SAM with CRP; Type: SAM; Serial: 1554 Measurement SW: DASY52, Version 52.8 (8); SEMCAD X Version 14.6.10 (7331)
Procedure Notes: iPhone 5se 1900 Left Head/With Chip/Area Scan (7x11x1): Measurement grid: dx=15mm, dy=15mm Maximum value of SAR (measured) = 0.0193 W/kg iPhone 5se 1900 Left Head/With Chip/Zoom Scan (5x5x7)/Cube 0: Measurement grid: dx=8mm, dy=8mm, dz=5mm Reference Value = 2.453 V/m; Power Drift = 0.01 dB Peak SAR (extrapolated) = 0.0290 W/kg SAR(1 g) = 0.020 W/kg; SAR(10 g) = 0.014 W/kg Maximum value of SAR (measured) = 0.0205 W/kg

Report Number: SAR.20160802
© 2016 RF Exposure Lab, LLC Page 39 of 71 This report shall not be reproduced except in full without the written approval of RF Exposure Lab, LLC.
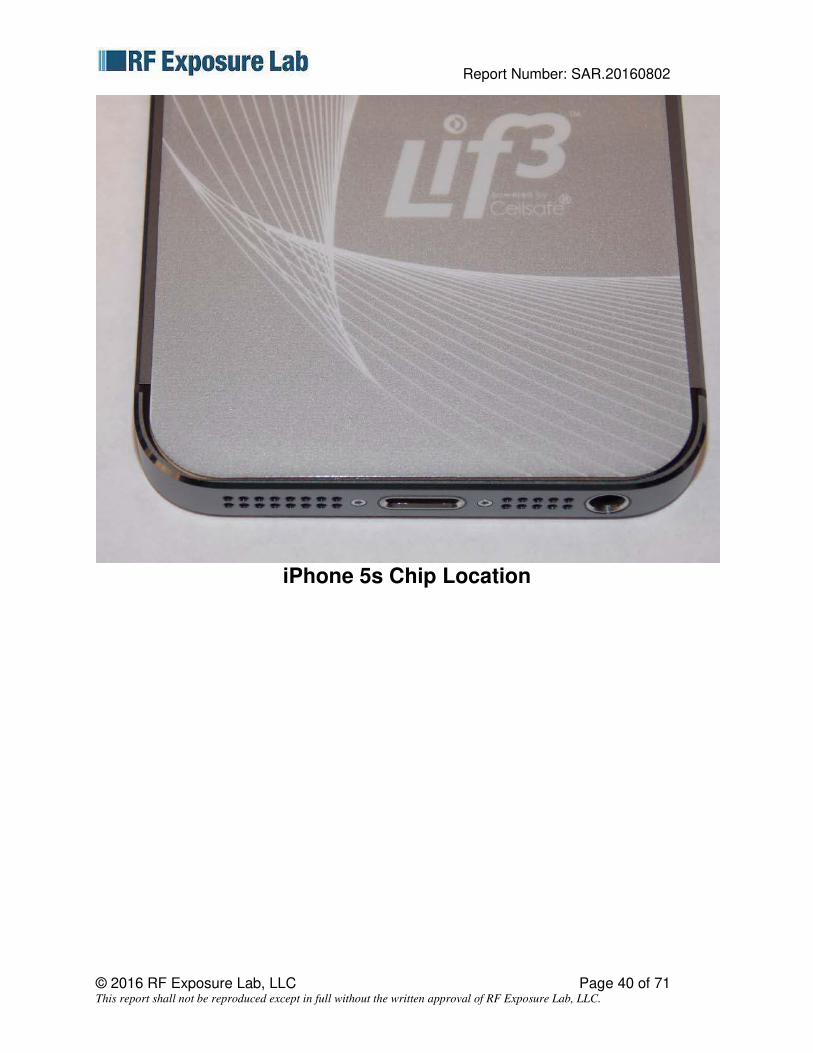
Appendix C – Test Photos
iPhone 5 Chip Location
Report Number: SAR.20160802
© 2016 RF Exposure Lab, LLC Page 40 of 71 This report shall not be reproduced except in full without the written approval of RF Exposure Lab, LLC.
iPhone 5s Chip Location

Report Number: SAR.20160802
© 2016 RF Exposure Lab, LLC Page 41 of 71 This report shall not be reproduced except in full without the written approval of RF Exposure Lab, LLC.
Appendix D – Probe Calibration Data Sheets


Report Number: SAR.20160802
© 2016 RF Exposure Lab, LLC Page 53 of 71 This report shall not be reproduced except in full without the written approval of RF Exposure Lab, LLC.
Appendix E – Dipole Calibration Data Sheets


Report Number: SAR.20160802
© 2016 RF Exposure Lab, LLC Page 70 of 71 This report shall not be reproduced except in full without the written approval of RF Exposure Lab, LLC.
Appendix F – Phantom Calibration Data Sheets

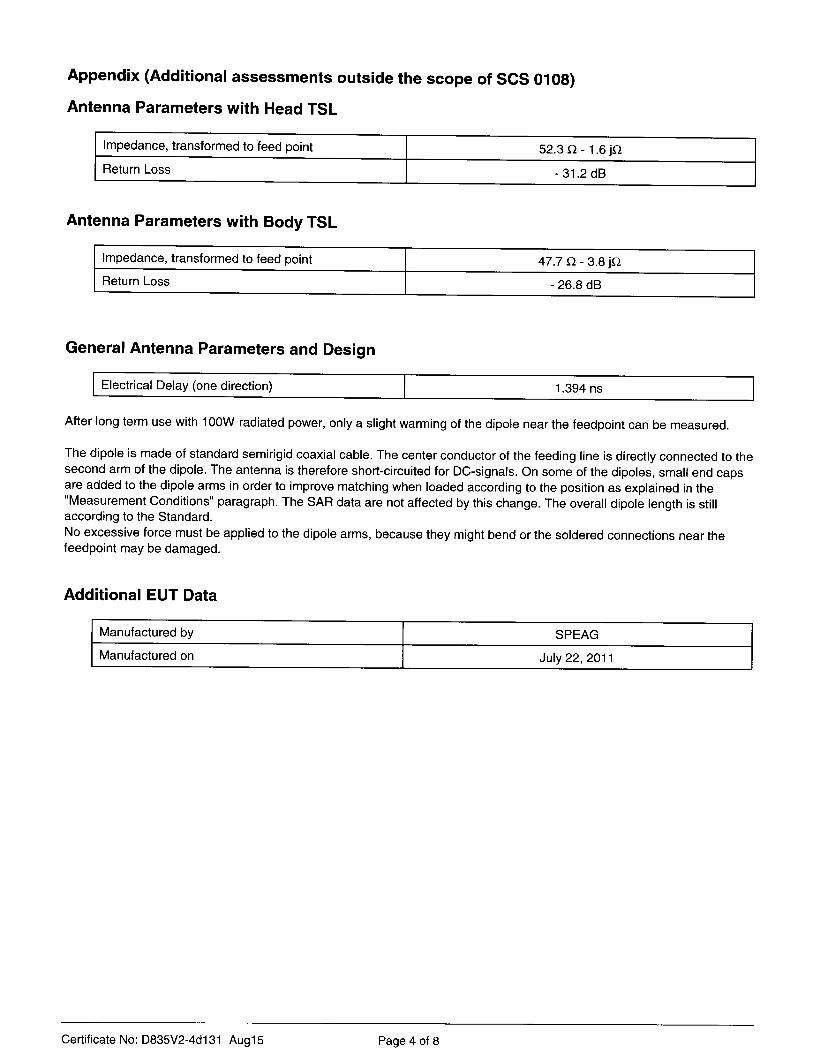
______________ . . . , j c _ ~ .........;'T__ Schmid & Partner Engineering AG 5 n e a ft
Zeughausstrasse 43, BOO4 Zurich, Switzerland
Phone +41 1 2459700, Fax +41 1 2459779
[email protected], http://www.speag.com
Certificate of Conformity I First Article Inspection
Item SAM Twin Phantom V4.0 Type No ODOOO P40 C Series No TP-1150 and higher
Manufacturer SPEAG Zeughausstrasse 43 CH-8004 ZOrich Switzerland
Tests The series production process used allows the limitation to test of first articles. Complete tests were made on the pre-series Type No. OD 000 P40 AA, Serial No. TP-1001 and on the series first article Type No. OD 000 P40 BA, Serial No. TP-1006. Certain parameters have been retested using further series items (called samples) or are tested at each item.
Test Requirement Details Units tested
Dimensions Compliant with the geometry according to the CAD model.
ITIS CAD File (*) First article, Samples
Material thickness
of shell Compliant with the requirements according to the standards
2mm +1- 0.2mm in flat and specific areas of head section
First article, Samples, TP-1314 ft.
Material thickness at ERP
Compliant with the requirements according to the standards
6mm +1- 0.2mm at ERP First article, All items
Material parameters
Dielectric parameters for required frequencies
300 MHz - 6 GHz: Relative permittivity < 5, Loss tangent < 0.05
Material samples
Material resistivity The material has been tested to be compatible with the liquids defined in the standards if handled and cleaned according to the instructions. Observe technical Note for material compatibility .
DEGMBE based simulating liquids
Pre-series, First article, Material samples
Sagging Compliant with the requirements according to the standards. Sagging of the flat section when filled with tissue simulating liquid.
< 1% typical < 0.8% if filled with 155mm of HSL900 and without DUT below
Prototypes, Sample testing
Standards [1] CENELEC EN 50361 [2] IEEE Std 1528-2003 [3] IEC 62209 Part I
[4] FCC OET Bulletin 65, Supplement C, Edition 01-01 (*) The ITIS CAD file is derived from [2] and is also within the tolerance requirements of the shapes of
the other documents.
Conformity Based on the sample tests above, we certify that this item is in compliance with the uncertainty requirements of SAR measurements specified in standards [1] to [4].
Date 07.07.2005
Signature 1Stamp
, e a
Doc No 881 - QD 000 P40 C - F Page 1 (1)