CER Residential Electricity Results 2014 Prepared for: Prepared by: June 2014 &
76
CER Residential Electricity Results 2014 Prepared for: Prepared by: June 2014 &
-
Upload
darren-nash -
Category
Documents
-
view
212 -
download
0
Transcript of CER Residential Electricity Results 2014 Prepared for: Prepared by: June 2014 &

CER Residential Electricity Results 2014
Prepared for:
Prepared by:
June 2014
&

2
Background
● Fieldwork for this survey was conducted between 10th March and 2nd April 2014
Questionnaire length was 25 minutes
● Survey data collection methodology was ‘face to face’ interviewing via CAPI, administered in the respondent’s home - 1007 respondents interviewed
Margin of error on a sample of this size is +/- 3%. For smaller subsamples the margin will be greater. For example, a base of 194 and 170 exist for electricity and gas switching within the past 12 months = a margin of error of +/- 7.1% and +/- 7.5% respectively.
A total of 120 paired sampling points throughout Republic of Ireland
● The sample is representative across geography, gender, age, socio-economic status and supplier
● The survey is comparable to 2010, 2011, 2012 and 2013 surveys in sample approach and representivity

3
Notes on results presented
● Percentage breakdowns are rounded to the nearest whole number to retain accuracy of results. This means that figures presented on charts may not sum to 100% due to rounding
3

4
Respondent & Market Profile

5
Respondent profile – age, social class, locationBase: All adults 16+ - 1007
● Population of respondents is representative of the national population (of all utility decision makers). Age profile is similar to previous waves.
● Just 3% of respondents lived in an apartment.
● Surveys completed across 120 paired sampling points.
Age profile of respondents Social grade of respondents
Location of respondents
County 2012 2013 2014
Dublin 30% 29% 29%
Cork 5% 11% 9%
Galway 6% 6% 4%
Kildare 5% 5% 2%
Meath 4% 4% 4%
Other * 38% 45% 51%
18-25 26-35 36-45 46-55 56-64 65+
8%
23% 23%
20%
14%13%
6%
22%21%
23%
13%
15%
7%
23%22%
18%
15%16%
7%
22%21%
18%
15%16%
2011
2012
2013
2014
Type of Home
97%
3%
Apartment
House
* Other – all other counties* Social grade definition: AB-Upper/Middle category, C1C2-Lower Middle & Skilled Workers, DE-Unskilled workers, F-Farmers.
AB* C1C2* DE* F*
12%
55%
28%
5%
12%
58%
25%
4%
12%
58%
25%
4%
2012
2013
2014

6
Claimed market share: residential electricity suppliersBase: All adults 16+ - 1007
● Electric Ireland retains the largest market share across the entire market and among consumers with use both electricity and natural gas. Albeit Electric Ireland’s share continues to decline slightly (-3%) in the dual fuel market.
● The main changes in the market centre on:
The decline in Airtricity’s share amongst the total electricity market, and indeed the dual fuel sector.
Correspondingly BGE has recovered this year.
● Prepaypower stand at 3% share of the total electricity market.
Claimed Electricity Market shares trends Claimed Electricity market shares – consumers with both gas and electricity
2010 2011 2012 2013 2014
85%
60% 58% 61% 63%
12%19% 18%
12%15%3%
21%23% 25% 19%
0 0.02 0.03
Electric Ireland BGE Airtricity Prepaypower
2012 2013 20140%
10%
20%
30%
40%
50%
60%
48% 46%43%
26%
19%
29%26%
32%28%
10%
4%0%
Electric Ireland BGEAirtricity Prepaypower
(Proportion of respondents with each supplier) (Proportion of respondents with each supplier)

7
Satisfaction with current supplierBase: All adults 16+ - 1007
7
● Overall satisfaction with current supplier shows no significant difference vs 2013.
Airtricity and BGE scores show a continued decline in satisfaction since 2012.
Electric Ireland remaining steady.
Overall satisfaction with current supplier Overall satisfaction by current supplier
2010 2011 2012 2013 2014
86% 84%89%
83% 81%
2010 2011 2012 2013 2014
82%83%
92%
85%84%
88% 84%87%
81%
77%
92% 87%
83%
77% 75%
Electric Ireland BGE Airtricity

8
Satisfaction with current supplier by demographicsBase: All adults 16+ - 1007
● Younger and older customers are more satisfied with their electricity suppliers. In terms of social class Farmers are the most satisfied, as are those who live in Conn/Ulster. No difference in satisfaction by gender.
18-25 26-34 35-45 46-55 56-64 65+
84%78% 77% 81% 80%
91%
Satisfaction x Age
Dublin Rest of Leinster Munster Conn/Ulster
80% 79% 82% 84%
Satisfaction x Region
AB C1C2 DE F
80% 82% 78%86%
Satisfaction x Social Class
Male Female
81% 81%
Satisfaction x Gender

9
Billing & Payment

10
Respondent profile – bill delivery and frequencyBase: All who receive any bill - 850
● The trend of receiving a bill by email continues, with 1 in 5 now citing that they receive a bill via the latter.
This reflects a decline in the proportion of Electric Ireland, BGE and the Airtricity customer bases receiving paper bills.
Method for receiving bill Method of receiving a bill – by supplier*
*: Selection of multiple methods possible
Post77%
Email20%
Website3%
2011 2012 2013 2014
9%
15%
18%20%E-mail
201420132012201120142013201220112014201320122011
83%89%92%95%
74%89%89%92%
52%63%61%61%
13%11%8%2%
20%
14%8%7%
42%38%
36%33%
2%2%2%0%4%0%4%1%5%3%7%6%
WebsiteEmailPost
Airtricity BGE Electric Ireland

11
Respondent profile – estimated bill size
*NB Prepayment included social welfare deductions pre 2014
**NB 2014 Bills relate to 2 monthly bills
● Note some of the billing questions not asked in 2014, hence the frame of reference and comparability has changed.
● Significantly lower monthly spend recorded for summer.
● The equaliser bill amounts have increased this year to an average €86 per month (from €58 in 2013). Note that as households switch to prepayment, the bill size is likely to increase as the customer profile shifts.
Estimated winter and summer bill size
Bill size Average winter monthly spend Average summer monthly spend
2010 2011 2012 2013 2014 2010 2011 2012 2013 2014
*Prepayment(Base: 157)
€117 €114 €132 €136 €130 €68 €80 €98 €95 €82
**Receive and Pay a Bill(Base: 735)
€79 €76 €87 €96 €186 €55 €50 €59 €63 €125
Equaliser (Base:90)
€75 €76 €65 €58 €86 €75 €76 €65 €58 €86
12
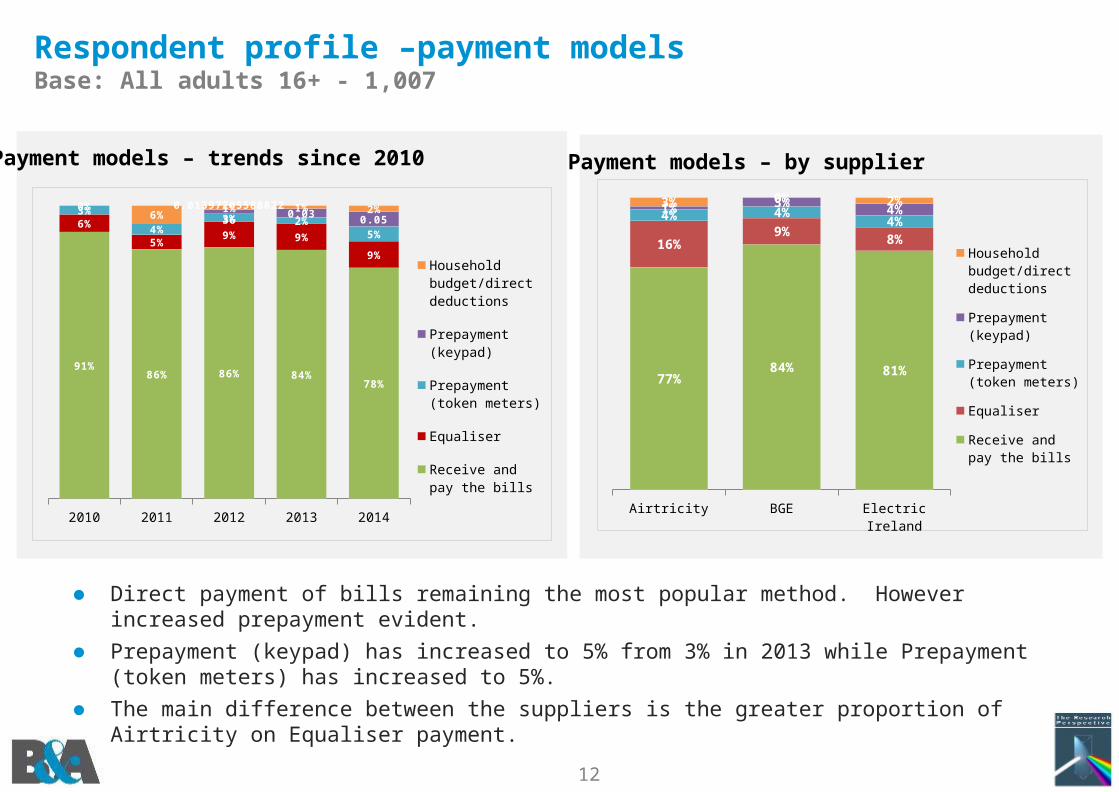
Respondent profile –payment modelsBase: All adults 16+ - 1,007
12
● Direct payment of bills remaining the most popular method. However increased prepayment evident.
● Prepayment (keypad) has increased to 5% from 3% in 2013 while Prepayment (token meters) has increased to 5%.
● The main difference between the suppliers is the greater proportion of Airtricity on Equaliser payment.
Payment models – trends since 2010 Payment models – by supplier
2010 2011 2012 2013 2014
91%86% 86% 84%
78%
6%
5%9% 9%
9%
3%
4%3% 2%
5%
0%6%
1% 1% 2%0.0139720558882236 0.03 0.05
Household bud-get/direct deduc-tions
Prepayment (keypad)
Prepayment (token meters)
Equaliser
Receive and pay the bills
Airtricity BGE Electric Ireland
77%84% 81%
16%9%
8%
4% 4%4%
1% 3% 4%3% 0% 2%
Household bud-get/direct deduc-tions
Prepayment (keypad)
Prepayment (token meters)
Equaliser
Receive and pay the bills

13
Respondent profile –payment methodsBase: All who receive any bill - 850
13
● The use of direct debit has remained pretty stable since 2011 Overall prevalence of direct debit in 2013 was 47% compared to 46% in 2014
● Electric Ireland and BGE level of direct debit is stable with Airtricity customers increasing their levels of direct debit this year.
● Proportions of BGE and Airtricity customers in receipt of FEA remain stable In contrast, the proportion of Electric Ireland Customers has declined this year.
Prevalence of direct debitBase: All receive a bill/pay fixed amount - 833
Proportion in receipt of FEABase: All adults 16+ - 1007
Overall Electric Ireland BGE Airtricity
42%
35%
57%
71%
47%
34%
51%
78%
44%
35%
40%
72%
47%
39%
44%
68%
46%
39%42%
74%
2010 2011 2012 2013 2014
Overall Electric Ireland BGE Airtricity
15%
22%
5% 5%
15%21%
8%5%
17%21%
10% 10%13%
16%10% 8%
2011 2012 2013 2014

14
Awareness of costs: unit and standing charge
● The level of awareness of unit cost has increased slightly, albeit still only at 1 in 5 consumers
The ability to estimate the standing charge remains low at 1 in 4 consumers
● The unit cost estimates where provided were highly variable. The average estimated cost was 18.49c in 2014, compared to 12.06c in 2013.
Ability to estimate unit cost and standing chargeBase: All adults 16+ - 1007
Able to provide estimate
‘11 ’12 ’13 ‘14
Unit cost 58% 25% 17% 21%
Standing charge 50% 20% 24% 25%
Estimate of unit cost
<=10c 10c to 15c 15c to 20c >20c
41%
20%
33%
6%
50%
2%
44%
3%
37%
11%
36%
16%
2012 2013 2014
Average: 18.49c
Among consumers able to provide an estimate…(Base: 207)

15
Bill payment record and arrears
15
● Bill payment record and claimed payment record has remained steady since 2010
● Most consumers do not consider part payment as being in arrears
● Awareness of availability of arrangements in the cases of arrears has remained pretty steady since 2012. However, the proportion aware of the availability of prepayment meters (in arrears cases) has declined (but note more actually have them installed; thus in effect similar levels to 2012/2013).
Awareness of availability of arrangement(Base: All not on prepayment – 850)
Stated bill payment record(Base: All who receive any bill – 850)
2012 2013 2014
Aware of availability of prepayment meter (Base: never disconnected – 989)
38% 40% 30%
Currently have a prepay meter(Base: all respondents 1007)
n/a n/a 8%
2012 2013 2014
34% 28% 34%
22%24% 17%
45% 48% 49%
Aware
Somewhat aware
Not aware
2011 2012 2013 2014
90%
74% 73%80%
0%20% 21%
14%7%
4% 4% 4%2% 1% 2% 1% Currently in arrears
Sometimes in arrears, not currently
Part pay bill (not in ar-rears)
Always pay bill on-time/in full
15% of those ever in arrears have been directed to outside assistance on budgeting, energy efficiency advice or services by their supplier (new question added 2014).

16
Payment plans
● As was found in past year, a lower than expected proportion of consumers stated that they were now or had been in the past on payment plans (1.7%).
● Attitudes towards payment plans are similar to 2013 given the small sample size Indeed more of these consumers agreed they are generally able to make the payments
required by the payment plan this year. An improvement on the 1 in 4 consumers that agreed in 2013.
About 3 in 5 agreed that the payment plan was tailored to their needs (new question added 2014).
Prevalence(Base: All adults 16+ - 1,007)
Prevalence 2012 2013 2014
Previously on payment plans 1.8% 1.2% 1.1%
Currently on payment plan 0.3% 0.5% 0.6%
2013
2014
2013
2014
2013
2014
2013
2014
25%
60%
81%
68%
81%
79%
N/A
63%
6%
20%
13%
16%
13%
5%
N/A
5%
Agree Disagree
I was/am generally able to make the payments required
by the payment plan
The payment plan made it easier for me to pay off the
money I owed
A payment plan makes it less likely for me to get behind in
my payments in future
The payment plan was tailored to my needs.
Attitudes towards Payment Plans (Base: Any ever on a payment plan – 14)

17
Competition & Deregulation

18
Awareness of competitors(Base: All adults 16+ - 1,007)
18
● Unprompted awareness reflects top of mind presence in the consumer mind and provides a good estimate of perception of competitive activity in a market
● 94% mentioned Electric Ireland or a prior name: 44% mentioned Electric Ireland (up from 33% in 2013) 23% mentioned ESB Electric Ireland
● Level of awareness of BGE and Airtricity have declined, with the public having increased awareness of Prepaypower, Energia and Pinergy
● On a prompted basis just over half of consumers are now aware of Prepaypower and Energia.
Unprompted awareness of Electricity Suppliers Prompted awareness of Electricity Suppliers
* Added 2014
Electric Ireland (or ESB and re-lated names)
BGE Airtricity Prepaypower Energia* Pinergy*
93%
69%
57%
91%
72% 74%
96%
58%
68%
2%
94%
55%
68%
5%
2010 2011 2012 2013 2014
Electric Ireland BGE Airtricity Prepay power Energia* Pinergy*
86%90% 92%
9%2%
89% 87% 89%
25%
3%
96%87%
94%
54% 55%
38%
2012 2013 2014

19
Satisfaction with level of competition(Base: All adults 16+ - 1,007)
19
● A majority of consumers remain satisfied with the level of competition in the residential consumer electricity market
The proportion very satisfied has increased back to 2012 levels (up to 26% from 17%)
Satisfaction with current level of competition: 63% (+3%)
2010 2011 2012 2013 2014
46% 47% 42% 43%37%
23% 20% 26%17% 26%
69% 67% 68%
60%Very satisfied
Satisfied
63%

20
Satisfaction with level of competition by current supplier
● Airtricity customers most satisfied with the current level of competition in the electricity market.
63%
70%
79%81%
78%
Very satisfied
Satisfied
Base: 1,007 586 108 216 83
Total Electric Ireland BGE Airtricity Prepay Power
0.370.42
0.350.44
0.37
0.26
0.29 0.440.37
0.41

21
Awareness of lack of price control(Base: All adults 16+ - 1,007)
21
● The level of understanding of the current regulation remains comparatively low with one third of all respondents correctly identifying price deregulation
Levels are similar for customers of each supplier
● A significant minority of consumers (32%) still believe that all electricity prices are subject to regulation
● In fact the proportion that believe suppliers are allowed to set their own prices has increased (from 26% to 33%)
Understanding of how prices are set
Overall Electric Ireland BGE Airtricity
2012 2013 2014 2012 2013 2014 2012 2013 2014 2012 2013 2014
All electricity suppliers are allowed to set their own prices
24% 26% 33% 25% 25% 33% 20% 28% 33% 25% 25% 33%
The prices set by some electricity suppliers are regulated which means that their prices must be approved by the Commission for Energy Regulation
35% 37% 32% 32% 34% 32% 37% 41% 37% 40% 42% 32%
The prices set by all electricity suppliers are regulated
37% 33% 35% 36% 35% 36% 37% 33% 30% 40% 29% 36%
None of these 11% 9% - 12% 12% - 11% 4% - 8% 6% -

22
Awareness and perceived impact of deregulation(Base: All aware of deregulation - 668)
● While a majority of consumers recognise benefits such as increased flexibility around products and services and increased innovation, a minority (33%) agree that deregulation has reduced prices. However agreement has decreased in the past year.
While most scores have declined slightly – the level of agreement with deregulation improving the service received from supplier shows the biggest decline (2013: 51%; 2014: 39%).
Impact of deregulation
2012
2013
2014
2012
2013
2014
2012
2013
2014
2012
2013
2014
53%
51%
39%
47%
42%
33%
61%
56%
51%
59%
56%
53%
15%
18%
27%
25%
28%
38%
13%
15%
23%
14%
14%
22%
This has improved the service I receive from electricity suppliers
This has lowered the price I pay compared to what I would have to pay if the regulator set the prices
This has made electricity supply companies more innovative in the services and products they provide
This has made electricity supply companies more flexible in the way they offer services & products
Agree Disagree

23
Ability to compare & understand offers from electricity suppliers(Base: All adults 16+ - 1,007)
● 21% of consumers found comparison of offers difficult/very difficult Similar to 2013
● 26% of consumers stated that they had not attempted to compare offers
Back to 2012 levels
Assessment of difficulty with comparing offersUnderstanding of electricity suppliers’ offers
● 24% of consumers stated that they had small degree or no understanding of offers
● 15% of consumers stated that they were not aware of the offers
Small increase from 10% in 2013
● Similar levels of consumer capability to understand and compare offers as in 2014
Very difficult Difficult Neither easy nor difficult
Easy Very easy Not attempted comparison
4%
13%
25%
29%
4%
25%
4%
16%
24%
32%
5%
19%
5%
16%
20%
26%
9%
26%
201220132014
Not a
war
e of
offer
s
Do no
t und
erstan
d
A sm
all d
egre
e
Som
e un
dersta
nding
Mos
tly u
nder
stan
d
Fully
und
erstan
d
13%11%
14%
32%
21%
9%10% 11%
17%
31%
21%
10%
15%
10%
14%
27%
22%
11%201220132014

24
Understanding of Electricity Suppliers’ offers by Current Supplier
● 1 in 5 of those on Prepaypower claim to not be aware of offers.
Total Electric Ireland Bord Gais Energy Airtricity Prepaypower
15% 16% 15%8%
21%
10% 10% 7%13%
4%
14% 16%
8% 13%15%
27% 27%
30%28%
23%
22% 20%27% 27% 25%
11% 11% 13% 11% 12%
Fully understand
Mostly understand
Some understanding
A small degree
Do not understand
Not aware of offers
Understanding of Electricity Suppliers’ offers by Current Supplier
Base: 1,007 586 108 216 83

25
Received information from supplier on upcoming price changes within the last 6 months(Base: All adults 16+ - 1,007)
Price Changes
34%
Awareness of price changes announced by different suppliers since October 2013(Base: All adults 16+ - 1,007)
42%
Reason for price increases being announced(Base: All aware of price changes – 429)
Cost of energy is increasing
Regulartor imposed increases
Supplier has increased costs
Don’t know
53%
18%
18%
18%
Only one third are aware of receiving upcoming price change information from suppliers for the last 6 months
Most believe the cost of energy is increasing resulting in rising electricity prices
Yes
No
Yes
No

26
Price Changes x Supplier
● Electric Ireland and Bord Gáis Energy customers show the highest incidence of being informed about upcoming price changes.
● Bord Gáis Energy customers are also the most likely to be aware of price changes announced by suppliers since last October.
Received information from supplier on upcoming price changes within the past 6 months
Electric Ireland Bord Gais Energy
Airtricity Prepaypower
35% 36%
30%
18%
Yes
Electric Ireland Bord Gais Energy
Airtricity Prepaypower
40%
51%
45%
27%
Yes
Aware of price change announced by different suppliers’ since October 2013
Base: 585 108 216 83 Base: 585 108 216 83

27
Awareness of ESB Networks and Electric Ireland business namesBase: All adults 16+ - 1,007
27
● There is no significant difference in awareness of the Electric Ireland business names between Electric Ireland and non-Electric Ireland consumers
● Awareness of ESB Networks shows some divergence with a continued higher awareness amongst non-Electric Ireland customers
Awareness of ESB Networks and EI business names
Awareness
Current Supplier
Electric Ireland Non-Electric Ireland
’12 ’13 ’14 ’12 ’13 ’14
ESB Networks 80% 79% 79% 76% 85% 84%
Electric Ireland 83% 87% 91% 82% 87% 90%
Awareness of Electric Ireland and ESB Networks business names - By current supplier
*: ESB CS in 2010 and 20112010 2011 2012 2013 2014
86%
89%
83%
87%
90%
78%
86%
78%
81% 81%
Electric Ire-land*
ESB Networks

28
Customer understanding of the roles of electricity supplier and ESB NetworksBase: All adults 16+ - 1,007
28
● 2012 measurement added joint responsibility (“both”).
● Association of ‘supplier’ responsibility for billing and payment increases.
● Associations with ESB Networks indicate a steady increase in awareness of its role.
2010 2011 2012 2013 2014
Generation of electricity
Repairing power failures
Maintenance of the electricity grid
Reading the meter
Billing and payment
Responsibilities of ESB Networks and the electricity supplier
Supplier ESB Networks
2010 2011 2012 2013 2014
ESB
Netw
ork
sEI
2012 2013 2014
10% 13% 6%
8% 10% 6%
8% 10% 5%
6% 9% 4%
7% 9% 4%
Both
36% 32
%
34% 30
%
32%
25% 22% 26% 27% 26%
46%
61%47% 50% 54%
56%71%
56% 58% 63%
56%
73% 58
%58%
62%
17%
43%
26%
24%
23%
10%
35%
18%
18%
14%
28%
24%
29%
28%
26%
74% 62
%
72%
70%
78%
64% 52
%
61%
62%
63%

29
Customer understanding of the roles of electricity supplier and ESB NetworksBase: All adults 16+ - 1,007
29
● Electric Ireland customers in particular tend to be lacking in knowledge about the role of ESB Networks, albeit some slight improvement noted.
Non-Electric Ireland customers are less likely to ascribe a joint role between their supplier and ESB Networks this year. Indeed these customers are less likely to assign ESB Network roles to their supplier since last year.
● This suggests that role distinction is improving, albeit still not grasped by all consumers.
Electric Ireland Customers Non-Electric Ireland Customers
2013 2014 2013 2014
SupplierESB
Networks Both SupplierESB
Networks Both SupplierESB
Networks Both SupplierESB
Networks Both
Generation of electricity 34% 50% 10% 39% 49% 6% 24% 51% 17% 19% 64% 6%
Repairing power failures 30% 57% 8% 32% 59% 5% 24% 59% 12% 15% 71% 6%
Maintenance of the electricity grid
30% 57% 8% 32% 56% 5% 21% 60% 13% 15% 72% 5%
Reading the meter 63% 26% 6% 67% 22% 4% 59% 21% 12% 57% 24% 4%
Billing and payment 68% 23% 7% 76% 16% 4% 73% 10% 13% 82% 9% 3%
Responsibilities of ESB Networks and the electricity supplier
ES
B N
etw
ork
sEI

30
Switching & Engagement

31
Switching: Contact by suppliersBase: All adults 16+ - 1,007
● Rate of contact from suppliers regarding switching is similar to 2013 at 47% in 2014
The most common method of contact is still by a home visit (38%)
● BGE registered the largest pull back on home visiting (and contact in general).
Level of contact in previous 12 months – by current supplier
2012 2013 2014 2012 2013 2014 2012 2013 2014
7% 12% 9% 13% 10% 9% 7% 12% 11%4%
3% 6%8%
5% 2% 4%5% 4%
52% 36% 38%
51%
40%34%
52%35% 41%
46%
54% 48%
38%
52%
41%
42%
55%49%
No By home visit By mail
EI BGE Airtricity

32
Proportion switching by year (at least once in last 12 months)
Switching – rates and supplier sharesBase: All adults 16+ - 1,007
32
● The overall rate of switching increased back to 2012 levels (16%), but falls short of 2010/2011
27% of switchers switched back to their previous supplier, while 26% of dual fuel customers switched supplier in past 12 months.
● BGE has won an increasing proportion of the switchers (32%) with Airtricity’s share declining (25% in 2014 down from 43% in 2013 and 60% in 2012)
● Electric Ireland’s share of customers who have switched to them remains relatively stable at 38% (2013: 34%)
Breakdown of supplier switched to by year
2010 2011 2012 2013 2014
26%29%
16%12%
16%
2010 2011 2012 2013 20140% 3%
27%34% 38%
92%
43%
10%
12%
32%
8%
54%
60% 43%
25%
0% 0% 4%10%
5%
OtherAirtricityBGEEI
26% of those on dual fuel switched at least once in
past 12 months
27% of switchers switched back to
previous supplier

33
Total never switched
Profile of those who have never switched(Base: All adults 16+ - 1,007)
● Younger and older customers are the least likely to have ever switched electricity suppliers. Farmers and Blue Collar consumers are also least likely switchers, as are those living in the Conn/Ulster regions.
Non switchers by social class
AB C1C2 DE F
56%62%
67%
81%
18-25 26-35 36-45 46-55 56-64 65+
73%
58% 55%62% 65%
78%
Dublin Leinster Munster Conn/Ulster
62%56%
67% 70%
Total
63%
Non-Switchers by Age Non-Switchers by Region

34
Switching-Duel Fuel vs Electricity only and Gas only switching(Base: All adults 16+ - 1,007)
● Dual fuel customers show the highest incidence of having switched suppliers in the past 12 months.
Proportion switching at least once in the last 12 months
Dual Fuel Switched Electricity (non dual fuel)
Switched Gas (Non dual fuel)
26%
13%
1%
Base: (173) (834) (834)

35
Level of switching in last 12 months by Age
Switching by Age & Social Class(Base: All adults 16+ - 1,007)
● Level of electricity switching in last 12 months highest amongst 36-45 age group.
● Switching also highest among AB social class at 1 in 5.
18-25 26-35 36-45 46-55 56-64 65+
7%
19%22%
13%
17%
9%
Level of switching in last 12 months by Social Class
AB C1C2 DE F
20%
16%14%
7%

36
Contact method used to switch suppliers(Base: All who switched in past 12 months – 194)
36
Method used to switch Method used to switch – by supplier switched to
● Most (61%) of switchers completed the switch during a visit to their home Some increase in usage of supplier website and price comparison since 2012
● BGE acquired less via home visits, with the website and comparison sites playing more of a role.
68%
7%
19%
3% 2% 1%
65%
6%
22%
6%1% 0%
61%
9%
18%
7%3% 1%
201220132014
2012 2013 2014 2012 2013 2014 2012 2013 2014
51%
63% 60%67%
53%47%
81%76% 75%
14%
9% 9%
7%
7%10%
4%
4% 7%30%23%
20%
23%
33%
22%
7%
9% 10%
5% 5%6%
0%
7%
14%
4%9% 5%
0% 3% 6% 3%
Price compar-ison website
Supplier website
Phone (initi-ated contact)
Phone (contac-ted)
Home visit
EI BGE Airtricity

37
Prevalence of switchback among switchers
Switching rates: switchbacks, package and dual fuel switching(Base: All who switched in past 12 months – 194)
37
● 27% of switchers returned to their previous supplier
Similar to 2013 when 26% switched back
Some increase in switch back for Airtricity (+6% pts)
2012 2013 2014
2% 3%
9%2%
2%
4%
19%19%
13%
EIBGEAirtricity

38
Prevalence of switchback among switchers
Investigating and switching packages
38
● 2% of consumers contacted their supplier to investigate changing package (5% in 2013)
Among consumers who didn’t switch, 5% actually changed package (5% in 2013)
● Only 1% (8% in 2013) of those who didn’t switch and use natural gas extended to a dual fuel product
OverallElectric Ireland
BGE Airtricity
Contacted supplier about changing package 2% 1% 4% 4%
Changed package (among those who didn't switch)
4% 3% 6% 6%
Extended to dual fuel (among those who didn't switch and use natural gas)
1% 0% 2% 1%
Change payment channel 1% 0% - 2%
Changed billing frequency 1% 1% 1% 3%
Supplier

39
Understanding of offer – among switchers(Base: All who switched in past 12 months – 194)
● A significant increase registered in the proportion (47%) who believe there is a guarantee on the term of the discount they received.
● Among residential consumers who switched during the previous 12 months, 43% believe that there were no conditions associated with their switch
This is an increase back to 2012 levels (however note in 2013 19% did not know)
Restrictions perceived on offer taken
2012 2013 2014
11%19%
0%
42%33%
43%
13% 16%
13%
37% 38%47%
Guarantee on term of discountRestriction on how long must stay with supplierNoneDon't know

40
Reasons for switching – most important factors
40 ● As expected desire to save money on the electricity bill remains the key reason given by most consumers as a primary or important factor in the decision to switch.
● In second place are dual fuel offers.
● Consumers are also sensitive to price increases.
● It is interesting to note that the proportion of consumers agreeing that they received a larger bill than expected has decreased this year.
Reasons for switching during last 12 months (where >33% state factor is primary/important)
Not a factorPrimary/important2013
2014
2013
2014
2013
2014
2013
2014
2013
2014
2013
2014
78%
87%
45%
46%
41%
44%
34%
35%
52%
33%
36%
33%
5%
6%
29%
42%
30%
29%
46%
47%
26%
41%
41%
45%
I want to save money on my electricity bill
To avail of a combined offer for electricity and natural
gas
My previous supplier had recently announced a price
rise
I preferred the payment methods available from my
new supplier (for instance equal payments throughout
the year)
I received a larger than
expected bill
I expected the customer service from the new
supplier would be better

41
Reasons for switching – other factors
41 ● Service factors such as bill frequency, bill clarity, online billing were not rated as primary/ important factors by most consumers
Reasons for switching during last 12 months
Not a factor
87%
46%
44%
35%
33%
33%
30%
25%
18%
13%
12%
11%
11%
6%
42%
29%
47%
41%
45%
47%
65%
62%
77%
63%
77%
80%
I want to save money on my electricity bill
To avail of a combined offer for electricity and natural gas
My previous supplier had recently announced a price rise
I preferred the payment methods available from my new supplier (for instance equal payments throughout the
year)
I received a larger than expected bill
I expected the customer service from the new supplier would be better
I want to support competition in the marketplace
I was unhappy with the service I have received from my former supplier
I want a supplier that would supply electricity generated in a more environmentally friendly way
I wanted to receive my bill more often
I did not find the bill understandable
I preferred the online billing option from my new supplier
I moved to a new home and my new supplier had been used by the previous resident (or landlord)
Not a factorPrimary/important
42
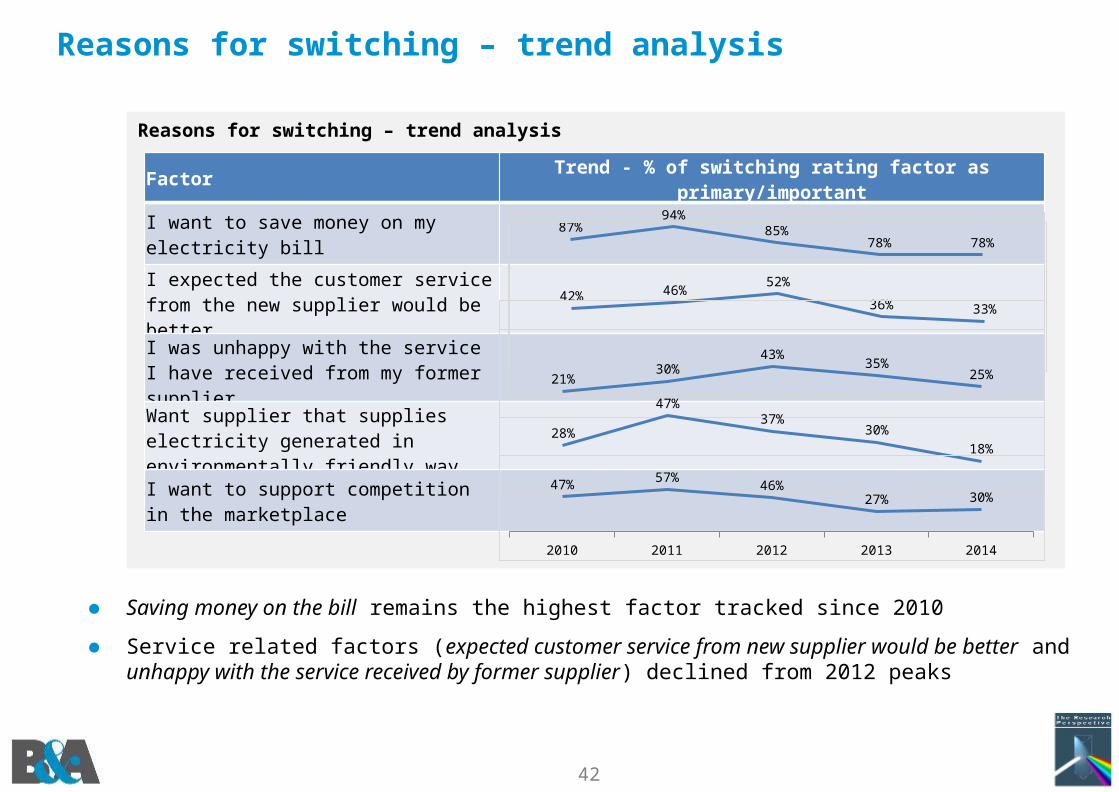
Reasons for switching – trend analysis
● Saving money on the bill remains the highest factor tracked since 2010
● Service related factors (expected customer service from new supplier would be better and unhappy with the service received by former supplier) declined from 2012 peaks
Reasons for switching – trend analysis
FactorTrend - % of switching rating factor as
primary/important
I want to save money on my electricity bill
I expected the customer service from the new supplier would be better
I was unhappy with the service I have received from my former supplier Want supplier that supplies electricity generated in environmentally friendly way
I want to support competition in the marketplace
87%94%
85%78% 78%
42% 46%52%
36% 33%
21%30%
43%35%
25%
28%
47%37%
30%18%
2010 2011 2012 2013 2014
47%57%
46%27% 30%

43
Comparison of most often reasons sited as primary or important reasons for switching back
Reasons for switching back43
● Reasons most often identified as important among consumers who switched back were similar to those who switched overall
Note: The wording for the switchback consumers varied to a small degree from the switching new consumers
● Of the specific reasons cited to switch back – ‘priced received not as good as expected’ has increased on 2013, with service issues decreasing.
Rating of reasons specific to switching back rated as primary or important
78%
58%
46%
40%
38%
37%
87%
NA
33%
25%
30%
NA
All switchersSwitch-back
I want to save money on my bill
I expected to get more savings by returning to my original supplier
I received a larger than expected bill
I was unhappy with the service I have received from my new supplier
I want to support competition in the market place
My bill increased in size because my new supplier had increased prices
2013%
2014 %
Switch-backAll Switchers
5366
7887
Switch-backAll Switchers
59n/a
58n/a
Switch-backAll Switchers
6378
4833
Switch-backAll Switchers
4435
4025
Switch-backAll Switchers
3816
3830
Switch-backAll Switchers
47n/a
37n/a
The price I received from my new supplier was not as good as I had expected
My original supplier contacted me with a better offer if I would switch back
Service from new supplier was not as good as the service received from original supplier
41%
41%
56%
54%
45%
39%
20142013

44
Most frequently rated reasons for not switching
44
● Satisfaction with the service received and trust are the top two most commonly selected as a primary/important reason for not switching
● 38% now state they do not believe that the levels of discount are sufficient to justify switching, with a similar proportion sceptical of supplier low prices claims.
Reasons for not switching during last 12 months (where >25% state factor is primary/important)
Reason
Primary/important
2014 Trend
I like the service that I receive from my current supplier
56%
I prefer to remain with an electricity supplier that I trust
55%
I have no reason to switch 44%
I do not believe that the level of discount are sufficient to justify switching
39%
I do not believe that the prices will be a low as the alternative supplier claims
37%
I will not save sufficient money to make it worth my while to switch
34%
I am concerned about whether the alternative supplier will be as responsive if there is a power outage
28%
I am concerned about whether the alternative supplier will provide a reliable supply of electricity
26%
55% 60% 61% 56%
74%
54% 55%
45%
61%51%
43%
26% 30%39% 38%
25%31%
42%37%
26%34%
39%34%
23% 23%
40%
28%
2011 2012 2013 2014
22% 29%40%
25%

45
Less frequently rated reasons for not switching
● Consumer confusion and perceived issues around complexity of offers are still cited by a minority of respondents
Reasons for not switching during last 12 months (where <25% state factor is primary/important)
Reason
Primary/important
2014 Trend
I find it hard to determine how much I would save if I switched
24%
I find the range of options offered to be confusing
19%
I find the terms and conditions relating to the offers to be confusing
18%
I intend to switch but I have not got around to it
9%
I am not able to switch because of the contract with my current supplier
7%
I have had a bad experience of switching other services (such as gas, telephone or mobile phone operators)
7%
23%15%
28% 24%
16% 19% 22% 19%
17%26% 22% 18%
9%4%
13% 9%
6%14%
7%
2011 2012 2013 2014
9%4% 7% 7%

46
Supplier role confusion and not switching
46
● Concerns about reliability of supply have decreased as reasons for not switching
This has decreased for BGE customers in particular
● Concerns about responsiveness in a power outage have in contrast increased for some operators (EI and Airtricity)
BGE has decreased on this measure
Concerns about supply reliability and maintenance: (Primary/important reason for not switching)
33% 30%11% 10%
24% 18%
EIBGEAirtricity
(+7)
(-8)
(+4) (-14)
(-29)(-10) ( ) = change vs 2013

47
FEA and switching
● FEA recipient switching rate remained stable in recent years
● FEA specific reasons remain much less commonly selected than general satisfaction with current supplier as the primary/ significant reason to remain with the current supplier.
Reasons for not switching – related to FEA
Reason for not switching – Top 2 reasons by FEA Customers (Base: All who did not switch – 120)
% rated primary/
significant
(Change from ‘13)
I prefer to remain with an electricity supplier that I trust
69% (+1%)
I like the service that I receive from my current supplier
60% (-8%)
Specific FEA reasons for not switching(Base: FEA consumers who did not switch – 120)
2014 score (Change from ‘13)
Concerned that might not continue to receive FEA if switched
25% (-9%)
Concerned that receiving FEA would be too inconvenient
22% (-10%)
2011 2012 2013 2014
14%
5%
7%8%
47
Proportion of consumers in receipt of FEA switching in last 12 months(Base: All in receipt of FEA – 134)

48
Rating the overall experience of switching
Experience of switching(Base: All who switched last 12 months – 194)
48
● Ease of switch experience registers an increase in 2014
As there have been no process changes, this must reflect increased expectations
● Thus not surprisingly (especially given that 54% felt the price received from their new supplier was not as good as expected), 31% are likely to switch again within 12 months).
Likelihood of switching in next 12 months – among switchers
% likely to switch again within 12 months
2010 2011 2012 2013 2014
70% 74%
45% 38%50%
27% 23%
46%46%
41%
97% 97%91%
84%91%
Series3EasyVery easy
2010 2011 2012 2013 2014
10%
32%
23%
33%31%

49
Experience of switching x supplier switched to
Experience of switching by supplier switched to
49
● Bord Gais Energy rated highest on ease of switching supplier, followed by Prepaypower and Airtricity.
Total Electric Ireland Bord Gais Energy*
Airtricity PrepayPower*
50%41%
50%57%
68%
41%43%
50% 36%27%
91%84%
100%93% 95%
Series3EasyVery easy
* Caution small base size
Base: (194) (65) (19) (57) (44)

50
Rating the overall experience of switching
Experience of switching process(Base: All who switched last 12 months – 194)
50
● Knowledge of who to contact is similar to pre 2013
● Similarly financial aspects of the switchover (duration of offer and deposit) declined
This reflects greater understanding of the offers and terms & conditions
● The ratings of the other specific aspects of the switching process remained high
Trend - % agree with statement2014 Trend
Knew who to contact 87%
Understood what was required
85%
Understood what was offered by the new supplier
89%
Actual changeover went smoothly
94%
Understood duration of offered prices
86%
Understood amount of deposit required
58%
0.9
0.820000000000001
0.860000000000001
93%
94%
94%
90%
94%
92%
95%
94%
90%
89%
89%
92%
94%
88%
85%
81%
86%
85% 74
%
87%
0.660.59 0.58

51
Rating the overall experience of switching supplier(Base: All who switched last 12 months – 194)
Rating of outcome – switching supplier and package
● While the overall rating of the switching experience has increased this year back to 2011 levels, the experience of the switching package indicates some declines. For example:
61% found the bill reduced by expected amount (vs. 67% in 2013).
FactorTrend - % agree with statement
2014 Trend
Bill reduced by expected amount
74%
New supplier service satisfactory
86%
Understood the terms
89%
Rating the overall experience of the actual switching package with current supplier(Base: All who switched package)
FactorTrend - % agree with
statement
2012 2013 2014
Bill reduced by expected amount 66% 67% 61%
Understood the terms 83% 88% 75%
Complied with the terms 79% 86% 72%2010 2011 2012 2013 2014
91%
86%
84%
89%
82%
92%
85%
78%
86%
78%
72%
70%
62%
74%

52
Rating of factors which would increase switching and impact of information sources on switching(Base: All adults 16+ - 1,007)
● Note new factors included in 2014, thus relativities impacted
● TOU (Time of Use) tariffs hold some interest as does information on how to reduce consumption – in reality consumers simply want to save money
● Some increased interest in a group scheme as an incentive for switching.
Would you consider switching if…
Agree Disagree
Impact of information sources on switching
Significantly increase
An
oth
er
su
pp
lier
off
ere
d
Increase
201220132014
201220132014
201220132014
201220132014
201220132014
201220132014
36%
35%
27%
32%
36%
26%
27%
28%
17%
22%
27%
20%
na
na
27%
na
na
29%
35%
38%
46%
41%
37%
47%
51%
48%
60%
50%
45%
53%
48%
45%
Recommendation from family/ friends
Same price - more environmentally friendly generation
Prepayment
Better service such as energy advice or online billing
Tariffs which included cheaper electricity at some times (balanced with more expensive electricity at other times)
More information about how to reduce my electricity usage such as an online system which allowed me to check my usage over the previous year
A group-scheme (from work or sport/other association) that I could avail of
Price comparison website
Website with a potential savings calculator
More information on bill about electricity consumption
A brochure comparing prices and examples of potential savings of typical households
201220132014
201220132014
201220132014
201220132014
201220132014
N/A10%
15%
11%10%
13%
13%12%13%
16%16%
13%
13%14%14%
14%15%
14%17%11%
13%16%
12%
18%21%
12%
18%21%
12%

53
Assessment of Sales Process

54
Consumer acceptance of call/phone contact(Base: All who were contacted by other suppler – 493)
Over 65yr (Base: 83)
2011 2012 2013 2014
56% 67% 62% 64%
59% 67% 66% 56%
61% 67% 60% 35%
69% 67% 75% 60%
60% 83% 64% 38%
70% 83% 83% 63%
80% 100% 83% 65%
Appropriate of call to door /phone contact
2014 Trend
Approach of sales person 62%
Number of contacts 66%
Understood the deal offered 61%
No unreasonable pressure to sign-up 66%
Understood T&Cs 59%
Not concerned if I said no 70%
Tone of conversation was appropriate 73%
Consumer rating of call/phone contact from suppliers
● Among those who had been contacted by phone or received a house call in the last 12 months, the approach, pressure, tone and offer understanding have all shown declines from 2012
● Scores have declined for those customers over 65 years
72%
81%
73%
70%
75%
90% 75
% 59%
70%
87% 74
%66%
80%
90% 72
%61%
72%
89% 66
%66%
72%
82%
67%
62%
75%
90% 75
%73%

55
Customer rating of call/phone contact from suppliers x region and contact type(Base: All who were contacted by other suppler – 493)
● Rest of Leinster and Connaught/Ulster ratings of sales process more positive than that experienced by consumers in Dublin and Munster.
● Those who received a face to face visit were also more satisfied with the contact vs those who received a phone call or mail.
Total Region Contact
2014 DublinRest of Leinster
MunsterConn/ Ulster
Phone MailHome visit
Approach of sales person 62% 53% 63% 69% 64% 62% 39% 64%
Number of contacts 66% 59% 74% 62% 74% 66% 45% 68%
Understood the deal offered 61% 60% 66% 54% 66% 55% 47% 62%
No unreasonable pressure to sign up 66% 56% 71% 66% 81% 64% 48% 69%
Understood terms and conditions 59% 54% 71% 53% 62% 55% 44% 60%
Not concerned if I said no 70% 67% 76% 69% 68% 71% 58% 72%
Tone of conversation 73% 63% 82% 74% 80% 71% 50% 76%
Appropriate of call to door/phone contact

56
Consumer response to advertising(Base: All who were contacted by other suppler – 493)
● Scores continue to decline from the peak in 2012
● All metrics are now scored less than 40% agree
Reaction to advertising 2011 2012 2013 2014
Advertising straight forward 71% 69% 58% 35%
Advertising clear on prices 61% 69% 51% 32%
Advertising clear on conditions 58% 69% 49% 33%
Advertising clear on savings 66% 74% 51% 34%
Clear on how to translate advertised savings into my bill
57% 73% 46% 30%
Consumer rating of call/phone contact from suppliers
2011 2012 2013 2014
11% 10% 14% 23%
17% 10% 18% 24%
18% 12% 19% 25%
13% 8% 17% 22%
19% 10% 22% 27%
AgreeAgree Disagree

57
Dual Fuel

58
Residential: Level and reasons for take-up of dual fuel
● Among consumers with natural gas and electricity, 52% continue to use a single supplier.
Results combine data from electricity and gas surveys
● The factor most often rated as important is greater savings overall when gas and electricity are purchase together. However the importance of this has declined over the years. Convenience of a dual supplier and greater reduction in gas prices have increased in importance this year.
% of consumers with a single supplier for gas and electricity
Single supplier
Twosuppliers
Rating of potential factors – single supplier
Important factor Not a factor
2010 2012 2013 2014
61%50% 52% 52%
39%50% 48% 48%
The greater reduction in electricity prices offered if your business also used the same supplier for gas The greater reduction in gas prices offered if you also used the same supplier for electricity The greater saving overall
The convenience of having a single supplier for both
Aspects of the service provided by your supplier - for both electricity and gas
201220132014
201220132014
201220132014
201220132014
201220132014
66%62%64%
61%59%
67%
81%76%
72%
61%56%
66%
53%55%54%
12%11%14%
14%14%14%
6%7%
10%
20%18%15%
22%17%19%

59
Take-up and interest in dual fuel: Reasons for not taking up dual fuel
● Among consumers with both natural gas and electricity with different suppliers for each, satisfaction with the service provided by each supplier was the only reason identified as important by a majority
Some increase in ‘not wanting to accept additional conditions such as paying by direct debit or getting the bill online’
Rating of potential factors - separate suppliers
Important factor Not a factor59
% of consumers with a single supplier for gas and electricity
Single supplier
Twosuppliers
2010 2012 2013 2014
61%50% 52% 52%
39%50% 48% 48%
Not aware that it was possible to get both fuels from one supplier Do not want to accept additional conditions such as paying by direct debit or getting the bill online
Prefer two separate bills with two different suppliers
Savings are greater if your business uses two different suppliers
Satisfied with the service provided by our current supplier for each and see no reason to switch
You do not trust a single supplier to provide both electricity and gas
Do not want to receive a single bill for both gas and electricity
You are concerned about what would happen if your business fell behind on payments for either
201220132014
201220132014
201220132014
201220132014
201220132014
201220132014
201220132014
201220132014
0%11%
17%
23%27%
36%
42%40%
28%26%29%
59%59%61%
25%24%24%
30%32%
25%28%28%
n/a69%
63%
54%48%
40%
30%35%
41%34%33%
17%21%16%
50%45%
49%
43%41%
57%48%50%
n/a

60
Bill Clarity & Information Supports

61
Typically open and read bill when received
Interaction with Electricity BillBase: All adults 16+ - 1,007
83%
17%
Parts of bill typically looked at(Base: All who open bill – 406)
While the vast majority open their bill, the focus is on the total bill amount.
YesNo
Amount of bill
Bill payment date
Consumption in last period
Price of electricity
Meter Reading
99%
88%
55%
51%
49%

62
Overall satisfactionBase: All adults 16+ - 1,007
● 74% of consumers are satisfied with their understanding of the electricity bill (up from 59%)
● A more consistent understanding of the bill across demographics is evident
62 % of consumers understanding their electricity bill (including amount used and amount charged for it)
% of consumers understanding their electricity bill (including amount used and amount charged for it)
Age cohort Social grade
18-25 26-35 36-45 46-55 56-64 65+ AB C1C2 DE F
66%
79%
71% 69%
76% 77% 75% 74% 72% 73%
2013 2014
9% 6%
8%3%
23%
17%
34%51%
25% 23% Very satisfied
Satisfied
Neither satisfied nor dissatisfied
Very dissatisfied
Dissatisfied

63
Rating the billBase: All adults 16+ - 1,007
Overall ratings of the bill by customers are stable BGE and Airtricity have consistently increased on all billing metrics
Change vs 2013
(-1%) (-1%) (+19%) (+5%)
Understand the calculation of the bill
Bill is easy to understand Bill makes it easy to understand the electricity used
Makes it easy to understand the electricity charged for
0%40%80% 60% 60% 72% 60%
Chart Title
0%40%80% 61% 61% 68% 59%
Chart Title
0%40%80% 63% 63% 73% 59%
Chart Title
0%40%80% 59% 59% 68% 58%
Chart Title
Change vs 2013
(=%) (-5%) (+17%) (+3%)
Change vs 2013
(+3%) (=%) (+22%) (+9%)Change vs
2013(-1%) (-4%) (+17%) (+8%)

64
Complaint Handling

65
Complaint handling – propensity and topics
● 4% of respondents had complained within the last 12 months
This is in line with the previous measurements
● The most common category of complain remains billing and payment (57%) – albeit the proportions have decreased since 2013. Some increase in complaints area; late payment/disconnection and issue related to switching.
Proportion of respondents who complained over last year(Base: All adults 16+ - 1007)
Complaint topic ’11 ’12 ’13 ’14
Billing and payment 63% 63% 74% 57%
Reliability of supply/power failures/supply issues
16% 6% 17% 17%
Late payment or disconnection
3% 9% 2% 6%
Issue related to switching
3% 4% 2% 6%
Connection/modification of supply
<1% 9% 1% 3%
Other 16% 9% 5% 6%
Complaint made to(Base: All who made a complaint – 46)
2011 2012 2013 2014
5%6%
5%4%
Current/previous supplier
ESB Networks
NCA
CER
Other
Don't know
57%
40%
0%
3%
0%
0%
85%
17%
0%
0%
2%
0%
74%
17%
2%
2%
1%
5%
79%
15%
0%
0%
0%
7%
2014201320122011

66
Complaint handling – awareness of process(Base: All adults 16+ - 1,007)
There has been a continued decline in the knowledge of ability to complain to CER Indeed just 57% know how to lodge a complaint
Most consumers understand who they should complain to, with current supplier increasing.
Knowledge of how to make a complaint Awareness of who to complain to
2011 2012 2013 2014
68%63%
55% 57%
45% 45%40%
36%
Know how to lodge a complaint
Aware you can complain to CER
59%
32%
2% 1% 2% 4%
74%
16%
1% 2% 0%6%
74%
17%
2% 2% 1%5%
79%
13%
1% 1% 0%5%
2011 2012 2013 2014

67
Satisfaction with handling and timeliness(Base: All who made a complaint - 46)
● The level of satisfaction with supplier complaint remains at a low level, albeit increasing over the last 2 years
Per supplier breakdown are not available due to small sample size
● Satisfaction with ESB Networks complaint handling has recovered somewhat, but not to 2011/2012 levels
● Overall satisfaction with the outcome has somewhat improved, but is still short of 2011
ESB NetworksSatisfaction with handling Satisfaction with time taken
Satisfaction with outcomeSupplierSatisfaction with handling Satisfaction with time taken
Satisfied
Dissatisfied
Satisfied
Dissatisfied
2011 2012 2013 2014 2011 2012 2013 2014
50%
27% 32% 38%50%
32%41% 37%
30%48% 54%
42%30%
50% 43% 43%
2011 2012 2013 2014
50%41%
29%36%
23%
48%56%
45%
2011 2012 2013 2014 2011 2012 2013 2014
64% 67%
40%48%
79%67%
40%48%
21% 22%
40%29%
21% 22%
40%29%

68
Interest in Prepayment

69
Interest in prepayment(Base: All not on prepayment – 850)69
● 14% of consumers (not on prepayment) stated some level of interest in prepayment meters – a decline on 2013 (however note some of last years enthusiasts have already switched)
The highest level of interest was in C1C2 (6%), DE (7%) and 18-25 (15%)
Level of interest in prepayment (very interested &Not at all interested) – by social grade and age
Level of interest in prepayment
Not at all interested Very interested
Not at all interested Very interested2011
2012
2013
2014
42%
47%
45%
61%
11%
9%
11%
11%
13%
16%
16%
13%
12%
13%
14%
8%
19%
12%
12%
6%
18-25
26-35
36-45
46-55
56-64
65+
AB
C1C2
DE
F
34%
60%
53%
59%
72%
74%
70%
60%
55%
78%
15%
5%
7%
6%
4%
3%
2%
6%
7%
6%

70
Rating of perceived benefits among consumers interested but not on prepayment(Base: All not on prepayment but interested – 106)
70
● Among consumers with a moderate to high level of interest in prepayment, all benefits proposed were seen as potential benefits by most consumers
Controlling bills is primary advantage cited
Rating the potential benefits – among those interestedin using prepayment
Not at all interested Very interested
Prime benefit/benefitPrepayment…
61%
11%
13% 8% 6%
Would make it easier to manage the money spent on electricity
Would mean that there is one less bill to think about
Would make me more aware of the cost of electricity
Would mean that I wouldn't get unexpectedly large bills
Would mean that I would not get estimated bills any more
Means that I would not have to worry about being disconnected if I don’t keep up to date with the bill
77%
79%
74%
78%
75%
75%
76%
80%
78%
80%
80%
82%
52%
49%
51%
65%
53%
54%
201420132012

71
Rating of perceived benefits among consumers on prepayment(Base: All on prepayment – 157)
● Prepayment is clearly preferred to bill pay by consumers on prepayment
Prime benefit/benefit
Rating the experienced benefits – among those with prepayment
Comparative rating of prepayment and bill payment- among respondents currently on prepayment
Prepayment…Compared to receiving and paying bills after you have consumed theelectricity, how would you rate a prepayment meter where you pay in advance…
Would make it easier to manage the money spent on electricity
Would mean that there is one less bill to think about
Would make me more aware of the cost of electricity
Would mean that I wouldn't get unexpectedly large bills
Would mean that I would not get estimated bills any more
Means that I would not have to worry about being disconnected if I don’t keep up to date with the bill
77%
79%
74%
78%
75%
75%
76%
80%
78%
80%
80%
82%
74%
73%
63%
76%
70%
73%
201420132012
Muc
h le
ss sat
isfa
...
Less
sat
isfa
ctor
y
Abou
t the
sam
e
Mor
e sa
tisfa
ctor
y
Muc
h m
ore
satis
f...
Don't
know
2% 2%7%
19%
67%
2%0% 0%6%
25%
67%
2%1%6%
15%
26%
51%
1%
2012 2013 2014

72
Comparative rating of prepayment and bill payment by supplier
72
● Highest level of prepayment satisfaction vs bill pay is among PrepayPower customers.
Electric Ireland customers currently on prepayment are the most likely to rate prepayment as less satisfactory to receiving and paying bills.
Base: All currently on prepayment - 157
0.01 0.02 0 0 00.01 0 0 0 0.030.06
0.11
0 00.03
0.150.16
0.240.33
0.05
0.26
0.27
0.15
0.4
0.22
0.510.44
0.61
0.27
0.67Much more satisfactoryMore satisfactoryAbout the sameLess satisfactoryMuch less satisfactoryDon’t know

73
Vulnerable & Priority Customers

74
Vulnerable consumers: Awareness of registration categories(Base: All adults 16+ - 1007)
● A minority of consumers are aware that it is possible to register with the supplier if dependent on electrically powered medical equipment (priority status) or vulnerable due to age or other conditions (the broader definition of vulnerable)
● Awareness does increase with age (albeit all scores have declined) – but amongst respondents over 65 only a minority of respondents were aware of either category
Awareness of priority and vulnerable status registration Awareness of priority registration- By age
Awareness of vulnerable status registration- By age
Awareness of priority registra-tion
Awareness of other vulnerable category registration
24%
0%
25%
16%
25%
15%
21%
11%
2011 2012 2013 2014
18-25 26-35 36-45 46-55 56-64 65+
21% 22%24% 26%
33%
26%
20% 21% 19%
27%
34%
29%
15%18% 19%
22%24% 24%
2012 2013 2014
18-25 26-35 36-45 46-55 56-64 65+
11% 11%
16% 17%21% 21%
14%12% 13%
17%20%
15%
6%9%
11%13% 13%
11%
2012 2013 2014

75
Vulnerable consumers: Level of registration
75
● 11% of respondents stated that they lived in households with 9% of these registered (1% of total base).
● The most common reason for not registering when aware was a perception that they were not eligible.
Incidence of those who are eligible for registration vs those actually registered.
Reasons given for not registering when aware of opportunity to register(Base: All eligible but not registered)
Did not know that I could register
Did not know what I needed to do in order to register
Do not think that I need to register as I can manage without electricity occasionally
Would be concerned about giving that sort of confidential information to my supplier
Other
Don't know
21%
2%
23%
5%
17%
28%
20%
11%
20%
3%
7%
31%
17%
4%
25%
3%
25%
26%
2014 2013 2012
Eligible for registration Registered
11% 9% 1% of total base
(Base: All adults – 1,007)
(Base: All eligible - 122)