CEPA Working Paper No. 17-02
27
How much do test scores vary among school districts? New estimates using population data, 2009-2013 This paper provides the first population-based evidence on how much standardized test scores vary among public school districts within each state and what factors explain that variation. Using over 200 million standardized test records in math and ELA for grades 3 through 8 from every U.S. public school district during the 2008-09 to 2012-13 school years, we estimate intraclass correlations (ICCs) as a measure of between-district variation. We characterize the variation in the ICCs across states, as well as the patterns in the ICCs over subjects, grades and cohorts. Further, we investigate the relationship between the ICCs and measures of racial and socioeconomic segregation. We find that between-district variation is greatest, on average, in states with high levels of both white-black and economic segregation among school districts. ABSTRACT AUTHORS VERSION January 2017 Suggested citation: Fahle, E., & Reardon, S.F. (2017). How much do test scores vary among school districts? New estimates using population data, 2009-2013 (CEPA Working Paper No.17-02). Retrieved from Stanford Center for Education Policy Analysis: http://cepa.stanford.edu/wp17-02 CEPA Working Paper No. 17-02 Erin M. Fahle Stanford University Sean F. Reardon Stanford University
Transcript of CEPA Working Paper No. 17-02
How much do test scores vary among school districts? New estimates using population data, 2009-2013
This paper provides the first population-based evidence on how much standardized test
scores vary among public school districts within each state and what factors explain that
variation. Using over 200 million standardized test records in math and ELA for grades 3
through 8 from every U.S. public school district during the 2008-09 to 2012-13 school years,
we estimate intraclass correlations (ICCs) as a measure of between-district variation. We
characterize the variation in the ICCs across states, as well as the patterns in the ICCs over
subjects, grades and cohorts. Further, we investigate the relationship between the ICCs and
measures of racial and socioeconomic segregation. We find that between-district variation is
greatest, on average, in states with high levels of both white-black and economic segregation
among school districts.
ABSTRACTAUTHORS
VERSION
January 2017
Suggested citation: Fahle, E., & Reardon, S.F. (2017). How much do test scores vary among school districts? New estimates using population data, 2009-2013 (CEPA Working Paper No.17-02). Retrieved from Stanford Center for Education Policy Analysis: http://cepa.stanford.edu/wp17-02
CEPA Working Paper No. 17-02
Erin M. FahleStanford University
Sean F. ReardonStanford University
How much do test scores vary among school districts?
New estimates using population data, 2009-2013
Erin M. Fahle
Sean F. Reardon
Stanford University
Version: January 2017
Direct correspondence to Erin Fahle ([email protected]). This research was supported by grants from the Institute of Education Sciences (R305D110018 and R305B090016), the Spencer Foundation (Award #201500058), and the William T. Grant Foundation (Award #186173) to Stanford University (Sean F. Reardon, Principal Investigator). The paper would not have been possible without the assistance of Ross Santy, Michael Hawes, and Marilyn Seastrom, who facilitated access to the EDFacts data. The paper benefited from collaboration with Andrew Ho, Katherine Castellano, and Ben Shear. We thank Demetra Kalogrides for excellent research assistance. Some of the data used in this paper was provided by the National Center for Education Statistics (NCES). The opinions expressed here are ours and do not represent views of NCES, the Institute of Education Sciences, or the U.S. Department of Education.
HOW MUCH DO TEST SCORES VARY AMONG DISTRICTS
2
How much do test scores vary among school districts?
New estimates using population data, 2009-2013
Abstract
This paper provides the first population-based evidence on how much standardized test scores vary
among public school districts within each state and what factors explain that variation. Using over 200
million standardized test records in math and ELA for grades 3 through 8 from every U.S. public school
district during the 2008-09 to 2012-13 school years, we estimate intraclass correlations (ICCs) as a
measure of between-district variation. We characterize the variation in the ICCs across states, as well as
the patterns in the ICCs over subjects, grades and cohorts. Further, we investigate the relationship
between the ICCs and measures of racial and socioeconomic segregation. We find that between-district
variation is greatest, on average, in states with high levels of both white-black and economic segregation
among school districts.
Keywords: between-district variation, intraclass correlation, segregation
HOW MUCH DO TEST SCORES VARY AMONG DISTRICTS
3
How much do test scores vary among school districts?
New estimates using population data, 2009-2013
Introduction
Average student academic performance varies substantially among school districts in the United
States. This is obvious from even the most cursory glance at publicly available test score data. But what
factors shape this variation? To what extent is this variation due to differences in school quality and to
what extent are is it due to the myriad of out-of-school factors that shape children’s opportunities,
including their family resources, neighborhood conditions, preschool programs, and afterschool
activities?
Answering these questions requires, first, a comprehensive description of the degree and
patterns of variation in academic performance among school districts in the U.S. We do not currently
have such a description, however. The National Assessment of Educational Progress (NAEP) tests provide
information on variation in academic performance among states, but not among schools or districts. State
accountability tests can provide school or district-level information, but a comprehensive analysis is
complicated by the facts that most states use different standardized tests and that publicly available data
often do not include detailed information on each school or district’s test score distribution. Nationally
representative studies conducted periodically by the National Center for Education Statistics (NCES)
provide estimates of the variation in test scores among schools (e.g., Hedges & Hedberg, 2007), but
cannot—because of their sampling designs—describe variation among districts, within individual states,
or across a range of grades and student cohorts.
In this paper, we provide a comprehensive description of the patterns of between-district test
score variation in the U.S. We apply newly developed methods to estimate the proportion of total test
score variance that lies between districts in each state, using over 200 million standardized math and
HOW MUCH DO TEST SCORES VARY AMONG DISTRICTS
4
English Language Arts (ELA) student test scores from every public school district in the U.S. during the
2008-09 through 2012-13 school years. As we demonstrate below, there is considerable variation among
states in the degree to which test scores vary among school districts. Moreover, most of this variation is
associated with factors outside of school districts’ control: between-district variation is greatest, on
average, in states with high levels of between-district racial and economic segregation.
Background Student performance on standardized tests may vary among school districts for a variety of
reasons: differences in family resources (including economic, social, and cultural capital); differences in
neighborhood conditions and resources; differences in the availability and quality of child care, preschool,
and afterschool programs; and—of course—differences in the resources, curricula, instructional
practices, and other dimensions of the quality of local schools.
Each of these factors may independently affect academic performance, and their effects may
interact as well. For example, low-income communities may have lower average achievement than high-
income communities not only because poor families have fewer resources to provide their children at
home, but also because concentrated poverty may lead to lower-quality preschool options and lower-
quality public K-12 schools. High-income communities, where parents can afford to pay for high-quality
childcare and preschool, may also be able to attract more skilled K-12 teachers. So even if average test
scores were determined solely by what happens in schools, these school experiences might be shaped by
out-of-school socioeconomic contexts. Therefore, it is perhaps more appropriate to think of the average
academic performance of students in a given school district as reflecting the total set of (both in- and out-
of-school) educational opportunities and resources available to children in that community.
We hypothesize that between-district disparities in access to total resources and opportunities
are likely largest in states with high levels of residential segregation. When between-district economic
HOW MUCH DO TEST SCORES VARY AMONG DISTRICTS
5
segregation is high, low-income children with fewer home resources also have access to fewer
neighborhood resources and differentially attend lower-quality school districts with similar low-income
peers. High-income students are concentrated in high-income neighborhoods with access to more
resources and opportunities outside of school, as well as access to higher quality schools attended by
similar high-income peers. Given the relationship between resources and achievement, the stark
between-district resource disparity in highly segregated states suggests that there will be greater
variation in test scores between-districts, on average, in these states relative to others.
The effects of exposure to differential total resources may further compound over time. If so, we
would expect to find that between-district variation should increase in later grades relative to earlier
grades. The logic is that younger students, whether resource poor or rich, have less exposure to their
respective resources than they will have had by the time that they are older. Therefore, differences in
academic achievement related to differences in total resources will be smaller when students are
younger and grow with students increased exposure to their respective resources. This hypothesis
suggests that not only do resource-poor students start school behind, but their academic performance
grows more slowly than that of resource-rich students. If true, we would find that between-district
disparities in test performance widen faster, on average, as children progress through school in more
segregated states than in less segregated states.
The most comprehensive study of between-district variation in test scores to date is by Hedges
and Hedberg (2014). They estimated between-district intraclass correlations (ICCs) for multiple grades in
both math and ELA for 11 states each in a single year. Their study identifies three patterns that merit
further exploration. First, between-district ICCs varied considerably among states. That is, in some states,
students in all districts performed, on average, quite similarly; in other states, average student
performance varied considerably among districts. Second, Hedges and Hedberg found that ICCs are
generally larger in math than in reading. And third, they found that between-district ICCs are, on average,
HOW MUCH DO TEST SCORES VARY AMONG DISTRICTS
6
larger in later grades than earlier ones. Hedges and Hedberg did not investigate the sources or correlates
of these three types of variation – among states, subjects and grades. Using state accountability test data,
we build on this work by exploring the robustness of those three patterns across the U.S. and analyzing
the patterns in light of our framework about access to resources using covariate data to explain variation
along these dimensions.
Data and Measures
Test Score Data
The test score data in this study come from the federal EDFacts data collection system. The data
were provided to us by the National Center for Education Statistics under a restricted data use license.
The EDFacts data include counts of students in each of several ordered proficiency categories (labeled,
for example, as “below basic,” “basic,” “proficient,” and “advanced”), by school, year, grade, and test
subject for all fifty states and the District of Columbia. Complete data, including math and ELA scores, are
available for all tested students in third through eighth grade from the 2008-09 school year through
2012-13.1 The full dataset represents students’ scores on roughly 220 million standardized tests
administered during this five-year period.
We aggregate the data to produce counts of students in each proficiency category within each
school district-year-grade-subject cell. For each grade, we define a school district as the set of public
(charter and non-charter) schools that serve students in that grade which are located within the
geographic boundaries of a traditional (non-charter) public school district. Operationally, we assign
charter schools to the traditional (non-charter) local education authority (LEA) in which they are
geographically located. By this definition, a district’s test score distribution describes the distribution of
1 The only exception is that data are missing from Wyoming in the 2009-10 school year.
HOW MUCH DO TEST SCORES VARY AMONG DISTRICTS
7
academic performance of all public school students attending school in a geographically-defined
community. The average student test score in a district can therefore be thought of as the result of the
total set of educational opportunities and constraints available to students in the community from birth
through middle school—including opportunities in their homes, neighborhoods, child care and preschool
programs, as well as in their local public schools.2
We exclude a small subset of the data. First, we exclude Hawai’i and the District of Columbia
because each has only a single school district, making the estimation of between-district variation
irrelevant. Second, we exclude schools administered by the Bureau of Indian Education (BIE) due to data
comparability issues. Third, in a few cases, not all students in a state took the same grade-level subject
test in a given year. In such cases, between-district variation in test scores will be conflated with
between-district differences in the proportions of students taking each test. Based on this requirement,
we exclude all data from Nebraska in the 2008-09 school year and math data from Nebraska in the 2009-
10 school year, as districts were allowed to select their own assessments in these years and subjects.
Additionally, we exclude math data from California and Virginia for 7th and 8th grades in all years, as
students in those states take different math assessments in those grades depending on the level of math
course in which they are enrolled.
Measure of Between-District Variation in Test Scores
There are two approaches that can be used to measure between-district variation in test scores.
One approach assumes a common within-district test score variance (denoted ) and typically uses a
maximum likelihood approach to estimate both and the (unweighted) variance of the district means
(denoted ); the ICC is then defined as /( + ). This is the approach used by Hedges and Hedberg
(2014). The ICC defined this way is useful in designing studies that sample participants from multiple
2 Of course, not every public school student attends a school located in the geographic district in which he or she resides, but the overwhelming majority do.

HOW MUCH DO TEST SCORES VARY AMONG DISTRICTS
8
school districts, because the sampling variance of parameter estimates (and therefore the statistical
power of a study) depend on this ICC (e.g., Hedges & Hedberg, 2007; Hedges 2007; Jacob, Zhu & Bloom,
2010; Raudenbush, Martinez & Spybrook, 2007; Schochet, 2008). The other approach is an analysis-of-
variance method that decomposes the total variance of test scores into between- and within-district
components. If all districts are the same size and the within-district variance is the same everywhere, the
two approaches estimate the same parameter. When districts are of different sizes, the two approaches
do not estimate the same ICC, because the unweighted variance of district means ( ) is not in general
equal to the between-district variance of test scores.
We use the analysis-of-variance approach because we are using population-based data (not a
sample) where districts have known, variable sizes. Additionally, we do not assume that all school districts
within a state have a common within-district variance and allow for the estimation of unique within-
district variances, as the methodology (described below) allows.
We use the proficiency category counts in the EDFacts data to construct estimates of the
between-district proportion of test score variance in each state-grade-year-subject. If we knew the
variance ( ) of test scores in each school district in a metric in which test scores are standardized
within each state-grade-year-subject, we could compute the ICC as 1 − ∑ , where is the
proportion of students in a state-grade-year-subject who are in district . In order to estimate from
the raw EDFacts proficiency data, we use a new adaptation of the heteroskedastic ordered probit model
described by Reardon, Shear, Castellano and Ho (forthcoming). We calculate the ICC using Equation (11)
from that paper. Using both simulations and analyses of real test score data, Reardon et al. demonstrate
that this approach provides nearly unbiased estimates of district-specific test score distributions and
between-district ICCs under a wide range of conditions. Although the Reardon et al. ICC estimator is
slightly positively biased, they show that the bias is generally very small—less than 0.005—unless all
groups are very small (fewer than 100 students per grade), a condition not present in any state when
HOW MUCH DO TEST SCORES VARY AMONG DISTRICTS
9
using schools districts as the target groups.3
In total, we estimate 2,890 between-district ICCs.4,5 For all but four states in our sample, we
produce 60 ICC estimates (2 subjects x 6 grades x 5 years) per state. Due to the data restrictions
described above, we can only estimate the ICC in a reduced number of cases for California (50), Nebraska
(42), Virginia (50), and Wyoming (48). To all estimates, we apply a standard measurement error
correction of , where is the reported test reliability for the test used in that state-grade-year-subject.6
State-level covariates
In states with many small school districts, Tiebout sorting processes (Bayer, Ferreira & McMillan,
2004, 2008; Tiebout, 1956) might lead to low within-district variance in test scores relative to states
where most students are concentrated in a few large school districts. We therefore include in our
regression models a set of variables measuring the size and number of school districts. These include the
number of school districts, the average district enrollment, and the standard deviation of district
enrollments. In addition, we calculate the Hirschman-Herfindahl Index (HHI) (Herfindahl, 1950;
Hirschman, 1945, 1964) of school district enrollments. This measures the extent to which students are
3 Note that if we had computed the between-school ICCs this would have been the case and the ICC estimates would be biased. Therefore, we do not report school-level ICCs. 4 All estimation is performed using the -hetop- (“heteroskedastic ordered probit”) command (Shear & Reardon, 2016), which relies on the -oglm- (“ordered generalized linear model”) command (Williams, 2010) in Stata (StataCorp, 2013). For details on the methodology, estimation and calculation of the ICCs, we direct readers to Reardon et al. (forthcoming). 5 We estimate the between-district ICC in each state-grade-year-subject using the “partially heteroskedastic ordered probit model” described by Reardon et al. (forthcoming). This model estimates a common variance for all districts with fewer than 50 students per grade, but allows the variances to vary among larger districts. The estimated ICC from this model has a smaller sampling variance and mean squared error than that from a fully heteroskedastic model. In a few states where only two proficiency categories are reported, we fit homoskedastic ordered probit models (constraining the variances in all districts to be the same), since the heteroskedastic model requires data with at least three ordered proficiency categories. Specifically, we fit the homoscedastic model in 72 of the 2,890 state-grade-year-subject cases. These cases include Colorado (all grades in 2009 through 2011 school years; 36 cases), Florida (all grades in 2009; 12 cases), South Carolina (all grades in 2011; 12 cases), and Texas (all grades in 2012; 12 cases). 6 The reliability data for each state’s subject-grade-year tests were provided by Reardon and Ho (2015) and supplemented with additional publicly available information from state technical reports. For cases where no information was available, test reliabilities were imputed using data from other grades and years in the same state.
HOW MUCH DO TEST SCORES VARY AMONG DISTRICTS
10
concentrated in few large districts or many small ones. In the education literature this is often referred to
as a measure of school district fragmentation (Bischoff, 2008; Owens, 2016).7 We compute these four
statistics using data from the Common Core of Data (CCD)8 separately for each grade (3 through 8) in
every year (2008-09 through 2012-13), and then average each within states to construct state-level
variables.9
To measure segregation among school districts, we compute the between-district white-black,
white-Hispanic, and poor-non poor (using free lunch receipt as an indicator of poverty) information
theory index ( ) (Massey & Denton, 1988; Theil & Finezza, 1971) using CCD data. Again, we compute the
segregation measures separately by grade and year, and then average each within states. Summary
statistics for all of the state-average covariates and transformed state-average covariates used on the
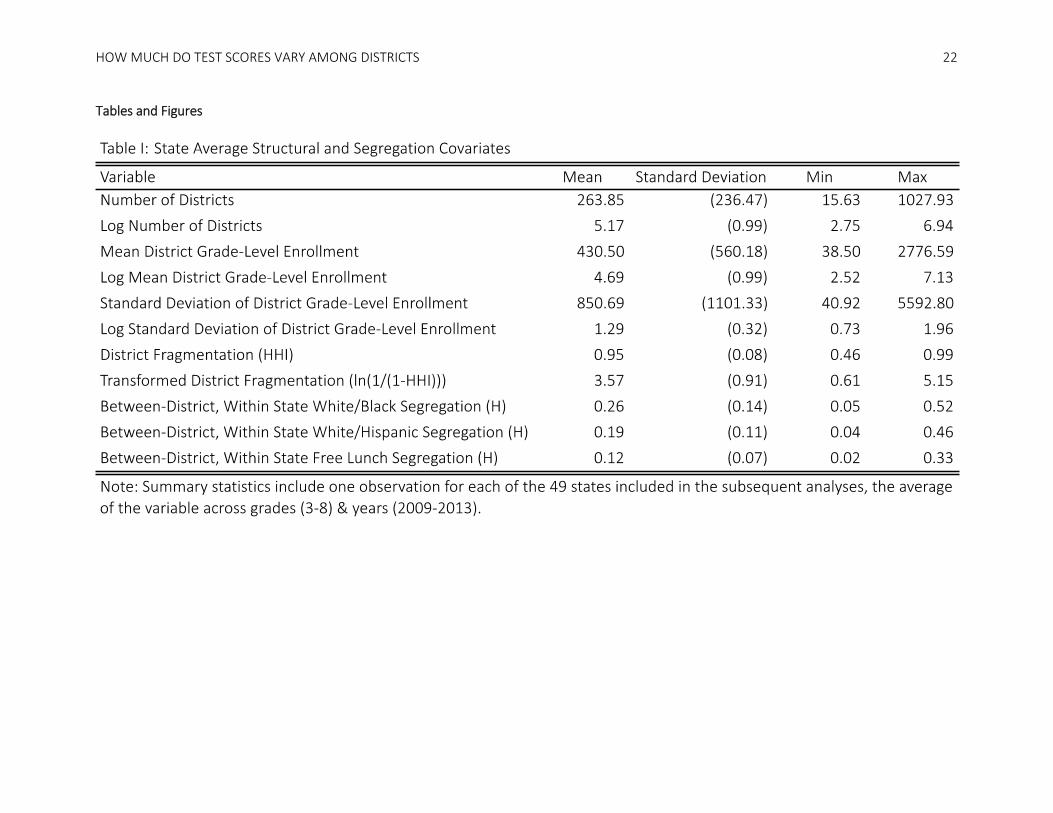
models to improve fit are shown in Table 1.
[Table 1]
Table 1 shows significant variation in the structure of school districts across states. Specifically,
states range from having approximately 15 school districts (Delaware) to over 1,000 school districts
(Texas), with an average of approximately 264 school districts. Correspondingly, the mean grade-level
enrollment and standard deviation of grade-level enrollment vary quite significantly across states with
some states having all small districts, others having all large districts, and the rest having a mix of both.
The HHI ranges from approximately 0.46 (in Nebraska) to 0.99 (in a number of states); however, most
7 The district fragmentation can be interpreted as the probability that two randomly chosen students in a state are enrolled in different school districts. For state , grade , and year , it is defined as: =∑ 1 −∈ , where and are number of students in a given grade ( ) and year ( ) enrolled in
district or state , respectively. 8 Data files can be found on the CCD data page of the CCD website: http://nces.ed.gov/ccd/ccddata.asp. 9 9 In our regression models we use the natural logarithm of the number, average size, and standard deviation of
enrollment variables. Additionally, we use a transformation of the fragmentation measure: ln . All variables are transformed prior to averaging over grades and years. These transformations improve model fit. Nonetheless, our results are substantively unchanged if we use the untransformed measures.
HOW MUCH DO TEST SCORES VARY AMONG DISTRICTS
11
states have a value above 0.90, reflecting that for almost all states the probability that two randomly
selected students are enrolled in different school districts is very high. For the segregation measures, the
ranges indicate that in some states there is very little between-district racial and economic segregation
(minimum values of each statistic ≤ 0.05), where as in others there is quite dramatic between-district
white-black segregation (maximum value = 0.52), white-Hispanic segregation (maximum value = 0.46) and
economic segregation (maximum values = 0.33). The maximum values near 0.5 indicate that on average,
each district has only half the diversity of the population as a whole, where as the minimum values less
than 0.05 indicate that on average, districts are at least 95% as diverse as the population as a whole.
Generally states with more racial segregation have more economic segregation (pairwise correlations of
0.68 – 0.82) and states with more white-black segregation have more white-Hispanic segregation
(correlation of 0.71). Delaware and Wyoming are among the least segregated states, with little
segregation by race or income (all three segregation measures < 0.08 for both states). Among the most
racially and economically segregated states are New Jersey, Illinois, and New York (white-black
segregation > 0.43; white-Hispanic segregation > 0.41; economic segregation > 0.24).
Models
The data consist of 2,890 estimated ICCs, nested in 49 states and varying across grades, years,
and test subjects. To accommodate the nested data structure, and to take into account the variable
sampling variance in the estimated ICCs, we fit precision-weighted random coefficients models to
estimate the parameters of interest of this form (one model for each test subject):
HOW MUCH DO TEST SCORES VARY AMONG DISTRICTS
12
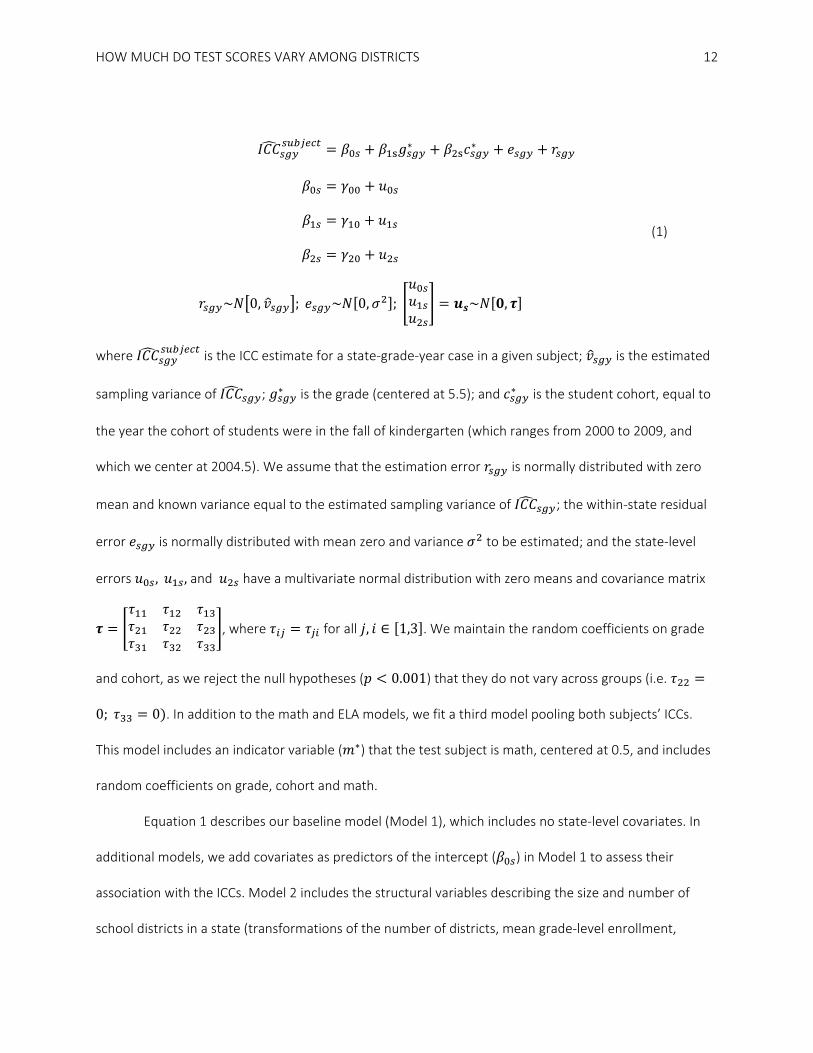
= + ∗ + ∗ + + = + = + = +
~ 0, ; ~ 0, ; = ~ ,
(1)
where is the ICC estimate for a state-grade-year case in a given subject; is the estimated
sampling variance of ; ∗ is the grade (centered at 5.5); and ∗ is the student cohort, equal to
the year the cohort of students were in the fall of kindergarten (which ranges from 2000 to 2009, and
which we center at 2004.5). We assume that the estimation error is normally distributed with zero
mean and known variance equal to the estimated sampling variance of ; the within-state residual
error is normally distributed with mean zero and variance to be estimated; and the state-level
errors , , and have a multivariate normal distribution with zero means and covariance matrix
= , where = for all , ∈ 1,3 . We maintain the random coefficients on grade
and cohort, as we reject the null hypotheses ( < 0.001) that they do not vary across groups (i.e. =0; = 0). In addition to the math and ELA models, we fit a third model pooling both subjects’ ICCs.
This model includes an indicator variable ( ∗) that the test subject is math, centered at 0.5, and includes
random coefficients on grade, cohort and math.
Equation 1 describes our baseline model (Model 1), which includes no state-level covariates. In
additional models, we add covariates as predictors of the intercept ( ) in Model 1 to assess their
association with the ICCs. Model 2 includes the structural variables describing the size and number of
school districts in a state (transformations of the number of districts, mean grade-level enrollment,
HOW MUCH DO TEST SCORES VARY AMONG DISTRICTS
13
standard deviation of grade-level enrollment, and district fragmentation). Model 3 adds three segregation
measures: white-black segregation, white-Hispanic segregation, and free lunch segregation.
Our final four models assess whether these two sets of covariates are associated with growth in
ICCs from third through eighth grade or with growth in the ICCs across cohorts. Using Model 3 as our
baseline, we add the structural covariates as predictors of the grade slope ( ) (Model 4), and then add
the segregation measures (Model 5). The coefficients on the interactions of the segregation variables and
the grade variable indicate the association of segregation with changes in ICCs as cohorts progress
through school. Similarly, we add the same two sets of covariates sequentially to Model 3 as predictors of
the cohort slope ( ) in Models 6 and 7. The coefficients on the interactions of the segregation variables
and the cohort variable indicate the association of segregation with changes in ICCs across cohorts.
Results
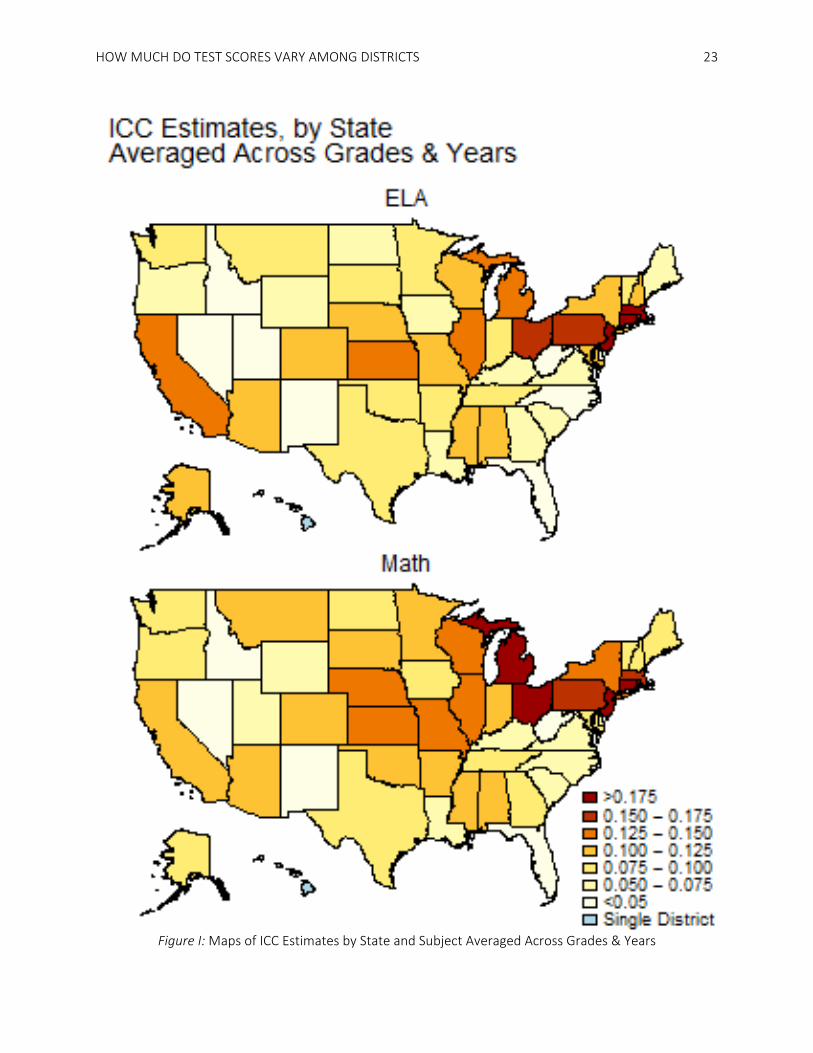
On average, between-district ICCs vary significantly across the U.S. Figure 1 maps the estimated
average between-district ICC in each subject. These are the Empirical Bayes estimates from Model 1
(though because the reliability of the estimates is over 0.99, there is virtually no shrinkage in these
estimates). The ICCs range from near zero (0.008 in ELA, 0.012 in math) to 0.225 in ELA and 0.230 in
math. An ICC of 0 implies that all test score variation is within districts (all districts have the same average
test score); whereas an ICC of 0.2 means that one fifth of the total within-state variance in test scores is
due to between-district differences. This is a relatively large ICC. In such a case, the population-weighted
average between-district variance is one-quarter the population-weighted within-district variance (put
differently, the district means have a population-weighted standard deviation that is half as large as the
average within-district standard deviation of scores).
[Figure 1]
A comparison of the two maps demonstrates that the ICCs are generally larger in math than in

HOW MUCH DO TEST SCORES VARY AMONG DISTRICTS
14
ELA. This difference is quantified by the joint-subject baseline model in Table 2. Specifically, the joint-
subject Model 1 results show that ICCs in math are approximately 13% larger that ICCs in ELA. However,
despite this difference in magnitude, the correlation between the math and ELA ICCs is 0.937, which
means that states with higher between-district variability in math also have higher between-district
variability in ELA. This high correlation suggests that the factors that generate more between-district
variability within a state are not-subject specific. The larger ICCs in math, however, may indicate that
mathematics test scores may be more sensitive than ELA scores to such factors.10
Each of the baseline models (Model 1) further provides clear evidence that the ICC increases over
grades. The positive growth over grades in both subjects suggests that the factors leading to between-
district variation in test scores compound over time. Moreover, the rate of increase varies across states.
Some states exhibit negative subject-specific growth rates over grades (e.g., Illinois has the lowest growth
rates in both subjects, equal to -0.0059 in ELA and -0.0039 in math) to large positive grade slopes (e.g.,
Kansas has the highest growth rates in both subjects, equal to 0.013 in ELA and 0.021 in math). The
average increase per grade is approximately 0.0048, so over the six grades in our sample the ICC
increases by about 0.029 or 29% of the average ICC. There is a notably higher rate of growth in math
(0.0062 per grade) than in ELA (0.0036 per grade). Together with the evidence that ICCs are larger in
math than in ELA, this supports the hypothesis that test scores in mathematics may be more responsive
to factors that generate between-district variability within a state. Evidence from prior research finds that
educational interventions more often yield larger effects on test scores in mathematics than in ELA (e.g.,
Decker, Mayer & Glaserman, 2004; Dobbie & Fryer, 2011; Jacob, 2005; Rockoff, 2004). Therefore, it may
be that exposure to differential resources, particularly in the school context, may generate larger
variability in mathematics test scores relative to ELA that also compounds more quickly over time.
10 Note that the larger math ICCs are not a function of greater reliability of math tests, since the reliability of state math tests and ELA tests do not differ appreciably and we adjust for reliability.
HOW MUCH DO TEST SCORES VARY AMONG DISTRICTS
15
Finally, for both math and ELA, Model 1 indicates that ICCs have increased among recent cohorts.
The average increase in the ICC over the ten cohorts in our sample is about 0.016, which is approximately
16% of the average ICC. Again, the slopes are slightly larger in math than in reading (0.0018 vs. 0.0013)
and the trend varies across states. In ELA, the cohort slopes range from -0.0041 (Kentucky) to 0.0072 per
year (Pennsylvania) and, in math, from -0.0067 (Nebraska) to 0.011 per year (Pennsylvania).
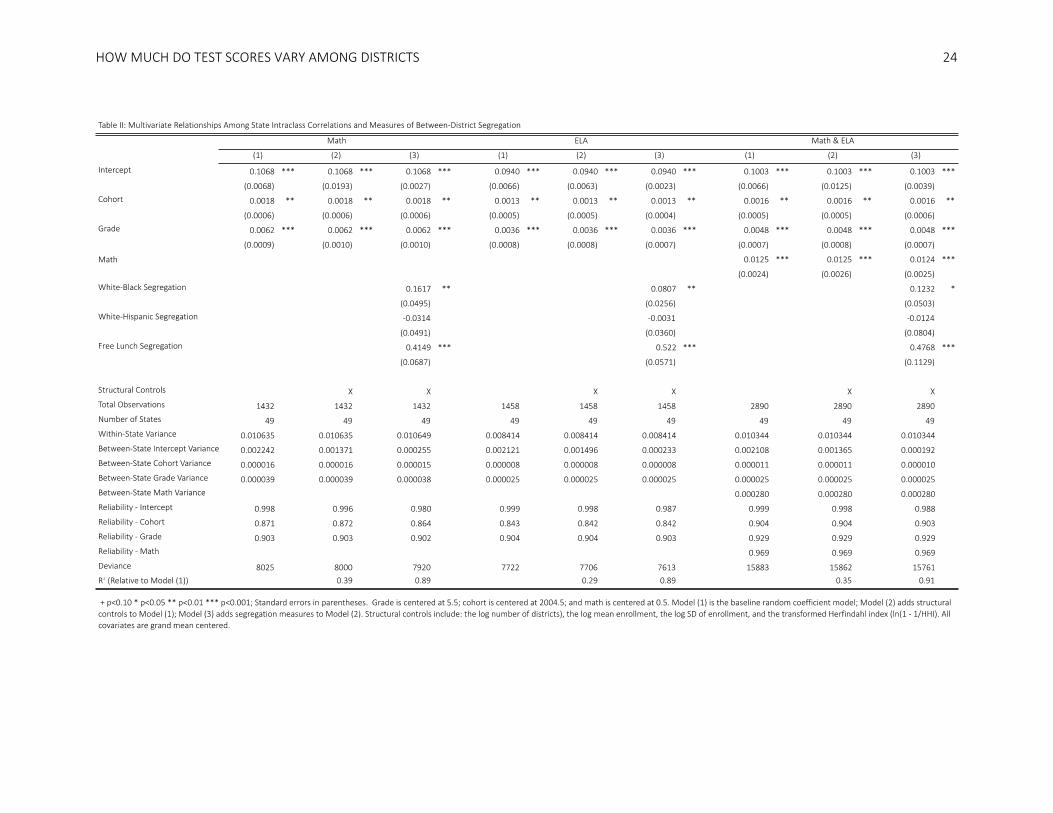
[Table 2]
In all subjects, Model 2 shows that adding controls for structural differences in district size and
enrollment across states explains approximately one third of the variation in the ICCs across states (29-
39% depending on the subject). Although Table 2 does not include estimates of the coefficients on the
structural variables in the interest of space, the coefficients generally indicate the there is more between-
district variance in test scores in states with highly-fragmented school systems, in which there are many
small districts.
The association between the size and number of school districts and the ICC may be due in part
to fact that the structure of districts is correlated with residential segregation between-district districts,
which may in turn shape patterns of between-district variation in achievement. States with few, large
districts generally have lower levels of between-district segregation than states with many small districts:
the number of districts in a state is correlated with both racial between-district segregation (correlation
of 0.59 for white-black segregation; correlation of 0.56 for white-Hispanic segregation) and segregation
by free lunch eligibility (correlation of 0.51).
Adding the segregation measures to the models explains most of the remaining variance in the
intercepts among states. Model 3 shows that 89-91% of the between-state variance is explained when
including both the structural and segregation measures. Notably if we exclude the structural covariates
(models not shown), the segregation measures alone still explain 84-87% of the variance suggesting that
segregation is the key factor in explaining variance in the ICCs among states. Across all models, free lunch
HOW MUCH DO TEST SCORES VARY AMONG DISTRICTS
16
segregation and white-black segregation are both significant predictors of the ICCs; white-Hispanic
segregation is not. The coefficient on free-lunch segregation is four times larger than the coefficient on
white-black segregation (0.48 vs 0.12 in the pooled subject model), indicating that between-district
socioeconomic segregation may be a much more important driver of between-district test score variation
than is racial segregation.
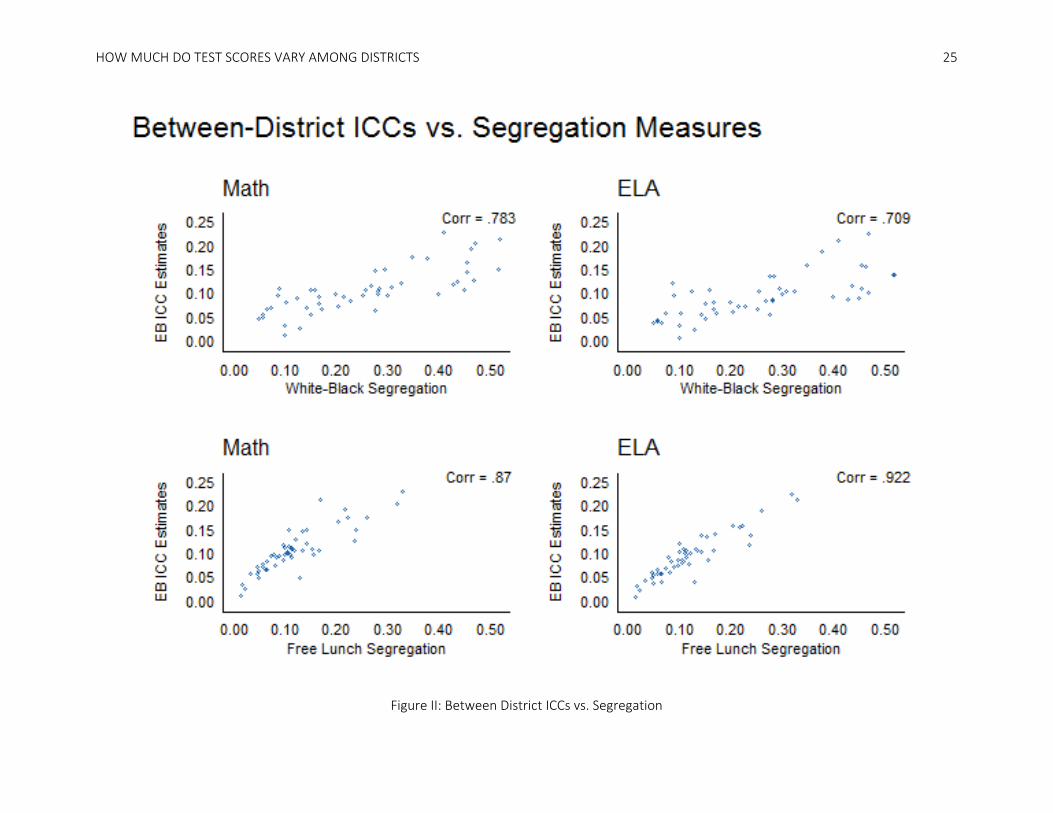
Figure 2 plots the ICCs against the state-average white-black and free lunch segregation to
visually demonstrate the bivariate relationship between the ICCs and the two segregation measures. The
correlations of white-black segregation with math and ELA ICCs are 0.78 and 0.71, respectively, while the
correlations of free-lunch segregation and ICCS are even higher: 0.87 and 0.92, respectively. These strong
correlations make clear that segregation is closely associated with the amount of between-district
variation in the average student test scores among states.
[Figure 2]
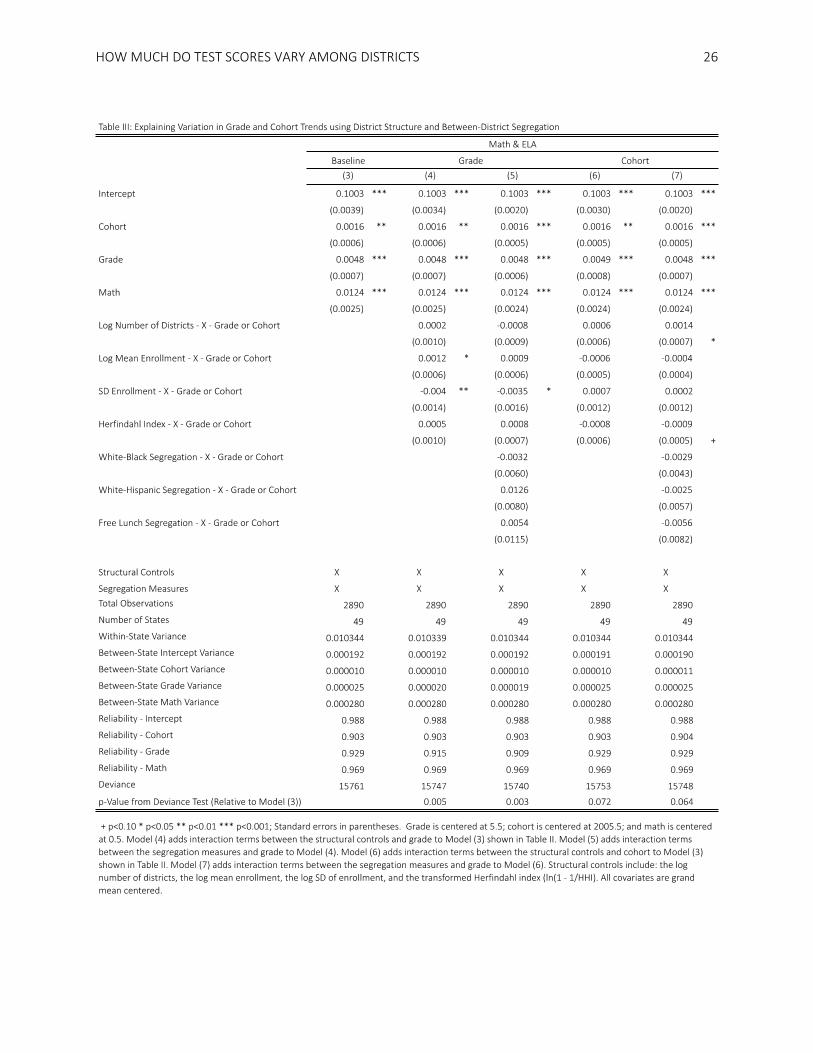
Our last analysis investigates the association between segregation and the rate at which the ICC
changes across grades and across cohorts. Table 2 shows that the rate of change of the ICC from grade 3
to 8 is positive on average, but varies significantly among states. We hypothesized that in states with
more segregation the compounding effects of differential exposure to resources may be larger than in
less segregated states because the contrast in resources among districts is likely starker. The regression
estimates in Table 3, however, do not support this hypothesis. None of the segregation measures are
significantly associated with the growth rate of the ICCs. Only a modest fraction (24%) of the variance in
the grade slope is explained with the addition of the covariate interaction terms in Table 3 (this can be
seen by comparing Model 5 to Model 3), indicating that factors other than segregation play an important
role in shaping changes over grades in between-district academic performance.
[Table 3]
We perform a similar analysis to determine whether or not these covariates explain any of the

HOW MUCH DO TEST SCORES VARY AMONG DISTRICTS
17
variance in the cohort slopes across states. The parallel models (Models 6 & 7) show that these variables
do not explain any of the between-state variation in cohort slopes. In other words, although free lunch
and white-black segregation explain much of the initial differences in the size of the ICCs across states,
places with higher free lunch and white-black segregation levels do not appear to have systematically
higher growth in the ICCs from grades 3 to 8 or higher growth in the ICCs from earlier to later cohorts.
Discussion
In this paper we conduct the first comprehensive analysis of between-district variation in
academic performance. Among the 49 states in our study, the between-district proportion of test score
variance ranges from near zero (indicating no average difference in average test scores among districts)
to 0.23 (indicating that average performance differs considerably among districts). In addition, the data
show the between-district test score variation is, on average, 29% greater in 8th grade than 3rd grade; and
is on average 16% greater for cohorts entering kindergarten in 2009 than in 2000.
This description of between-district test score variation may be useful in several ways. It provides
information about the extent to which low-performing students are concentrated in a small number of
school districts, and so may be useful for designing school finance systems and determining how
resources should be distributed among school districts. Moreover, knowledge of ICCs can be useful in
power analyses needed to design studies of educational interventions and processes.
Data on the extent of between-district test score variation is further necessary for understanding
its causes and consequences. Our analyses show that roughly 90% of the variation in the ICC among
states can be accounted for by patterns of between-district white-black and economic segregation and
structural characteristics of school districts (number, enrollment, and concentration of students). States
with high levels of white-black and economic segregation have, on average, more between-district
variation; this relationship is particularly strong for economic segregation. Segregation levels are not
HOW MUCH DO TEST SCORES VARY AMONG DISTRICTS
18
associated with the rate at which the ICC grows from grade 3 to 8 or across cohorts, however, indicating
that segregation alone does not explain why between-district test score variation grows faster in some
states than others.
Why is segregation so strongly associated with the between-district variation in test scores? One
obvious explanation is that family background and neighborhood conditions exert a strong influence on
academic performance—particularly on the development of academic skills in early childhood and
elementary school. This would lead to higher average performance in affluent school districts than in
poorer ones, and therefore to more test score variation between districts when the between-district
socioeconomic dispersion is wider. The other obvious explanation is that school quality may be correlated
with local socioeconomic and racial composition. If the schools in poor and predominantly black and
Hispanic school districts are inferior, on average, to those in affluent and predominantly white districts,
this would also lead to the correlation between segregation and between-district test score variation that
the data reveal.
Because we have no direct measures of school district quality or measures of the ICC at the start
of formal schooling, our analyses here cannot distinguish the relative importance of the two potential
explanations. Moreover, the two explanations are likely not fully separable in practice. If local
socioeconomic conditions shape school quality—because affluent districts are able to marshal more
economic, social, and political resources and to attract and retain more skilled teachers and staff—then a
key channel through which local socioeconomic conditions shape educational outcomes is through their
effects on school quality. Identifying the aspects of school quality that drive between-district variation in
academic success—and learning how to improve schools in low-income communities—is therefore
essential for reducing educational inequality.
HOW MUCH DO TEST SCORES VARY AMONG DISTRICTS
19
References
Bayer, P., Ferreira, F., McMillan, R., Bajari, P., Berry, S., Black, S., … Staiger, D. (2004). Tiebout Sorting,
Social Multipliers and the Demand for School Quality. National Bureau of Economic Research
Working Paper Series, 10871(203). http://doi.org/10.3386/w10871
Bayer, P., Ferreira, F., & McMillan, R. (2007). A Unified Framework for Measuring Preferences for Schools
and Neighborhoods. Journal of Political Economy, 115(4), 588–638.
http://doi.org/10.1086/522381
Bischoff, K. (2008). School District Fragmentation and Racial Residential Segregation: How Do Boundaries
Matter? Urban Affairs Review, 44(2), 182–217. http://doi.org/10.1177/1078087408320651
Decker, Paul, Daniel Mayer and Steven Glaserman (2004) “The Effects of Teach for America on Students:
Findings from a National Evaluation.” Mathematica Policy Research Report No. 8792-750, June 9,
2004.
Dobbie, W., & Fryer, R. G. (2011). Are high-quality schools enough to increase achievement among the
poor? Evidence from the Harlem Children’s Zone. American Economic Journal: Applied
Economics, 3(3), 158–187. http://doi.org/10.1257/app.3.3.158
Hedges, L. V. (2007). Effect Sizes in Cluster-Randomized Designs. Journal of Educational and Behavioral
Statistics, 32(4), 341–370. http://doi.org/10.3102/1076998606298043
Hedges, L. V., & Hedberg, E. C. (2007). Intraclass Correlation Values for Planning Group-Randomized Trials
in Education. Educational Evaluation and Policy Analysis, 29(1), 60–87.
doi:10.3102/0162373707299706
Hedges, L. V., & Hedberg, E. C. (2014). Intraclass Correlations and Covariate Outcome Correlations for
Planning Two- and Three-Level Cluster-Randomized Experiments in Education. Evaluation Review,
37(6), 445–489. http://doi.org/10.1177/0193841X14529126
Herfindahl, O. C. (1950). Concentration in the U.S. Steel Industry. Unpublished Doctoral Dissertation.
HOW MUCH DO TEST SCORES VARY AMONG DISTRICTS
20
Columbia University.
Hirschman, A. O. (1945). National Power and the Structure of Foreign Trade. Los Angeles: University of
California Press.
Hirschman, A. O. (1964). The Paternity of an Index. The American Economic Review, 54(5), 761.
Jacob, Brian (2005) “Accountability, Incentives and Behavior: Evidence from School Reform in Chicago.”
Journal of Public Economics, 89(5-6): 761-796.
Jacob, R., Zhu, P., & Bloom, H. (2010). New empirical evidence for the design of group randomized trials in
education. Journal of Research on Educational Effectiveness, 3(2), 157–198.
http://doi.org/10.1080/19345741003592428Massey, D. S., & Denton, N. A. (1988). The
Dimensions of Residential Segregation. Social Forces, 67(2), 281. http://doi.org/10.2307/2579183
Owens, A. (2016). Inequality in Children’s Contexts: The Economic Segregation of Households With and
Without Children. American Sociological Review, 81(3), 1–26.
http://doi.org/10.1177/0003122416642430
Raudenbush, S. W., Martinez, a., & Spybrook, J. (2007). Strategies for Improving Precision in Group-
Randomized Experiments. Educational Evaluation and Policy Analysis, 29(1), 5–29.
http://doi.org/10.3102/0162373707299460
Reardon, S. F., & Ho, A. D. (2015). Practical Issues in Estimating Achievement Gaps From Coarsened Data.
Journal of Educational and Behavioral Statistics (Vol. 40).
http://doi.org/10.3102/1076998615570944
Reardon, S. F., Shear B. R., Castellano, K. E., & Ho A. D. (forthcoming). Using Heteroskedastic Ordered
Probit Models to Recover Moments of Continuous Test Score Distributions from Coarsened Data.
Working paper. Journal of Educational and Behavioral Statistics.
Rockoff, Jonah E. (2004) “The Impact of Individual Teachers on Student Achievement: Evidence from
Panel Data.” American Economic Review, 94(2): 247–252.
HOW MUCH DO TEST SCORES VARY AMONG DISTRICTS
21
Schochet, P. Z. (2008). Statistical Power for Random Assignment Evaluations of Education Programs.
Journal of Educational and Behavioral Statistics, 33(1), 62–87.
http://doi.org/10.3102/1076998607302714
Shear, B. & Reardon, S.F. (2016). HETOP: Stata module for estimating heteroskedastic ordered probit
models with ordered frequency data. Available at
https://ideas.repec.org/c/boc/bocode/s458287.html
Theil, H. & Finezza, A. J. 1971. "A Note on the Measurement of Racial Integration of Schools by Means of
Informational Concepts." Journal of Mathematical Sociology 1:187-94.
Tiebout, Charles M., (1956), “A Pure Theory of Local Expenditures,” Journal of Political Economy, 64: 416-
424.
Williams, R. (2010). Fitting heterogeneous choice models with oglm. The Stata Journal, 10(4), 540–567.
HOW MUCH DO TEST SCORES VARY AMONG DISTRICTS
22
Tables and Figures
HOW MUCH DO TEST SCORES VARY AMONG DISTRICTS
23
Figure I: Maps of ICC Estimates by State and Subject Averaged Across Grades & Years
HOW MUCH DO TEST SCORES VARY AMONG DISTRICTS
24
HOW MUCH DO TEST SCORES VARY AMONG DISTRICTS
25
Figure II: Between District ICCs vs. Segregation
HOW MUCH DO TEST SCORES VARY AMONG DISTRICTS
26