CEPA Working Paper No. 17-07
47
Long-Term Trends in Private School Enrollments by Family Income We use data from multiple national surveys to describe trends in private elementary school enrollment by family income from 1968-2013. We find several important trends. First, the private school enrollment rate of middle-income families declined substantially over the last five decades, while that of high-income families remained quite stable. Second, there are notable differences in private school enrollment trends by race/ethnicity, urbanicity, and region of the country. Although racial/ethnic differences in private school enrollment are to a large extent explained by income differences, the urban/suburban and regional differences in private school enrollment patterns are large even among families with similar incomes. Factors contributing to these patterns may include trends in income inequality, private school costs and availability, and the perceived relative quality of local schooling options. ABSTRACT AUTHORS VERSION December 2017 Suggested citation: Murnane, R.J., & Reardon, S.F. (2017). Long-Term Trends in Private School Enrollments by Family Income (CEPA Working Paper No.17-07). Retrieved from Stanford Center for Education Policy Analysis: http://cepa.stanford.edu/wp17-07 CEPA Working Paper No. 17-07 Richard J. Murnane Harvard University Sean F. Reardon Stanford University Acknowledgements: Many people and organizations provided information and support for this project. They include the Russell Sage Foundation, which provided a research grant. Robert Hauser and Rob Warren provided data files from the October CPS for the years 1968-2005 that they had cleaned and organized. These supplemented October CPS files that we purchased from Unicon. Kurt Bauman of the U.S. Census Bureau, and Sarah Grady and Stephen Broughman of the U.S. Department of Education answered many questions about properties of particular datasets. Dale McDonald, PBVM, PhD, the Director of Public Policy and Educational Research for the National Catholic Educational Association provided information on enrollment trends in NCEA schools. Sarah Lubienski explained definitions of school types used in her research. Sabino Kornrich provided data from his research. Joshua Starr answered questions about the Phi Delta Kappan polls of attitudes toward schools. Kurt Bauman, Greg Duncan, Christopher Jencks, Ann Owens, and Tim Smeeding provided comments on earlier drafts. Anne Lamb, Bonnie Mackintosh, Preeya Mbekeani, Mallory Perry, and Marcus Waldman provided excellent research assistance.
Transcript of CEPA Working Paper No. 17-07

Long-Term Trends in Private School Enrollments by Family Income
We use data from multiple national surveys to describe trends in private elementary school
enrollment by family income from 1968-2013. We find several important trends. First, the
private school enrollment rate of middle-income families declined substantially over the last
five decades, while that of high-income families remained quite stable. Second, there are
notable differences in private school enrollment trends by race/ethnicity, urbanicity, and
region of the country. Although racial/ethnic differences in private school enrollment are to a
large extent explained by income differences, the urban/suburban and regional differences in
private school enrollment patterns are large even among families with similar incomes.
Factors contributing to these patterns may include trends in income inequality, private school
costs and availability, and the perceived relative quality of local schooling options.
ABSTRACTAUTHORS
VERSION
December 2017
Suggested citation: Murnane, R.J., & Reardon, S.F. (2017). Long-Term Trends in Private School Enrollments by Family Income (CEPA Working Paper No.17-07). Retrieved from Stanford Center for Education Policy Analysis: http://cepa.stanford.edu/wp17-07
CEPA Working Paper No. 17-07
Richard J. MurnaneHarvard University
Sean F. ReardonStanford University
Acknowledgements: Many people and organizations provided information and support for this project. They include the Russell Sage Foundation, which provided a research grant. Robert Hauser and Rob Warren provided data files from the October CPS for the years 1968-2005 that they had cleaned and organized. These supplemented October CPS files that we purchased from Unicon. Kurt Bauman of the U.S. Census Bureau, and Sarah Grady and Stephen Broughman of the U.S. Department of Education answered many questions about properties of particular datasets. Dale McDonald, PBVM, PhD, the Director of Public Policy and Educational Research for the National Catholic Educational Association provided information on enrollment trends in NCEA schools. Sarah Lubienski explained definitions of school types used in her research. Sabino Kornrich provided data from his research. Joshua Starr answered questions about the Phi Delta Kappan polls of attitudes toward schools. Kurt Bauman, Greg Duncan, Christopher Jencks, Ann Owens, and Tim Smeeding provided comments on earlier drafts. Anne Lamb, Bonnie Mackintosh, Preeya Mbekeani, Mallory Perry, and Marcus Waldman provided excellent research assistance.

1
Long-Term Trends in Private School Enrollments by Family Income
Richard J. Murnane* and Sean F. Reardon**
December, 2017
Forthcoming, AERA Open
*Harvard University ([email protected])
**Stanford University ([email protected])
Many people and organizations provided information and support for this project. They include the Russell Sage Foundation, which provided a research grant. Robert Hauser and Rob Warren provided data files from the October CPS for the years 1968-2005 that they had cleaned and organized. These supplemented October CPS files that we purchased from Unicon. Kurt Bauman of the U.S. Census Bureau, and Sarah Grady and Stephen Broughman of the U.S. Department of Education answered many questions about properties of particular datasets. Dale McDonald, PBVM, PhD, the Director of Public Policy and Educational Research for the National Catholic Educational Association provided information on enrollment and staffing trends in NCEA schools. Sarah Lubienski explained definitions of school types used in her research. Sabino Kornrich provided data from his research. Joshua Starr answered questions about the Phi Delta Kappan polls of attitudes toward schools. Henry Braun, Kurt Bauman, Greg Duncan, Christopher Jencks, Ann Owens, and Tim Smeeding provided comments on earlier drafts. Anne Lamb, Bonnie Mackintosh, Preeya Mbekeani, Mallory Perry, and Marcus Waldman provided excellent research assistance.

2
Long-Term Trends in Private School Enrollments by Family Income
Abstract
We use data from multiple national surveys to describe trends in private elementary school enrollment by
family income from 1968-2013. We find several important trends. First, the private school enrollment
rate of middle-income families declined substantially over the last five decades, while that of high-income
families remained quite stable. Second, there are notable differences in private school enrollment trends
by race/ethnicity, urbanicity, and region of the country. Although racial/ethnic differences in private
school enrollment are to a large extent explained by income differences, the urban/suburban and
regional differences in private school enrollment patterns are large even among families with similar
incomes. Factors contributing to these patterns may include trends in income inequality, private school
costs and availability, and the perceived relative quality of local schooling options.
Keywords: Educational Inequality, Income Inequality, Private Schools

3
Long-Term Trends in Private School Enrollments by Family Income
Introduction
Family income inequality in the U.S. has risen sharply in the last few decades (Stone et al., 2016).
One of the consequences of this has been rising residential segregation – affluent families, especially
those with school-aged children, increasingly live in different communities than lower-income families
(Reardon and Bischoff, 2011; Owens, 2016). Since most children attend a public school close to their
home, this has resulted in increased segregation of public schools by income (Owens, Reardon, and
Jencks, 2016). This, in turn, contributes to inequality in educational outcomes through at least three
mechanisms: peer effects, student mobility effects, and teacher quality effects (Duncan and Murnane,
2014).
Rising inequality may also have led to increasing economic segregation between public and
private schools. There is, however, surprisingly little information about whether this has happened. This
paper seeks to close this knowledge gap by describing trends over the last several decades in private
school enrollment rates by children from high-, median- and low-income families.
Background and Context
Parents send their children to private elementary schools for many reasons. In 2007, 31 percent
reported that they did so to obtain a better academic program than that offered by available public
schools. Thirty-six percent reported that they wanted their child’s school to provide instruction in a
particular religion or value system. Eight percent reported that they wanted a small school, and four
percent reported that they wanted a safer environment or better discipline than available public schools
provided.1
The effects of growing income inequality on patterns of private school enrollment are unclear. As

4
families have become more aware of the remarkably high recent labor market payoffs to educational
attainments, and as private school tuitions have risen, private schooling may be one more way that high-
income families seek to give their children an advantage in preparing for post-secondary education. With
increasing wealth and income, relatively affluent families are increasingly able to afford the high tuitions
that most nonsectarian and some religious private schools charge. They may also increasingly want to
substitute payment of private school tuitions for the time they would otherwise spend in monitoring their
child’s experiences in public schools.
On the other hand, increasing residential and school segregation by income may obviate the
need to seek educational advantage through private schooling. In many states, the size of the local per-
student property tax base is a strong predictor of school district spending. Buying into suburban
communities with high housing prices typically provides access to public schools perceived to be of high-
quality and to a variety of real or perceived amenities associated with having affluent neighbors. Since
interest on mortgage payments is deductible from income in computing federal income tax liability, while
private school tuitions are not, residential moves may have financial advantages over sending children to
private schools.
There are three groups of families for which increasing income inequality may have had an
especially large impact on private school enrollment rates. The first are black and Hispanic families.
Reardon and Bischoff (2011) show that the increase in residential segregation by income was greater
among black families than among white families over the last three decades. Nonetheless, affluent black
and Hispanic families still live in much lower-income neighborhoods than equally affluent white families
(Pattillo, 2013; Reardon, Fox, & Townsend, 2015; Sharkey, 2014). This may lead a larger percentage of
affluent black and Hispanic families to choose private schools for their children than equally affluent
white families.
The second group are families living in cities. Many urban public schools struggle as they serve

5
increasingly low-income student populations. Affluent families that choose to live in cities may find
private schools an increasingly attractive educational option for their children.
The third are families living in the South. School districts in most southern states are
geographically large. Consequently, it is more difficult for affluent families to purchase high-quality public
schooling for their child by moving to a school district with high housing prices than it is in parts of the
country in which school districts are geographically small.
Given that less than 10 percent of American children attend a private elementary or secondary
school, why should we care if gaps by family income in private school enrollment rates have grown? One
reason is that if the private schools affluent families choose for their children provide a better education
than the schools available to children from lower-income families, these choices pass on economic
advantage to the next generation, and undercut the potential for intergenerational economic mobility.
Even if the instruction in the private schools that affluent parents choose is not better than that which
public schools provide, the opportunity to build relationships with children from other affluent, well-
connected families may confer long-term economic advantage.
Another reason to care about trends in private school enrollments by family income is that well-
educated affluent parents that send their children to private schools may be less interested in devoting
their time and their political and social capital to advocating for better public schools.2
Finally, the mix of private schools in the United States has changed dramatically over the last half
century. These changes, which we describe below, may have altered the role of private schools in
educating children from different parts of the family income distribution.
Research Design
Datasets
The ideal dataset for answering our research questions would provide detailed information on

6
the family incomes, demographic characteristics, residential locations, and elementary schooling choices
of large representative samples of American children for every year over the last five decades. For
children who attended a private school, the dataset would indicate whether the school was Catholic,
affiliated with another religion, or nonsectarian. It would also indicate the annual “sticker price”
(published tuition and fees) each private school charged, the net annual cost that individual families paid,
and the average amount the school spent each year in educating each student.3
Unfortunately, no such ideal dataset exists. This led us to use many nationally representative
datasets, each of which contains information useful in addressing some of our questions. In describing
the years for which particular datasets provide information on private elementary school enrollments, we
use the calendar year pertaining to the beginning of the school year. The datasets include:
- 46 October Current Population Surveys (CPS), including education supplements, each providing
information on a nationally representative sample of American households for one of the years
from 1968-2013;
- 4 IPUMS datasets, each providing information on a nationally representative sample of
households from one of the decennial Censuses of Population from 1969-1999;
- 8 National Household Education Surveys (NHES), each of which provides information on a
nationally representative sample of children enrolled in U.S schools in a particular year, between
1992 and 2013;
- 3 NCES longitudinal datasets, each of which tracks over time a nationally representative sample
of children in elementary school;
- 13 Private School Universe Surveys (PSS), each of which provides information on almost all
private elementary and secondary schools in operation in the U.S. during a particular year, from
1989 to 2013.
- 6 surveys conducted for Phi Delta Kappan, each of which provides information on the attitudes

7
toward local public schools of a nationally representative sample of adults for one of the years
from 1982 to 1992.
We provide information on the characteristics of these datasets in the online appendix.
Samples
The CPS and Census survey households. Since our research questions concern the elementary
schooling choices of families, we created samples from these datasets that included all children enrolled
in any grade from 1-8 in a public or private school. For ease of exposition, we refer to these as the
elementary grades. The NCES longitudinal datasets are samples of children enrolled in school. We
included all of the children in these datasets in our analytical samples. The NHES datasets are samples of
children, including children who are home-schooled. Using these datasets, we estimated that the
percentage of children of elementary school age who are home schooled increased from 2.4 percent in
2000 to 3.0 percent in 2006. (Due to a change between 2006 and 2011 in the method of administering
the NHES, the estimate of the home schooling rate from the 2011 survey is not comparable with those
from earlier administrations of the NHES.) To retain comparability with other datasets used in this study,
we constructed analytic samples of NHES participants enrolled in either public or private elementary
schools.
The unit of observation in each of the 13 PSS datasets is a private school. We used the PSS
datasets to track trends in the number of private schools in operation in the U.S. and in the number and
percentage of American children enrolled in particular types of private school. We compared estimates of
enrollment trends based on data from the PSS to those derived from responses to household surveys.
Since 1995, trends in private school enrollments estimated from these data sources have been very
similar.4
Procedures
Preparing the many samples for analysis involved several steps. One was to verify the accuracy of

8
information on key variables in the many data sets. A second was to create standard definitions for all
variables. This was challenging because the questions about demographics, family income, and schooling
choices for children varied among datasets and across years for the same survey. One example concerns
racial and ethnic classifications. Prior to the 1980s, individuals could identify their race only as white,
black, or other. By the late 2000s, there were 25 racial self-identity categories.
Another step in data preparation was dealing with missing data on family income. As explained in
the online appendix, we used multiple imputation with 20 imputed datasets to fill in values of family
income for respondents who did not complete the relevant survey question.
Measures
The variables used in our analyses include type of school attended, family income percentile,
child race/ethnicity, and indicators of residential location.
School type. In the datasets that provide the requisite information (NHES, all NCES longitudinal datasets,
and the 1994 and 1997 CPS), we coded school type as public or as one of three types of private school:
Catholic, other religious, or nonsectarian. Some datasets (CPS 1979, 1985, 1988, and 1991; Census 1969
and 1979) only distinguished church-related private schools (either Catholic or non-Catholic) from
nonsectarian private schools. Others (CPS and Census in other years) only distinguished private schools
from public schools.
Unfortunately, the datasets that provide information on family incomes do not provide
information on trends over time and location in the distribution of private schools. However, the PSS does
provide this information. The PSS also allows us to distinguish conservative Christian schools from other
schools in the non-Catholic religion-affiliated elementary school category, a distinction relevant in
interpreting the evidence we report in the next section.5 Table 1 provides descriptive statistics on the
national distribution of private elementary schools and students in 1989 and 2013. Table 2 provides
information on the distribution of each type of private school and enrolled students by region, locale

9
type, and year.
<Tables 1 and 2 about here>
In 1989, one-third of the nation’s 23,500 private elementary schools were Catholic. These
schools, almost half of which were located in cities, tended to be large relative to other private schools,
with an average of 31 students per grade. In 1989, they served 56 percent of the nation’s private
elementary school students. Twenty-four years later, only 22 percent of the 25,903 private elementary
schools in the United States were Catholic, and they served only 42 percent of private elementary school
students. The decline in the number of students attending Catholic elementary schools in Northeastern
cities was particularly great, with enrollment falling from 282,746 in 1989 to 91,967 in 2013.
In 1989, half of the private elementary schools in the U.S. were associated with a religion other
than Catholicism. One-third of these were conservative Christian schools. Both conservative Christian and
other religion-affiliated elementary schools tended to be small, averaging 12 to 13 students per grade.
Together they served one-third of the private elementary school student population. Over the next 24
years, the number of Conservative Christian elementary schools increased by 9 percent, with growth
concentrated in the South. In 2013, almost half the students attending conservative Christian elementary
schools lived in this region.
In 1989, 16 percent of private elementary schools were nonsectarian and these schools served 10
percent of private elementary school students in the U.S. Over the next 24 years, the number of
nonsectarian private elementary schools increased by almost 60 percent, with growth concentrated in
the Northeast. In 2013, they served 18 percent of the nation’s students enrolled in private elementary
schools.
Family income percentile. Some surveys, such as the Census, asked respondents to report the
individual income for each family member and estimated family income from the sum of the reported
individual incomes. Others asked parents to report into which of 10-18 pre-specified ranges their family

10
income fell. To obtain a metric that was common across years in constructing trends in private school
enrollment rates for children in elementary school, we used the method described in the online appendix
to convert ordinal income categories into percentiles of the national distribution of incomes for families
with children between the ages of 5 and 21 who were enrolled in grades one to eight.
Our original plan was to report trends in private school enrollments by family income percentile
from 1968 to 2015. However, as we explain in the online appendix, CPS-based estimates of private school
enrollment rates by family income for the years 2014 and 2015 are inconsistent with those from the
larger American Community Survey. For that reason, we ended our CPS-based estimates with the year
2013.
Family race/ethnicity. We classified children in our analytic samples as belonging to one of four
mutually exclusive racial/ethnic groups: non-Hispanic white (henceforth white), non-Hispanic black
(henceforth black), Hispanic, or other. In our Findings section below, we describe trends in the private
school enrollment rates of children from different racial/ethnic groups whose families are in the top,
middle, or bottom of the U.S. family income distribution, not the income distribution of families of a
particular race/ethnicity. This is important to keep in mind because the income distributions of black and
Hispanic families lie to the left of the income distribution for white families. For example, in 1969, 2
percent of black children and 4 percent of Hispanic children in elementary school lived in families with
incomes that were in the top 10 percent of the national distribution of incomes of families with children
in elementary school. The comparable figures for 2013 are 3 percent of black children and 4 percent of
Hispanic children. At the other end of the family income spectrum, in 1969, 28 percent of black children
and 16 percent of Hispanic students in elementary school lived in families in the bottom 10 percent of the
national income distribution for all families with children in elementary school. In 2013, the comparable
figures are 20 percent of Black students and 13 percent of Hispanic students.

11
Region. We classified children as living in one of four regions: Northeast, Midwest, South, and
West. Over the half century in which we examined private school enrollment patterns, the geographic
distribution of American elementary school students changed, with the South and West gaining at the
expense of the Northeast and Midwest. In 1969, 23 percent lived in the Northeast; 28 percent lived in the
Midwest; 32 percent in the South; and 17 percent in the West. The comparable percentages for the year
2013 are 16, 22, 38, and 24.
City/Suburb/Rural. Between 1969 and 2013 the distribution of U.S. elementary school students
among three types of locales, cities, suburbs, and rural areas, changed markedly, with suburbs gaining at
the expense of cities and rural areas. In 1969, 30 percent lived in cities, 41 percent lived in suburbs, and
28 percent lived in rural areas. The comparable figures for 2013 are 22, 60, and 18 percent.
Data-Analytic Plan
The details of our analytic methods are described in the online appendix. Here we provide a brief
outline of the methods. We estimate the private school enrollment rate in each year, conditional on a
family’s percentile rank in the income distribution, by fitting a polynomial logit model in which the
outcome is a dichotomous variable assuming a value of 1 if a child in elementary school in the relevant
year attended a private school and zero otherwise. The predictors include a polynomial function of a
family’s percentile rank in the national income distribution of the families of children in elementary
school. Fitting this model provides an estimate of the function that describes the association between the
probability of private school enrollment and family income percentile in a particular school year. Using
this estimated function, we compute the estimated proportion of students enrolled in private school in
the relevant year at the 10th, 50th, and 90th percentiles of the income distribution. We refer to these
family-income percentiles as low, middle (or median), and high.
To estimate private school enrollment rates in each year by race/ethnicity, region, and
urban/suburban location), we fit logit models on the relevant subpopulaton data. To estimate the
12
proportion of students enrolled in different types of private schools in each year, we fit polynomial
multinomial logit models rather than simple logit models.
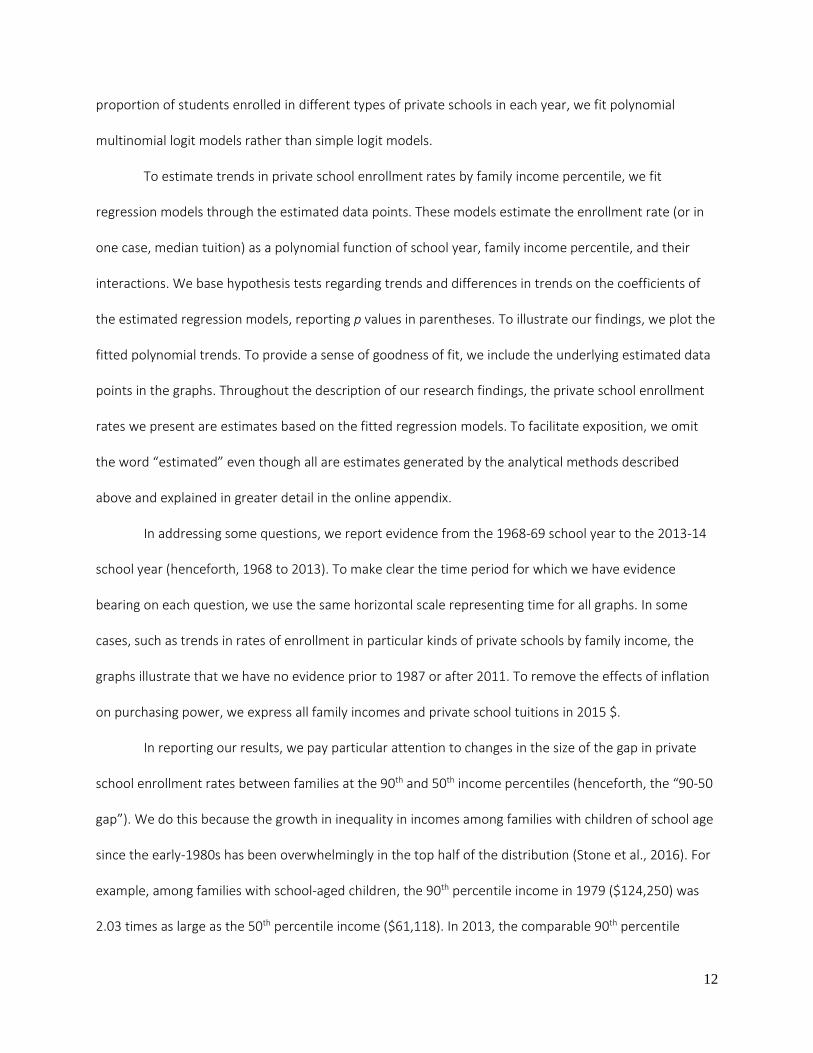
To estimate trends in private school enrollment rates by family income percentile, we fit
regression models through the estimated data points. These models estimate the enrollment rate (or in
one case, median tuition) as a polynomial function of school year, family income percentile, and their
interactions. We base hypothesis tests regarding trends and differences in trends on the coefficients of
the estimated regression models, reporting p values in parentheses. To illustrate our findings, we plot the
fitted polynomial trends. To provide a sense of goodness of fit, we include the underlying estimated data
points in the graphs. Throughout the description of our research findings, the private school enrollment
rates we present are estimates based on the fitted regression models. To facilitate exposition, we omit
the word “estimated” even though all are estimates generated by the analytical methods described
above and explained in greater detail in the online appendix.
In addressing some questions, we report evidence from the 1968-69 school year to the 2013-14
school year (henceforth, 1968 to 2013). To make clear the time period for which we have evidence
bearing on each question, we use the same horizontal scale representing time for all graphs. In some
cases, such as trends in rates of enrollment in particular kinds of private schools by family income, the
graphs illustrate that we have no evidence prior to 1987 or after 2011. To remove the effects of inflation
on purchasing power, we express all family incomes and private school tuitions in 2015 $.
In reporting our results, we pay particular attention to changes in the size of the gap in private
school enrollment rates between families at the 90th and 50th income percentiles (henceforth, the “90-50
gap”). We do this because the growth in inequality in incomes among families with children of school age
since the early-1980s has been overwhelmingly in the top half of the distribution (Stone et al., 2016). For
example, among families with school-aged children, the 90th percentile income in 1979 ($124,250) was
2.03 times as large as the 50th percentile income ($61,118). In 2013, the comparable 90th percentile

13
income ($183,959) was 2.70 times as large as the 50th percentile income ($68,256).6 We report p values
in parentheses from tests of null hypotheses that the 90-50 gaps were the same size in different years.
We base all such tests on the estimated parameters of the regression models.
Findings
National trends
The percentage of American elementary school students attending private elementary schools
increased from 10 percent in 1948 to more than 15 percent in 1958. The percentage remained close to
15 through the mid-1960s, but then fell back to 10 percent by the mid-1970s. The private elementary
school enrollment rate remained between 9 and 11 percent for the rest of the 20th century. After 1999,
the rate declined slowly but steadily, from 11 percent in 1999 to 9 percent in 2015.7
Figure 1 displays fitted trends in private school enrollment rates over the period from 1968 to
2013 for all U.S. children enrolled in grades one to eight whose family incomes were at particular points
in the national distribution. The figure illustrates the strong positive role of income in predicting private
school enrollment rates. For example, in 1968, 18 percent of elementary-school-aged children living in
high-income families attended a private school, while the corresponding percentages for children from
median- and low-income families are 12 and 5 respectively. This pattern is no surprise because, in the
absence of scholarships, families must pay tuitions to send a child to a private school, but not to a public
school.8
<Figure 1 about here>
Figure 1 also illustrates that the income mix of children attending private elementary schools
changed markedly over the last several decades. The proportion of children from middle-class families
who attended private schools declined by almost half, while the proportion of children from affluent
families attending private schools remained quite steady. As a result, the 90-50 gap in private elementary

14
school enrollment rates grew from 5.5 percentage points in 1968 to 9.3 percentage points in 2013
(p<0.001). To gain greater insight into trends in the schooling decisions of families from different parts of
the income distribution, we now to turn to enrollment trends by private school type.
National trends by private school type
In 1965, 89 percent of American children who attended a private elementary school were
enrolled in a Catholic school; in 2013, the comparable figure was 42 percent. In contrast, the percentage
of private elementary school students who attended a non-Catholic religious elementary or secondary
school increased from 8 percent in 1965 to 40 percent in 2013. During this same period, the percentage
of private elementary school students enrolled in nonsectarian schools increased from 4 to 18 percent.9
We now turn to enrollment trends by family income for the three mutually exclusive categories of private
elementary schools that can be differentiated in national data, albeit in two cases beginning only in 1987.
The left panel of Figure 2 displays trends in rates of enrollment in private nonsectarian
elementary schools, by family income, from 1969 to 2011. Only a small percentage of the nation’s
elementary school students attend these schools, and a growing percentage who do come from relatively
affluent families. In 1969, one percent of students from median-income families attended a private
nonsectarian school, and the enrollment rate for children from middle-income families remained
between one and two percent through 2011, the last year for which we have the relevant data.
<Figure 2 about here>
In 1969, the enrollment rate in private nonsectarian elementary schools for children from high-
income families was only 2 percent, and consequently the 90-50 enrollment rate gap in these schools was
only one percentage point. However, the enrollment rate in private nonsectarian elementary schools for
children from high-income families increased slowly but steadily, reaching 6 percent in 201l.
Consequently, the 90-50 gap in enrollment rates in private nonsectarian elementary schools in 2011 was
almost five percentage points, more than three times the size of the comparable gap in 1969 (p<0.001).

15
The middle panel of Figure 2 displays trends in enrollment rates in Catholic elementary schools,
by family income, over the period from 1987 to 2011. Catholic school enrollment rates for students from
families in the bottom half of the family-income distribution fell slowly but steadily over the 24-year
period. The enrollment rate for middle-income families in 2011 was 3 percent, half the comparable
enrollment rate in 1987.
In contrast, the Catholic school enrollment rate for high-income families declined by only one
percentage point over the 25-year period, from 11 to 10 percent. As a result, the 90-50 gap in enrollment
rates grew from 4 to almost 7 percentage points. Unfortunately, as a result of having only 11 data points
to estimate Catholic school enrollment rate trends at each family income percentile, the slope differences
displayed in Figure 2 are only suggestive; we cannot reject the null hypothesis that the 90-50 gap in 2011
is the same size as the 90-50 gap in 1987 (p=0.18).
The right panel of Figure 2 illustrates that enrollment trends in non-Catholic religious elementary
schools are quite different from those for the other two groups of private schools. Over the period 1987
to 2011, the enrollment rate in other religious elementary schools of children from median-income
families increased from 3 to 4 percent, while that of children from high-income families declined from 6
to 5 percent. As a result, the 90-50 gap in enrollment rates in non-Catholic religious elementary schools in
2011 was half the size of the comparable gap in 1987. As with the Catholic school enrollment trends,
these patterns are only suggestive. Due to a lack of power, we cannot reject the null hypothesis that the
90-50 gaps are the same size in the two years (p=0.13).
In summary, the relatively stable private elementary school enrollment rate for children from
high-income percentile families displayed in Figure 1 masks a shift from religious to non-sectarian schools
over the last four decades. The declining private school enrollment rates for children from middle-income
and low-income families displayed in Figure 1 are due to a decline in Catholic school enrollment rates for
these groups. These declines were somewhat offset by increases in the enrollment rates of children from

16
these groups in other religious private schools.
Trends for subgroups of families
Race/ethnicity. In 1959, enrollment rates in private elementary schools for white, Hispanic, and black
students were 16, 13, and 3 percent respectively.10 Over the next half century, the private elementary
school enrollment rate of white students declined slowly, with 11 percent enrolled in private elementary
schools in 2013. During this same period, the comparable enrollment rate of Hispanic students declined
quite rapidly, while that of black students increased slightly. In 2013, 5 percent of black children and 3
percent of Hispanic children of elementary-school-age were enrolled in a private school.11
It is not immediately clear to what extent the changes in private school enrollment rates by race
are due to changes in each group’s income distribution or to changes in private school enrollment
conditional on income. Given that black and Hispanic families were less concentrated in the bottom decile
of the income distribution in 2013 than in 1969, we would expect their private school enrollment rates to
rise if enrollment rates conditional on income remained constant. This is why it is important to examine
trends in private school enrollment rates for black and Hispanic whose families were at particular points
in the national family income distribution.
The left panel of Figure 3 displays trends in rates of enrollment in any type of private elementary
school for black students whose families were at the 10th, 50th, and 90th percentiles of the national family
income distribution. In 1968, two percent of black children from low-income families attended private
elementary schools. This rate rose slowly over the next four decades, reaching four percent in 2013. The
private school enrollment rate for black children from middle-income families was quite steady over this
time period, with a 2013 enrollment rate one point higher than the 5 percent enrollment rate in 1968. In
contrast, the private school enrollment rate for black students from high-income families increased from
11 percent in 1968 to more than 16 percent in the mid-1990s. Subsequently, this rate fell slightly,
reaching 14 percent in 2013. The net effect of these trends is that the 90-50 gap in the private

17
elementary school enrollment rate of black students in 2013, 8 percentage points, was only slightly larger
and not statistically different from the comparable gap of 6 points in 1968 (p=0.32).12 Note that the slow,
but steady increase in the private school enrollment rate for low-income black students indicates that not
all of the overall increase in the black private school enrollment rate was due to changes in the black
family income distribution.
<Figure 3 about here>
The right panel of Figure 3 displays trends in private school enrollment rates, by income, from
1969 to 2013 for Hispanic children. Private school enrollment rates fell over this period for children from
Hispanic families in all parts of the income distribution. The rate of decline was most rapid for children
from middle-income Hispanic families, falling from 15 percent in 1969 to three percent in 2013. Since the
decline was more modest for children from high-income Hispanic families (from 18 percent in 1969 to 15
percent in 2013), the 90-50 private school enrollment rate gap experienced a statistically significant
increase from 3 points in 1969 to 12 points in 2013 (p<0.001).
One question that the panels of Figure 3 prompt is whether private school enrollment rates for
black and Hispanic students from high-income families differ from those of non-Hispanic white students
from equally high-income families. To address this question, we fitted regression models estimating
trends in private school enrollment rates for black, Hispanic, and white children from families in the 90th
percentile of the family income distribution in the relevant year. In 1970, only 12 percent of children from
high-income black families attended a private elementary school, compared to 18 percent of children
from high-income white and Hispanic families. However, as illustrated by Figure 4, the racial/ethnic gaps
in the private elementary school enrollment rates of children from high-income families narrowed after
1980. While we reject null hypotheses that the private school enrollment rates of children from the three
high-income ethnic groups were equal in 1989, 1999, and 2009 (p<0.05, p<0.001, and p<0.01,
respectively), the differences were less than three percent in every year. In summary, differences in

18
family income explain much, but not all, of the differences in private school enrollment rates for children
from black, Hispanic, and white families.
<Figure 4 about here>
Urban/Suburban. In 1968, 19 percent of children living in cities and 13 percent of those living in suburbs
attended a private elementary school.13 Over the next half century, both percentages declined, as did the
difference between the private elementary school enrollment rates of urban and suburban children. In
2013, the respective enrollment percentages were 10 and 8.
The left panel of Figure 5 displays trends in private elementary school enrollment rates, by
income percentile, for families living in cities. The pattern is a more vivid version of that displayed in
Figure 1 for all American elementary school students. The private school enrollment rate for children
from median-income families declined quite steadily from 20 percent in 1968 to 7 percent in 2013. This
decline is linked to the closing of many urban Catholic schools over this time period. However, it is not
clear how much this is due to changes in the demand for urban Catholic schools (stemming from changes
in the religious and racial demographics of cities) and how much is due to changes in the ability of the
Catholic Church to maintain urban schools with the same relatively low tuition rates that parishes had
provided historically.
<Figure 5 about here>
In 1968, 26 percent of elementary-school-age children from high-income urban families attended
a private school. Over the next two decades, the private school enrollment rate climbed slightly, reaching
30 percent in 1989. Since then, the private school enrollment rate has fallen to a rate of 24 percent in
2013, slightly lower than the 1968 rate. A result of these trends, especially the dramatic decline in the
enrollment rate of children from middle-income families, is that the 90-50 gap in private school
enrollment rates for children living in cities increased from 6 percentage points in 1968 to 17 points in
2013 (p<0.001).

19
As the right panel of Figure 5 illustrates, the private elementary school enrollment rate for
children from middle-income families living in suburbs fell quite steadily over the last several decades,
from 11 percent enrolled in 1968 to 6 percent in 2013. The comparable enrollment rate for children from
high-income suburban families remained quite steady at a level between 15 and 18 percent from 1968
until quite recently, but fell in the years following the onset of the Great Recession. A result of this recent
decline in the private school enrollment rate of high-income suburban families is that the 90-50 gap in
private school enrollment rates was the same in 2013 as it had been in 1968 – 7 percentage points.
Region. In 1968, private elementary school enrollment rates were considerably higher in the Northeast
and Midwest than in the South and West.14. In 2013, they were still higher, but the differences were much
smaller. The reason is that private school enrollment rates in the Northeast and Midwest fell substantially
while those in the South and Midwest held quite steady. The respective enrollment rates by region were
22, 16, 6, and 8 percent in 1968 and 10, 9, 8, and 7 percent in 2013.15
The four panels of Figure 6 show trends in private school enrollment rates, by income, for
students living in each of four regions. In 1968, more than 20 percent of children from median-income
and high-income families in the Northeast attended private elementary schools, with the vast majority
attending Catholic schools. Over the next 45 years, the percentage of children from median-income
families in the Northeast attending private elementary schools declined steadily, falling to 9 percent in
2013. The private school enrollment rate for children from high-income families in the Northeast also fell
during this period, but more slowly. As a result, the 90-50 gap in private school enrollment rates in the
Northeast increased from two to five percentage points (p=.103).
<Figure 6 about here>
Private school enrollment rates of children from high- and middle-income families in the Midwest
fell by approximately the same amount between 1968 and 2013. As a result, the 90-50 enrollment rate
gap in 2013 (6 points) was not significantly different from the 1968 gap of 8 percentage points (p=0.47).

20
Trends in private elementary school enrollment rates in the South and West are quite different
from those in the other two regions. The private school enrollment rate of children from median-income
families in the South held quite steady between 1968 to 2013, with six percent of children attending
private elementary schools in both the first and last years of this period. In contrast, the private
elementary school enrollment rate of children from high-income families in the South increased from 14
percent in 1968 to 19 percent in 2013. As a result, the 14 percentage point gap in 2013 between the
private school enrollment rates of children from high- and middle-income families in the South was twice
as large as the comparable gap in 1968 (p<0.001).
Trends in private school enrollment rates by income in the West are similar to those in the South,
although more muted. The private school enrollment rate of children from median-income families in the
West fell slightly, from 7 percent in 1968 to 5 percent in 2013. During this same period, the private school
enrollment rate of children from high-income families in the West increased, and the 14 percent
enrollment rate in 2013 was 3 percent higher than the comparable rate in 1968. A result of these trends
is that the 90-50 enrollment rate gap experienced a statistically significant increase from 4 points in 1968
to 9 in 2013 (p<0.001).
Explaining the Patterns
To summarize, we have described several striking patterns:
1. The gap between the private elementary school enrollment rates of children from high- and
median-income families grew substantially between 1968 and 2013, especially during the last
two decades of the 20th century. It grew largely because the private school enrollment rate of
middle-income families declined considerably during that time period.
2. The growth in the 90-50 enrollment rate gap among students of private nonsectarian
elementary schools has been particularly large and is almost entirely due to a substantial
21
increase in the enrollment rate of children from high-income families.
3. Catholic elementary school enrollment rates have shown a substantial long-term decline,
especially among children from low- and middle-income families. This accounts for much of
the growth in the 90-50 gap in private school enrollment rates.
4. Conditional on family income, private school enrollment rates are much higher among
families living in cities than among those living in suburbs, and the 90-50 gap grew more
among urban families.
5. Private elementary school enrollment rates are lower for black and Hispanic families than for
white families, but differences in income account for a large part of enrollment rate
differences.
6. Private school enrollment trends are quite different in the South and West than in the
Northeast and Midwest. In both of the former regions, the private school enrollment rates of
children from high-income families increased, while they declined in the other two regions.
The 90-50 gap in private school enrollment rates increased much more in the South than in
other regions.16
We frame explanations for these patterns in terms of a simple economic model of families. We
assume that parents seek to maximize their family’s welfare, subject to the constraints they face. Quality
of their children’s education, as they define it, is one element of welfare. Relevant constraints include
their family income and the cost and perceived quality of the public and private schools available to them.
The cost of public schools depends on the price of housing in different communities. The cost of private
schools is the net tuition and fees the parents would be charged. We want to emphasize that our
potential explanations are hypotheses supported by descriptive evidence that we offer to motivate future
research. We do not claim to present evidence of causation.
The decline in the number of Catholic schools and the increasing cost of those that remain

22
contributed to the decline in the percentage of families sending their children to private elementary
schools, especially among those of modest means. Between 1970 and 2010, the number of Catholic
elementary schools in the United States declined 37 percent and the number of students attending these
schools fell 60 percent. In part, this was because inflation-adjusted tuition in Catholic elementary schools
increased 570 percent (from $873 to $5,858).17 During this period, the median real income of families
with school-aged children increased only 33 percent, and that of families at the 10th percentile of the
income distribution declined by three percent. Dynarski, Gruber, and Li (2009) show that the demand for
Catholic elementary school education is more sensitive to price the lower a family’s income. The rapid
tuition increases help explain why Catholic elementary schools increasingly serve students from relatively
high-income families.
One factor contributing to the increasing cost and declining supply of Catholic schools is the
decline in the number of clergy and members of religious orders who provided low-cost teaching services
to Catholic schools. Between 1970 and 2016, the percentage of the staff of Catholic elementary schools
who were clergy or members of religious orders fell from 48 to less than 3.18
Another factor contributing to the decline in Catholic school enrollments may have been the
sexual abuse crisis, which was concentrated in the Northeast in the first decade of the 21st century.
Publicity about this scandal may have led some parents to withdraw children from Catholic schools or to
make other choices for children entering school. Settling the court cases that arose from the abuses
reduced the ability of many dioceses to subsidize their schools, a long-standing practice that had allowed
parishes to keep tuitions well below average per-student operating cost and to offer substantial
scholarships to students from low-income families.19 Fallout from the crisis may have contributed to the
44 percent decline between 2001 and 2011 in the number of students attending Catholic elementary
schools in the Northeast. As illustrated in Figure 7, this was a much more rapid enrollment decline than
that experienced by Catholic elementary schools in other regions of the country during this decade or in

23
the Northeast in the previous decade.20
While tuitions at Catholic schools have increased especially rapidly in recent decades, tuitions in
other types of private schools also increased more rapidly than the median income of families with
children. Measured in 2015 dollars, the average full tuition in nonsectarian private elementary schools
rose from $4,120 in 1979 to $22,611 in 2011.21 Given the high tuitions in nonsectarian private elementary
schools, it is not surprising that enrollment in these schools rose faster among students from high-income
families than among those from low-income families, or that the 90-50 enrollment gap increased
substantially.
Tuitions have also increased substantially in non-Catholic religious elementary schools. In 1993,
average full tuition (in 2015$) in these schools was $3,896. In 2011, it was $9,134 (Snyder and Dillow,
2015, Table 205.50). Since the average income of high-income families increased by much more than that
of median-income or low-income families during this period, it is surprising that 90-50 enrollment gap did
not increase between 1987 and 2011. We return to this puzzle below, when we discuss differences across
regions.
Another factor relevant to explaining trends in private school enrollments is the perceived quality
of the public schools with which private schools compete. Nationwide, the gap between the average
score of students in public schools and private schools on the grade 4 National Assessment of Educational
Progress mathematics assessment declined markedly between the 1990s and 2011 (Dynarski, 2016). This
may explain why the percentage of elementary school students attending private schools declined slightly
during this period.
A consequence of the increase in residential segregation by income over the last several decades,
especially among families with school-aged children, is that urban public schools increasingly serve low-
income student populations (Owens, 2016; Owens, Reardon, and Jencks, 2016). Average mathematics
and reading scores are considerably lower for students attending urban public schools than for those
24
attending suburban public schools (Blagg, 2016). Student discipline problems are more frequent (Snyder,
DeBrey, and Dillow, 2016, Table 230.10). Throughout the 1980s and early 1990s (the only period for
which consistently coded data are available), a lower percentage of urban parents with children of school
age rated their local public schools as A or B than suburban parents with the same income did. Moreover,
as illustrated in Figure 8, a higher percentage of high-income suburban parents gave their local public
schools a grade of “A” or “B” (on an A-F scale) than did lower-income suburban parents (p<0.01). This
probably reflects the greater capacity of high-income parents to choose to live in suburban communities
with high-quality public schools. In contrast, high-income parents living in cities did not rate their local
public schools more favorably than lower-income urban parents did.22 This helps to explain why high-
income parents who choose to live in cities are more likely than those living in suburbs to send their
children to private elementary schools.23
Differences across regions in the composition of private school enrollments help to explain
differences in private school enrollment trends. Historically, Catholic school enrollment rates in the South
and West were much lower than those in the Northeast and Midwest. Consequently, declining availability
and increasing cost of Catholic elementary schools affected private school enrollment rates in the South
and West less than those in the other two regions.
During the 1970s, efforts by the courts to desegregate public schools in the South resulted in
white flight to private schools (Rossell, 1983). This contributed to the increase in the private school
enrollment rate in the South during that decade, especially among white and high-income families.
Reardon and Yun (2003) show that the private school enrollment rate of white children living in
predominantly black counties in the South remained high throughout the last three decades of the 20th
century.
The disproportionate number of conservative Christians in the South may also play a role in
explaining regional differences in private school enrollment rate trends. In the wake of Supreme Court

25
decisions banning prayer in schools, many conservative Christians felt that public schools did not reflect
their values (Cooper, 1984). This may explain why the percentage of median-income families living in the
South who sent their children to non-Catholic religious elementary schools increased over the past
several decades despite the marked increase in tuitions at these schools. Interestingly, the percentage of
high-income families in the South who sent their children to non-Catholic religious elementary schools
declined over this same period, and the 90-50 gap in enrollment rates in other religious elementary
schools declined (p<0.05). However, high-income Southern families increasingly sent their children to
nonsectarian private schools (p<0.01). This helps to explain why 90-50 gaps in private elementary school
enrollment rates increased in the South between 1987 and 2011.24
One other factor that may contribute to the trends in private school enrollment rates that we
document are changes in the composition of families at each income percentile. For example, the
percentage of black children from low-income families that attended private schools increased slowly but
steadily between 1968 and 2013. During this same period the percentage of black children living in
families with incomes in the bottom 10 percent of the national family income distribution declined from
28 percent to 20 percent. Low-income black families in 2013 may differ from low-income black families
in 1969 in unobserved dimensions relevant to school choice.
Implications of the Trends
Relative to residential mobility patterns, trends in private school enrollments play only a modest
role in explaining increases in school segregation by income. The reason is that the percentage of
American children attending private elementary schools has declined from 15 to less than 9 percent in
recent decades. However, this role is not inconsequential. Over the last three decades, Catholic schools
and nonsectarian private schools have increasingly served students from high-income families. These
trends, especially among urban families and those living in the South and West, are one of several

26
mechanisms through which increases in family income inequality have contributed to increases in school
segregation by income.
It is more difficult to judge whether trends in private school enrollment rates by family income
have contributed to increases in gaps in educational outcomes by family income. If average per student
expenditure is an indicator of instructional quality, this may be the case. The reason is that the 90-50
enrollment rate gap has increased the most in nonsectarian elementary schools, which are more than
twice as expensive, on average, as religious schools (Baker, 2009).
It is also the case that median-income parents who enrolled their child in a particular type of
private elementary school paid less than high-income parents who did so. For example, the median
tuition paid by a middle-income family that sent a child to a nonsectarian private school in 2001, the
latest year for which we have the relevant data, was $2,100 less (in 2015 $) than that paid by high-income
families.25 Part of the difference may reflect scholarship aid to median-income families. However, it also
reflects differences between the high-priced private schools that children from affluent families attend
and the lower-priced, and perhaps less effective private schools that students from lower-income families
attend. Indeed, Braun, Jenkins, and Grigg (2006) and Lubienski and Lubienski (2014) document that
differences in the effectiveness of private schools within each private school type are much greater than
differences between the average effectiveness of each type of school. We know of no evidence about
whether the more expensive private schools are more effective than the less expensive ones. Certainly,
the school choices of affluent families indicate that they believe they are.
The limited available evidence on the average effectiveness of different types of private schools
does not support a clear inference about whether trends in private school enrollments by family income
have increased or decreased the size of income-related gaps in student achievement. Using data from the
2003 National Assessment of Educational Progress, Braun, Jenkins, and Grigg (2006) and Lubienski and
Lubienski (2014) find that, net of family background influences, the average mathematics and reading

27
achievement of children enrolled in conservative Christian elementary schools was approximately one-
half a standard deviation lower than that of demographically similar children enrolled in public schools.
This is consistent with the very low average per student expenditure in these schools (Baker, 2009) and
the weak average academic qualifications of their teaching staffs (Lubienski & Lubienski, 2014).
Unfortunately, there is no systematic evidence on the reading and mathematics achievement, net of
family background influences, for the 65 percent of children enrolled in non-Catholic religious private
schools that are not conservative Christian schools.
Enrollment of students from high-income families in non-Catholic religious private schools
declined in recent decades, while that of students from middle-income and low-income families
increased. The low average reading and mathematics achievement of children enrolled in conservative
Christian academies suggests that these enrollment trends may have contributed to the increase in the
reading and math test score gap between children from low- and high-income families, although the
effects would likely be very modest, given the small proportion of students in such schools.
On the other hand, trends in Catholic elementary school enrollments may have reduced income-
related gaps in test scores. Using data from the period 1998-2004, Reardon, Cheadle, and Robinson
(2009) report that, by fifth grade, Catholic school students have math skills 3–4 months behind those of
socioeconomically similar public school students who started kindergarten with the same level of initial
skills.26 Using NAEP data from 2003, Braun, Jenkins, and Grigg (2006) and Lubienski and Lubienski (2014)
report similar patterns. In recent decades, the percentage of children from low- and medium-income
families who attend Catholic elementary schools has fallen rapidly while the percentage attending public
schools has risen. If the change in the distribution of low- and middle-income students reflected
movement from Catholic schools of average effectiveness to public schools of average effectiveness, this
would have resulted in improved mathematics achievement for students from low- and middle-income
families. However, we have no way to judge whether this assumption holds. Nor do we know if the

28
relative performances of Catholic and public elementary schools has changed in the last dozen years.
We conclude by reminding the reader of the dramatic changes that have taken place in the
distribution of private elementary school enrollments in the U.S. over the last 45 years. One illustration is
that non-Catholic religious elementary schools today serve more students whose family incomes are in
the bottom half of the distribution than Catholic elementary schools do. Another is the substantial
increase in recent decades in the percentage of students from high-income families that attend private
nonsectarian private schools. Much less is known about these groups of private schools than is known
about Catholic schools, which historically were the dominant supplier of private school services in the U.S.
and the subject of a great deal of research.
The key trends we document in this paper have, together, troubling implications for the
segregation of low-income students. As a result of growing residential segregation by income, low-income
families are increasingly concentrated in urban areas. In such places, one quarter of high-income families
enroll their children in private schools; but a much smaller—and declining—proportion of middle- and
low-income families in urban areas do so. This is, in part, a result of rising tuition and reduced availability
of Catholic schools, which in the past enrolled many middle and low-income students in urban areas. As a
result, both urban public schools and urban private schools have less socioeconomic diversity today than
they had several decades ago.
Higher income families increasingly live either in the suburbs or enroll their children in private
schools. Moreover, the private schools their children attend are more likely to be expensive nonsectarian
schools than was the case four decades ago. Together these trends indicate an increasingly polarized
pattern of school enrollment. As a result, American schools—both public and private—are increasingly
segregated by income.

29
Notes
1 Authors’ tabulations of data from the 2007 National Household Education Surveys (NHES).
2 Another possibility is that affluent parents who send their children to private schools may be less likely
to vote in favor of the taxes needed to fund high quality public education. We know of no evidence that
directly addresses this hypothesis. However, Boustan et al. (2013) and Corcoran and Evans (2010) find
that rising income inequality is associated with increases in spending on public education. They point out
that this is consistent with a median voter model in which rising income inequality reduces the median
voter’s tax share.
3 As Baker (2009) points out, many private schools spend more per student each year than the tuition and
fees they charge, making up the difference from returns on endowments or from annual voluntary
donations.
4 The estimates of private school enrollments from the first administrations of the PSS (1989, 1991, and
1993) were considerably higher than CPS-based estimates. Williams (1987) explains that surveys of
private schools conducted by the U.S. Department of Education during the 1970s and early 1980s also
produced estimates higher than those obtained from the CPS (a household survey). We had hoped to use
information from the PSS to estimate birth and death rates for different types of private schools.
However, we concluded that our estimates were inaccurate because many private schools did not
respond to the PSS questionnaire in some years.
5 The U.S. Department of Education classifies conservative Christian schools as those that have
membership in at least one of four associations: Accelerated Christian Education, American Association of
Christian Schools, Association of Christian Schools International, or Oral Roberts University Education
Fellowship (Kena et al., 2016, p. 83).
6 Had we chosen to report private school enrollment trends for 95th income percentile families instead of
those for 90th income percentile families, the patterns we describe would have been even more striking.

30
We chose to report the 90th income percentile trends because they are less sensitive to limitations in the
family-income data and assumptions about the functional form of our estimating equations than the 95th
income percentile trends are.
7 Estimates of private school enrollment rates for the years prior to 1968 were taken from Bruno, 1982,
Table 1, p. 20. The authors estimated rates for subsequent years from October Current Population Survey
data. In all of the statistics we report in this paper on the percentages of American elementary school
students enrolled in private school, the denominator is the combined total number of students enrolled
in either private or public schools. Excluded from the denominator is the number of students of
elementary-school age who are home-schooled.
8 Families do pay for high-quality public schools by paying premiums for housing in relevant attendance
zones.
9 The authors calculated the distribution of student enrollments in different categories of private schools
in 1965 using information in Statistics of Nonpublic Elementary and Secondary Schools 1965-66 (1968),
Tables 7a and 8a, pp. 24 and 26. Authors’ calculations of data from the 2013 PSS provided the analogous
information for 2013.
10 Authors’ calculations from 1959 U.S. Census of Population data.
11 Authors’ calculations from October 2013 CPS data.
12 Part of the explanation for the recent decline in the private elementary school enrollment rate for
children from high-income black families lies in relatively long-lasting income and wealth shocks from the
Great Recession that were greater, on average, than those experienced by white families (McKernan et
al., 2013). However, the decline started before the onset of the Great Recession.
13 Authors’ calculations from October 1968 CPS data.
14Authors’ calculations from October 1968 CPS data.
15 Authors’ calculations from data from the 1968 and 2013 October Current Population Surveys.

31
16 For reasons of parsimony, we do not include in this paper evidence on trends in private school
enrollment rates for secondary school students. These trends are quite similar to those for elementary
school students, with the following qualifications. The percentage of high school students attending
private schools has been consistently lower than that of elementary school students, but the difference
has declined from four percentage points to one over the last half century. The 90-50 gap in private
school enrollment rates grew less among high school students than among elementary school students.
Finally, point estimates indicate that trends by family income in enrollment rates in particular types of
private schools are somewhat different at the high school level than at the elementary school level.
However, the differences are primarily due to the small amount of data available to estimate these
trends.
17 Dale McDonald, PBVM, PhD, the Director of Public Policy and Educational Research for the National
Catholic Educational Association, provided these figures. They are for full tuition, and do not reflect any
discounts offered to low-income families or those with multiple children attending the school.
18 Ibid. MacGregor (2012) cites evidence that nuns teaching in Catholic schools in the 1940s were paid an
average annual stipend of $335, equivalent to about $300 in 2010 dollars. In contrast, the median salary
of lay teachers in Catholic elementary schools in 2015 was approximately $50,000 (National Catholic
Educational Association, 2016).
19 See Baker (2009) for an informative discussion of the difference between private school tuitions and
per-student operating cost.
20 Between 2001 and 2011, the number of students attending Catholic elementary schools declined by 27
percent in the Midwest and by 19 percent in the South and West. Between 1991 and 2001, Catholic
elementary school enrollment in the Northeast declined by 10 percent.
21 Bruno (1982), Table 7, page 27 provides the mean tuition in 1979 in current dollars. The tuition figure
for 2011 came from Snyder and Dillow (2015), Table 205.50, pp. 118-119. These are estimates of full

32
tuitions. Retrieved on May 4, 2017 from: https://nces.ed.gov/pubs2015/2015011.pdf.
22 See the online appendix for a description of the data and the specification and estimated parameters of
the model used to produce the results described in this paragraph.
23 Another factor that may have contributed to the decline in the private school enrollment rate of
children from median-income and low-income urban families after the mid-1990s is the increasing
availability of charter schools in many cities. These are public schools that provide families with another
schooling option free of tuition payments. Chakrabarti (2013) shows that the decisions of low-income
families to enroll their children in a private school are very sensitive to modest costs such as paying for
transportation, even when the schools charge no tuition. We know of only one study that examines the
causal impact of greater charter school availability on private school enrollment rates. Using data from
Michigan, Chakrabarti and Roy (2016) do not find evidence supporting the substitution hypothesis.
24 Authors’ analyses of data from those CPS and NCES datasets containing information on enrollment in
particular types of private schools by family income and region.
25 See the online appendix for a description of the data and methods that we used to estimate the
difference between the median tuition middle-income and high-income parents paid to send a child to a
private nonsectarian elementary school.
26 In contrast, several studies (for example, Coleman, Hoffer, & Kilgore, 1982; Evans & Schwab, 1995;
Neal, 1997) find that Catholic high schools located in cities are more effective than urban public schools in
enabling students to graduate and to enroll in college.

33
References
Baker, B. D. (2009). Private schooling in the U.S.: Expenditures, supply, and policy implications. Boulder
and Tempe: Education and the Public Interest Sector & Educational Policy Research Unit.
Blagg, K. (2016). Making the grade in America's cities: Assessing student achievement in urban districts.
Washington, DC: The Urban Institute.
Boustan, L., Ferreira, F., Winkler, H., & Zolt, E. M. (2013). The effect of rising income inequality on
taxation and public expenditures: Evidence from U.S. municipalities and school districts, 1970-
2000. Review of Economics and Statistics, 95(4), 1291.
Braun, H., Jenkins, F., & Grigg, W. (2006). Comparing private schools and public schools using hierarchical
linear modeling (NCES 2006-461). Washington, DC: U.S. Department of Education, National
Center for Education Statistics, Institute of Education Sciences.
Bruno, R. R. (1982). Private school enrollment, tuition and enrollment trends: October 1979. Current
Population Reports, Special Studies, Series P-23, No. 121. Suitland, Md.: Bureau of the Census.
Chakrabarti, R. (2013). Do vouchers lead to sorting under random private school selection? Evidence from
the Milwaukee voucher program. Economics of Education Review, 34, 191-218.
Chakrabarti, R., & Roy, J. (2016). Do charter schools crowd out private school enrollment? Evidence from
Michigan. Journal of Urban Economics, 91, 88-103.
Coleman, J. S., Hoffer, T., & Kilgore, S. (1982). High school achievement: Public, catholic, and private
schools compared. New York: Basic Books.
Cooper, B. S. (1984). The changing demography of private schools: Trends and implications. Education
and Urban Society, 16(4), 429-442.
Corcoran, S. P., & Evans, W. N. (2010). Income inequality, the median voter, and the support for public
education. Cambridge, MA: National Bureau of Economic Research Working Paper No. 16097.
Duncan, G. J., & Murnane, R. J. (2014). Restoring opportunity: The crisis of inequality and the challenge for
34
American education. Cambridge, MA: Harvard Education Press and the Russell Sage Foundation.
Dynarski, M. (2016). On negative effects of vouchers. Brookings Institution Reports, Retrieved from
https://search-proquest-com.ezp-prod1.hul.harvard.edu/docview/1791230682.
Dynarski, S., Gruber, J., & Li, D. (2009). Cheaper by the dozen: Using sibling discounts at catholic schools to
estimate the price elasticity of private school attendance. NBER Working Paper No. 15461.
Cambridge, MA: NBER.
Epple, D., Figlio, D., & Romano, R. (2004). Competition between private and public schools: Testing
stratification and pricing predictions. Journal of Public Economics, 88(7-8), 1215-1245.
Evans, W. N., & Schwab, R. M. (1995). Finishing high school and starting college: Do Catholic schools make
a difference? Quarterly Journal of Economics, 110(4), 941-974.
Flood, S., King, M., Ruggles, S., & Warren, J. R. (2015). Integrated public use microdata series, current
population survey: Version 4.0. [dataset]. Minneapolis, MN: University of Minnesota.
Gallup/phi delta kappa poll of the public's attitudes toward the public schools [datasets]. (1992).
Bloomington, Indiana: Phi Delta Kappan.
Kena, G., Hussar, W., McFarland, J., de Brey, C., Musu-Gillette, L., Wang, X., Dunlop Velez, E. (2016). The
condition of education 2016. (No. NCES 2016-144). Washington, DC.: U.S. Department of
Education, National Center for Education Statistics.
Lubienski, C. A., & Lubienski, S. T. (2014). The public school advantage. Chicago: University of Chicago.
MacGregor, C.A. (2012). School’s Out Forever: The Decline of Catholic Education in the United States.
Ph,D. Dissertation Princeton University Sociology Department.
McKernan, S., Ratcliffe, C., Steuerle, E., & Zhang, S. (2013). Less than equal: Disparities in wealth
accumulation. Washington, D.C.: Urban Institute.
Meyer, B. D., Mok, W. K., & Sullivan, J. X. (2015). Household surveys in crisis. Journal of Economic
Perspectives, 29(4), 199-226.

35
National Catholic Educational Association. 2016. The Annual Financial Report Catholic Elementary and
Secondary Schools in the United States: 2015-2016. Arlington, Va.
Neal, D. (1997). The effects of catholic secondary schooling on educational achievement. Journal of Labor
Economics, 15(1), 98-123.
Owens, A. (2016). Inequality in children's contexts: Trends and correlations of economic segregation
between school districts, 1990 to 2010. American Sociological Review, 81(3), 549-574.
Owens, A., Reardon, S. F., & Jencks, C. (2016). Income segregation between schools and school districts.
American Educational Research Journal, 53(4), 1159-1197.
Pattillo, M. (2013). Black picket fences: Privilege and peril among the black middle class. Chicago:
University of Chicago Press.
Reardon, S. F. (2011). The widening academic achievement gap between the rich and the poor: New
evidence and possible explanations. In G. J. Duncan, & R. J. Murnane (Eds.), Whither opportunity?
Rising inequality, schools, and children's life chances (pp. 91-116). New York: Russell Sage
Foundation and the Spencer Foundation.
Reardon, S. F., & Bischoff, K. (2011). Income inequality and income segregation. American Journal of
Sociology, 116(4), 1092-1153.
Reardon, S. F., Cheadle, J. E., & Robinson, J. P. (2009). The effect of Catholic schooling on math and
reading development in kindergarten through fifth grade. Journal of Research on Educational
Effectiveness, 2, 45-87.
Reardon, S. F., Fox, L., & Townsend, J. (2015). Neighborhood income composition by race and income,
1990-2009. The Annals of the American Academy of Political and Social Science, 660, 78-97.
Reardon, S. F., & Yun, J. T. (2003). Integrating neighborhoods, segregating schools: The retreat from
school desegregation in the south, 1990-2000. North Carolina Law Review, 81, 1563-2433.
Rossell, C. (1983). Desegregation plans, racial isolation, white flight, and community response.

36
In C. Rossell, & W. Hollis (Eds.), The consequences of school desegregation (pp. 29-57).
Philadelphia, PA: Temple University Press.
Sharkey, P. (2014). Spatial segmentation and the black middle class. American Journal of Sociology, 119,
903-954.
Snyder, T. D., De Brey, C., & Dillow, S. A. (2016). Digest of education statistics 2015. ( No. NCES 2016-014).
Washington, DC: National Center for Education Statistics, Institute of Education Sciences, U.S.
Department of Education.
Snyder, T. D., & Dillow, S. A. (2015). Digest of education statistics 2013. ( No. NCES 2015-011).
Washington, DC.: National Center for Education Statistics, Institute of Education Sciences, U.S.
Department of Education.
Statistics of nonpublic elementary and secondary schools 1965-66. (1968). (No. No-0E-20111).
Washington, DC: National Center for Educational Statistics.
Stone, C., Trisi, D., Sherman, A., & Horton, E. (2016). A guide to statistics on historical trends in income
inequality. Washington D.C.: Center on Budget and Policy Priorities.
Williams, M. F. (1987). Private school enrollment and tuition trends: Issue paper. (Reprinted from The
Condition of Education, 1986 edition). Washington DC: Office of Educational Research and
Improvement, U.S. Department of Education.

37
Tables
TABLE 1 Distribution of Private Elementary Schools and Students by School Type and Year
Catholic Conservative
Christian Other religion-
oriented Nonsectarian 1989 2011 1989 2011 1989 2011 1989 2011 Number of schools 7883 5842 3852 4302 8079 8085 3686 5486 % of all private elementary schools 34 25 16 18 34 34 16 23 Number of students (000) 1769 1170 358 402 698 681 325 461 Average enrollment per grade 31 28 13 13 12 12 15 13 % of all private elementary school students 56 43 11 15 22 25 10 17 Note. Data come from the 1989 and 2011 PSS. PSS = Private School Universe Survey.

38
TABLE 2 Distribution of Private Elementary Schools and Enrolled Students by School Type and Year Catholic Conservative Christian Other religion-oriented Nonsectarian 1989 2011 1989 2011 1989 2011 1989 2011 Schools % in NE 32 25 11 11 19 22 19 25 % in Midwest 37 38 27 21 34 35 11 13 % in South 18 21 33 47 29 30 39 34 % in West 13 16 29 22 18 14 32 28
% in cities 47 39 31 24 33 26 38 38 % in suburbs 32 38 31 32 25 24 32 40 % in rural areas 21 23 38 43 42 50 30 22
Students % in NE 33 24 10 8 23 27 19 23 % in Midwest 35 35 22 18 28 24 12 11 % in South 19 24 36 48 31 36 47 41 % in West 13 17 32 26 19 14 22 26
% in cities 52 43 43 31 45 40 46 46 % in suburbs 33 43 36 39 32 33 32 36 % in rural areas 15 14 21 30 23 27 22 18 Note. Data come from the 1989 and 2011 PSS. PSS = Private School Universe Survey.

39
Figures
Figure 1. Estimated total private school enrollment rate by family income percentile, 1968-2013, with fitted third-order polynomial regression line.
Note. Data come from the U.S. Census and the Current Population Survey.

40
Figure 2. Estimated elementary private school enrollment rate by family income percentile with fitted linear regression line for (a) nonsectarian schools, 1969-2011, (b) Catholic schools, 1987-2011, and (c) other Religious schools, 1987-2011.
Note. Data come from U.S. Census, CPS, NHES, NELS88, and ECLS.

41
Figure 3. Estimated elementary private school enrollment rate by family income percentile, 1968-2013, with fitted third-order polynomial regression line for (a) Black and (b) Hispanic students.
Note. Data come from the U.S. Census and the Current Population Survey.
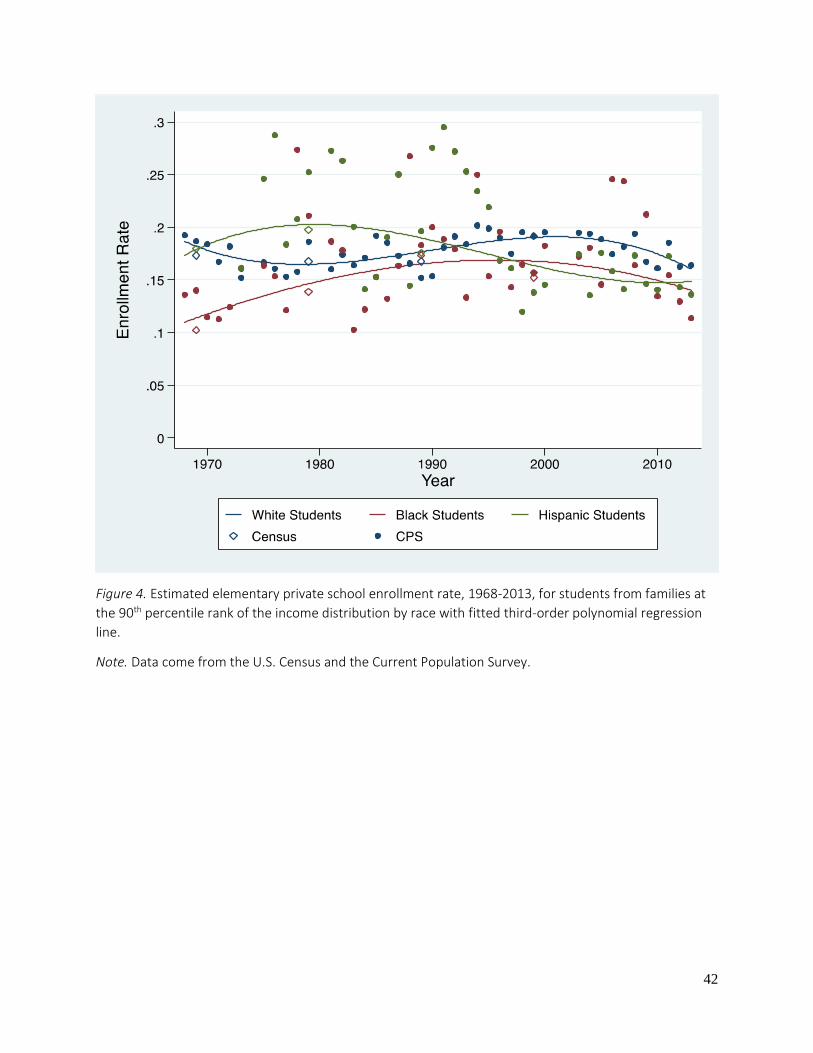
42
Figure 4. Estimated elementary private school enrollment rate, 1968-2013, for students from families at the 90th percentile rank of the income distribution by race with fitted third-order polynomial regression line.
Note. Data come from the U.S. Census and the Current Population Survey.

43
Figure 5. Estimated elementary private school enrollment rate by family income percentile, 1968-2013, with fitted third-order polynomial regression line for (a) children in urban areas and (b) children in suburban areas.
Note. Data come from the U.S. Census and the Current Population Survey.
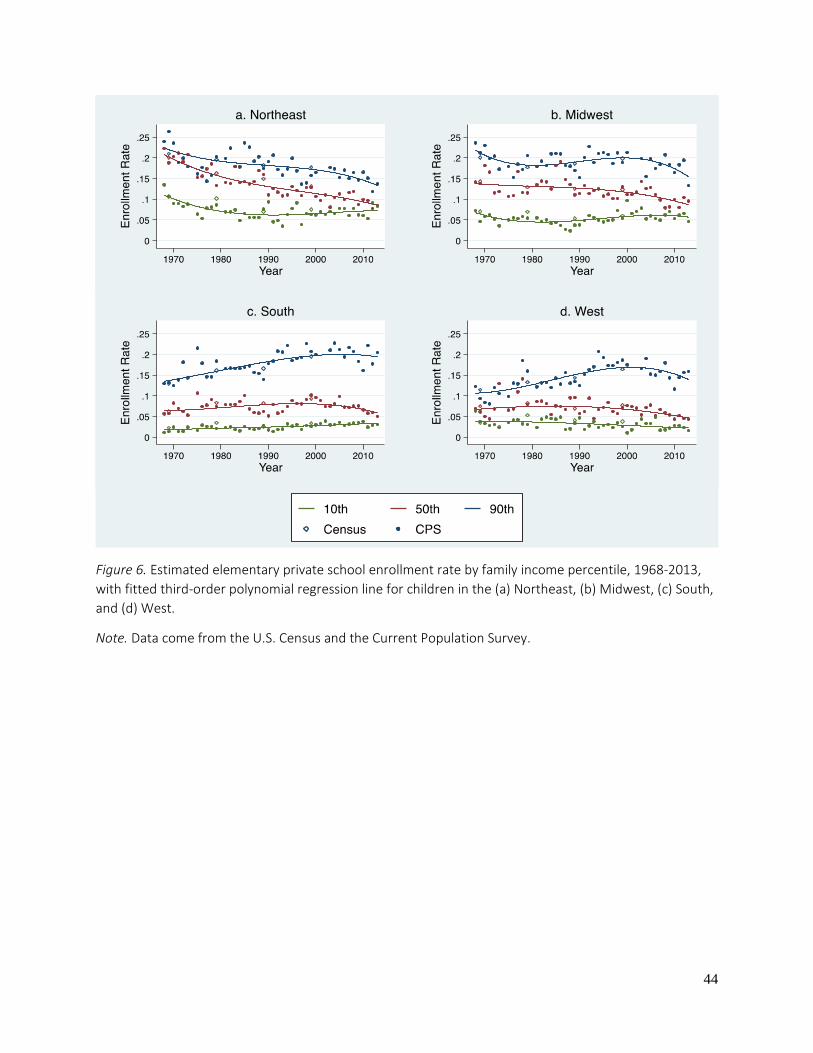
44
Figure 6. Estimated elementary private school enrollment rate by family income percentile, 1968-2013, with fitted third-order polynomial regression line for children in the (a) Northeast, (b) Midwest, (c) South, and (d) West.
Note. Data come from the U.S. Census and the Current Population Survey.

45
Figure 7. Elementary private school enrollment by private school type, 1989-2013, in the (a) Northeast, (b) Midwest, (c) South, and (d) West.
Note. Data come from the Private School Universe Surveys.

46
Figure 8. Estimated proportion of urban and suburban families with children rating their local schools as an A or B, 1982-1992.
Note. Data come from the Phi Delta Kappan polls on education.