CEO Presentation - tokaitokyo-fh.jp
42
CEO Presentation November 2017
Transcript of CEO Presentation - tokaitokyo-fh.jp

CEO Presentation
November 2017
1
02,0004,0006,0008,00010,00012,00014,00016,00018,000
010,00020,00030,00040,00050,00060,00070,00080,00090,000
1H 2H 1H 2H 1H 2H 1H 2H 1H 2H 1H
FY2012 FY2013 FY2014 FY2015 FY2016 FY2017
(Million Yen)
Operating revenue,Ordinary income
Operating Revenue
Ordinary Income
Net Income
●
Net Income(Million Yen)
¥11.16 billion gain of negative goodwill by
acquiring Takagi Securities
Recorded positive ordinary income non stop for 28 consecutive quarters
1H calculated excluding Takagi Sec. and ETERNAL
8,000
12,000
16,000
20,000
24,000Nikkei 225 (Yen)
FINANCIAL RESULTS (CONSOLIDATED)■ Trend of Financial Results (Semi-Annual)

2
CONTRIBUTING FACTORS
JVAffiliates
ProductForeign Stocks
Structured Bonds
Market Division
Income Growth

3
FOCUS AREAS
HIGH WEALTHBUSINESS
JOINT VENTURE
NEW PROJECTS

4
CAPITAL POLICY
Shareholder Return
Reserved Capital
- Dividend- Share Buyback- Benefit Program
Investment in Future Growth
Development of “MONEQUE”
M&A / Alliance
Enhancement of Market Division
Expansion in Tokyo
IT EnhancementRestructuring Takagi Sec.

5
NEW MANAGEMENT PLAN
MarketExpansion
Develop new sectorin the industry
RetailSegmentation
“New Age’s Flag Bearer 5”
Productivity Revolution Tokyo M&A
Management and Business Base built through
“Ambitious 5”
EnvironmentalChange
“New Age’s Flag Bearer 5”
GreatPlatform

6
Inquiries to be directed to:
Effective April 1, 2009, the Company spun off its financial instrument operation and Tokai Tokyo Security Co., Ltd. (former Tokai Tokyo Securities Spin-off Preparation Co., Ltd.) took it over. The Group (Tokai Tokyo Financial Group) at the same time shifted to a holding company system.Effective the same date, the Company and Tokai Tokyo Securities Spin-off Preparation Co., Ltd. changed their corporate names to Tokai Tokyo Financial Holdings, Inc., and Tokai Tokyo Securities Co., Ltd. respectively.The result for the fiscal year ended on March 31, 2009 or any earlier date account for the operation of the former Tokai Tokyo Securities Co., Ltd. under then existing organizational structure.
Corporate Communications DepartmentTEL: +81-3-3517-8618 FAX: +81-3-3517-8314E-mail: [email protected]
This material is intended to provide information regarding the Company’s most recent operational result and NOT to solicit investment in securities issued by the Company.

IR Presentation
Financial Summary & Business Strategy
November 2017

1
Contents
* Unless otherwise specified, the numerical data we quote here were all compiled as consolidated figures of the Tokai Tokyo Financial Holdings, Inc.
Overview of Tokai Tokyo Financial Holdings
Financial Summary and Characteristics of Business and Performance
Progress of New Project
Capital Policy
New Management Plan “New Age’s Flag Bearer 5”

Overview of Tokai Tokyo Financial Holdings

3
Corporate ProfileCompany Name: Tokai Tokyo Financial Holdings, Inc.
Consolidated Net Assets: 171.5 billion yenClient Assets under Custody: 4,646.0 billion yen(Retail Client Assets: 2,678.4 billion yenMarket Capitalization: 187.1 billion yenNumber of Employees:
Holding Company 182Consolidated Basis: 3,424
Group company of theTokai Bank(b)
Group company of theNikko Securities (a)
Tokai Tokyo Securities
Tokai Tokyo Financial Holdings
was established
Apr. ‘09
Oct. ‘07YM
Nov. ‘08Hamagin TT
May ‘10Nishi-Nippon City TT
Oct. ‘12Senshu Ikeda TT
Apr. ‘10Relocated HQ of TTSC
to Nagoya CityApr. ‘10
TTSC merged with Toyota Financial
Services Sec.Tokyo
Securities
Tokai Maruman Securities
Jan. ‘17HokuhokuTT
Group HistoryCurrent group configuration was formed in October 2000 through merger between Tokyo Securities and Tokai Maruman Securities
* Currently, (a) SMBC Nikko Securities, (b) Bank of Tokyo-Mitsubishi UFJ
Overview of Tokai Tokyo Financial Holdings
Apr. ‘17Tochigi Bank invested in Utsunomiya Securities
March. ‘17
AcquiredETERNAL
Apr. ‘17
AcquiredTakagi Sec.
Sep. ‘17
AcquiredPinnacle
(As of September 30, 2017)

Financial Summaryand
Characteristics of Business and Performance

5
02,0004,0006,0008,00010,00012,00014,00016,00018,000
010,00020,00030,00040,00050,00060,00070,00080,00090,000
1H 2H 1H 2H 1H 2H 1H 2H 1H 2H 1H
FY2012 FY2013 FY2014 FY2015 FY2016 FY2017
(Million Yen)
Operating revenue,Ordinary income
Operating Revenue
Ordinary Income
Net Income
●
Net Income(Million Yen)
Trend Analysis (Consolidated)Financial Summary
■ Financial Results (Semi-Annual)
¥11.16 billion gain of negative goodwill by
acquiring Takagi Securities
Recorded positive ordinary income non stop for 28 consecutive quarters
1H calculated excluding Takagi Sec. and ETERNAL
8,000
12,000
16,000
20,000
24,000Nikkei 225 (Yen)

6
Revenue SourceCharacteristics of Business and Performance
■ Group operating revenue image including the affiliates’ figures on Pro-Rata Basis*
* The charts present an image of the source of Group revenue, in FY2017 1H, which, being different from our consolidated PL, include affiliates’ figures on pro-rata basis.

7
70 77 73 74 76 75 74 73 70 70 66 69 66 61 63 59 60 58 58 57 60 55
30 23 27 26 24 25 26 27 30 30 34 31 34 39 37 41 40 42 42 43 40 45
0%
10%
20%
30%
40%
50%
60%
70%
80%
90%
100%
1Q2Q3Q4Q1Q2Q3Q4Q1Q2Q3Q4Q1Q2Q3Q4Q1Q2Q3Q4Q1Q2Q
FY2012 FY2013 FY2014 FY2015 FY2016 FY2017
Non-Retail Retail
Characteristics of Business and Performance
■ Revenue Breakdown by Business Segment
FY2012 FY2017 1H
* Numeric data on this slide were extracted from the internal managerial record of Tokai Tokyo Securities Co., Ltd.
Breakdown by Business Segment

0
5,000
10,000
15,000
20,000
25,000
30,000
35,000
40,000
1H 2H 1H 2H 1H 2H 1H 2H 1H 2H 1H
FY2012 FY2013 FY2014 FY2015 FY2016 FY2017
Others
Investment Trusts
Bonds
Foreign Stocks
Domestic Stocks
(Million Yen)
0
5,000
10,000
15,000
20,000
25,000
30,000
35,000
40,000
1H 2H 1H 2H 1H 2H 1H 2H 1H 2H 1H
FY2012 FY2013 FY2014 FY2015 FY2016 FY2017
Western Japan
Eastern Japan
Central Japan
(Million Yen)
Revenue Breakdown by RegionRevenue Breakdown by Product
* Excluding income not accompanying customers
Characteristics of Business and PerformanceRetail Segment
8
(Mostly foreign/structured bonds)

9
0
200
400
600
800
1,000
1,200
1,400
0
50
100
150
200
250
300
4Q 1Q 2Q 3Q 4Q 1Q 2Q
FY2015 FY2016 FY2017
Assets under Custory
Number of Membership
(Billion Yen)
Number of Membership & Assets under Custody (Orque d’or)
Wealth Management UnitCharacteristics of Business and Performance
184223
240
314
354365 367
425
479
0
100
200
300
400
500
600
1H 2H 1H 2H 1H 2H 1H 2H 1H
FY2013 FY2014 FY2015 FY2016 FY
2017
Premier Executive
AdvisorsOverlap
Wealth Management
(Billion Yen)
Assets under Custody(Wealth Management Unit & Premier Executive Advisors)
10
High
Wealth
6.5%
Wealth
25.9%
Middle
56.1%
General
11.4%
High Wealth
16.6%
Wealth
30.6%
Middle
44.9%
General
8.0%
Wealth Management UnitCharacteristics of Business and Performance
High
Wealth
27.5%
Wealth
25.0%
Middle
36.7%
General
10.9%
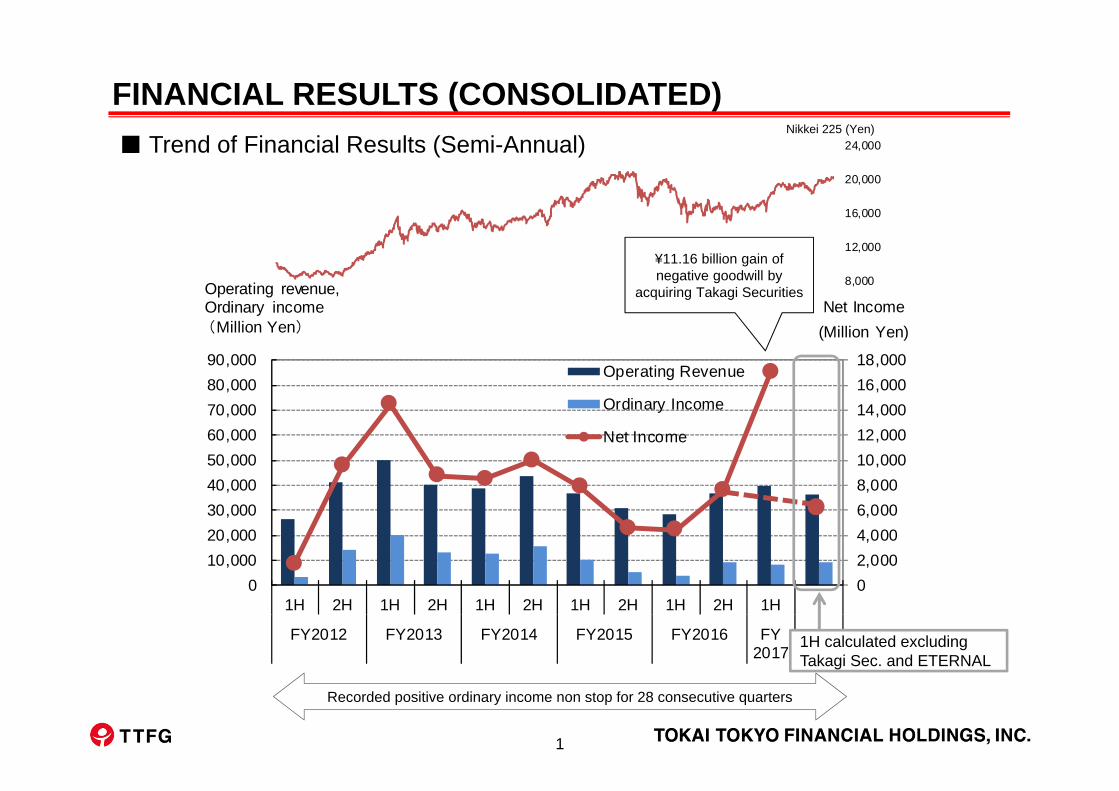
Share of High Wealth AUC in Retail Segment
High Wealth :Holding over 100 million yen in assets under custodyWealth :30 million to 100 million yenMiddle :5 million to 30 million yenGeneral :less than 5 million yen
End of March 2013 End of Sep. 2017
Share of High Wealth Revenue in Retail Segment
FYE March 2013
1H of FYE Mar. 2018 (6 months from Apr.- Sep. 2017)
High
Wealth
14.4%Wealth
24.3%Middle
46.5%
General
14.8%

11
-2,000
0
2,000
4,000
6,000
8,000
10,000
12,000
14,000
1H 2H 1H 2H 1H 2H 1H 2H 1H 2H 1H
FY2012 FY2013 FY2014 FY2015 FY2016 FY2017
(Million Yen)
others
Foreign Bonds and Derivatives
Foreign Stocks
Bond Trading
Equity Trading
Characteristics of Business and PerformanceTrend of Revenue and its Composition at Market Segment
* Numeric data on this slide were extracted from the internal managerial record of Tokai Tokyo Securities Co., Ltd.
* “Others” comprises trading which cannot be classified into products according to management accounting rule.
Increase in Foreign bonds & derivatives, and Foreign stocks
(Mostly origination fee)
(Domestic/structured bonds, etc.)
(Japanese equity)

12
0
200
400
600
800
1,000
1,200
1,400
1H 2H 1H 2H 1H 2H 1H
FY2014 FY2015 FY2016 FY2017
Others
InvestmentTrusts
Foreign &StructuredBondsDomesticBonds
ForeignStocks
DomesticStocks
(Billion Yen)
Income Contribution from JV Affiliates
Assets under Custody by Product
Joint VenturesCharacteristics of Business and Performance
5 36
245305
371450
540538
642668
780841
884963
1,0471,009
998
1,024
1,244
1,444
0
200
400
600
800
1,000
1,200
1,400
1,600
Mar‐08
Sep‐08
Mar‐09
Sep‐09
Mar‐10
Sep‐10
Mar‐11
Sep‐11
Mar‐12
Sep‐12
Mar‐13
Sep‐13
Mar‐14
Sep‐14
Mar‐15
Sep‐15
Mar‐16
Sep‐16
Mar‐17
Sep‐17
(Billion Yen)
Assets under Custody - from JVs (6 Entities)
05101520253035404550
-1,000
0
1,000
2,000
3,000
4,000
5,000
6,000
7,000
FY2008 FY2009 FY2010 FY2011 FY2012 FY2013 FY2014 FY2015 FY2016 FY20171H
Income and Other Benefits Realized from Transactions with JVsGain on Investments in PartnershipProportion to Consolidated Ordinary Income
(%)(Million Yen)

13
Bank Name Bank Deposits(Trillion Yen) JV Name Date of Commencing
Operation
1 Concordia Financial Group 14.9 Hamagin Tokai Tokyo Nov-20082 ★ Mebuki Financial Group 13.53 ★ Fukuoka Financial Group 13.24 ★ Chiba Bank 11.65 Hokuhoku Financial Group 10.6 Hokuhoku Tokai Tokyo Jan-20176 ★ Shizuoka Bank 9.27 Yamaguchi Financial Group 8.5 YM Securities Oct-20078 ★ North Pacific Bank 8.19 Nishi-Nippon City Bank 7.6 Nishi-Nippon City Tokai Tokyo May-201010 ★ The 77 Bank 7.411 ★ Hiroshima Bank 7.012 ★ Kyoto Bank 6.613 ★ Gunma Bank 6.514 ★ The Hachijuni Bank 6.415 ★ Chugoku Bank 6.216 The Juroku Bank 5.317 ★ The Toho Bank 5.218 ★ Iyo Bank 5.019 Senshu Ikeda Holdings 4.8 Senshu Ikeda Tokai Tokyo Sep-201320 Ogaki Kyoritsu Bank 4.8
- Tochigi Bank 2.6 Utsunomiya Apr-2017
Top 20 Regional Banks (total deposits)(As of March 31, 2017)
Total Bank Deposits49 Trillion Yen
★ : Banks that have subsidiary securities companies
※ Denotes Tokai Tokyo Financial Holdings’ alliance partners
Joint VenturesCharacteristics of Business and Performance

14
020406080
100120140160180200
1H 2H 1H 2H 1H 2H 1H 2H 1H
FY2013 FY2014 FY2015 FY2016 FY2017
TakagiTTSCBroker's Broker BusinessJV
(Billion Yen)
5,506
10,310
16,079
30,755
54,489
63,29962,104
56,75959,712
80,805
85,662
0
10,000
20,000
30,000
40,000
50,000
60,000
70,000
80,000
90,000
1H 2H 1H 2H 1H 2H 1H 2H 1H 2H 1H
FY2012 FY2013 FY2014 FY2015 FY2016 FY2017
(Million Yen)
Assets under Custody (Foreign Stocks )
Broker’s Broker Business
Assets under Custody Number of Accounts
Characteristics of Business and Performance

15
0
5,000
10,000
15,000
20,000
25,000
30,000
35,000
1H 2H 1H 2H 1H 2H 1H 2H 1H 2H 1H
FY2012 FY2013 FY2014 FY2015 FY2016 FY2017
Personnel Expenses Operational Expenses Fees to JVsTrading-related Expenses Other DepreciationOccupancy and Rental Fixed Cost
(Million Yen)
Characteristics of Business and PerformanceCost Analysis (Consolidated)
* Excluding the Data Transfer Cost (Operational Expenses) to JV Securities Companies in 2Q & 4Q FY2016
Increase in salaries of employees by
acquiring Takagi Sec.
1H calculated excluding Takagi Sec. and ETERNAL

Progress of New Project

17
Major Initiatives and Project Progress since FY2016
Project Achievement/Status Outlook2016Mar. “Orque d’or” Opened facility
in NagoyaStarted services for high-net-worth customers and already profitable with assets amassing to JY200 billion.
Plan to expand to Tokyo
Apr. ANAM Own 33% Started surplus fund management business for affiliate local banks as a new revenue source (212.9 billion yen of AUM as of Sep. 2017)
To receive income scream to become profitable
Sep. Ace Sec. Own 29% Started alliance to wholesale our products. Their client base is helping us increase trading revenue
Pursue further viable strategy for the alliance
2017Jan. Hokuhoku TT
Sec. Own 40%(jointly owned with Hokuhoku FG)
Commenced securities brokerage operation and made a jump start with profit as of 1Q of this fiscal year
To develop new clients and assets. Plan to expand with new branch network.
Utsunomiya Sec.
Business alliance with Tochigi Bank
Owning 40% as of April 2017 and started JV operation
To develop new clients and assets
Feb. Takagi Sec. Own 100% To expand business base in Kansai area. Operating loss of 783 million yen as of 1H FYE Mar. 2018
Rebuilding business strategy to this FY’s positive turnaround
Mar. ETERNAL Own 100% To expand insurance business base To strengthen its business and explore effective operating synergy with MONEQUE
“MONEQUE” Opened 3 outlets Launched as a new service brand to attract younger customers with “one-stop for every thing” channel meeting their changing financial needs over their life-time
To identify optimal operating style to draw customers. Plan to expand in Chubu area.

Capital Policy

19
2.31.4
2.3
3.7
2.6
3.83.72.7 3.2
4.5
2.6
4.24.5
2.93.8
012345
FY2012 FY2013 FY2014 FY2015 FY2016 FY2017 2Q
(%)4.2 4.0
2.9
9.71.4
8.6
17.7
8.917.0
12.68.6
12.88.1
4.99.57.8 8.7 8.4
0
10
20
30(%)
21.0
7.7 8.0
42.77.90
43.0
87.7
57.6
99.669.5 61.7
87.146.9
36.5
68.345.7
67.3 61.5
0
50
100
150(Yen)
130.4
61.6 61.5
Tokai Tokyo Nomura Daiwa
Capital Policy
EPS
ROE
Dividend Yield
Comparison with Major Securities Companies
*EPS and ROE is annualized by multiplying 2 to actual semi-annual figures.

20
March 2013 March 2014 March 2015 March 2016 March 2017 Sep. 2017 Shareholders' Equity (million yen) 121,947 140,462 154,633 153,089 155,312 169,482
Treasury Stock 4,207 3,835 3,639 6,390 7,572 7,528
Dividend per Share (yen) 16.00 32.00 34.00 28.00 26.00 14.00
Dividend Payout Ratio (%) 37.4 % 36.5 % 48.9 % 59.7 % 56.9 % 62.1 %
DOE (Dividend On Equity ratio) (%) 3.6 % 6.5 % 6.1 % 4.8 % 4.4 % 4.3 %
Capital PolicyShareholder Information
*Dividend per share of Sep. 2017 is semi-annual, and its payout ratio is calculated excluding 11.16 billion yen of negative goodwill caused by acquiring Takagi Securities, and also the ratio is annualized by multiplying 2 to actual semi-annual figures.
Major Shareholders No. ofshares (K)
OwnershipRatio (%)
- "Schroders Group"(*) 18,200 7.55
1 Japan Trustee Services Bank, Ltd. (Trust Account) 12,875 4.58
2 The Bank of Tokyo-Mitsubishi UFJ, Ltd. 12,016 4.28
3 The Master Trust Bank of Japan, Ltd. (Trust Account) 10,379 3.69
4 Mitsui Sumitomo Insurance Co., Ltd. 9,033 3.21
5 Toyota Financial Services Corporation 8,885 3.16
6 The Bank of Yokohama, Ltd. 7,014 2.50
7 Nippon Life Insurance Company 5,611 2.00
8 J. P. Morgan Chase Bank 385166 4,840 1.72
9 Sumitomo Mitsui Trust Bank, Limited 4,800 1.71
10 Meiji Yasuda Life Insurance Company 4,406 1.57(As of September 30, 2017)
Distribution of Shareholders
* The data of the shareholder ranking No. 1 through 10 were identical in substance to what we had publicized for disclosure purpose. However, the Change Report Pertaining to the Report of Possession of Large Volume submitted on November 7, 2017 Schroder group show that their 4 companies altogether owned 7.55% of Tokai Tokyo Financial Holdings, Inc. as of October 31, 2017
Indicators per share
Announcement of Share Repurchase and RetirementOn Oct. 27, 2017, the Company announced its Board of Directors’ decisions of 1) share repurchase up to 5 million shares (1.91% of total issued shares excluding treasury shares, up to 3.5 billion yen)2) share retirement of 10 million shares (3.56% of total issued shares including treasury shares before retirement)

21
Capital Policy
i) To keep existing operations
Required capital to keep operations by securities brokerage subsidiaries
75.7
Required capital at equity-method affiliates 20.6
Other fixed assets 14.0
Sub total 110.3
ii) Available surplus capital
Available for further allocation 61.2
(Billion yen, as of the end of Sep. 2017)
Mid-longterm debt 73.6
Consolidated own capital
Investment securities 26.0
Other investment 22.5
Cash equivalent 86.3
Total 134.8
171.5iii) Actual usage
New Management Plan“New Age’s Flag Bearer 5”

23
2. Alliance & Platform
4. Humanity
5. RiskManagement
3. Expertise
1. Community & the Middle
Innovation Jump up 5(2006 - 2009)
IT Strategy Instrumental to
Innovation +Alliance Strategy
Premier HouseBlue Ocean Strategy
M&A Strategy
TT Revolution(2009 - 2012)
Ambitious 5(2012 – 2017)
Growth Strategy
Overseas Operation
Retail
Capital Policy
Market& Product
Tokai Tokyo Securities
Amplify Earnings
Power
• Growth Potential
• Productivity
• Communication
• Customer Loyalty
• Super Community
House
• Corporate Governance/ Corporate Culture Innovation
• Business Portfolio / Business Model Innovation
• Network Reform• Product and Service
Innovation• Employees Productivity
Innovation
Group Power
New Management Plan “New Age’s Flag Bearer 5”Achievement under Past Business Plan
Ambitious 5

24
Assets under Custody ¥4.4 trn ¥6.1 trn
As of March 2012 As of March 2017
73% 58%
3 banks 6 banks
Retail Dependence Ratio
Allied Regional Banks
13 companies 50 companiesClients of Broker’s Broker Business
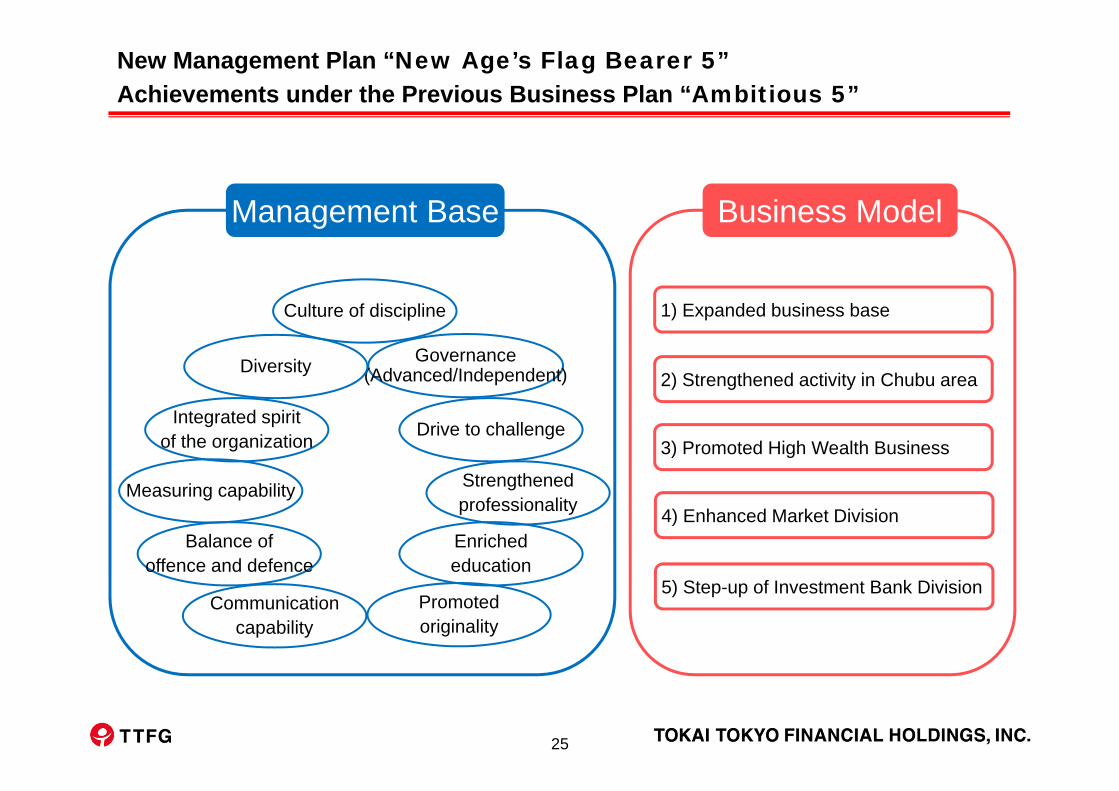
New Management Plan “New Age’s Flag Bearer 5”Achievements under the Previous Business Plan “Ambitious 5”
25%Assets under Custody of High Wealth Segment 14%
25
Governance(Advanced/Independent)Diversity
Culture of discipline
Integrated spiritof the organization Drive to challenge
Measuring capability Strengthenedprofessionality
Balance ofoffence and defence
Promotedoriginality
Communicationcapability
Enrichededucation
1) Expanded business base
2) Strengthened activity in Chubu area
3) Promoted High Wealth Business
4) Enhanced Market Division
5) Step-up of Investment Bank Division
Management Base
New Management Plan “New Age’s Flag Bearer 5”Achievements under the Previous Business Plan “Ambitious 5”
Business Model

26
1.0
6.0
11.0
16.0
21.0
26.0
31.0
200
7/4
200
8/4
200
9/4
201
0/4
201
1/4
201
2/4
201
3/4
201
4/4
201
5/4
201
6/4
201
7/4
対野村倍率
対大和倍率
350,000
1,350,000
2,350,000
3,350,000
4,350,000
5,350,000
野村
大和
0
50,000
100,000
150,000
200,000
250,000
300,000
350,000
2007/4
2008/4
2009/4
2010/4
2011/4
2012/4
2013/4
2014/4
2015/4
2016/4
2017/4
Tokai Tokyo
Market Cap Trend in comparison with Nomura and Daiwa
Achievements under the Previous Business Plan “Ambitious 5”
Nomura
Daiwa
Tokai Tokyo
Market Cap Multiple
Nomura/Tokai Tokyo
Daiwa/Tokai Tokyo
New Management Plan “New Age’s Flag Bearer 5”
2017
/10

27
Changing of Business Environment
Precaution forfinancial environment
②Era of disparity①Aged society
(Era of big inheritance)③Intensified
competitiveness ④Work style reform
Opaque,insecure
and uneasy era
Big Data
Accountaggregation Robot advisor
BlockchainAI
Digital era of- FinTech -
Fiduciary Duty
Governance
MonitoringBusiness
model
New guidanceby FSA
Geopolitical issues
New Management Plan “New Age’s Flag Bearer 5”

28
The Overall Picture
“New Age’s Flag Bearer 5”
Further Strengthen Operating Base and Achieve Growth Pursuit Strategic Themes
Productivity Revolution
Growth by M&A
Asset management
Pension and insurance service
Banking service
Overseas market expansion
Expansion to Metropolis
Organization
Defense Mechanism
Humanity
Professionality
Market & Investment
BankGreat Platform
Orqued’or
MONEQUE Matured
Unique development of retail strategy
New Management Plan “New Age’s Flag Bearer 5”
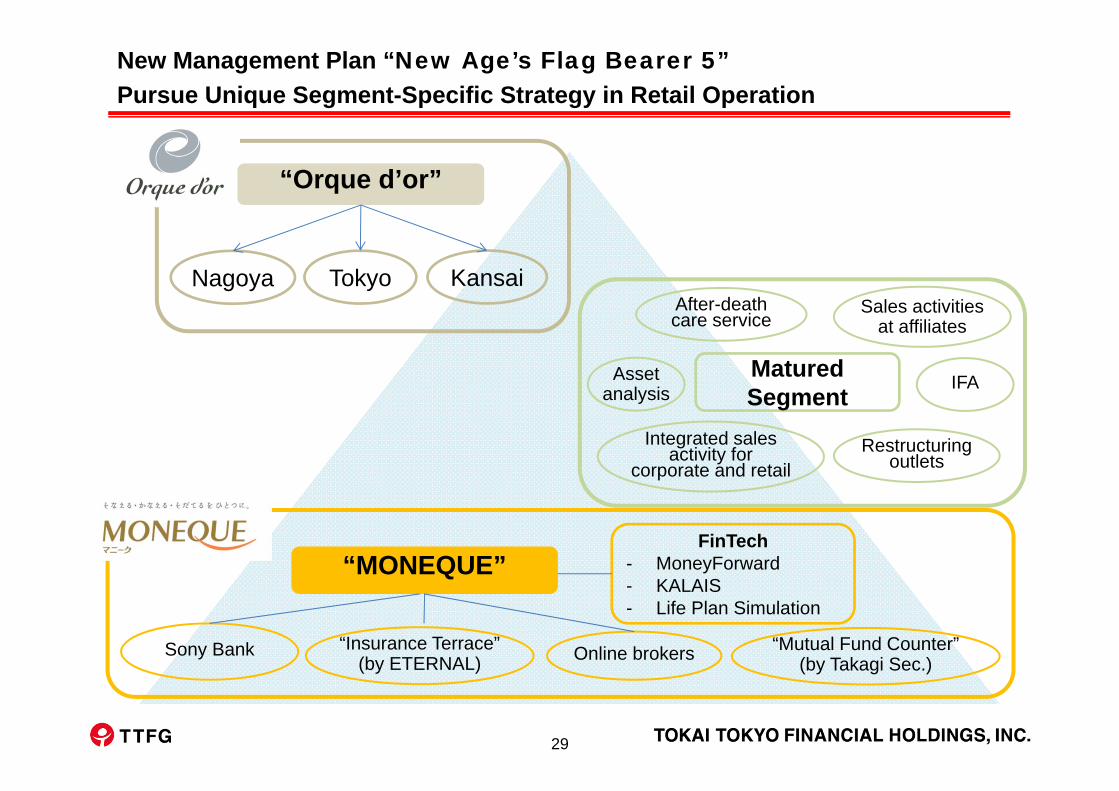
“MONEQUE”
Pursue Unique Segment-Specific Strategy in Retail Operation
“Orque d’or”
Nagoya Tokyo KansaiAfter-death care service
IFA
Restructuring outlets
Integrated sales activity for
corporate and retail
Asset analysis
Sales activities at affiliates
Matured Segment
Online brokers“Insurance Terrace”(by ETERNAL)
“Mutual Fund Counter”(by Takagi Sec.)
Sony Bank
FinTech- MoneyForward- KALAIS- Life Plan Simulation
29
New Management Plan “New Age’s Flag Bearer 5”

30
M&A
Financing
Underwriting bonds
Corporate FinanceMarket
Corporate Sales
Developing new product
Enhancement of location
Upgrading system & infra-
structure
Upgrading information
Global market
IPO
■ Strengthen Trilateral Approach
Market Division
■ Leap of Market Division
Developing new market globally
Strengthening manpower
New Management Plan “New Age’s Flag Bearer 5”

31
Organizational Administration Retail Sales Operation- Branch reorganization
- Sales force with new IT equipmentHuman Resource Management
Practice
System Infrastructure
Integrate all the group resources and pursue synergy for the group
Productivity RevolutionNew Management Plan “New Age’s Flag Bearer 5”
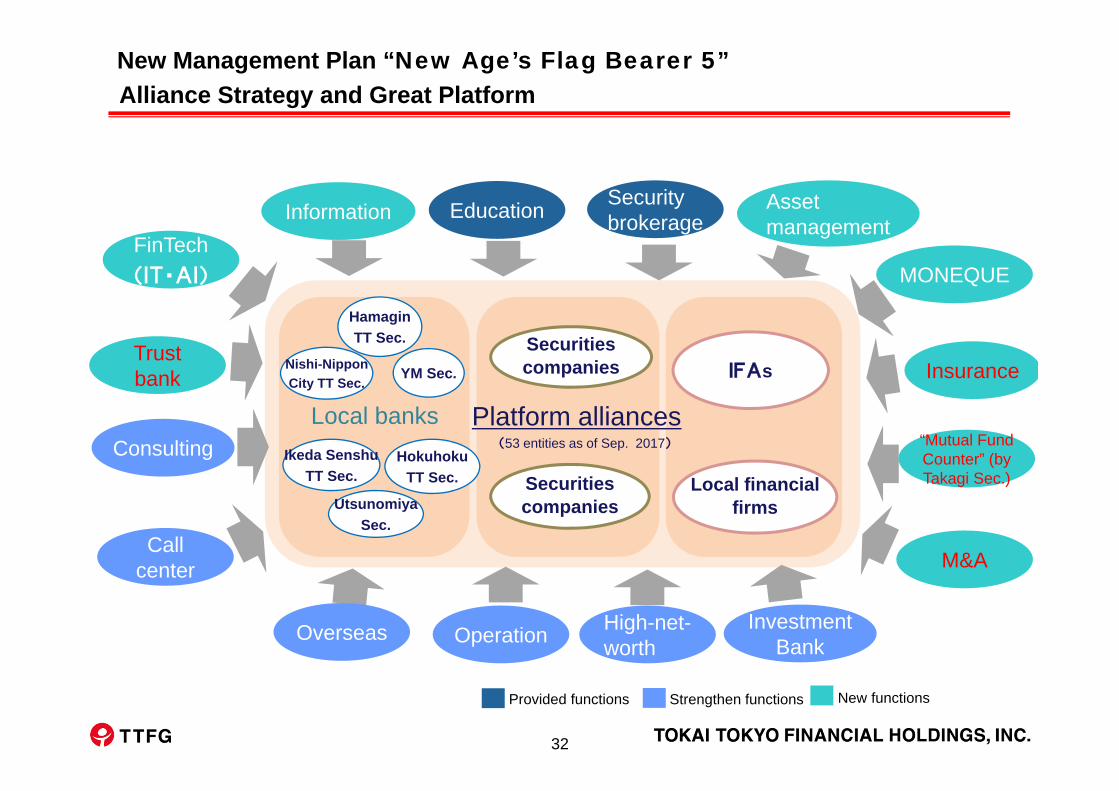
32
Local banks
HamaginTT Sec.
Nishi-NipponCity TT Sec.
Ikeda SenshuTT Sec.
Securitiescompanies
Provided functions Strengthen functions New functions
UtsunomiyaSec.
IFAs
Local financialfirms
YM Sec.
HokuhokuTT Sec.
FinTech(IT・AI)
Information
Call center
Investment Bank
Security brokerageEducation Asset
management
Overseas Operation
Insurance
High-net-worth
M&A
“Mutual Fund Counter” (by Takagi Sec.)
Consulting
Trust bank
MONEQUE
Securitiescompanies
Platform alliances(53 entities as of Sep. 2017)
Alliance Strategy and Great PlatformNew Management Plan “New Age’s Flag Bearer 5”

33
Area Strategy
Tokai Tokyo Securities :66 operating outlets
Tokai42 outlets
(33 in Aichi Pref.)
Kyushu1 outlets
Chugoku/Shikoku4 outlets
Kinki3 outlets
Koushin’etsu/Hokuriku2 outlets
Hokkaido/Tohoku1 outlets
Kanto13 outlets
(8 in Tokyo)
Utsunomiya Securities
(6 operating outlets)
(4 operating outlets)
YM Securities
Nishi-Nippon City TT
(16 operating outlets)
(19 operating outlets)
Hamagin TT
(16 operating outlets)
Senshu Ikeda TT
■Nationwide network and plan to expand in Kanto area
(As of June 30, 2017)
(3 operating outlets)Hokuhoku TT
Takagi Securities :14 operating outlets
JV Securities :64 operating outlets
New Management Plan “New Age’s Flag Bearer 5”
34
Inquiries to be directed to:
Effective April 1, 2009, the Company spun off its financial instrument operation and Tokai Tokyo Security Co., Ltd. (former Tokai Tokyo Securities Spin-off Preparation Co., Ltd.) took it over. The Group (Tokai Tokyo Financial Group) at the same time shifted to a holding company system.Effective the same date, the Company and Tokai Tokyo Securities Spin-off Preparation Co., Ltd. changed their corporate names to Tokai Tokyo Financial Holdings, Inc., and Tokai Tokyo Securities Co., Ltd. respectively.The result for the fiscal year ended on March 31, 2009 or any earlier date account for the operation of the former Tokai Tokyo Securities Co., Ltd. under then existing organizational structure.
Corporate Communications DepartmentTEL: +81-3-3517-8618 FAX: +81-3-3517-8314E-mail: [email protected]
This material is intended to provide information regarding the Company’s most recent operational result and NOT to solicit investment in securities issued by the Company.


![Hca ceo presentation prabha jessica [4.24]](https://static.fdocuments.us/doc/165x107/546928abaf7959b6258b5a03/hca-ceo-presentation-prabha-jessica-424.jpg)