Central dogma of molecular biology -...
48
Transcriptomics Marta Puig Institut de Biotecnologia i Biomedicina Universitat Autònoma de Barcelona
Transcript of Central dogma of molecular biology -...

Transcriptomics
Marta Puig Institut de Biotecnologia i Biomedicina
Universitat Autònoma de Barcelona

Central dogma of molecular biology

Genome
Proteome Transcriptome
Complete DNA content of an organism with all its genes and
regulatory sequences
Complete collection of proteins and their relative
levels in each cell
Transcription
Translation
Central dogma of molecular biology
Phenotype
Complete set of transcripts and their relative levels of expression in a particular cell or tissue under defined conditions at a given time

RNA profiling provides information about:
Expressed sequences and genes of a genome
Gene regulation and regulatory sequences
Function and interaction between genes
Functional differences between tissues and cell types
Identification of candidate genes for any given process or disease
Why is the study of RNA so important?

Methods
Alternative splicing
Types of transcripts
Regulatory sequences
ENCODE project
Overview

SINGLE GENES
Northern
RT-PCR
5’ and 3’ RACE
Quantitative RT-PCR (Real-Time RT-PCR)
WHOLE
TRANSCRIPTOME
EST sequencing
Microarrays
RNA-Seq
Transcriptome analysis methods

Transcriptome analysis using microarrays
Gene expression arrays - Quantification of transcript abundance - Single/multiple 3’ probes
Genome tiling arrays - Identification of transcribed sequences - Multiple probes covering the genome
Alternative splicing arrays - Quantification of different RNA isoforms - Probes in exons and exon-exon junctions
Gene
Probes
Gene
Probes
Inclusion form
Exclusion form

Brent (2008) Nature Reviews Genetics 9: 62-73
ESTs
Alignment with genome
cDNA synthesis
cDNA library
Sanger sequencing of insert ends
Expressed Sequence Tags (EST)

RNA-seq
AAAAA
Figure 1. Wang et al. (2009) Nature Reviews Genetics 10: 57-63
Sequencing of all the transcripts in a sample using NGS technologies

RNA-seq mapping of short reads in exon-exon junctions
CCGAAAATCAAGTCATCCCTAAAGACTAAGTAAGTAACCATATTACATTAAGGAAGGCACTTTAAAAGTTTATAATCATTTGTAGACTCCCACCAAAGCCACTGACTCGCAAGG
Exon Exon Intron
RNA-seq

Figures 1 and 2. Graveley et al. (2011) Nature 471: 473-479
Discovery of new transcripts by RNA-seq in D. melanogaster
RNA-seq examples
iab-8

Expression profile by RNA-seq of the D. melanogaster gene eve in different developmental stages
Quantification and determination of expression profiles
D. melanogaster RNA-seq data as shown in GBrowse (FlyBase)
RNA-seq examples

Independence of the existence of an available genomic sequence
Detection of new transcripts
Single-nucleotide precision
Detection of splicing variants and alternative transcription starts and ends
Detection of SNPs in transcribed regions
Detection of allele-specific transcription
Accurate quantification of expression levels (wide range of measurements)
Great reproducibility
Small amount of initial RNA needed
RNA-seq advantages

Table 1. Wang et al. (2009) Nature Reviews Genetics 10: 57-63
RNA-seq advantages

CTGAATAAATCCA
Polyadenylation signal
Methionine TRANSLATION INITIATION
Regulatory elements
Promoters
ACTGATGTCCA
TATA
TRANSCRIPTION START SITE
TRANSCRIPTION TERMINATION SITE
CCGATAAATCC STOP codon
TRANLATION TERMINATION
5’ UTR 3’ UTR
ORF
DNA
mRNA AAAAAAAAA
polyA tail
Splicing
mRNAs

Figure 1. Nielsen and Graveley (2010) Nature 463: 457-463 Figure 1. Li et al. (2007) Nature Reviews Neuroscience 8: 819-831.
Internal exons
Initial/final exons
Exon inclusion/skipping
Alternative 5’ splice site selection
Alternative 3’ splice site selection
Intron retention
Alternative splicing

Figure 8.22. Evolution. Barton et al. (2007) Cold Spring Harbor Laboratory Press
Alternative promoters Exon inclusion/skipping Alternative polyA sites
Alternative splicing example: α-tropomyosin
Alternative 3’ splice site selection

Figure 2. Nielsen and Graveley (2010) Nature 463: 457-463
Extreme alternative splicing examples
>500
38016
28
Number of isoforms

Xiao et al. (2010) WIREs Syst Biol Med DOI: 10.1002/wsbm.084
Alternative splicing analysis methods

Single-molecule sequencing of human transcriptome
Circular-consensus sequencing (SMRT, Pacific Biosciences)
Full-length RNA molecules up to 1.5 kb can be sequenced with little sequence loss at 5’ ends
>10% of alignments represent exon-intron structures that were not previously annotated
Sharon et al. (2013) Nature Biotechnology 31: 1009-1014

Prevalence of alternative splicing in Drosophila
7473 genes are alternatively spliced
60.7% out of 12295 expressed genes with multiple exons
Table 1. Graveley et al. (2011) Nature 471: 473-479

Figure 2. Wang et al. (2008) Nature 456: 470-476
92-94% of human genes show alternative splicing 86% of human genes generate two different transcripts in significant amounts (minor isoform frequency of 15%) Many alternative isoforms are produced in different tissues as a result of a specific regulation
Prevalence of alternative splicing in humans

Figure 1. Wang et al. (2008) Nature 456: 470-476
Tissue-regulated splicing variants in humans
Figure 2. Nielsen and Graveley (2010) Nature 463: 457-463
Not all possible isoforms exist
Regulation of alternative splicing
Figure 4. Graveley et al. (2011) Nature 471: 473-479
Developmentally regulated splicing variants in D. melanogaster

Genes tend to express many isoforms simultaneously
One isoform dominates in a given condition
12
0.3
75% of the protein-coding genes have at least two different major isoforms
Variability of gene expression contributes more than variability in splicing ratios to the variability of transcript abundance across cell lines
Figure 4. Djebali et al. (2012) Nature 489: 101-108
Regulation of alternative splicing in humans

Unanswered questions
How many of the observed isoforms are functionally relevant?
Can alternative splicing account for the higher complexity of some organisms?
Table 2. Nielsen and Graveley (2010) Nature 463: 457-463
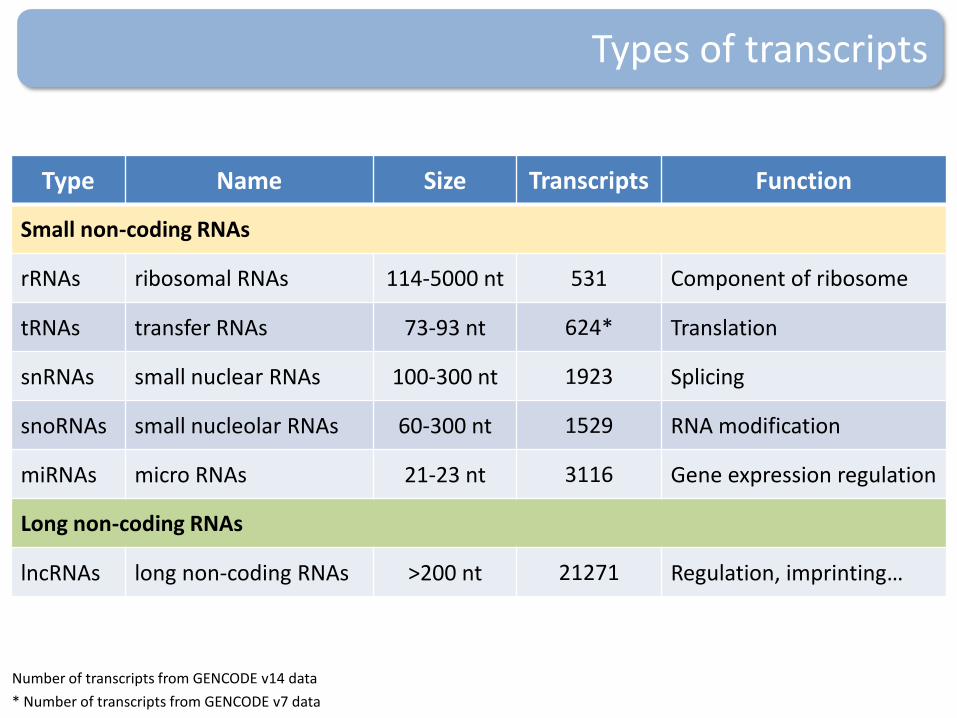
Type Name Size Transcripts Function
Small non-coding RNAs
rRNAs ribosomal RNAs 114-5000 nt 531 Component of ribosome
tRNAs transfer RNAs 73-93 nt 624* Translation
snRNAs small nuclear RNAs 100-300 nt 1923 Splicing
snoRNAs small nucleolar RNAs 60-300 nt 1529 RNA modification
miRNAs micro RNAs 21-23 nt 3116 Gene expression regulation
Long non-coding RNAs
lncRNAs long non-coding RNAs >200 nt 21271 Regulation, imprinting…
* Number of transcripts from GENCODE v7 data
Number of transcripts from GENCODE v14 data
Types of transcripts

rRNAs and tRNAs
rRNAs transcribed from a polycistronic transcript that is modified and processed to generate the mature 18S, 5.8S and 28S
rRNAs assemble with proteins to form the two subunits of the ribosome
tRNAs carry an amino acid to the protein synthetic machinery of a cell (ribosome) as directed by a three-nucleotide sequence (codon) in the mRNA
Essential components of the protein translation process
tRNAs
rRNAs

snRNAs snoRNAs
Dredge et al. (2001) Nature Reviews Neuroscience 2: 43-50 Eddy (2001) Nature Reviews Genetics 2: 919-929
snRNAs and snoRNAs
Part of the splicing machinery Guide chemical modifications of other RNAs

Figure 2. He and Hannon (2004) Nature Reviews Genetics 5: 522-531.
Small non-coding RNAs (21-23 nt) involved in the post-transcriptional regulation of gene expression by binding to the 3’ UTR of target mRNAs
Identified in the early 1990s, but recognized as a distinct class of regulators in the early 2000s
Detected in multiple species ranging from humans to mice, Drosophila, C. elegans or even plants (Arabidopsis)
Abundant in many cell types and may be involved in many different processes
Target around 60% of mammalian genes
microRNAs

Rinn and Chang (2012) Annual Review of Biochemistry 81: 145–166
Genomic organization
Definition Non-coding RNAs longer than 200 nucleotides
Long non-coding RNAs (lncRNAs)
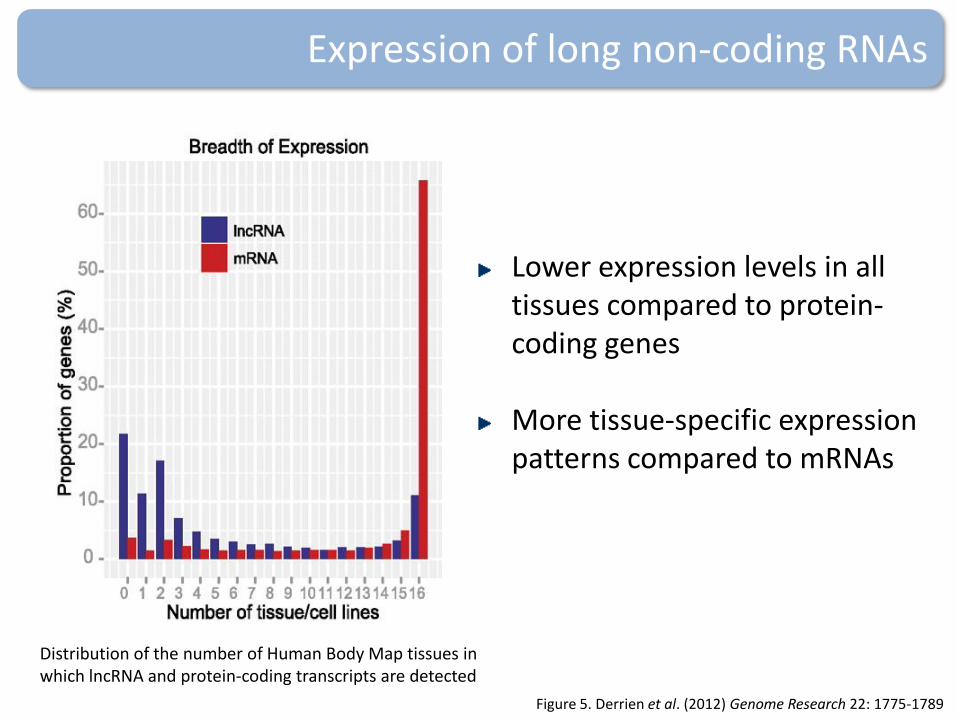
Figure 5. Derrien et al. (2012) Genome Research 22: 1775-1789
Lower expression levels in all tissues compared to protein-coding genes More tissue-specific expression patterns compared to mRNAs
Expression of long non-coding RNAs
Distribution of the number of Human Body Map tissues in which lncRNA and protein-coding transcripts are detected

Currently 21,271 annotated transcripts transcribed from 12,933 loci in the human genome Significantly more conserved than neutrally evolving sequences but at lower levels than protein-coding genes
Are lncRNAs functional?
Baker (2011) Nature Methods 8: 379–383
Byproduct
Guide
Scaffold
Long non-coding RNAs

3.1 kb
1 kb
Figure 2. Huarte and Rinn (2010) Hum. Mol. Genet. 19 :R152-R161
Examples of long non-coding RNAs
lincRNA-p21 represses many genes and results in cellular apoptosis GAS5 is induced under starvation and growth arrest. It competes with glucocorticoid receptor for DNA binding sites and results in reduced metabolism A lncRNA is transcribed from the promoter region of CCND1 induced for DNA damage, and recruits TLS protein to CCND1 (cyclin D1) and represses its expression, interrupting cell cycle

Figure 3. Harrow et al. (2012) Genome Research 22: 1760-1774
≈10,000
≈3,000
≈29
≈175
Definition Genes that have lost their coding ability
Types
Pseudogenes

863 pseudogenes are transcribed and associated with active chromatin in the human genome
Can pseudogenes have a function or they are just what remains of inactivated genes?
PTENP1 pseudogene protects PTEN from miRNA silencing, and therefore has a tumor suppressive function
Figure 1. Poliseno et al. (2010) Nature 465: 1033-1038
Pseudogenes

Mouse
Data from Su et al. (2004) PNAS 101: 6062-6067
Human
http://biogps.org
Transcript profiling across tissues

Transcript profiling across individuals
Figure 1. Cheung and Spielman (2009) Nature Reviews Genetics 10: 595-604
Different expression levels of a given gene are detected in different individuals

Regulatory changes have unique properties that could make them especially important in phenotypic evolution
Reduced pleiotropical effects
Fine-tuning of gene function
Co-dominance and more efficient selection
Coding vs. Regulatory changes

Lactase production in adults shows large variability in human populations and seems related with pastoralism
In most mammals ability to digest milk disapears with age and is related to the production of the lactase enzyme
Figure 1. Itan et al. (2010) BMC Evolutionary Biology 10:36
Persistence of lactase expression

Figure 1. Tishkoff et al. (2007) Nature Genetics 39: 31 - 40
Persistence of lactase expression

Regulatory elements are difficult to predict:
Small ( <50 pb)
Variable sequence motifs
Few nucleotide positions are really important
Poorly conserved and with not defined locations
Regulatory elements:
Core promoter
Proximal elements
Distal enhancers (upstream / downstream)
Figure 1. Ong and Corces (2011) Nature Reviews Genetics 12: 283-293
Regulatory elements

ChIP-seq
Figure 1. Massie and Mills (2008) EMBO reports 9: 337-343. Figure 2. Park (2009) Nature Reviews Genetics 10: 669-680.
Chromatin immunoprecipitation (ChIP) + Sequencing
Detection of transcription factor binding sites and other DNA-protein interactions

PHASES
• Pilot phase (2003-2007) 1% of human genome (44 regions, a total of ≈30 Mb)
• Production phase (2007-2012) Whole genome
ENCyclopedia Of DNA Elements
International project funded by the National Human Genome Research Institute (NHGRI) with the goal to identify all functional elements in the human genome.
ENCODE project
DATA http://genome.ucsc.edu/ENCODE/

Figure 1. Ecker et al. (2012) Nature 489: 52-55
ENCODE project – Functional elements

Maher (2012) Nature 489: 46-48
1,640 genome-wide data sets prepared from 147 cell types
ENCODE project data

A total of 62.1% and 74.7% of the human genome is covered by either processed or primary transcripts, respectively No cell line expresses more than 56.7% of the union of the expressed transcriptomes across all cell lines
A large number of previously unknown transcription start sites and new transcript isoforms have been identified
Thousands of new non-coding transcripts have been detected (22,531 long-noncoding RNAs)
An initial set of 399,124 regions with enhancer-like features and 70,292 regions with promoter-like features have been described
80% of the genome has been annotated with potentially functional elements
ENCODE project main results