Census Data Sources - About Us | Department of...
12
Census Data Sources Statistics Canada Census data at the census tract level or larger for 2006 and 2011 are now available for free on the Statistics Canada website: http://www.statcan.gc.ca/ Abacus (UBC Library) Dissemination area level 2006 Census data are available through the UBC Library’s data server Abacus. When the 2011 dissemination area data become available, they will be added to Abacus as well. “Topic-based Tabulations” are tables that have information about: • Immigration • Languages • Marital status • Labour force activity • Housing • Education • Age and sex The shapefile “Combined Dissemination Block Digital Boundary File and Geographic Attribute File, 2006” joins dissemination block polygons with information about: • Population • Private dwellings Or, you can search Abacus for other census and survey data tables. SimplyMap SimplyMap is a web-based program with the following types of Canadian data: • Adjusted census data 2006 • Demographic estimates for 2010, 2011 and 2015 • Household spending 2010, 2011 SimplyMap also has data for the United States, including: • Census data • Consumer expenditure • Marketing, business and consumer data
Transcript of Census Data Sources - About Us | Department of...

���������������� �
Census Data Sources
Statistics Canada
Census data at the census tract level or larger for 2006 and 2011 are now available for free on the
Statistics Canada website:
http://www.statcan.gc.ca/
Abacus (UBC Library)
Dissemination area level 2006 Census data are available through the UBC Library’s data server Abacus.
When the 2011 dissemination area data become available, they will be added to Abacus as well.
“Topic-based Tabulations” are tables that have information about:
• Immigration
• Languages
• Marital status
• Labour force activity
• Housing
• Education
• Age and sex
The shapefile “Combined Dissemination Block Digital Boundary File and Geographic Attribute File, 2006”
joins dissemination block polygons with information about:
• Population
• Private dwellings
Or, you can search Abacus for other census and survey data tables.
SimplyMap
SimplyMap is a web-based program with the following types of Canadian data:
• Adjusted census data 2006
• Demographic estimates for 2010, 2011 and 2015
• Household spending 2010, 2011
SimplyMap also has data for the United States, including:
• Census data
• Consumer expenditure
• Marketing, business and consumer data

Acquiring Census Data and Incorporating Files into GIS
Topic-based Tabulations in Abacus
1. Go to the Abacus website: http://abacus.library.ubc.ca/jspui/
2. Click the “UBC Member” link on the right under “Login to Abacus”
3. Log in using your CWL or library barcode and pin
4. In the search box, type “topic-based tabulations”
5. Click on “Census of Canada. Topic-based Tabulations, 2006.”

6. There are several tables that cover a variety of topics and geographic areas. Make sure that the
table you select includes dissemination areas if that is the level of geography that you are
looking for. In this example, let’s look for average income. There is a table that covers Income
and Earnings.
7. Click the link at the left to download the file. It is in the Beyond 20/20 format, but is
compressed into a ZIP file.
8. Unzip the file.
9. Open the file in Beyond 20/20.
10. Select Geography and drag it to the row heading.
11. Select Income and drag it to the column heading.

12. Drag any other headings to the top grey area to remove them from the table.
13. In the Presence of Income column headings, select the “Average 2005 Total Income $” column
to highlight it. Click on “Item” in the menu, select “Show”.
14. In the Geography column, select the British Columbia dissemination areas (all those beginning
with 59) by first clicking on the first entry, listed as British Columbia.
15. Scroll down the table until you find the last entry, just before Yukon Territory, hold down the
shift key and click on the last entry for British Columbia. Click on “Item” in the menu, select
“Show”.
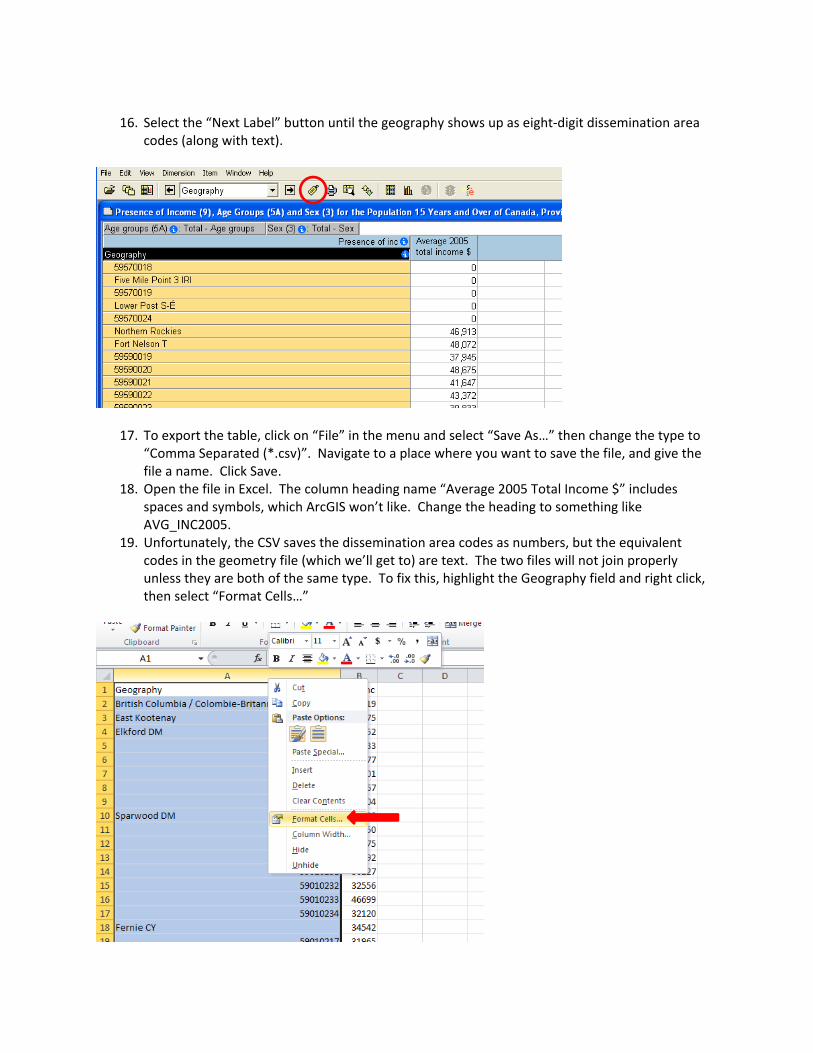
16. Select the “Next Label” button until the geography shows up as eight-digit dissemination area
codes (along with text).
17. To export the table, click on “File” in the menu and select “Save As…” then change the type to
“Comma Separated (*.csv)”. Navigate to a place where you want to save the file, and give the
file a name. Click Save.
18. Open the file in Excel. The column heading name “Average 2005 Total Income $” includes
spaces and symbols, which ArcGIS won’t like. Change the heading to something like
AVG_INC2005.
19. Unfortunately, the CSV saves the dissemination area codes as numbers, but the equivalent
codes in the geometry file (which we’ll get to) are text. The two files will not join properly
unless they are both of the same type. To fix this, highlight the Geography field and right click,
then select “Format Cells…”

20. Change the format to “text” and click OK.
21. Save the file as an Excel table and close it. (Keeping the file in CSV will not save this formatting
change.)
22. To download the geometry that goes with this file, search Abacus for the “Cartographic
Boundary Files” for 2006 and click on the link.
23. Select the file for British Columbia dissemination areas.
24. Save the file to a location and unzip it. This is a polygon shapefile.
25. In ArcMap, the polygon shapefile field “DAUID” can then be joined to the Excel table’s field
“Geography”.
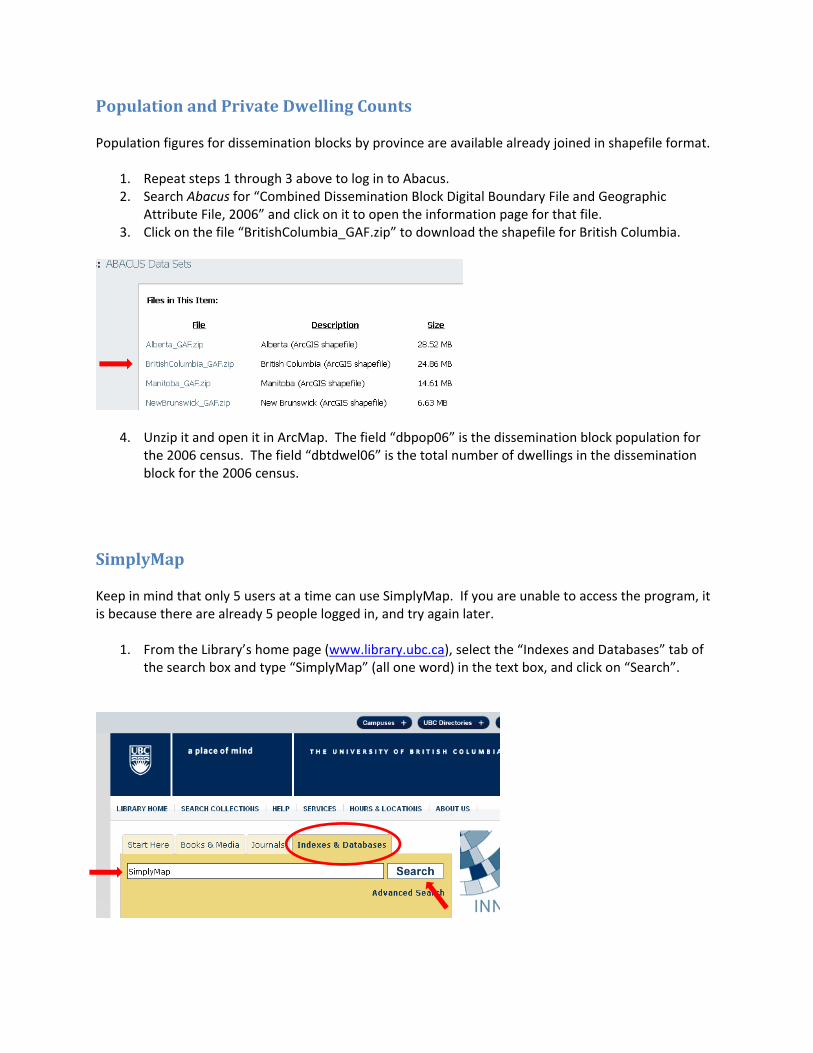
Population and Private Dwelling Counts
Population figures for dissemination blocks by province are available already joined in shapefile format.
1. Repeat steps 1 through 3 above to log in to Abacus.
2. Search Abacus for “Combined Dissemination Block Digital Boundary File and Geographic
Attribute File, 2006” and click on it to open the information page for that file.
3. Click on the file “BritishColumbia_GAF.zip” to download the shapefile for British Columbia.
4. Unzip it and open it in ArcMap. The field “dbpop06” is the dissemination block population for
the 2006 census. The field “dbtdwel06” is the total number of dwellings in the dissemination
block for the 2006 census.
SimplyMap
Keep in mind that only 5 users at a time can use SimplyMap. If you are unable to access the program, it
is because there are already 5 people logged in, and try again later.
1. From the Library’s home page (www.library.ubc.ca), select the “Indexes and Databases” tab of
the search box and type “SimplyMap” (all one word) in the text box, and click on “Search”.

2. On the results page, click on “SimplyMap”.
3. On the information page, click on “SimplyMap”.
4. On the login page, you can create your own account so that your work will be saved. Or, you
can just click the word “here” to open a temporary account that won’t save your work.
5. In this example, we want to create a table that shows the number of people in each
dissemination area in Vancouver who have master’s degrees. Click on “New Tabular Report” on
the top of the page, then click “Location Analysis Report”. This type of report allows us to
choose a variable and create a table for a geographic area broken down by dissemination areas
or census tracts.
6.

7. You are now on a new “Location Analysis” tab. Click on the “Variables” button to select a
variable.
8. For our example, click on “Adjusted Census Data 2006”, then in the next column click on
“Education” to expand the category. Click on “Highest Education Attained”. In the next column,
select the variable “# Highest Education Attained | Master’s degree”. In the last column, click
on “Use Variable”. Then click the X in the top right corner to close the dialogue box.
9. Click on the “Locations” button to select a geographic location.
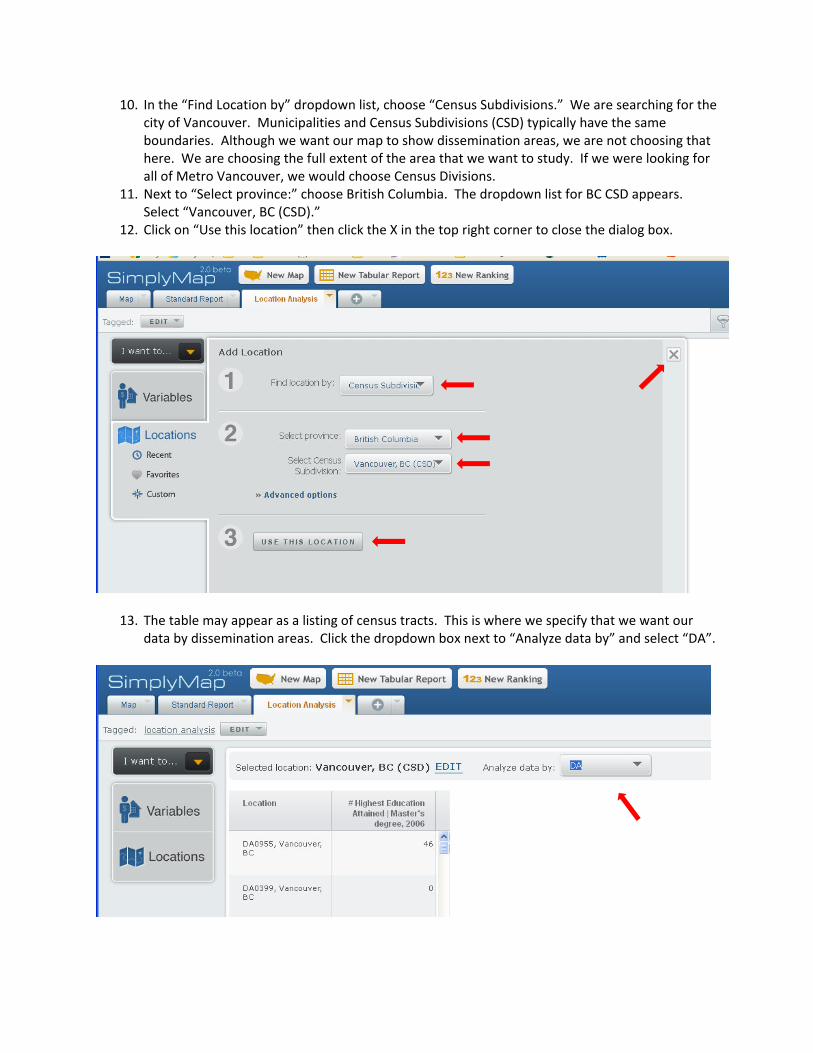
10. In the “Find Location by” dropdown list, choose “Census Subdivisions.” We are searching for the
city of Vancouver. Municipalities and Census Subdivisions (CSD) typically have the same
boundaries. Although we want our map to show dissemination areas, we are not choosing that
here. We are choosing the full extent of the area that we want to study. If we were looking for
all of Metro Vancouver, we would choose Census Divisions.
11. Next to “Select province:” choose British Columbia. The dropdown list for BC CSD appears.
Select “Vancouver, BC (CSD).”
12. Click on “Use this location” then click the X in the top right corner to close the dialog box.
13. The table may appear as a listing of census tracts. This is where we specify that we want our
data by dissemination areas. Click the dropdown box next to “Analyze data by” and select “DA”.
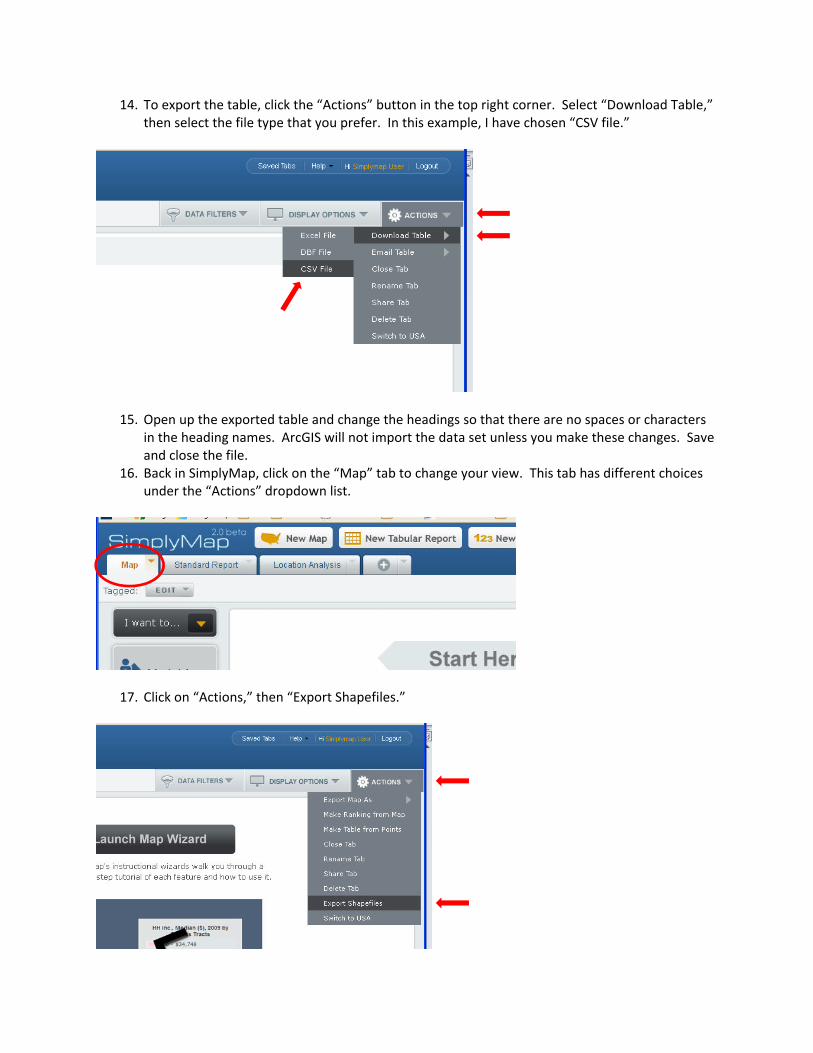
14. To export the table, click the “Actions” button in the top right corner. Select “Download Table,”
then select the file type that you prefer. In this example, I have chosen “CSV file.”
15. Open up the exported table and change the headings so that there are no spaces or characters
in the heading names. ArcGIS will not import the data set unless you make these changes. Save
and close the file.
16. Back in SimplyMap, click on the “Map” tab to change your view. This tab has different choices
under the “Actions” dropdown list.
17. Click on “Actions,” then “Export Shapefiles.”

18. In the dialogue box that appears, select the Geographic Unit (Dissemination Area in our example)
and Area (British Columbia) that you want for your polygon shapefile. Click “Save” and save the
file to the location of your choice. You will need to unzip the downloaded file before bringing it
into ArcGIS.
19. The table and shapefile can be joined in ArcGIS using the “LOCATION_N” field in the shapefile
and the “Location” field in the table.