Census Bureau - United States Department of Commerce · FY 2003 Performance In FY 2003, the Census...
36
Census Bureau T he U.S. Census Bureau’s mission is built around its large-scale surveys and censuses. This involves the full range of activities required to produce data, including survey and questionnaire design and data collection, processing, and dissemination. Research and data analysis will directly support the Census Bureau’s capabilities to conduct large- scale surveys and censuses. Through strategic planning, the Census Bureau evaluates how best to accomplish this mission. The strategic plan provides a framework for articulating program goals and builds these goals through consensus. The planning process promotes synergy, innovation, and efficiency, and represents a better way of doing business. The goal of the Census Bureau is to provide the best mix of timeliness, relevancy, quality, and cost for the data collected and services provided. The data provided by the Census Bureau shape important policy decisions that help improve the nation’s social and economic conditions: Census data are used to distribute hundreds of billions of dollars in federal funding. Census data provide the basis for estimating the gross domestic product (GDP) and leading economic indicators. Census data determine the apportionment of congressional seats, as mandated in the Constitution. Census data inform about education, income, poverty, and health insurance coverage. National, state, and local governments use Census data to formulate policy. Large corporations and local businesses use Census data to devise their business plans. To accomplish its mission, the Census Bureau depends on activities that: Provide the U.S. official measures on monthly unemployment, income, poverty, and health insurance coverage, as well as economic indicators that include housing starts, retail and wholesale trade sales; international trade; manufacturers’ shipments, orders, and inventories, and quarterly estimates of corporate profits. Provide the statistical foundation and benchmark measures against which most data-based decisions and activities take place. CENSUS BUREAU 119 F Y 2 0 0 3 P E R F O R M A N C E R E P O R T Mission Statement The Census Bureau serves as the leading source of quality data about the nation's people and economy. We honor privacy, protect confidentiality, share our expertise globally, and conduct our work openly. We are guided on this mission by our strong and capable workforce, our readiness to innovate, and our abiding commitment to our customers.
Transcript of Census Bureau - United States Department of Commerce · FY 2003 Performance In FY 2003, the Census...
Census Bureau
The U.S. Census Bureau’s mission is built around its large-scale surveys and censuses. This involves the full range ofactivities required to produce data, including survey and questionnaire design and data collection, processing, anddissemination. Research and data analysis will directly support the Census Bureau’s capabilities to conduct large-
scale surveys and censuses. Through strategic planning, the Census Bureau evaluates how best to accomplish this mission.The strategic plan provides a framework for articulating program goals and builds these goals through consensus. The planningprocess promotes synergy, innovation, and efficiency, and represents a better way of doing business.
The goal of the Census Bureau is to provide the best mix of timeliness, relevancy, quality, and cost for the data collected andservices provided. The data provided by the Census Bureau shape important policy decisions that help improve the nation’ssocial and economic conditions:
Census data are used to distribute hundreds of billions of dollars in federal funding.
Census data provide the basis for estimating the gross domestic product (GDP) and leading economic indicators.
Census data determine the apportionment of congressional seats, as mandated in the Constitution.
Census data inform about education, income, poverty, and health insurance coverage.
National, state, and local governments use Census data to formulate policy.
Large corporations and local businesses use Census data to devise their business plans.
To accomplish its mission, the Census Bureau depends on activities that:
Provide the U.S. official measures on monthly unemployment, income, poverty, and health insurance coverage, aswell as economic indicators that include housing starts, retail and wholesale trade sales; international trade;manufacturers’ shipments, orders, and inventories, and quarterly estimates of corporate profits.
Provide the statistical foundation and benchmark measures against which most data-based decisions and activitiestake place.
C E N S U S B U R E A U
119F Y 2 0 0 3 P E R F O R M A N C E R E P O R T
Mission Statement
The Census Bureau serves as the leading source of quality data about the nation's people and economy. We honorprivacy, protect confidentiality, share our expertise globally, and conduct our work openly. We are guided on thismission by our strong and capable workforce, our readiness to innovate, and our abiding commitment to our customers.

Re-engineer the 2010 Decennial Census of Population to improve the relevance and timeliness of census long-formdata, reduce operational risk, improve the accuracy of census coverage, and contain costs.
Invest in statistical methodological research and new technologies to improve current operations and prepare forthe future.
Continue to provide strict security of census information, address privacy issues, and foster program goals whilemaintaining confidentiality of census information.
Priorities/Management Challenges
To deliver the most value, the Census Bureau must target measurement on those trends and segments of the population andeconomy most critical to continued U.S. success and prosperity. During FY 2003, the Census Bureau focused activities inthese areas through a variety of priority program efforts that continue and improve ongoing statistical programs. They includeddistributing Census 2000 data, planning the 2010 Census, obtaining cyclical economic data through the Economic Census andthe Census of Governments, and distribution of data from the 2002 American Community Survey (ACS).
Changing priorities and goals became an issue in FY 2003. Working with its congressional committee, the Census Bureauwas commissioned to provide, and carried out, an extensive test on the ACS. The resources needed to complete this test wereobtained by shifting resources from activities contributing to the original performance goal of completing three evaluationreports by September 30, 2003. The Census Bureau focused on conducting and evaluating the test instead of work on threeevaluation reports. The test was successfully completed and the results were reported to Congress.
Last year’s report cited several management challenges, including: concerns from the public about the perceived intrusivenessof data collection efforts, continued decline in trust of government, sensitivity to the confidentialty of data, and a greaterdemand for quality, which have complicated the Census Bureau’s data gathering efforts and ability to maintain or increaseresponse rates. These challenges continue to be of concern, and are being addressed in concert with an added emphasis inthe Census Bureau’s mission statement to “honor privacy, protect confidentiality, … and conduct the Census Bureau’s workopenly.” To this end, the Census Bureau has enunciated privacy principles, conducted privacy impact assessments, begun toassess employee awareness, and is developing an external communications plan. Each of these components helps to ensurethat the Census Bureau is continually demonstrating its commitment to ensuring the quality, accessibility, and security of itsdata, and its ongoing sensitivity to privacy.
Business events in the last two years, the recession and slow recovery, and businesses’ growing objection to paperwork burdencontributed significantly to difficulties in gathering business data. This resulted in missing the target response rate on theEconomic Census. The Census Bureau took some innovative and aggressive promotional and respondent contact steps thatmay have prevented the response rate from declining even further. The Census Bureau will continue to actively work towardsmaintaining targeted response rates.
In addition, the Census Bureau must use state-of-the-art technology to stay ahead of the demand from policymakers foraccurate and timely information on emerging economic and societal trends. The current emphasis includes significant effortsfor the fiscal year 2004 Decennial Census test to study both the benefits and security concerns to transmitting potentiallysensitive data on mobile computing devices and the Internet.
C E N S U S B U R E A U
F Y 2 0 0 3 P E R F O R M A N C E R E P O R T120

FY 2003 Performance
In FY 2003, the Census Bureau had four goals, 14 measures, and 19 targets. The Census Bureau met or exceeded 16 ofthe targets.
The performance measures focused on providing and improving current measures of the U.S. population, economy,and governments; timely release of Decennial Census products; and the implementation of the 2010 Decennial Census. Thesemeasures promote the use of information in preserving and protecting the American public’s interests through the following:
Provided statistics that were critical to understanding current conditions in the U.S. economy, including principalfederal economic indicators.
Produced economic statistics that provided 75 percent of the source data used in preparing gross domestic productestimates, one of the nation's most important barometers of current economic activity.
Provided information on the labor, capital, and material inputs to, as well as the outputs of, the nation'smanufacturing, mining, and construction industries.
Conducted company-based surveys for the collection of financial data, including data on capital investment, income,payroll, assets, and expenditures.
Collected, processed, and compiled statistical data relating to U.S. merchandise trade (exports, imports, andtransportation) with foreign countries and Puerto Rico and the Virgin Islands; detailed trade information is availableon both a monthly and annual basis for 17,000 import commodities and 10,000 export commodities.
Conducted annual sample surveys of state and local government finances and employment, and produced quarterlymeasures of taxes and government assets.
Conducted surveys for other government agencies related to federal, state, and local government activities.
Undertook reimbursable activities (surveys and special tabulations) that take advantage of the economic program’sprocessing infrastructure and core competencies.
These economic conditions drive the interest rates of the United States, thus affecting consumer buying, confidence, andday-to-day living.
During FY 2003, the Census Bureau’s demographic statistics program successfully developed and implemented plans andprograms to collect, process, and disseminate information from surveys and censuses on the population and its characteristics,and on the size and characteristics of the housing inventory. Other surveys that measured housing characteristics (such ashome ownership), income, poverty, family composition, and the socioeconomic characteristics of race and ethnic groups weresuccessfully completed. These surveys provide information on home ownership, income levels, poverty and health insurancecoverage. Federal agencies, the Congress, and the states use these statistics as they consider modifying programs such asSocial Security, Medicare, and Medicaid.
The 2002 Economic Census provided a significant expansion to content and coverage, as well as an accelerated releaseschedule. New for the 2002 Economic Census content includes information on e-commerce and leased employees, first-timeservice product data for 65 service industries, and supply chain information from manufacturing, retail, wholesale, and someservice industries. Ensuring that coverage and release data are accurate and timely affects the daily lives of millions ofAmericans in their financial capabilities.
C E N S U S B U R E A U
121F Y 2 0 0 3 P E R F O R M A N C E R E P O R T

Targets and Performance SummarySee individual Performance Goal section for further description of each measure.
C E N S U S B U R E A U
F Y 2 0 0 3 P E R F O R M A N C E R E P O R T122
Performance Goal 1: Meet the Needs of Policymakers, Businesses and Non-Profit Organizations, and the Public for Current Measures of the U.S. Population, Economy, and Governments1
FY 2000 FY 2001 FY 2002 FY 2003 FY 2003 FY 2003 FY 2003Measure Actual Actual Actual Target Actual Met Not Met
(1) Household response ratefor the Current PopulationSurvey (CPS), the NationalCrime Victimization Survey(NCVS), and the AmericanHousing Survey (AHS)
(2) Response rate for theNational Health InterviewSurvey
(3) Response rate for theSurvey of Income andProgram Participation (SIPP)2
(1) Release data productsfrom the Survey of Incomeand Program Participation(SIPP)
(2) Release Data Productsfrom the Survey of ProgramDynamics
Release principal economicindicators
Unit response rates for annual economic surveysused to benchmark data during intercensal years(includes Annual Survey ofManufacturers, the AnnualTrade Survey (ATS), theAnnual Retail Trade Survey,and the Service AnnualSurvey (SAS)3
100%
MaintainedFY 1999actual timeachieved
New
New
100%
MaintainedFY 1999actual timeachieved
New
New
100%
MaintainedFY 1999actual timeachieved
100% ontime
New
(1) 90%
(2) 87%
(3) 62%
(1) Two dataproducts by9/30/03.
(2) One dataproduct by9/30/03.
Release all 116monthly andquarterly princi-pal economicindicatorsaccording topre-announcedtime schedule.
New
(1) 91%
(2) 88%
(3) 70%
(1) One data productwas released by9/30/03.
(2) One data productreleased on 4/30/03.
All principal economicindicators werereleased according totheir pre-announcedtime schedule.
New
X
X
X
X
X
N/A
X
N/A

C E N S U S B U R E A U
123F Y 2 0 0 3 P E R F O R M A N C E R E P O R T
Performance Goal 2: Support the Economic and Political Foundations of the United States by Producing Benchmark Measures of the Economy and Population for the Administration and Equitable Funding of Federal, State, and Local Programs4
FY 2000 FY 2001 FY 2002 FY 2003 FY 2003 FY 2003 FY 2003Measure Actual Actual Actual Target Actual Met Not MetImplementation of electronic reportingand 24/7 Internet helpdesk for the EconomicCensus
Conduct the EconomicCensus and Census ofGovernments
Response rate for theEconomic Census
(1) Release DecennialCensus products
(2) Release Census ofGovernments products
(3) Release EconomicCensus products
Conduct an evaluationprogram to measurethe effectiveness ofCensus operations andsurvey procedures
New
New
New
New
New
New
New
New
100% ofscheduledreleases
New
New
New
New
100% ofscheduledreleases
New
2002 EconomicCensus 24/7 Internethelp desk is opera-tional by 12/20/02.
(1) Complete initialmailing for the financephase of the Censusof Governments by10/31/02 and five million EconomicCensus forms by12/20/02.
(2) Complete initialmailing 2002 Surveyof Business Ownersforms to 1 millionbusinesses with paid employees by 9/30/2003.
84%
(1) Four data prod-ucts by 9/30/03.
(2) Two data productsby 9/30/03.
(3) None
Release eight evalua-tion topic reports by9/30/03.
On 11/15/02 the 24/7Internet/Help Desk was estab-lished. To date the site hasreceived more than nine millionhits, over 300,000 visits, andclose to 100,000 requests for extensions, remails, andadditional forms.
Initial mailing for the financephase of the Census ofGovernments was completedin October. By 12/20/02 somefive million Economic Censusforms had been mailed.
Initial mailing for the 2002Survey of Business Ownersforms to 1 million businesseswith paid employees wascompleted on 9/10/2003.
82%
(1) 5 data products werereleased by 9/30/03.
(2) Product number 1-Government Counts from theOrganization Survey wasreleased 1/03, almost 6months ahead of schedule.Product number 2-State byState Organization Report isbeing released on a flow basisbeginning 9/03, with all statesbeing released by 12/03.
(3) None
Released 14 Census 2000evaluation topic reports by9/30/03.
X
X
X
X
X
X
X
X

C E N S U S B U R E A U
F Y 2 0 0 3 P E R F O R M A N C E R E P O R T124
Performance Goal 3: Meet Constitutional and Legislative Mandates by Implementing a Re-Engineered 2010 Census that is Cost-Effective, Provides More Timely Data, Improves Coverage Accuracy, and Reduces Operational Risk5
FY 2000 FY 2001 FY 2002 FY 2003 FY 2003 FY 2003 FY 2003Measure Actual Actual Actual Target Actual Met Not MetImplement theAmericanCommunity Survey(ACS)
Implement MasterAddress File (MAF)/TopologicallyIntegratedGeographicEncoding andReferencing system (TIGER)modernization
Conduct early 2010Census planning,development andtesting
New
New
New
New
New
New
Completed fieldactivities support-ing the release of2001 data fromthe long formtransitional data-base in summerof 2002.
Prepared plan andsystems by end ofFY 2002 to meas-ure housing unitcoverage of theaddress list; list isat least as com-plete as it was for Census 2000,as measured by the accuracyand coverage evaluation.
New
Release three evalua-tion reports on the continuous measure-ment program by9/30/03.
Complete map featureand housing unit loca-tion corrections of 250counties by 9/30/03.6
Select 2004 Censustest sites by 12/31/02.
Develop and document designrequirements for 2004Census test by12/31/02.
Develop detailed opera-tional schedule for the2004 Census test inApril 2004 by 9/30/03.
Evaluation reports notreleased.
Completed map featurecorrections of 250 countiesby 9/30/03.
Selected 2004 Censustest sites by 12/31/02.
Developed and documented designrequirements for 2004Census Test by 12/31/02.
Developed detailed opera-tional schedule for the 2004Census Test by 9/30/03.
X
X
X

C E N S U S B U R E A U
125F Y 2 0 0 3 P E R F O R M A N C E R E P O R T
Performance Goal 4: Foster an Environment that Supports Innovation, Reduces Respondent Burden,and Ensures Individual Privacy7
FY 2000 FY 2001 FY 2002 FY 2003 FY 2003 FY 2003 FY 2003Measure Actual Actual Actual Target Actual Met Not Met
1 This goal has been reworded since the publication of the FY 2001 Annual Program Performance Report (APPR) and FY 2003 Annual Performance Plan (APP). This goalwas previously worded as: “Provide and improve current measures of the U.S. population, economy, and governments that meet the needs of policymakers, businesses,and the public.”
2 Prior to FY 2003 this measure was worded as "Percentage of household surveys with initial response rates greater than 90 percent." The Census Bureau met 100 percentof the stated target by obtaining response rates better than 90 percent for FY 1999 through 2002. For FY 2003, this measure was separated into three components. Thefirst component included response rates for the CPS, the NCVS, and the AHS.
3 This was not a reported measure in the FY 2001 APPR and FY 2003 APP. This is a new measure that will be reported in the FY 2004 APP. 4 This goal has been reworded since the publication of the FY 2001 APPR and FY 2003 APP. This goal was previously worded as: “Provide the statistical foundation and
benchmark measures of the population, economy, and government that meet the needs of policymakers, federal, state, and local governmental agencies, businesses andthe public.”
5 This goal has been reworded since the publication of the FY 2001 APPR and FY 2003 APP. This goal was previously worded as: “Re-engineer the 2010 Decennial Censusto be more efficient and cost effective, provide richer data, improve coverage, and reduce risk in meeting constitutional and legislative mandates.”
6 This measure was reworded with the publication of the FY 2004 APP to read: “TIGER features are within five meters of true GPS location for 7.7 percent of the nation’scounties by 9/30/03”. The Census Bureau is reporting against the measure as published in the FY 2003 APP and FY 2001 APPR.
7 This goal has been reworded since the publication of the FY 2001 APPR and FY 2003 APP. This goal was previously worded as: “Re-engineer the 2010 Decennial Censusto be more efficient and cost effective, provide richer data, improve coverage, and reduce risk in meeting constitutional and legislative mandates.”
8 This is not reported as a measure in FY 2003. This is reported as a new measure starting with the FY 2004 APP.
Response to the annual Boundary and AnnexationSurvey (BAS)
Meet milestone dates for Web-enabled portaltechnology demonstration project and forprototype imaging technology research project
Segment score for overall customer satisfaction onthe American Customer Satisfaction Index8
New
New
New
New
New
New
New
New
New
83%
100%
New
88%
100%
New
X
X
N/A N/A

Resource Requirements Summary(Dollars In Millions. Funding Amounts Reflect Total Obligations.) Information Technology (IT)Full-Time Equivalent (FTE)
Performance Goal 1: Meet the Needs of Policymakers, Businesses and Non-Profit Organizations, and the Public for Current Measures of the U.S. Population, Economy, and Governments1
FY 2000 Actual FY 2001 Actual FY 2002 Actual FY 2003Actual
Salaries and Expenses
Current Economic Statistics 88.9 102.7 111.3 122.9
Current Demographic Statistics 47.5 49.8 53.5 54.4
Survey Development and Data Services 3.5 3.8 4.1 N/A
Mandatory
Survey of Program Dynamics 9.9 10.0 9.9 9.9
Children’s Health Insurance Program 10.0 10.0 10.0 10.0
Periodic Censuses and Programs
Economic Censuses 47.5 41.4 52.1 N/A
Census of Governments 3.6 3.1 5.7 N/A
Intercensal Demographic 5.4 5.7 6.3 N/A
Continuous Measurement 19.9 21.2 26.4 N/A
Demographic Surveys Sample Redesign 5.1 7.9 12.4 N/A
Electronic Information Collection 5.4 6.1 6.2 N/A
Geographic Support 6.5 13.9 18.6 N/A
Data Processing Systems 11.4 11.8 11.6 N/A
Suitland Federal Center 0.0 0.1 1.2 N/A
Reimbursable Obligations 170.7 205.2 226.9 223.5
Total Funding 435.3 492.7 556.2 420.7
IT Funding5 100.0 100.1 157.6 41.7
FTE 5,462 5,931 6,457 4,626
C E N S U S B U R E A U
F Y 2 0 0 3 P E R F O R M A N C E R E P O R T126

Performance Goal 2: Support the Economic and Political Foundations of the United States by Producing Benchmark Measures of the Economy and Population for the Administration and Equitable Funding of Federal, State, and Local Programs 2
FY 2000 Actual FY 2001 Actual FY 2002 Actual FY 2003 Actual
Periodic Censuses and Programs
Economic Censuses New New New 86.4
Census of Governments New New New 6.5
Intercensal Demographic Estimates New New New 9.3
2000 Decennial Census 4,116.5 441.5 147.9 82.9
Demographic Surveys Sample Redesign New New New 12.1
Electronic Information Collection 0.6 0.0 0.0 N/A
Geographic Support 26.0 20.9 5.6 N/A
Data Processing Systems 11.3 11.7 11.5 N/A
Suitland Federal Center 0.0 0.2 0.9 N/A
Total Funding 4,154.4 474.3 165.9 197.2
IT Funding5 322.5 199.9 89.1 90.2
FTE 80,937 4,449 1,243 1,665
Performance Goal 3: Meet Constitutional and Legislative Mandates by Implementing a Re-Engineered 2010 Census that is Cost-Effective, Provides More Timely Data, Improves Coverage Accuracy, and Reduces Operational Risk 3
FY 2000 Actual FY 2001 Actual FY 2002 Actual FY 2003 Actual
Periodic Censuses and Programs
2010 Decennial Census New New 64.3 144.7
Geographic Support New New 13.0 N/A
Total Funding New New 77.4 144.7
IT Funding5 New New 44.7 79.8
FTE New New 598 1,076
C E N S U S B U R E A U
127F Y 2 0 0 3 P E R F O R M A N C E R E P O R T

Performance Goal 4: Foster an Environment that Supports Innovation, Reduces Respondent Burden,and Ensures Individual Privacy 4
FY 2000 Actual FY 2001 Actual FY 2002 Actual FY 2003 Actual
Salaries and Expenses
Survey Development and Data Services New New New 4.3
Periodic Censuses and Programs New New New New
Electronic Information Collection New New New 6.2
Geographic Support New New New 37.6
Data Processing System New New New 23.5
Suitland Federal Center Reconstruction New New New 1.5
Total Funding New New New 73.1
IT Funding5 New New New 29.7
FTE New New New 398
Grand Total FY 2000 Actual FY 2001 Actual FY 2002 Actual FY 2003 Actual
Salaries And Expenses 139.9 156.3 168.9 181.6
Periodic Censuses And Programs 4,259.0 585.5 383.8 410.7
Mandatory Programs 19.9 20.0 19.9 19.9
Total Funding7 4,589.5 967.0 799.5 835.7
Direct 4,418.8 761.8 572.6 612.2
Reimbursable6 170.7 205.2 226.9 223.5
IT Funding5 470.0 347.4 291.4 241.4
FTE 86,399 10,380 8,420 7,766
1This goal has been reworded since the publication of the FY 2001 APPR and FY 2003 APP This goal was previously worded a: “Provide and improve current measures of theU.S. population, economy, and governments that meet the needs of policymakers, businesses, and the public.”
2 This goal has been reworded since the publication of the FY 2001 APPR and FY 2003 APP This goal was previously worded as: “Provide the statistical foundation andbenchmark measures of the population, economy, and government that meet the needs of policymakers, federal, state, and local governmental agencies, businesses andthe public.”
3 This goal has been reworded since the publication of the FY 2001 APPR and FY 2003 APP. This goal was previously worded as: “Re-engineer the 2010 Decennial Censusto be more efficient and cost effective, provide richer data, improve coverage, and reduce risk in meeting constitutional and legislative mandates.”
4 This goal has been reworded since the publication of the FY 2001 APPR and FY 2003 APP. This goal was previously worded as: “Provide mission critical support for toolsand capabilities that improve processes, products and services for the Census Bureau’s surveys and censuses.”
5 IT Funding included in Total Funding. 6 Reimbursable Funding included in Total Funding.7 Total obligations in this table exclude Working Capital Fund obligations financed by other Census Bureau funds and already reflected in the results for the other funds.
Skills Summary:
Survey statisticians, mathematical statisticians, large-scale census and survey specialists, economists, geographers,demographers, program and management analysts, and information technology specialists.
C E N S U S B U R E A U
F Y 2 0 0 3 P E R F O R M A N C E R E P O R T128

FY 2003 Performance GoalsPerformance Goal 1: Meet the Needs of Policymakers, Businessesand Non-Profit Organizations, and the Public for Current Measures ofthe U.S. Population, Economy, and Governments
(This goal has been reworded since the publication of the FY 2001 APPR and FY 2003 Annual Performance Plan (APP).This goal was previously worded as: “Provide and improve current measures of the U.S. population, economy, andgovernments that meet the needs of policymakers, businesses, and the public.”)
Corresponding Strategic Goal
Strategic Goal 1: Provide the information and tools to maximize U.S. competitiveness and enable economic growth forAmerican industries, workers and consumers.
Rationale for Performance Goal
Demographic Statistics:
The Census Bureau’s demographic statistics program is responsible for:
Developing plans and programs to collect, process, and disseminate information from surveys and censuses on thepopulation and its characteristics, and on the size and characteristics of the housing inventory. The Census Bureauundertakes analytical research on emerging issues and trends, such as the condition of children and the elderly, theemployment of disabled individuals, and the characteristics of immigrants.
Directing and coordinating technical and developmental work on the collection and analysis of data by race, Hispanicorigin, and ancestry are major responsibilities.
Providing official statistics on income, poverty, and health insurance coverage, as well as longitudinal data on incomeand program participation that federal agencies use to develop, modify, and monitor income transfer programs, comefrom demographic programs. These data determine the impact of the Personal Responsibility and Work OpportunityReconciliation Act of 1996, often called welfare reform.
Conducting the foundational analysis and research underlying the U.S. Office of Management and Budget’s (OMB)decisions on national statistical standards on topics such as occupational classifications, metropolitan areas, and raceand ethnicity.
Planning and conducting surveys and special censuses funded by other federal agencies that focus on topics ofnational importance, such as unemployment, crime, health, housing, education, and consumer expenditures.
C E N S U S B U R E A U
129F Y 2 0 0 3 P E R F O R M A N C E R E P O R T

Economic Statistics:
The Census Bureau’s economic statistics program is responsible for:
Conducting more than 100 separate surveys monthly, quarterly, and annually, including principal economicindicators.
Producing voluminous merchandise export and import statistics monthly.
Accomplishing extensive compilations of administrative records.
Undertaking numerous research and technical studies.
Conducting a number of surveys under reimbursable agreements with other federal agencies.
FY 2003 Performance
The FY 2003 performance levels for most measures were achieved. During FY 2003, the Census Bureau’s demographicstatistics program staff successfully achieved most of the specified targets. The Census Bureau’s demographic statisticsprogram staff successfully developed and implemented plans and programs to collect, process, and disseminate informationfrom surveys and censuses on the population and its characteristics, and on the size and characteristics of the housinginventory. Other surveys that measured housing characteristics, such as home ownership, income, poverty, familycomposition, and the socioeconomic characteristics of race and ethnic groups were successfully completed.
For the FY 2003 budget cycle, the Census Bureau underwent its first Program Assessment Rating Tool (PART) process.This process is still ongoing; however, initial reaction from the OMB has been generally positive. OMB assessed three areasin the demographic statistics program, using the PART process:
Demographic Surveys Sample Redesign
Intercensal Demographic Estimates
Current Demographic Statistics
Formal recommendations resulting from the PART process will be reflected in the Census Bureau’s APP.
During FY 2003, the Census Bureau’s economic statistics program staff successfully:
Provided statistics that were critical to understanding current conditions in the U.S. economy, including principalfederal economic indicators.
Produced economic statistics that provided 75 percent of the source data used in preparing GDP estimates, one ofthe nation's most important barometers of current economic activity.
Provided information on the labor, capital, and material inputs to, as well as the outputs of, the nation'smanufacturing, mining, and construction industries.
Conducted company-based surveys for the collection of financial data, including data on capital investment, income,payroll, assets, and expenditures.
C E N S U S B U R E A U
F Y 2 0 0 3 P E R F O R M A N C E R E P O R T130

Collected, processed, and compiled statistical data relating to U.S. merchandise trade (exports, imports, andtransportation) with foreign countries and Puerto Rico and the Virgin Islands; detailed trade information is availableon both a monthly and annual basis for 17,000 import commodities and 10,000 export commodities.
Conducted annual sample surveys of state and local government finances and employment and produced quarterlymeasures of taxes and government assets.
Conducted surveys for other government agencies related to federal, state, and local government activities.
Undertook reimbursable activities (surveys and special tabulations) that take advantage of the economic program’sprocessing infrastructure and core competencies.
In FY 2003, work was also begun to improve the relevancy of the Census Bureau’s economic statistics. This was as a resultof the $10.7 million in addition to funding Congress provided in FY 2003 for the “Improved Measurement of Services” andthe “e-business” initiatives. Products that will come from these initiatives include:
A new principal economic indicator series, the Quarterly Services Survey. Data collection for this new quarterlyeconomic indicator, the first to be introduced by the Census Bureau in over 40 years and the first by any federalagency in 30 years, will begin in April 2004. Currently, the only measures of service industry activity are availableannually, 9-10 months after the reference period.
Additional service industry product detail that will be added incrementally to the Services Annual Survey (SAS).This program component will provide new annual data on service industry products (i.e., breakdowns of servicereceipts by industry). These data will be used by the Bureau of Economic Analysis (BEA), the Bureau of LaborStandards (BLS), and others to improve measures of economic growth, real output, prices, and U.S. productivitystatistics, helping to improve BEA’s national and industry accounts and BLS’ industry productivity measures.FY 2003 funding provides for services product detail being added incrementally to SAS over a three-year period.
New purchase services data that will be added incrementally to the SAS. This program enhancement provides newannual data on purchased services by industry, permitting BEA and the Federal Reserve Board to compute economicvalue added by particular service industries. The FY 2003 funding increase added the purchased services categoriesdescribed above to the SAS over a two-year period. Data collection occurred in January following the end of thereference year with dissemination no later than 12 months following the end of the reference year.
Expansion of the Annual Trade Survey (ATS) to include manufacturers’ sales branches and offices (MSBO).MSBO’s of large manufacturing companies have and are using e-business processes to change the way they dobusiness. These changing practices have resulted in consolidation and changing inventory levels and practices, yetthese businesses are only surveyed once every five years in the Economic Census. FY 2003 funds will expand the2003 ATS by covering MSBOs annually. The 2003 ATS will include a sample of about 1,600 MSBOs and will bemailed in early 2004 to collect data on total sales, e-commerce sales, and inventory where relevant. Providing BEAwith annual coverage of MSBOs will address a long-standing BEA priority to obtain accurate enumerations of$50 billion in wholesale inventories that they have had to estimate annually because these data are only collected inthe Economic Census. Receiving these data from the Census Bureau annually, instead of only once every five years,will enable BEA to improve its GDP estimates since inventory change is a key component of GDP estimates.
C E N S U S B U R E A U
131F Y 2 0 0 3 P E R F O R M A N C E R E P O R T
Expansion of the Annual Capital Expenditures Survey (ACES) to include information on information technology(IT) and related expenditures. The Census Bureau’s plan is to collect comprehensive and detailed annual data oneconomy-wide business expenditures for the information and communication technology (ICT) portion of thee-business infrastructure. Collected data will include all business spending, whether capitalized or expensed,associated with creating and maintaining the ICT infrastructure. The Census Bureau currently collects selectedcapitalized and expensed ICT data for various industries but most of these collections are limited to specific sectorsof the economy and are not collected annually. Such data gaps and lack of consistency among data collectionscreate problems for data users. In some sectors, the total cannot be calculated because the expensed data are notcollected. In others, the total cannot be calculated because the capitalized and expensed data are collected in differentyears. In addition to these inconsistencies and gaps among collections, the current ACES excludes expenditures forIT equipment that businesses expense but that economists consider investment. Excluding these expenses isconsistent with the ACES mission to collect capitalized expenditures only, but without data on these key ICTexpenditures, the gap between the business and economic concept is difficult to assess. Collection of the ICTinfrastructure data started with the 2003 ACES.
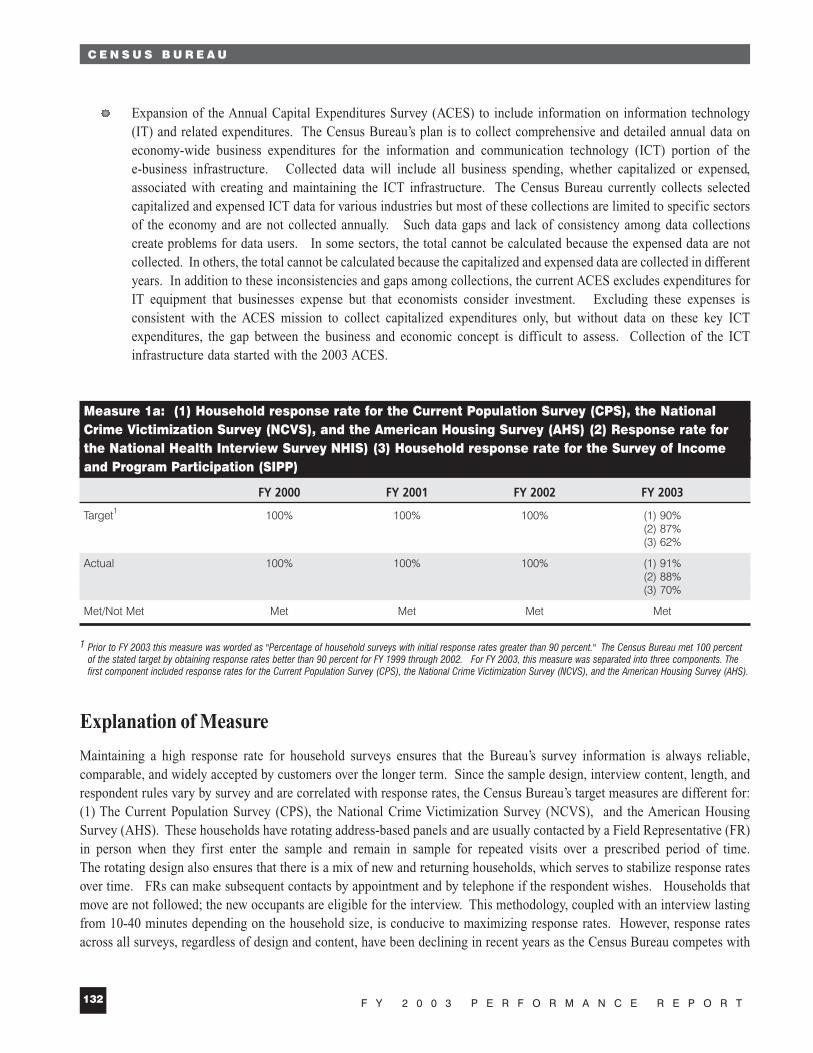
Measure 1a: (1) Household response rate for the Current Population Survey (CPS), the National Crime Victimization Survey (NCVS), and the American Housing Survey (AHS) (2) Response rate for the National Health Interview Survey NHIS) (3) Household response rate for the Survey of Income and Program Participation (SIPP)
FY 2000 FY 2001 FY 2002 FY 2003
Target1 100% 100% 100% (1) 90%(2) 87%(3) 62%
Actual 100% 100% 100% (1) 91%(2) 88%(3) 70%
Met/Not Met Met Met Met Met
1 Prior to FY 2003 this measure was worded as "Percentage of household surveys with initial response rates greater than 90 percent." The Census Bureau met 100 percentof the stated target by obtaining response rates better than 90 percent for FY 1999 through 2002. For FY 2003, this measure was separated into three components. Thefirst component included response rates for the Current Population Survey (CPS), the National Crime Victimization Survey (NCVS), and the American Housing Survey (AHS).
Explanation of Measure
Maintaining a high response rate for household surveys ensures that the Bureau’s survey information is always reliable,comparable, and widely accepted by customers over the longer term. Since the sample design, interview content, length, andrespondent rules vary by survey and are correlated with response rates, the Census Bureau’s target measures are different for:(1) The Current Population Survey (CPS), the National Crime Victimization Survey (NCVS), and the American HousingSurvey (AHS). These households have rotating address-based panels and are usually contacted by a Field Representative (FR)in person when they first enter the sample and remain in sample for repeated visits over a prescribed period of time.The rotating design also ensures that there is a mix of new and returning households, which serves to stabilize response ratesover time. FRs can make subsequent contacts by appointment and by telephone if the respondent wishes. Households thatmove are not followed; the new occupants are eligible for the interview. This methodology, coupled with an interview lastingfrom 10-40 minutes depending on the household size, is conducive to maximizing response rates. However, response ratesacross all surveys, regardless of design and content, have been declining in recent years as the Census Bureau competes with
C E N S U S B U R E A U
F Y 2 0 0 3 P E R F O R M A N C E R E P O R T132

other surveys and demands on the public’s time. (2) The National Health Interview Survey (NHIS) uses a different design inthat a household is in the sample only once, the FR has a short interval of time to conduct the interview, and the averageinterview length is 60 minutes, hence the lower target response rate of 87 percent. (3) The Survey of Income and ProgramParticipation (SIPP) is on average a 60-minute household interview and collects information on income, assets, transferprogram participation, and various other socio-economic topics. Since 1996, the SIPP has had “abutting” rather thanoverlapping panels, which means that at any given time, all households have been in sample for the same time period, i.e.,there is no replenishment of sample as in the CPS, NCVS, and AHS designs. In addition, respondents are interviewed everyfour months, are encouraged to consult their records and to report their social security number to ensure accurate data, andare followed to new locations if they move during the life of the panel, which is usually three to four years. These designfeatures, particularly the requirement to follow original household members, have contributed to sharp declines in panelresponse rates in recent years. The Census Bureau has taken several steps to maximize response such as monetary incentives,redesigned introductory letters and materials, and enhanced FR training. The target response rates consider the age of thepanel in the appropriate year. The SIPP has a household response rate target of 62 percent.
Beginning in FY 2003 this measure was expanded to include longitudinal surveys (such as SIPP and Survey of ProgramDynamics (SPD)) for which the high response rates are difficult to maintain over time.
FY 2003 Performance
With the exception of one data product from SIPP, the FY 2003 performance level for this measure was achieved. The CensusBureau was able to achieve a response rate of 90 percent or greater for the its cross-sectional household surveys. This measureexcludes household expenditure surveys. These response rates are developed during the data collection phase of the survey.
Measure 1b: (1) Release Data Products from the Survey of Income and Program Participation (SIPP)and (2) the Survey of Program Dynamics (SPD) (see the “Explanation of Measure” Section for Data Products List)
FY 2000 FY 2001 FY 2002 FY 2003
Target Maintain FY 1999 Maintain FY 1999 Maintain FY 1999 (1) Two data products actual time achieved actual time achieved actual time achieved by 9/30/03.
(2) One data product by 9/30/03.
Actual Maintained FY 1999 Maintained FY 1999 Maintained FY 1999 (1) One data product was actual time achieved actual time achieved actual time achieved released by 9/30/03.
(2) One data product released on 4/30/03.
Met/Not Met Met Met Met Not Met/Met1
1 There are two product measurements. This first was not met and the second was met.
Explanation of Measure
The Census Bureau has achieved optimal release times for many long-standing household surveys. For example, the Bureaureleases data from the AHS nine months after collection. Other household surveys have different schedules based on theirdesigns. This measure addresses newer surveys and survey supplements, such as SIPP and the SPD.
C E N S U S B U R E A U
133F Y 2 0 0 3 P E R F O R M A N C E R E P O R T

SIPP collects a “core” of data items on detailed income, program participation, and work experience at four-month intervalsfrom a cohort of households that are in the sample for approximately three years. Each four-month interval is referred to asa “wave” of interviewing and, in addition to the core items, questions measuring other aspects of household economic andsocial well-being are included as “topical modules” during each wave. The core data supplies longitudinal (studies in whichvariables relating to an individual or group of individuals are assessed over a period of time) measures over the life of thepanel while the topical module data supplies cross-sectional (studies that focus on phenomena that occur during a precise timeinterval, such as a calendar year) measures at one or more points in time.
The SPD is a follow-on survey conducted with SIPP respondents from the 1992 and 1993 panels who were last interviewedin 1995 and 1996, respectively, to comply with the Personal Responsibility and Work Opportunity Reconciliation Act of 1996,commonly known as the 1996 Welfare Reform Act.
FY 2003 Performance
While SIPP successfully produced the 2001 waves 1 through 4 longitudinal files planned for FY 2003, the 2001 waves 1 and2 topical module files were not completed during FY 2003. These topical modules provide extensive demographic historiesof the participants and require new disclosure avoidance procedures beyond those previously employed in order to respond tothe rapid growth in personally identified information available through the Internet. New disclosure protocols are beingdeveloped to address these issues. As a result, the 2001 waves 1 and 2 topical module files are expected to be released bythe end of calendar year 2003.
Measure 1c: Release Principal Economic Indicators
FY 2000 FY 2001 FY 2002 FY 2003
Target New New 100% on time Release all 116 monthly and quarterly principal economic indicators according to pre-announcedtime schedule.
Actual 100% on time 100% on time
Met/Not Met Met Met
Explanation of Measure
The Census Bureau provides statistics that are critical to understanding current conditions in the economy. These statisticsinclude the principal federal economic indicators that drive national monetary policy, federal economic policy-making andinvestment, and business decisions. These principal economic indicators include the:
Advance Retail Sales
Manufacturing and Trade: Inventories and Sales
Monthly Wholesale Trade
Advanced Report on Durable Goods, Manufacturers’ Shipments, Inventories, and Orders
Construction Put in Place
Quarterly Financial Report (QFR): Manufacturing, Mining, and Wholesale Trade
C E N S U S B U R E A U
F Y 2 0 0 3 P E R F O R M A N C E R E P O R T134
New Residential Construction
New Residential Sales
QFR: Retail
Housing Vacancies
The U.S. International Trade in Goods and Services—jointly released with the BEA1
OMB Statistical Directive No. 3 requires that data for Census Bureau principal economic indicators be released withinprescribed time periods. For most monthly indicators this means that they must be made available within one month of theend of the reference period, and for the quarterly indicators within two and a half months. Release dates for these indicatorsare available online at www.census.gov/epcd/econ/www/indijun.htm. The Census Bureau’s goal is to release all 116 monthlyand quarterly principal economic indicators on time.
FY 2003 Performance
During FY 2003, all principal economic indicators were released on time. The Census Bureau’s principal economic indicatorsare among some of the most important and closely followed statistics generated by the federal statistical system. Theseindicators provide government policymakers and private decisionmakers with timely information about the currentperformance of the U.S. economy.
Program Evaluation
The Census Bureau’s statistical program evaluations are numerous and ongoing. One measure the Bureau uses to determinedata reliability is response rates. Another measure the Bureau uses to determine timeliness is the elapsed time from datacollection to data release.
Demographic Statistics
The Census Bureau regularly generates quality profiles and management reports for both reimbursable and Bureau-sponsoreddemographic surveys. These profiles and reports provide statistical measures of reliability and note compliance with oraccomplishment of project tasks.
Economic Statistics
Regular evaluations of programs by the economic statistics staff have led to better measures of capital expenditures by U.S.companies, improved the Bureau’s ability to capture data on e-commerce activities, and clarified the information companiescan provide on their pollution abatement activities. Also, every three years, as required by statistical directive no. 3, the CensusBureau prepares a report for OMB on the compilation, release, and evaluation of the principal economic indicators that theBureau produces. The evaluation component assesses the accuracy and reliability of the published data.
C E N S U S B U R E A U
135F Y 2 0 0 3 P E R F O R M A N C E R E P O R T
1 Previously, the U.S. International Trade in Goods and Services measure was reported in the BEA’s APPR and APP with reference to the Census Bureau’s data collection andprocessing responsibilities.

Performance Goal 2: Support the Economic and Political Foundationsof the United States by Producing Benchmark Measures of theEconomy and Population for the Administration and EquitableFunding of Federal, State, and Local Programs(This goal has been reworded since the publication of the FY 2001 APPR and FY 2003 APP. This goal was previously wordedas: “Provide the statistical foundation and benchmark measures of the population, economy, and government that meet theneeds of policymakers, federal, state, and local governmental agencies, businesses and the public.” )
Corresponding Strategic Goal
Strategic Goal 1: Provide the information and tools to maximize U.S. competitiveness and enable economic growth forAmerican industries, workers, and consumers.
Rationale for Performance Goal
The Census Bureau’s benchmark programs are a major source of baseline information upon which most data-based decisionsand activities take place. Whether gathered through the Decennial Census of Population and Housing, the Economic Census,the Census of Governments, or the Intercensal Demographic Estimates that provide baseline demographic information inbetween the decennial censuses, the Census Bureau’s benchmark programs are where everyone turns to for information.
The demographic programs provide the data used by the states and other agencies to:
Allocate nearly $200 billion dollars in federal funds each year.
Conduct the analyses that underlie the statistical definitions and standards used by the entire Federal Governmentin policy decisions.
Establish the baseline sample units that underlie virtually every survey conducted in the United States by both privateand public sectors.
The economic statistics programs count and profile U.S. businesses and government organizations in a rapidly evolvingeconomic environment. They include conducting an Economic Census and a Census of Governments every five years.The Economic Census covers all nonagricultural sectors of the economy, publishes data on the activities of more than22 million businesses and more than 1,100 industries, and provides detailed geographic information.
As a complement to the sectoral Economic Census program components, the Census Bureau also conducts a series of relatedprograms to collect information on topics of special interest—for example, minority and women-owned businesses, thecharacteristics of the nation's trucking fleet; business expenses; the flow of commodities; and the economies of Puerto Rico,Guam, the Virgin Islands, American Samoa, and the Northern Mariana Islands.
The Census of Governments represents the primary source of facts about the structure and function of the public sector of theU.S. economy. It provides essential information to Congress and federal agencies for planning and evaluating programs thatinvolve intergovernmental relationships. The census contributes an important element for constructing composite nationaleconomic measures, such as GDP, BEA’s input-output tables that measure market sectors, and the Federal Reserve Board’s
C E N S U S B U R E A U
F Y 2 0 0 3 P E R F O R M A N C E R E P O R T136

flow of funds accounts that provide time-series data of financial flows in the economy. The Census of Governments’ findingssupply vital analytical tools for a wide variety of data users. Among the most prominent are state and local governmentofficials, educational organizations, criminal justice organizations, public interest groups, private industry, economic researchagencies, and the media.
The Census Bureau’s Performance Goal 2 focuses on the major conduct and dissemination milestones for the 2002 Economicand Government Censuses and providing improved demographic intercensal estimates. Specific performance goals andmeasures related to these activities include
Publishing and disseminating data from the 2002 Economic Census and the 2002 Census of Governments on atimely, scheduled basis.
Mailing Survey of Business Owners forms for the 2002 Economic Census.
FY 2003 Performance
Primary activities concentrated on collecting and processing data for the Economic Census and Census of Governments.The 2002 Economic Census provided a significant expansion to content and coverage, as well as an accelerated releaseschedule. New for the 2002 Economic Census content includes information on e-commerce and leased employees, first-timeservice product data for 65 service industries, and supply chain information from manufacturing, retail, wholesale, and someservice industries. This included the mailing of more than five million Economic Census forms to businesses. Except forMeasure 2c (obtain an 84 percent response rate for the Economic Census), all performance targets were met during FY 2003.The Economic Census data provides detailed information on the structure of the economy. Some data uses include:
Public sector — benchmarking, tracking economic change, assisting business development, and attracting newbusinesses.
Private sector — study your industry (market share, product trends, and strategic planning), study business markets,and evaluate investments.
Measure 2a: Implementation of Electronic Reporting and 24/7 Internet Help Desk for the Economic Census
FY 2000 FY 2001 FY 2002 FY 2003
Target New New New 2002 Economic Census 24/7 Internet Help Deskis operational by 12/20/02.
Actual On 11/15/02, more than a month ahead of schedule, the 24/7 Internet/Help Desk was established to expedite the handling of respondents’ information requests.
Met / Not Met Met
C E N S U S B U R E A U
137F Y 2 0 0 3 P E R F O R M A N C E R E P O R T

Explanation of Measure
This is a new performance measure for FY 2003. For the Economic Census, the Census Bureau followed a strategy thatmaximized response and minimized reporting burden. In order to do this, it is absolutely critical that the electronic reportingoption and customer relations management programs be rolled out in a timely manner.
Over the past decade the Census Bureau has introduced a number of initiatives aimed at automating the collection anddissemination of economic statistics. These initiatives have been driven by external demand for services, available technology,requirements of the Paperwork Reduction Act and Government Paperwork Elimination Act, and efforts to facilitate andsimplify reporting, improve quality, and reduce data collection costs. The overall electronic reporting strategy has been tofocus on the most burdensome surveys, provide respondents with functionality that facilitates and simplifies reporting withoutrequiring the programming or data processing expertise, and is cost beneficial to the Census Bureau.
The 1987 Economic Census was the first census to permit a limited number of large companies to report economic censusdata on magnetic tape. In response to demands from large companies, the Census Bureau broadened the magnetic tapereporting program in the 1992 Economic Census and developed an Electronic Data Interchange capability for use by largeretailers. Electronic reporting initiatives for the 1997 Economic Census, like previous censuses, focused on large,homogeneous retail enterprises. For retail companies the Census Bureau developed a computerized self-administeredquestionnaire that covered 27 different economic census report forms. The Census Bureau received more than 200,000 retailestablishment forms electronically, but because of timing and resource constraints it did not fully revamp the Census Bureau’sprocessing systems. While non-retail establishments were permitted to file using a standard spreadsheet format, mostcompanies did not follow the instructions and this resulted in significant processing problems.
The Census Bureau’s experience has demonstrated that implementing an electronic reporting capability, if done effectively,demands substantial Bureau resources and significant changes to existing processing systems. An ambitious electronicreporting capability was introduced for the 2002 Economic Census. The Census Bureau’s plan offered Web-based reportingto all 3.5 million participating businesses. If successful, the Census Bureau expects that both respondent burden and CensusBureau data processing costs will be reduced.
Also, as part of the Census Bureau’s strategy to exploit the Web, a 24/7 Internet site was established to provide assistance to2002 Economic Census respondents. The site provided the user with functionality, including the ability to get replacementforms, file extensions, download and submit electronic versions of the census, and to inactively ask and receive answers toquestions. The effectiveness of the site will be part of the post-census evaluation. The evaluation will be based on the resultsof a customer satisfaction survey and the more traditional metrics such as number of hits, visits, downloads, etc.
FY 2003 Performance
On November 15, 2002, more than a month ahead of schedule, the 24/7 Internet Help Desk was established to expedite thehandling of respondents’ information requests. To date, the site has received more than nine million hits, over 300,000 visits,and responded to more than 100,000 requests for extension, re-mails, and additional forms. With the 2002 Economic Censusa major milestone in collecting data from companies was achieved by offering more than 3.5 million businesses the opportunityto file electronically via the Internet. Almost 440,000 establishments filed their reports electronically. This representsabout 12 percent of the total reports filed. In fact, three out of four responses by our nation’s largest companies weresubmitted electronically.
C E N S U S B U R E A U
F Y 2 0 0 3 P E R F O R M A N C E R E P O R T138
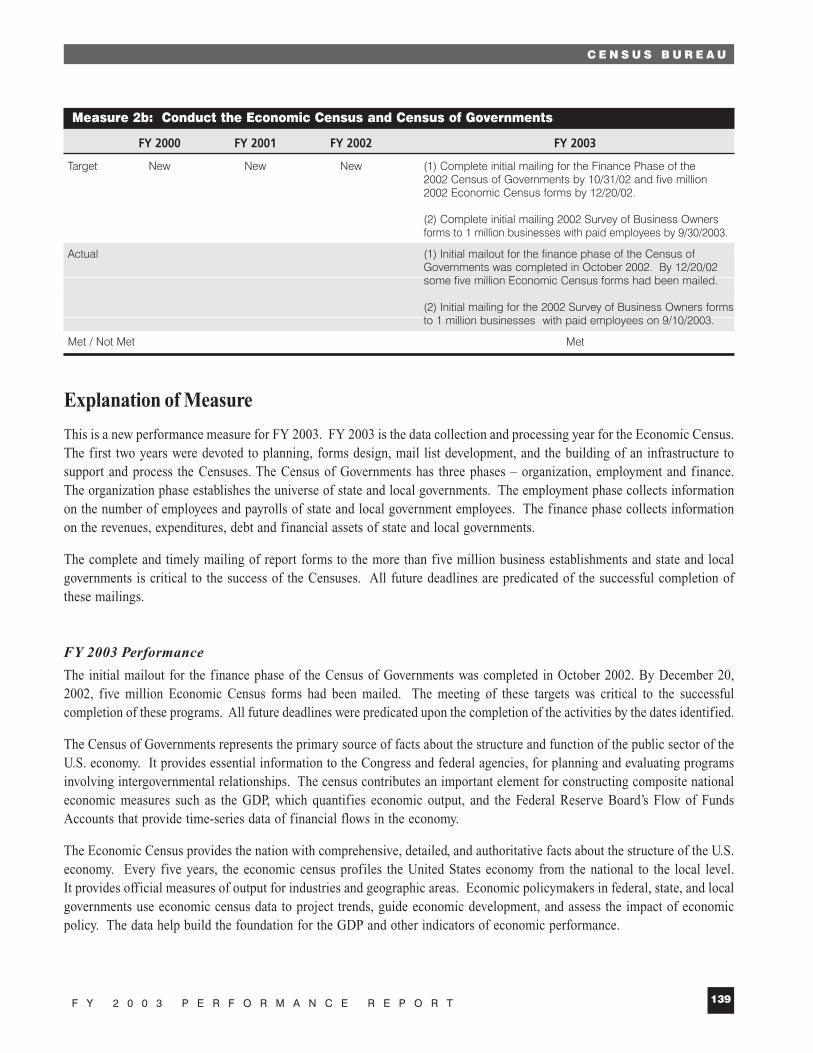
Measure 2b: Conduct the Economic Census and Census of Governments
FY 2000 FY 2001 FY 2002 FY 2003
Target New New New (1) Complete initial mailing for the Finance Phase of the2002 Census of Governments by 10/31/02 and five million2002 Economic Census forms by 12/20/02.
(2) Complete initial mailing 2002 Survey of Business Ownersforms to 1 million businesses with paid employees by 9/30/2003.
Actual (1) Initial mailout for the finance phase of the Census ofGovernments was completed in October 2002. By 12/20/02 some five million Economic Census forms had been mailed.
(2) Initial mailing for the 2002 Survey of Business Owners formsto 1 million businesses with paid employees on 9/10/2003.
Met / Not Met Met
Explanation of Measure
This is a new performance measure for FY 2003. FY 2003 is the data collection and processing year for the Economic Census.The first two years were devoted to planning, forms design, mail list development, and the building of an infrastructure tosupport and process the Censuses. The Census of Governments has three phases – organization, employment and finance.The organization phase establishes the universe of state and local governments. The employment phase collects informationon the number of employees and payrolls of state and local government employees. The finance phase collects informationon the revenues, expenditures, debt and financial assets of state and local governments.
The complete and timely mailing of report forms to the more than five million business establishments and state and localgovernments is critical to the success of the Censuses. All future deadlines are predicated of the successful completion ofthese mailings.
FY 2003 Performance
The initial mailout for the finance phase of the Census of Governments was completed in October 2002. By December 20,2002, five million Economic Census forms had been mailed. The meeting of these targets was critical to the successfulcompletion of these programs. All future deadlines were predicated upon the completion of the activities by the dates identified.
The Census of Governments represents the primary source of facts about the structure and function of the public sector of theU.S. economy. It provides essential information to the Congress and federal agencies, for planning and evaluating programsinvolving intergovernmental relationships. The census contributes an important element for constructing composite nationaleconomic measures such as the GDP, which quantifies economic output, and the Federal Reserve Board’s Flow of FundsAccounts that provide time-series data of financial flows in the economy.
The Economic Census provides the nation with comprehensive, detailed, and authoritative facts about the structure of the U.S.economy. Every five years, the economic census profiles the United States economy from the national to the local level.It provides official measures of output for industries and geographic areas. Economic policymakers in federal, state, and localgovernments use economic census data to project trends, guide economic development, and assess the impact of economicpolicy. The data help build the foundation for the GDP and other indicators of economic performance.
C E N S U S B U R E A U
139F Y 2 0 0 3 P E R F O R M A N C E R E P O R T

Measure 2c: Response Rate for the Economic Census
FY 2000 FY 2001 FY 2002 FY 2003
Target New New New 84%
Actual 82%
Met / Not Met Not Met
Explanation of Measure
Maintaining response rates consistent with previous censuses is critical to the Census Bureau’s mission. Stakeholders rely on CensusBureau data to accurately portray the structure of the economy. High response rates are crucial to the reliability of these data.
FY 2003 Performance
As of the end of FY 2003, the response rate for the 2002 Economic Census was 82 percent. While the target was missed, hadsome innovative and aggressive promotion and respondent contact steps not been taken, the response rate may have declined evenmore. Business events in the last two years, the recession and slow recovery, and businesses’ growing objection to paperworkburden likely contributed to the lower response rate. At the time it became clear to the Census Bureau that the goal would not bemet, despite implementing all planned activities, a follow-up plan of action was developed.
Additional activities were initiated to further increase the response rate. Actions, beyond those initially planned, includedincreased and more targeted follow-up mailings, a stepped up telephone follow-up program, and a special campaign informingfirms of the penalties for not responding. These actions, as well as others, constituted the multi-dimensional plan used by theCensus Bureau to address response issues. The plan is outlined below:
An account manager program for the top 1,000 companies. Reports from these companies ultimately provide datafor close to 500,000 locations.
Three form follow-ups to two million single-location companies and to all small and medium-sized multi-locationcompanies.
An extensive promotion and outreach program.
A 24/7 Internet help site and toll-free telephone assistance.
Offering an electronic reporting option to all 3.5 million business locations participating in the census.
Actions taken to mitigate the decline in response rate included:
Having staff at the Census Bureau’s National Processing Center call non-responding medium-sized companies in July.
Having account managers call their non-responding companies in June and July.
Sending a letter, signed by Under Secretary Cooper, to the largest 39 noncompliant companies informing them oftheir legal obligation to comply.
C E N S U S B U R E A U
F Y 2 0 0 3 P E R F O R M A N C E R E P O R T140
Sending 40,000 non-responding single location companies a priority-mail letter from the Department of Commerce’sOffice of General Counsel informing them of their legal obligation, to comply and potential penalties fornon-compliance.
In addition to the actions outlined above, an intensive telephone follow-up effort is being conducted by senior-level CensusBureau staff.
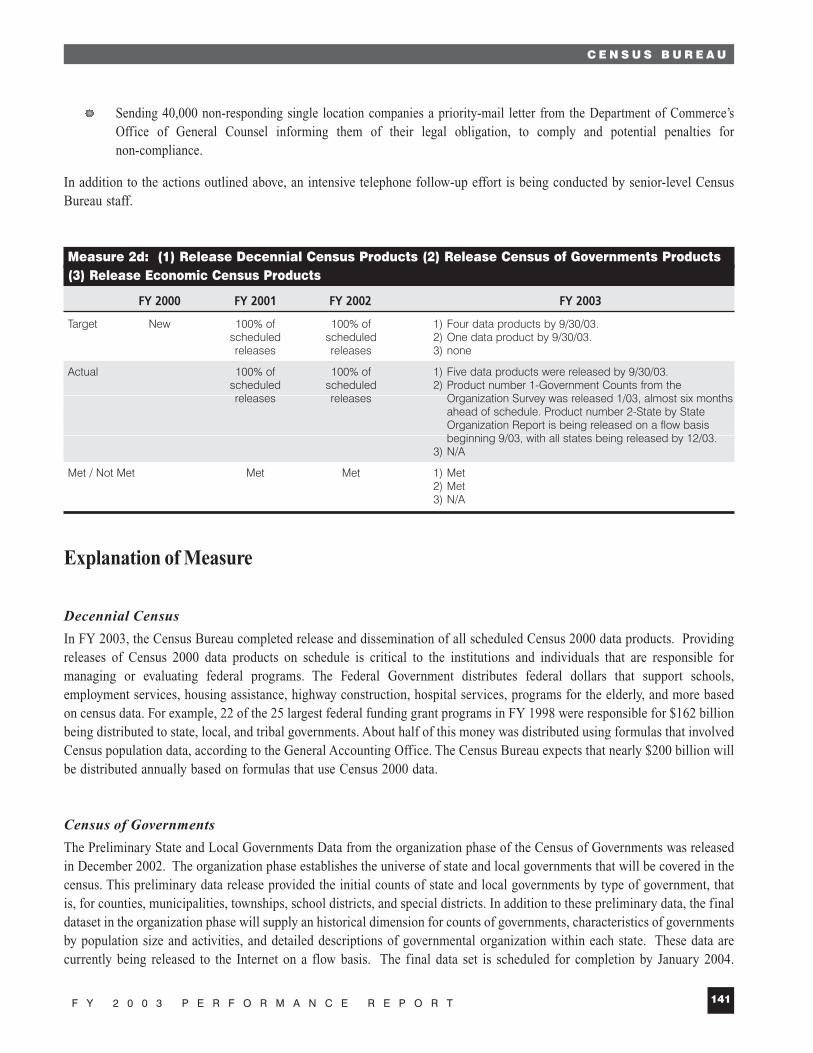
Measure 2d: (1) Release Decennial Census Products (2) Release Census of Governments Products (3) Release Economic Census Products
FY 2000 FY 2001 FY 2002 FY 2003
Target New 100% of 100% of 1) Four data products by 9/30/03.scheduled scheduled 2) One data product by 9/30/03.releases releases 3) none
Actual 100% of 100% of 1) Five data products were released by 9/30/03.scheduled scheduled 2) Product number 1-Government Counts from the releases releases Organization Survey was released 1/03, almost six months
ahead of schedule. Product number 2-State by StateOrganization Report is being released on a flow basisbeginning 9/03, with all states being released by 12/03.
3) N/A
Met / Not Met Met Met 1) Met2) Met3) N/A
Explanation of Measure
Decennial Census
In FY 2003, the Census Bureau completed release and dissemination of all scheduled Census 2000 data products. Providingreleases of Census 2000 data products on schedule is critical to the institutions and individuals that are responsible formanaging or evaluating federal programs. The Federal Government distributes federal dollars that support schools,employment services, housing assistance, highway construction, hospital services, programs for the elderly, and more basedon census data. For example, 22 of the 25 largest federal funding grant programs in FY 1998 were responsible for $162 billionbeing distributed to state, local, and tribal governments. About half of this money was distributed using formulas that involvedCensus population data, according to the General Accounting Office. The Census Bureau expects that nearly $200 billion willbe distributed annually based on formulas that use Census 2000 data.
Census of Governments
The Preliminary State and Local Governments Data from the organization phase of the Census of Governments was releasedin December 2002. The organization phase establishes the universe of state and local governments that will be covered in thecensus. This preliminary data release provided the initial counts of state and local governments by type of government, thatis, for counties, municipalities, townships, school districts, and special districts. In addition to these preliminary data, the finaldataset in the organization phase will supply an historical dimension for counts of governments, characteristics of governmentsby population size and activities, and detailed descriptions of governmental organization within each state. These data arecurrently being released to the Internet on a flow basis. The final data set is scheduled for completion by January 2004.
C E N S U S B U R E A U
141F Y 2 0 0 3 P E R F O R M A N C E R E P O R T
FY 2003 Performance
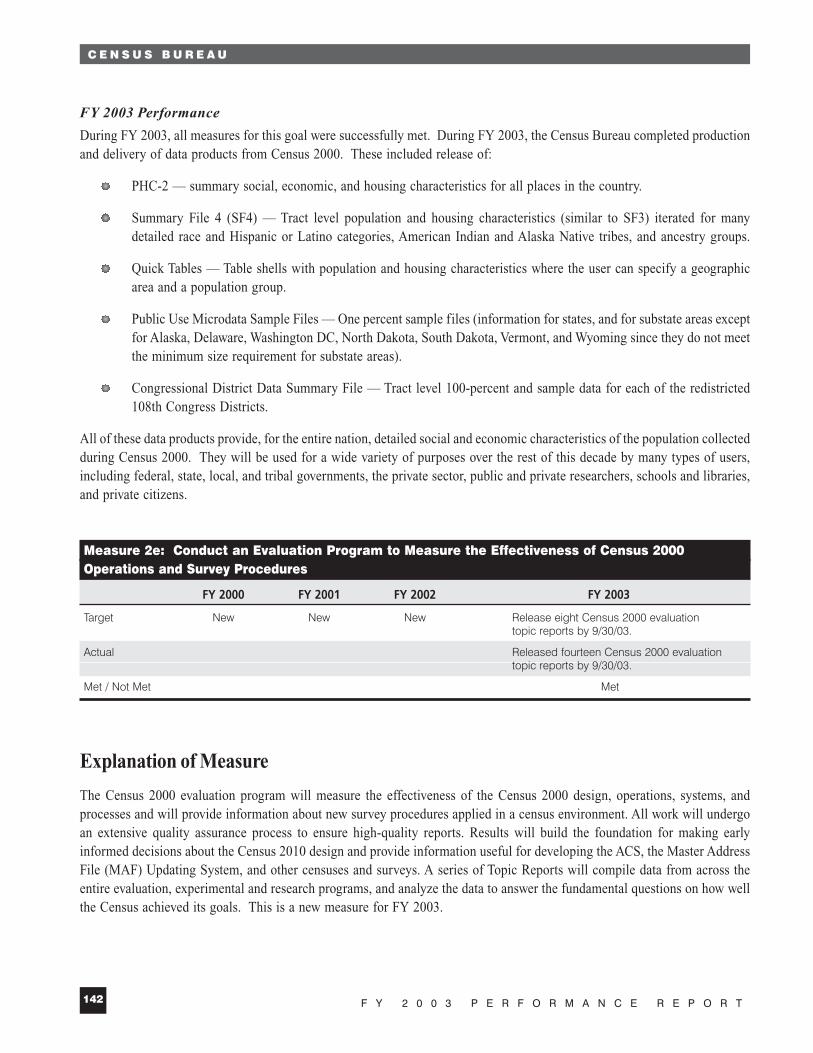
During FY 2003, all measures for this goal were successfully met. During FY 2003, the Census Bureau completed productionand delivery of data products from Census 2000. These included release of:
PHC-2 — summary social, economic, and housing characteristics for all places in the country.
Summary File 4 (SF4) — Tract level population and housing characteristics (similar to SF3) iterated for manydetailed race and Hispanic or Latino categories, American Indian and Alaska Native tribes, and ancestry groups.
Quick Tables — Table shells with population and housing characteristics where the user can specify a geographicarea and a population group.
Public Use Microdata Sample Files — One percent sample files (information for states, and for substate areas exceptfor Alaska, Delaware, Washington DC, North Dakota, South Dakota, Vermont, and Wyoming since they do not meetthe minimum size requirement for substate areas).
Congressional District Data Summary File — Tract level 100-percent and sample data for each of the redistricted108th Congress Districts.
All of these data products provide, for the entire nation, detailed social and economic characteristics of the population collectedduring Census 2000. They will be used for a wide variety of purposes over the rest of this decade by many types of users,including federal, state, local, and tribal governments, the private sector, public and private researchers, schools and libraries,and private citizens.
Measure 2e: Conduct an Evaluation Program to Measure the Effectiveness of Census 2000 Operations and Survey Procedures
FY 2000 FY 2001 FY 2002 FY 2003
Target New New New Release eight Census 2000 evaluation topic reports by 9/30/03.
Actual Released fourteen Census 2000 evaluation topic reports by 9/30/03.
Met / Not Met Met
Explanation of Measure
The Census 2000 evaluation program will measure the effectiveness of the Census 2000 design, operations, systems, andprocesses and will provide information about new survey procedures applied in a census environment. All work will undergoan extensive quality assurance process to ensure high-quality reports. Results will build the foundation for making earlyinformed decisions about the Census 2010 design and provide information useful for developing the ACS, the Master AddressFile (MAF) Updating System, and other censuses and surveys. A series of Topic Reports will compile data from across theentire evaluation, experimental and research programs, and analyze the data to answer the fundamental questions on how wellthe Census achieved its goals. This is a new measure for FY 2003.
C E N S U S B U R E A U
F Y 2 0 0 3 P E R F O R M A N C E R E P O R T142

FY 2003 Performance
In FY 2003 the Census Bureau achieved its goal for releasing the Census 2000 Evaluation Topic Reports. The completed topicreports included:
Address List Development
Automation of Census Processes
Content and Data Quality
Coverage Improvement
Coverage Measurement
Data Capture
Data Collection
Data Processing
Partnerships and Marketing
Privacy
Puerto Rico
Race and Ethnicity
Response Rates and Behavior Analysis
Special Places and Group Quarters
By pulling together findings from multiple studies, these reports will provide a more integrated and effective assessment ofCensus 2000 results.
Program Evaluation
The continued dissemination of data products to federal, state, local and tribal governments, as well as to users in the privateand public sectors make them available for countless applications. Some uses of the data include the resolution of populationand boundary issues, and the distribution of federal dollars to states and localities to meet their needs. The completion of theCensus 2000 evaluation report, particularly the Topic Reports, will provide both internal and external audiences usefulinformation for planning and developing all components of the re-engineered 2010 Census program.
C E N S U S B U R E A U
143F Y 2 0 0 3 P E R F O R M A N C E R E P O R T

Performance Goal 3: Meet Constitutional and Legislative Mandatesby Implementing a Re-Engineered 2010 Census that is Cost-Effective, Provides More Timely Data, Improves Coverage Accuracy,and Reduces Operational Risk(This goal has been reworded since the publication of the FY 2001 APPR and FY 2003 APP. This goal was previously wordedas: “Re-engineer the 2010 Decennial Census to be more efficient and cost effective, provide richer data, improve coverage,and reduce risk in meeting constitutional and legislative mandates.”)
Corresponding Strategic Goal
Strategic Goal 1: Provide the information and the framework to enable the economy to operate efficiently and equitably.
Rationale for Performance Goal
This is a continuation of a performance goal established for FY 2002. Census 2000 was an operational and data qualitysuccess: all operations were completed on time and within overall budget; overall coverage was improved; and differentialundercount was improved for all minority groups and for children. However, Census 2000 was conducted with high cost andat great operational risk.
In response, and in striving to better meet this nation’s ever-expanding needs for social, demographic, and geographicinformation, the Department of Commerce and the Census Bureau have developed a multi-year effort to completely modernizeand re-engineer the Decennial Census program.
This re-engineering effort for the 2010 Decennial Census has four major performance outcomes:
Improve the relevance and timeliness of census long-form data,
Reduce operational risk,
Improve the accuracy of census coverage, and
Contain costs.
The re-engineered 2010 Decennial Census program consists of three highly integrated activities designed to take advantageof opportunities for innovations made possible through the expanded use of technology, major changes in the Census Bureau’sbusiness process for data collection, and the use of focused coverage improvement procedures:
Collect and tabulate long-form data every year throughout the decade using a large household survey (the ACS).Besides improving the timeliness of these detailed socio-economic data for federal programs and other data users,this will allow the 2010 Census to focus solely on short-form data collection and coverage.
C E N S U S B U R E A U
F Y 2 0 0 3 P E R F O R M A N C E R E P O R T144

Conduct a multi-year effort to enhance and improve the Census Bureau’s MAF and geographic database, TIGER, bybringing them into alignment with global positioning system (GPS) coordinates and by converting the CensusBureau’s home-grown processing environment into one based on commercial off-the-shelf and geographic informationsystem (GIS) software products. In addition to the great benefits of these improvements to the nation’s geographicinformation infrastructure, this will allow the 2010 Census to utilize GPS-equipped mobile computing devices.This in turn will allow the Census Bureau to make major improvements in its business process for data collection.
Conduct a multi-year program of integrated planning, development, and testing to completely restructure themanagement and conduct of a short-form only census in 2010. This effort encompasses time-critical major fieldtests under census-like conditions in 2004 and 2006, and a full Dress Rehearsal in 2008.
Together, these three components are needed to achieve its long-range performance goals for the 2010 Census–maintainingor reducing net differential undercounts compared to Census 2000, increasing the mail response rate compared to Census2000, and containing the full cycle costs. That is, while each of these components can yield great benefits on its own, thefull overall benefit comes from the combination and integration of these activities into a fully re-engineered Decennial Censusprogram.
FY 2003 Performance
During FY 2003, the Census Bureau successfully met four of the five measures for this goal. The Census Bureau completedselecting sites, developed a detailed operational schedule, and prepared design requirements for the 2004 Census Test—the firstmajor field test in preparation for the 2010 Decennial Census. These were key accomplishments within the Census Bureau’smulti-year effort of planning, development, and testing to reengineer the conduct of a short form only 2010 Census. They willallow the Census Bureau to implement and evaluate the critical objectives and research questions of the 2004 Census Test, andthen to use the results of that test to refine the Census Bureau’s development and testing objectives for the remainder of thismulti-year effort. Overall, it keeps the Census Bureau on track to define final requirements by 2007 so that it can implementa dress rehearsal currently planned in 2008 of the actual methods and systems the Census Bureau plans to use for 2010.These successes also contribute to the overall 2010 Census goals of reducing risk, improving coverage, and containing costs.Census also met the MAF/TIGER Enhancements Program goal of bringing map features into GPS alignment for 250 counties.This is planned to be completed by 2008 for all 3,233 counties (and county equivalents) in the United States, Puerto Rico, andthe Island Areas. Completion of this program also supports our overall 2010 goals relating to risk reduction, coverageimprovement, and cost containment. It also is critical to implementation of the ACS, and the ACS is in turn critical to meetingthe Census Bureau’s fourth overall goal for 2010—improving the timeliness and relevance of data.
Measure 3a: Implement the American Community Survey (ACS)
FY 2000 FY 2001 FY 2002 FY 2003
Target New New Complete field activities supporting Release three evaluation reports onthe release of 2001 data from the Continuous Measurement Program Long Form Transitional Database in by 9/30/03.summer of 2002.
Actual Completed field activities supporting Reports not released. the release of 2001 data from theLong Form Transitional Database in summer of 2002.
Met/Not Met Met Not Met
C E N S U S B U R E A U
145F Y 2 0 0 3 P E R F O R M A N C E R E P O R T

Explanation of Measure
The ACS’s methods of data collection involve three modes:
Collecting data by mailing out forms and processing the completed responses.
Contacting non-responding households by telephone in order to collect these data.
Sampling households that have still not responded and attempting data collection by visiting these households andconducting interviews.
The overall weighted response rate reflects the contribution of all three modes of response. The FY 2004 budget proposedfull implementation of the ACS beginning in the last quarter of FY 2004. Under full implementation, the ACS monthly samplewill reach 250,000 households. The ACS will also assist data users to understand the quality of the published estimates bycalculating and displaying the confidence interval for all estimates in the ACS data products. The Census Bureau conductedthe Census 2000 Supplementary Survey, the 2001 Supplementary Survey, and the 2002 Supplementary Survey using ACSmethods. These surveys collected the data for the Long Form Transitional Database. The data collection for the Long FormTransitional Database was conducted to study the operational feasibility of collecting long-form-type data using a differentmethodology than that used in the decennial census, to demonstrate the reliability and stability of state and large-area estimatesover time, and to demonstrate the usability of multi-year estimates. Each of these surveys had a sample of approximately700,000 residential addresses per year. Using a sample of this magnitude, data can be generated that will provide estimatesfor all states and essentially all counties of 250,000 people or more.
The success of the ACS is predicated on the ability to validate, as well as the willingness of data users to accept, the currentexpectation that the ACS will eliminate the need for the decennial census long form. To this end, the Census Bureau willconduct census tract-by-tract comparisons between the 1999-2001 ACS cumulated estimates and the Census 2000 long formin the 31 test sites. These comparisons are used to identify the causes of differences, ways to improve ACS design, and areasthat require additional research. This analysis is a critical part of the transition to using data from the ACS as a nationalprogram. As currently planned ACS community profiles would be updated every year rather than every 10 years. These vastlyimproved data will enable the U.S. Government to distribute billions of dollars more efficiently and to more effectively evaluatefederal programs.
By September 30, 2003, the following evaluations related to the program were scheduled for release:
A comparison of the Census 2000 Supplementary Survey and the Census 2000 Short Form,
A comparison of the Census 2000 Supplementary Survey and the Census 2000 Long Form (sample items) data, and
A comparison of three-year averages from the ACS data from 31 sites.
FY 2003 Performance
For FY 2003, the Census Bureau did not meet its original performance goal for the ACS. This was due to a change in prioritiesand goals for this program for FY 2003. Working with the congressional committee, the Census Bureau was commissionedto, and carried out, an extensive test to assess the effect on mail response rates of changing the ACS from a mandatory to avoluntary survey. The methodological resources needed to complete this test were obtained by shifting resources from other
C E N S U S B U R E A U
F Y 2 0 0 3 P E R F O R M A N C E R E P O R T146

activities contributing to the Census Bureau’s previously determined performance goal. Therefore, completion of this test andreporting of the results to the Congress became the Census Bureau’s new focus for FY 2003. This test was accomplished andthe results of the test are ready for presentation to the Congress.
Measure 3b: Implement Master Address File (MAF)/ Topologically Integrated Geographic Encoding and Referencing System (TIGER) Modernization
FY 2000 FY 2001 FY 2002 FY 2003
Target New New Prepare plan and systems by the end of Conduct map feature and FY 2002 to measure housing unit coverage housing unit location corrections of the address list; in 250 counties by 9/30/03.1List is at least as complete as it was forCensus 2000, as measured by the Accuracyand Coverage Evaluation.
Actual Prepared plan and systems by the end of Completed map feature FY 2002 to measure housing unit coverage corrections in 250 counties by of the address list; 9/30/03. List is at least as complete as it was forCensus 2000, as measured by the Accuracyand Coverage Evaluation.
Met/Not Met Met Met
1 The original wording for this measure incorrectly included housing unit location corrections. The measure was reworded with the publication of the FY 2004 APP to read:“TIGER features are within 5 meters of true GPS location for 7.7 percent of the nation’s counties by 9/30/03.”
Explanation of Measure
This was a new performance measure for FY 2003. Correctly locating every street and other map feature in the MAF/TIGERdatabase is critical to providing geographic products and services that meet the accuracy expectations of the 2010 Census fielddata collection staff and the Census Bureau’s data product customers. The Census Bureau’s field staff members have reportedextensive difficulties in completing address list updating and verification tasks, and in finding addresses and streets thatrequired follow-up visits in Census 2000. Many local or tribal governments that participated in the Census 2000 geographicpartnership programs and many potential customers for MAF/TIGER geographic products have told the Census Bureau thatthey would not consider future geographic partnership or use without substantial improvements in location accuracy. Investingin the identification and correct location of new housing units and streets or roads in small towns and rural areas will assureuniform address and street coverage in the MAF/TIGER database and in Census Bureau data products.
FY 2003 Performance
In FY 2003, the Census Bureau met its goal of completing the MAF/TIGER alignment for 250 counties. This is part of amulti-year effort that is planed to be completed in FY 2008 with completion for all 3,233 counties (and county equivalents)in the United States, Puerto Rico, and the Island areas. Improving the geographic accuracy of the information in these twokey databases is a vital, multi-year program that supports the Census Bureau’s overall 2010 goals relating to risk reduction,coverage improvement, and cost containment. It also is critical to implementation of the ACS, and the ACS is, in turn, essentialto meeting the Census Bureau’s fourth overall goal for 2010—improving the timeliness and relevance of data.
C E N S U S B U R E A U
147F Y 2 0 0 3 P E R F O R M A N C E R E P O R T

Measure 3c: Conduct Early 2010 Census Planning and Testing
FY 2000 FY 2001 FY 2002 FY 2003
Target New New New Select 2004 Census Test sites by 12/31/02.Develop and document design requirements for 2004 Census Test by 12/31/02.Develop detailed operational schedule for the 2004 Census Test in April 2004 by 9/30/03.
Actual Selected 2004 Census Test sites by 12/31/02.Developed and documented design requirements for 2004 Census Test by 12/31/02.Developed detailed operational schedule for the 2004 Census Test by 9/30/03.
Met / Not Met Met
Explanation of Measure
A sustained, multi-year, integrated program for planning, testing, and development of a short-form only census for 2010 isthe third key component of the re-engineering effort. Without it, the program is left with a census that improves data relevanceand timeliness (through the ACS) and geographic accuracy (through the MAF/TIGER efforts), but at a greatly expanded costand with no serious reductions in operational risk or improvements in coverage accuracy. With it, the data collection effortfor 2010 can take advantage of and build on these other improvements to contain costs and improve accuracy while keepingoperational risk to a minimum. This will be accomplished through things such as:
Data collection using GPS-equipped mobile computing devices. Use of these devices will allow the Census Bureauto make major improvements to the business process for data collection — the largest and most expensive componentof any census. For example, their use will significantly reduce the need for paper forms and maps, the huge staffand space required to handle that paper, and the printing, postage, and data capture costs associated with datacollection using paper forms. These devices also will provide better information to field staff as they conduct theirwork. This should result in improved productivity and fewer errors.
Mailing a second questionnaire to households that do not respond to the initial mail out. Research has shown this tohave significant promise for increasing mail response rates, thus lowering field follow-up workloads and costs. TheCensus Bureau plans to offer alternative response modes, such as the Internet and telephone, to increase response rates.
Finding ways to increase data quality for all population groups by improving questionnaire wording and instructionswhen collecting data about race and Hispanic origin.
Exploring ways to increase within-household coverage for all groups and areas by improving questionnaire wordingand instructions regarding the Census Bureau’s residence rules.
Making methodological improvements to data collection for persons who live in group quarters.
To do these things successfully, procedures are tested under census-like conditions, and refined in advance of Census Day.This requires a sustained, multi-year effort of integrated planning, development, testing, revising, and retesting of all the manyprocedures needed to complete a successful census. A major field test will occur in 2004, focused primarily on improvedmethodologies for data collection and coverage. In 2006, a second major field test is planned that will focus primarily on the
C E N S U S B U R E A U
F Y 2 0 0 3 P E R F O R M A N C E R E P O R T148

systems integration needed to carry out this new census design. In 2008, a full dress rehearsal of the new census methodsand systems is planned, setting the stage for a 2010 Census that can achieve all the goals of the 2010 Decennial Censusre-engineering. Throughout the decade the Census Bureau also will conduct focused special purpose tests, cognitive studies,and technology assessments.
FY 2003 Performance
In FY 2003 the Census Bureau met its goals for this measure. The sites for the 2004 Census Test were selected by December2002, as were the specific design requirements (test objectives and research questions). A detailed operational schedule forthe 2004 Census Test was completed in September 2003. Early operations for this test are now underway, and the CensusBureau is on schedule to complete this first major field test of new and improved methods to be used for the 2010 Census.
Program Evaluation
The Census Bureau achieved four of its five performance measures for Performance Goal 3 in FY 2003. For the 2004 CensusTest, sites were selected, a detailed operational schedule was prepared, and early operations got underway. The first majorfield test of 2010 Census methods is on schedule. As part of a multi-year effort, the Census Bureau met its goal of completingthe MAF/TIGER realignment for 250 counties. For FY 2003, the Census Bureau did not meet its original performance goalfor the ACS due to a change in priorities and goals for this program. Instead, at the request of its congressional committee,the Census Bureau planned and carried out an extensive test to assess the effect on mail response rates of changing the ACSfrom a mandatory to a voluntary survey.
The achievements relating to the 2004 Census Test were key accomplishments within the Census Bureau’s multi-year effortof planning, development, and testing to reengineer the conduct of a short-form only 2010 Census. They will allow the CensusBureau to implement and evaluate the critical objectives and research questions of the 2004 Census Test, and then to use theresults of that test to refine the Census Bureau’s development and testing objectives for the remainder of this multi-year effort.Overall, it keeps the Census Bureau on track to define final requirements by 2007 so that the Census Bureau can implementa “real” dress rehearsal in 2008 of the actual methods and systems the Census Bureau plans to use for 2010. These successesalso contribute to our overall 2010 Census goals of reducing risk, improving coverage, and containing costs. Completing theMAF/TIGER objective also was key to a critical, multi-year program that is planned to be completed by 2008 for all3,233 counties (and county equivalents) in the United States, Puerto Rico, and the Island areas. Completion of this programalso supports the Census Bureau’s overall 2010 goals relating to risk reduction, coverage improvement, and cost containment.It also is critical to implementation of the ACS, and the ACS is in turn critical to meeting our fourth overall goal for 2010—improving the timeliness and relevance of data. While the Census Bureau did not meet the original measures for the ACS, itwas able to successfully refocus its resources to carry out the test requested by the congressional committee, and completionof that test was a critical effort in developing congressional support of this program.
For the FY 2003 budget cycle, the Census Bureau underwent its first PART process. This process is still ongoing; howeverinitial reaction from the OMB has been generally positive. OMB assessed four areas using the PART process, including the2010 Decennial Census.
Formal recommendations resulting from the PART process will be reflected in the Census Bureau’s APP.
C E N S U S B U R E A U
149F Y 2 0 0 3 P E R F O R M A N C E R E P O R T

Performance Goal 4: Foster an Environment that Supports Innovation,Reduces Respondent Burden, and Ensures Individual Privacy(This goal has been reworded since the publication of the FY 2001 APPR and FY 2003 APP. This goal was previously wordedas: “Provide mission critical support for tools and capabilities that improve processes, products and services for our surveysand censuses.”)
Corresponding Strategic Goal
Strategic Goal 1: Provide the information and tools to maximize U.S. competitiveness and enable economic growth forAmerican industries, workers, and consumers.
Rationale for Performance Goal
Mission critical support of the Census Bureau’s goals and objectives provides a national resource for statistical, survey, andtechnological research; geographic systems; and IT services.
Geographic systems, the cornerstone to our collection, processing, and dissemination systems, provide the basicmaps, address lists, address and geographic reference files, and associated processing systems needed to meet thegeographic requirements of all Census Bureau programs. The geographic support system (GSS) manages largevolumes of information from both internal and external sources to establish and maintain a current and completeinventory of streets, roads, accurate boundaries, and other attribute information.
Centralized IT services that provide stable, dependable information technology support and the ability to continuallyincrease the Census Bureau’s capacity for IT innovation are intimately linked to the accuracy, timeliness, andeffectiveness of all Bureau programs. These information technology services must include an IT security program.
Research, testing, and the prototyping of tools, systems and new methods to improve the Census Bureau’s coreprocesses—data collection, processing, and dissemination—across programs are essential for the Census Bureau tomeet its increasing customer demands for more complex data in a timely and efficient manner. Maintaining adequateresponse rates, reducing respondent burden, meeting complex data needs, improving data quality, and developinginnovative training techniques can all be facilitated through research and the application of core expertise instatistical and survey methodologies.
The annual compilation and issuance of the Statistical Abstract of the United States provides vital program data forpolicy background and research for congressional staffs and federal, state, and local government officials.The Statistical Abstract is also the principal source of annual statistics describing the social and economic structureof the United States for over 250 government, private, and international organizations, and support for programmaticcrosscutting periodic supplements such as the County and City Data Book, State and Metropolitan Area Data Book,and the Census Bureau’s Product Catalog.
FY 2003 Performance
The Census Bureau met or exceeded its 2003 targets for Performance Goal 4 measures.
C E N S U S B U R E A U
F Y 2 0 0 3 P E R F O R M A N C E R E P O R T150

Measure 4a: Response to the Annual Boundary and Annexation Survey (BAS)
FY 2000 FY 2001 FY 2002 FY 2003
Target New New New 83%
Actual 81% 84% 88%
Met / Not Met Met
Explanation of Measure
The annual Boundary and Annexation Survey (BAS) is the mechanism by which the Census Bureau determines the legalboundaries and names of all governmental units (counties, cities, townships, American Indian reservations, etc.) for whichit tabulates and disseminates statistical data in its various censuses and household surveys. The BAS is the longestrunning component of the GSS and the response typically declines in years farther from the previous decennial census.The Census Bureau is developing more options for local and tribal governments to respond and to notify when no changeshave occurred. The Census Bureau expects this to increase the percentage of governments that respond to the BAS duringthe intercensal years.
FY 2003 Performance
The Census Bureau exceeded the target of 83 percent with an actual response rate of 88 percent. High participation rates fromall governmental units is important to ensure that the latest legal boundaries and names of all units (counties, cities, townships,American Indian reservations, and so forth) are reflected in the geographic reference files that are used in the tabulation ofstatistical data from the various censuses and household surveys the Census Bureau conducts throughout the decade.
Measure 4b: Meet Milestone Dates for Web-Enabled Portal Technology Demonstration Project and for Prototype Imaging Technology Research Project
FY 2000 FY 2001 FY 2002 FY 2003
Target New New New 100%
Actual 100%
Met / Not Met Met
Explanation of Measure
Designing and testing Web-based and imaging technology solutions for collection and processing tools/application systemswill enable the Census Bureau to meet the needs of its customers and provide employees with more efficient electronic accessto data and analysis tools.
C E N S U S B U R E A U
151F Y 2 0 0 3 P E R F O R M A N C E R E P O R T

FY 2003 Performance
The Census Bureau met its target by achieving 100 percent of its milestone dates for these projects. Meeting these milestoneshas allowed the Web-enabled portal technology demonstration project’s team to move forward in its evaluation of thetechnology, in order to determine its future implementation status. Further, the prototype imaging technology has beenimplemented within the Census Bureau. This mission-critical support is essential for survey and census collection, processing,and dissemination.
Program Evaluation
The Census Bureau’s ability to exploit technologies, enhance and apply support systems, and develop and implement improvedstatistical and survey methodologies is critical to meeting our mission needs of day-to-day and year-to-year measurement ofthe U.S. economy and population. Evaluations of the Census Bureau’s mission-critical support programs are numerous andongoing. Examples include BAS respondent reporting rates recorded in production control systems, the annual conductingof the IT Security Self-Assessment survey in accordance with the standard established by the National Institute for Standardsand Technology, and measures of customer satisfaction with key Census Bureau products in various media.
Census Bureau Data Validation and VerificationThe Census Bureau conducts an annual review of the performance data to ensure that projected targets are met. Data areverified by comparison with past release dates for those targets involving data release measures. The survey data tabulationsare compared to publicly reported methodological standards for its surveys to verify that the specified measures are attainedfor targets involving reliability measures. During this process, significant deviations from projected targets, if any, arediscussed with the appropriate program areas so that changes can be implemented to help meet the Census Bureau’sperformance goals.
In some cases, information is manually checked against actual paper files (when available) to ensure the accuracy ofinformation. Additionally, documentation is reviewed and a determination is made on its adequacy and sufficiency to supportclaims that outcomes and outputs have been achieved.
The Census Data Validation and Verification table can be found starting on the following page.
C E N S U S B U R E A U
F Y 2 0 0 3 P E R F O R M A N C E R E P O R T152
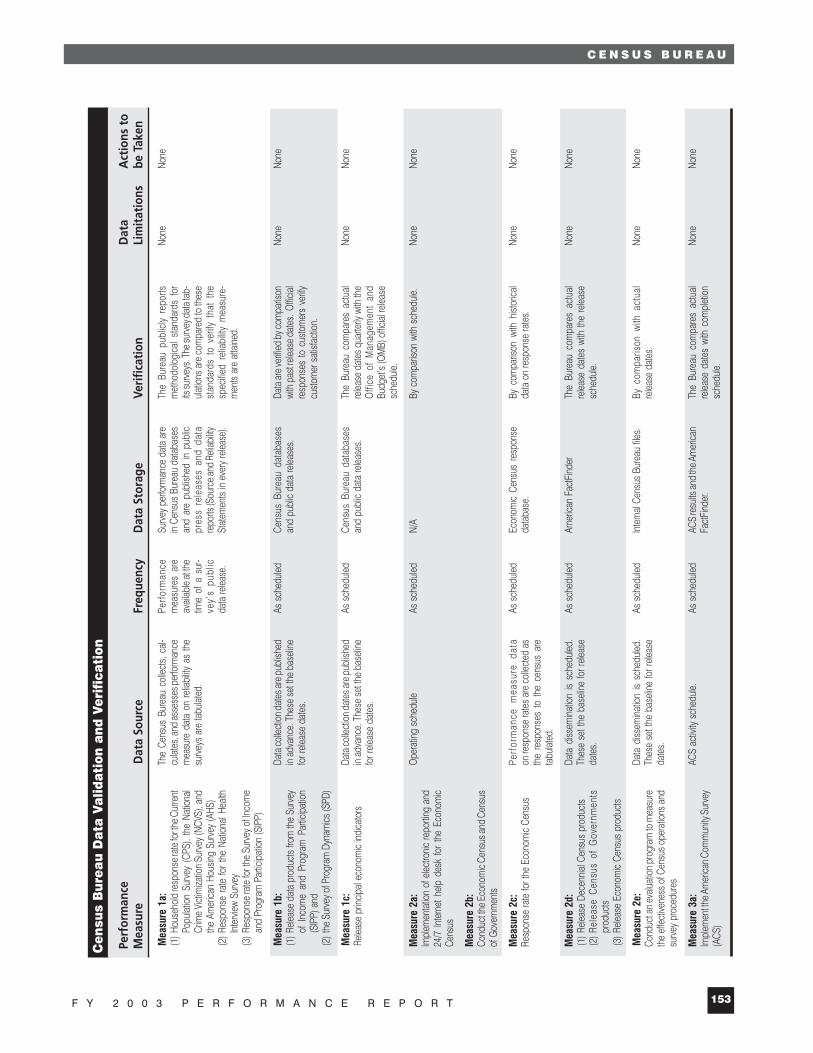
C E N S U S B U R E A U
153F Y 2 0 0 3 P E R F O R M A N C E R E P O R T
Cen
sus
Bu
rea
u D
ata
Va
lid
ati
on a
nd
Ver
ific
ati
on
Perf
orm
ance
D
ata
Act
ions
to
Mea
sure
Dat
a So
urce
Freq
uenc
yD
ata
Stor
age
Veri
fica
tion
Lim
itat
ions
be T
aken
Mea
sure
1a:
(1
)Hou
seho
ld re
spon
se ra
te fo
r the
Cur
rent
Popu
latio
n Su
rvey
(CPS
), th
e Na
tiona
lCr
ime
Vict
imiza
tion
Surv
ey (N
CVS)
, and
the
Amer
ican
Hous
ing S
urve
y (A
HS)
(2)R
espo
nse
rate
for t
he N
atio
nal H
ealth
Inte
rview
Sur
vey
(3
)Res
pons
e ra
te fo
r the
Sur
vey o
f Inco
me
and
Prog
ram
Par
ticip
atio
n (S
IPP)
Mea
sure
1b:
(1
)Rele
ase
data
pro
duct
s fro
m th
e Su
rvey
of I
ncom
e an
d Pr
ogra
m P
artic
ipat
ion
(SIP
P) a
nd(2
)the
Sur
vey o
f Pro
gram
Dyn
amics
(SPD
)
Mea
sure
1c:
Re
lease
prin
cipal
econ
omic
indica
tors
Mea
sure
2a:
Im
plem
enta
tion
of e
lectro
nic re
porti
ng a
nd24
/7 In
tern
et h
elp d
esk
for
the
Econ
omic
Cens
us
Mea
sure
2b:
Co
nduc
t the E
cono
mic
Cens
us an
d Ce
nsus
of G
over
nmen
ts
Mea
sure
2c:
Re
spon
se ra
te fo
r the
Eco
nom
ic Ce
nsus
Mea
sure
2d:
(1)R
eleas
e De
cenn
ial C
ensu
s pr
oduc
ts(2
)Rel
ease
Cen
sus
of G
over
nmen
tspr
oduc
ts(3
)Rele
ase
Econ
omic
Cens
us p
rodu
cts
Mea
sure
2e:
Co
nduc
t an
evalu
atio
n pr
ogra
m to
mea
sure
the
effe
ctive
ness
of C
ensu
s ope
ratio
ns a
ndsu
rvey
pro
cedu
res
Mea
sure
3a:
Im
plem
ent th
e Am
erica
n Com
mun
ity S
urve
y(A
CS)
The
Cens
us B
urea
u co
llect
s, ca
l-cu
lates
, and
asse
sses
per
form
ance
mea
sure
dat
a on
relia
bility
as
the
surv
eys
are
tabu
lated
.
Data
colle
ctio
n dat
es ar
e pub
lishe
din
adva
nce.
The
se se
t the
bas
eline
for r
eleas
e da
tes.
Data
colle
ctio
n dat
es ar
e pub
lishe
din
adva
nce.
The
se se
t the
bas
eline
for r
eleas
e da
tes.
Ope
ratin
g sc
hedu
le
Perf
orm
ance
mea
sure
dat
a on
resp
onse
rate
s ar
e co
llect
ed a
sth
e re
spon
ses
to th
e ce
nsus
are
tabu
lated
.
Data
diss
emina
tion
is sc
hedu
led.
Thes
e se
t the
bas
eline
for r
eleas
eda
tes.
Data
diss
emina
tion
is sc
hedu
led.
Thes
e se
t the
bas
eline
for r
eleas
eda
tes.
ACS
activ
ity s
ched
ule.
Perfo
rman
cem
easu
res
are
avail
able
at th
etim
e of
a s
ur-
vey’
s pu
blic
data
relea
se.
As s
ched
uled
As s
ched
uled
As s
ched
uled
As s
ched
uled
As s
ched
uled
As s
ched
uled
As s
ched
uled
Surv
ey p
erfo
rman
ce d
ata
are
in Ce
nsus
Bur
eau
data
base
san
d ar
e pu
blish
ed in
pub
licpr
ess
rele
ases
and
dat
are
ports
(Sou
rce a
nd R
eliab
ility
Stat
emen
ts in
eve
ry re
lease
).
Cens
us B
urea
u da
taba
ses
and
publ
ic da
ta re
lease
s.
Cens
us B
urea
u da
taba
ses
and
publ
ic da
ta re
lease
s.
N/A
Econ
omic
Cens
us r
espo
nse
data
base
.
Amer
ican
Fact
Find
er
Inte
rnal
Cens
us B
urea
u file
s.
ACS
resu
lts an
d th
e Am
erica
nFa
ctFi
nder.
The
Bure
au p
ublic
ly re
ports
met
hodo
logi
cal s
tand
ards
for
its su
rvey
s. Th
e sur
vey d
ata t
ab-
ulatio
ns a
re c
ompa
red
to th
ese
stan
dard
s to
ver
ify t
hat
the
spec
ified
relia
bility
mea
sure
-m
ents
are
atta
ined.
Data
are v
erifie
d by
com
paris
onwi
th p
ast r
eleas
e dat
es. O
fficial
resp
onse
s to
cus
tom
ers
verif
ycu
stom
er s
atisf
actio
n.
The
Bure
au c
ompa
res
actu
alre
lease
dat
es q
uarte
rly w
ith th
eO
ffice
of
Man
agem
ent
and
Budg
et’s
(OM
B) o
fficial
relea
sesc
hedu
le.
By c
ompa
rison
with
sch
edule
.
By c
ompa
rison
with
hist
orica
lda
ta o
n re
spon
se ra
tes.
The
Bure
au c
ompa
res
actu
alre
lease
dat
es w
ith th
e re
lease
sche
dule.
By c
ompa
rison
with
act
ual
relea
se d
ates
.
The
Bure
au c
ompa
res
actu
alre
lease
dat
es w
ith c
ompl
etio
nsc
hedu
le.
None
None
None
None
None
None
None
None
None
None
None
None
None
None
None
None

C E N S U S B U R E A U
F Y 2 0 0 3 P E R F O R M A N C E R E P O R T154
Cen
sus
Bu
rea
u D
ata
Va
lid
ati
on a
nd
Ver
ific
ati
on (
cont
.)
Perf
orm
ance
D
ata
Act
ions
to
Mea
sure
Dat
a So
urce
Freq
uenc
yD
ata
Stor
age
Veri
fica
tion
Lim
itat
ions
be T
aken
Mea
sure
3b:
Im
plem
ent
Mas
ter
Addr
ess
File
(M
AF)/
Topo
logi
cally
Int
egra
ted
Geo
grap
hic
Enco
ding
and
Ref
eren
cing
syst
em (T
IGER
)m
oder
nizat
ion
Mea
sure
3c:
Co
nduc
t ear
ly 20
10 C
ensu
s pl
annin
g an
dte
sting
Mea
sure
4a:
Re
spon
se t
o th
e an
nual
Bou
ndar
y an
dAn
nexa
tion
Surv
ey (B
AS)
Mea
sure
4b:
M
eet
mile
ston
e da
tes
for
Web
-ena
bled
po
rtal te
chno
logy d
emon
strat
ion p
rojec
t and
for p
roto
type
imag
ing te
chno
logy
rese
arch
proj
ect
MAF
/TIG
ER a
ctivi
ty sc
hedu
le.
2010
act
ivity
sche
dule.
Geog
raph
ic Su
ppor
t Sys
tem
(GSS
)In
trane
t sta
tus
repo
rts.
Data
are
col
lecte
d an
d as
sess
edas
res
earc
h, te
sting
, and
eva
lua-
tions
pro
ceed
.
As s
ched
uled
As s
ched
uled
As s
ched
uled
As s
ched
uled
Cens
us B
urea
u M
AF/T
IGER
data
base
.
Inte
rnal
Cens
us B
urea
u d
oc-
umen
tatio
n of
requ
irem
ents
.
Cens
us B
urea
u M
AF/T
IGER
data
base
.
Dat
a ar
e pr
inte
d in
the
rese
arch
repo
rts, m
etho
dolog
yan
d st
anda
rds
repo
rts,
and
evalu
atio
n re
ports
.
The
Cens
us B
urea
u co
mpa
res
actu
al c
ompl
etio
n da
tes
with
sche
duled
dat
es.
2004
Cen
sus t
est r
equir
emen
tsde
fined
and
test
site
s se
lecte
das
sch
edule
d.
By c
ompa
rison
with
act
ual
repo
rted
resp
onse
rate
s.
By c
ompa
rison
with
act
ual
proj
ect r
esult
s an
d re
ports
.
None
None
None
None
None
None
None
None