CE Delft 4596 Bus Coach Transport Greening … van Essen Anouk van Grinsven . 2 October 2011 4.596.1...
34
Bus and coach transport for greening mobility Contribution to the European Bus and Coach Forum 2011 Rapport Delft, October 2011 Author(s): Huib van Essen Anouk van Grinsven
Transcript of CE Delft 4596 Bus Coach Transport Greening … van Essen Anouk van Grinsven . 2 October 2011 4.596.1...
Bus and coach transport for greening mobility
Contribution to the European Bus and Coach Forum 2011
Rapport Delft, October 2011 Author(s): Huib van Essen Anouk van Grinsven

2 October 2011 4.596.1 – Bus and coach transport for greening mobility
Publication Data
Bibliographical data: Huib van Essen, Anouk van Grinsven
Bus and coach transport for greening mobility
Contribution to the European Bus and Coach Forum 2011
Delft, CE Delft, October 2011
Transport of passengers / Mobility / Sustainable / Buses
Publication code: 11.4596.71
CE publications are available from www.cedelft.eu
Commissioned by: International Road Transport Union.
Further information on this study can be obtained from the contact person, Huib van Essen.
© copyright, CE Delft, Delft
CE Delft
Committed to the Environment
CE Delft is an independent research and consultancy organisation specialised in
developing structural and innovative solutions to environmental problems.
CE Delft’s solutions are characterised in being politically feasible, technologically
sound, economically prudent and socially equitable.

3 October 2011 4.596.1 – Bus and coach transport for greening mobility
Contents
Summary 5
1 Introduction 7 1.1 Context: challenges for transport 7 1.2 Aim of this paper – potential of bus and coach transport 7
2 Comparison of buses with other transport modes 9 2.1 Introduction 9 2.2 Methodological issues for comparing transport modes on their emissions 9 2.3 Specific assumptions for bus and coach transport 10 2.4 Comparison of modes in specific cases 11 2.5 Longer term perspectives 15 2.6 Comparison of other indicators 15
3 EU White Paper on Transport 17 3.1 Introduction 17 3.2 Overall targets 17 3.3 The role of buses and coaches according to the White Paper 18
4 The potential of bus and coach transport for greening transport21 4.1 Introduction 21 4.2 Emission standards and short term development 21 4.3 More fuel efficient ICE-powered bus and coach transport 22 4.4 Alternative energy carriers and power-trains for buses and coaches 23 4.5 Logistic optimisations 25 4.6 Policy considerations 25
5 Conclusions and recommendations 29 5.1 Environmental performance of various modes of transport 29 5.2 Greening of bus and coach transport 30 5.3 Policy considerations for greening mobility by increasing the share of bus and
coach transport 30
Literature 33

4 October 2011 4.596.1 – Bus and coach transport for greening mobility

5 October 2011 4.596.1 – Bus and coach transport for greening mobility
Summary
The 7th European Bus and Coach Forum – Greening of travel and tourism On the 20th of October 2011, the International Road Transport Union organises the 7th European Bus and Coach Forum. The subject of this event is the greening of travel and tourism. At this event Huib van Essen from CE Delft will give a presentation on the environmental performances of bus and coach transport and the potential that these modes may have for greening mobility, transport and travel. This paper is the background paper of this presentation. It discusses the environmental performance of bus and coach transport in relation to other modes and various policy strategies.
The environmental performance of buses and coaches Particularly coach transport has important environmental benefits compared to competing modes, in particular the CO2 emissions per passenger transported, compared to passenger cars and aviation. The average CO2 emissions of coach transport per passenger transported are the best in class for long distance transport (together with electric trains, depending on electricity mix). They are considerably lower than cars and even four to eight times lower than for aviation. Public transport buses have also lower climate impacts than cars, but as the occupancy rates are on average lower than for coaches, the differences are much smaller. Where CO2 emissions per passenger are relatively low, buses emit a relatively higher amount of air pollutants (particulate matter and NOx) per passenger transported. For public transport buses emissions per passenger are currently higher than for an average car. The level of pollutant emissions of passenger cars and coaches is roughly in the same range and it depends on the fuel type and occupancy rate which mode scores better. In the coming decade air pollutant emission factors of bus and coach transport will improve significantly because of the Euro VI emissions standards. In the short term, the progress in reducing CO2 emissions of bus and coach transport is likely to be smaller than for cars and rail transport. This is the results of the CO2 regulation of cars, the EU 2020 targets for electricity and the fact that energy efficiency improvements for buses and coaches will be compensated by the energy use of after-treatment systems for pollutant emissions, needed for meeting the Euro VI standards. However, also at the end of this decade, conventional (diesel-powered) coach transport is likely to be still among the most climate friendly modes of transport. Regarding other environmental and socio-economic impacts, we conclude that collective passenger transport by bus and coach has generally important advantages over passenger cars. The total socio-cost ratios per passenger-kilometre of bus transport are estimated to be two to four times lower than for passenger cars. They are also lower than for rail transport, because of the relatively high costs of rail infrastructure (CE, 2004).
Greening of bus and coach transport To remain a relatively green mode of transport, further improvements in the energy efficiency of buses and coaches will be needed as well as a shift to low-carbon energy carriers.
6 October 2011 4.596.1 – Bus and coach transport for greening mobility
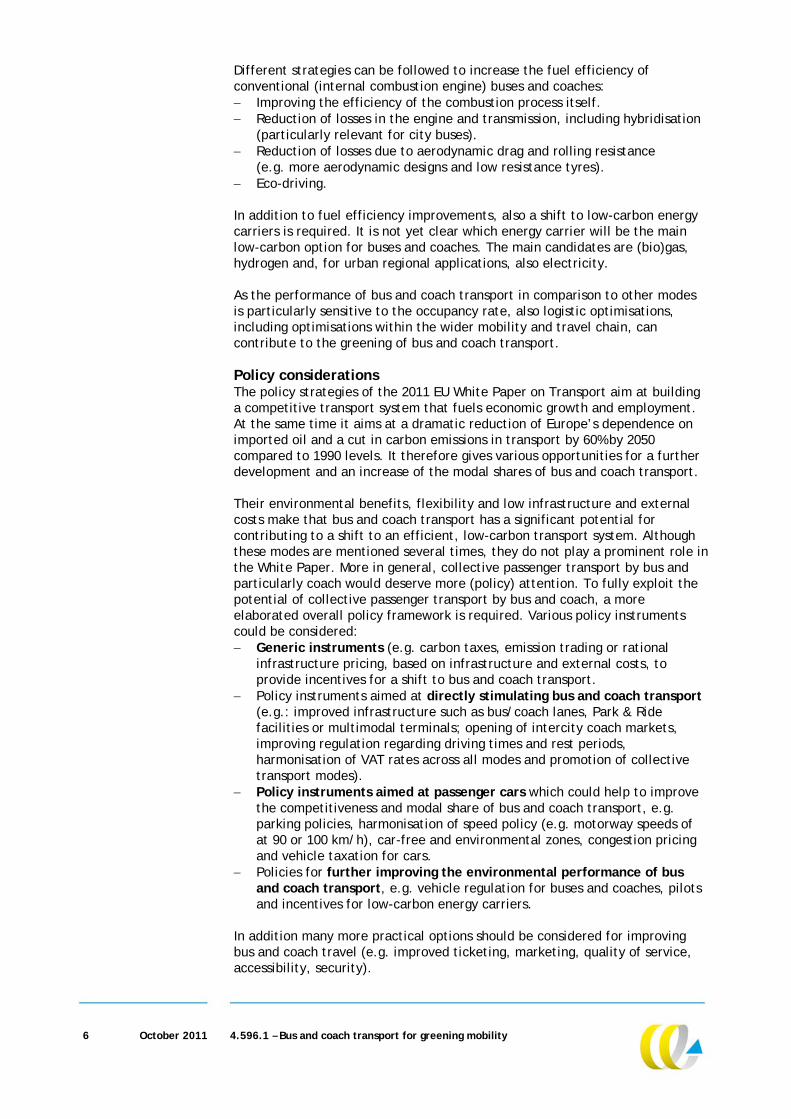
Different strategies can be followed to increase the fuel efficiency of conventional (internal combustion engine) buses and coaches: Improving the efficiency of the combustion process itself. Reduction of losses in the engine and transmission, including hybridisation
(particularly relevant for city buses). Reduction of losses due to aerodynamic drag and rolling resistance
(e.g. more aerodynamic designs and low resistance tyres). Eco-driving. In addition to fuel efficiency improvements, also a shift to low-carbon energy carriers is required. It is not yet clear which energy carrier will be the main low-carbon option for buses and coaches. The main candidates are (bio)gas, hydrogen and, for urban regional applications, also electricity. As the performance of bus and coach transport in comparison to other modes is particularly sensitive to the occupancy rate, also logistic optimisations, including optimisations within the wider mobility and travel chain, can contribute to the greening of bus and coach transport.
Policy considerations The policy strategies of the 2011 EU White Paper on Transport aim at building a competitive transport system that fuels economic growth and employment. At the same time it aims at a dramatic reduction of Europe’s dependence on imported oil and a cut in carbon emissions in transport by 60% by 2050 compared to 1990 levels. It therefore gives various opportunities for a further development and an increase of the modal shares of bus and coach transport. Their environmental benefits, flexibility and low infrastructure and external costs make that bus and coach transport has a significant potential for contributing to a shift to an efficient, low-carbon transport system. Although these modes are mentioned several times, they do not play a prominent role in the White Paper. More in general, collective passenger transport by bus and particularly coach would deserve more (policy) attention. To fully exploit the potential of collective passenger transport by bus and coach, a more elaborated overall policy framework is required. Various policy instruments could be considered: Generic instruments (e.g. carbon taxes, emission trading or rational
infrastructure pricing, based on infrastructure and external costs, to provide incentives for a shift to bus and coach transport.
Policy instruments aimed at directly stimulating bus and coach transport (e.g.: improved infrastructure such as bus/coach lanes, Park & Ride facilities or multimodal terminals; opening of intercity coach markets, improving regulation regarding driving times and rest periods, harmonisation of VAT rates across all modes and promotion of collective transport modes).
Policy instruments aimed at passenger cars which could help to improve the competitiveness and modal share of bus and coach transport, e.g. parking policies, harmonisation of speed policy (e.g. motorway speeds of at 90 or 100 km/h), car-free and environmental zones, congestion pricing and vehicle taxation for cars.
Policies for further improving the environmental performance of bus and coach transport, e.g. vehicle regulation for buses and coaches, pilots and incentives for low-carbon energy carriers.
In addition many more practical options should be considered for improving bus and coach travel (e.g. improved ticketing, marketing, quality of service, accessibility, security).

7 October 2011 4.596.1 – Bus and coach transport for greening mobility
1 Introduction
1.1 Context: challenges for transport
Transport in Europe faces various serious challenges. Many countries and regions suffer from air pollution and noise and severe congestion on their road networks. Moreover, transport is a major source of greenhouse gas emissions and so contributing to climate change. While in many sectors greenhouse gas emissions have started to decrease, the total emissions from transport are still growing. In addition, plans for improving the EU transport infrastructure, like the Trans-European Network (TEN-T) face problems finding sufficient financial resources. In this context the European Commission presented in the spring of 2011 the new White Paper on transport. This paper sets stage for the transport policy of the next decade. It contains a broad range of objectives for making transport more efficient, greener and safer, including a 60% reduction target for greenhouse gas emissions compared to 1990 levels. The strategy in the White Paper for meeting these objectives includes making vehicles more energy efficient, decarbonisation of energy carriers and a shift to cleaner and more efficient transport modes. Compared to competing transport modes, bus and coach transport can have important advantages, e.g. regarding energy efficiency or efficient use of available infrastructure capacity. Therefore these modes could be an element in solving the main challenges of the passenger transport.
1.2 Aim of this paper – potential of bus and coach transport
On 20 October 2011, the International Road Transport Union organises the 7th European Bus and Coach Forum. The subject of this event is the greening of travel and tourism. At this event Huib van Essen from CE Delft will give a presentation on the environmental performances of bus and coach transport and the role these modes may play in the greening of transport. This paper is the background paper of this presentation. It discusses the following subjects: Comparison of the environmental performances of transport modes
(Chapter 2). Policy strategy of the EU White Paper on Transport (Chapter 3). Potential of collective bus and coach transport in the greening of transport
and related policy issues (Chapter 4). Main conclusions and recommendations (Chapter 5).

8 October 2011 4.596.1 – Bus and coach transport for greening mobility

9 October 2011 4.596.1 – Bus and coach transport for greening mobility
2 Comparison of buses with other transport modes
2.1 Introduction
In this chapter, bus and coach transport are compared with other transport modes. First, we discuss the key methodological issues for comparisons of transport modes (in Paragraph 2.2) and specific assumptions for bus and coach transport (in Paragraph 2.3). Next, in Paragraph 2.4, we show comparisons of transport modes based on the different emissions per passenger-kilometre. In Paragraph 2.5 we discuss how these are expected to develop over the next decade. In Paragraph 2.6, a comparison of transport modes on other environmental indicators is presented.
2.2 Methodological issues for comparing transport modes on their emissions
There are various studies, datasets and models for comparing transport modes on their emissions. The relative performance of the various modes depends on a whole range of assumptions, in particular: Emission factors (changing over time because of vehicle regulation, varying
with road types). Logistic parameters (e.g. occupancy rates1 and transport to/from public
transport terminals). A report by CE Delft (CE, 2003) showed that it is dangerous to compare just the overall average emissions of various transport modes, since modes operate at different markets with different characteristics. Environmental comparisons between transport modes only make sense for well-defined, homogeneous and competing markets and for complete transport chains. If sound transport policy conclusions are to be drawn, moreover, analysis must move beyond the present to include the anticipated future environmental performance of the various modes of interest. It needs to be considered that different modes are relevant for travel over short or long distances. For travelling short distances the collective transport modes used are mostly limited by city/regional buses, tramways, subways and local trains. Personal transportation can be undertaken by car, motorcycle or moped or by zero emissions modes such as walking and cycling. For longer distances coaches, intercity trains, high speed trains and aircraft can be used, while mopeds, walking and cycling are unlikely. In this paper we present data from STREAM (CE, 2008) because this study differentiates both emission factors and logistic parameters to market segments (distance class), types of transport (car, coach vs. public transport bus), fuel types and road types. It provides a comprehensive overview of the emissions of the different transport modes. CE Delft developed STREAM (Study on the Transport Emissions of All Modes) on request of the Dutch Ministries of
1 Including empty driving.
10 October 2011 4.596.1 – Bus and coach transport for greening mobility
Transport (Netherlands Institute for Transport Policy Analysis, KiM) and Environment. STREAM provides both basic data of different transport modes as well as comparisons of different modalities for specific cases. The comparisons of various modes cover both the tank-to-wheel emissions (from tailpipes of the vehicles) and the well-to-wheel emissions (so including the emissions related to fuel and electricity production).
The calculated emission factors in STREAM are based on fleet averages for the Netherlands, which are generally also quite representative for the EU. All emission factors used in STREAM represent real life conditions, which can be considerably higher than the values obtained from test cycles for type approval.
2.3 Specific assumptions for bus and coach transport
The energy use of buses depends on the specific traffic conditions. Therefore the variation in emissions for different roads is used to determine emission factors per bus type: City bus: 100% city roads Regional bus: 50% city roads + 50% country roads Coach: 25% city roads + 25% country roads + 50% motorways The emission data in STREAM are based on the database of the Taakgroep Verkeer en Vervoer, which also serves as data basis for the transport related data in the National Emissions Inventory for the Netherlands. Next to road types, also logistic parameters affect the emissions of buses. First of all occupancy rates in terms of the average number of passengers per bus-kilometre is a key parameter. As can be seen from Table 1, vehicle occupancy rates of coaches are much higher than for public transport buses. In addition, also within the segment of coaches and public transport buses, vehicle occupancy rates differ substantially. The lower occupancy rates for public transport buses can at least partly be explained by public service obligations, which require also some less profitable lines with low occupancy rates to be maintained. Both for coaches and buses not all kilometres driven are productive, as in both cases there are some empty trips. For coaches the share of empty trips is usually higher than for buses, see also Table 1. Another important parameter is the so-called detour-factor. This factor expresses the ratio between the distance by road (for the fastest route) and the actually driven distances. For passenger cars this factor is usually equal to one. For rail, bus and air transport this factor is usually higher than one. For coaches however, this factor is usually much smaller than for public transport buses. Finally there is the door-to-door effect: bus transport and also other modes like rail and air transport, require some transport from the origin of the trip to terminals or bus/coach stops and also at the end of the trip to the final destination. The assumptions for this are also summarised in Table 1.

11 October 2011 4.596.1 – Bus and coach transport for greening mobility
Table 1 Logistic parameters for buses
Percentage of
detouring
Share of transport
to/from bus
stops/terminals
Average occupancy
of productive
kilometres
Productive
kilometres
Min. Max. Min. Max.
Type of
bus
Passengers/vehicle % % % % %
City bus 13 93% 0% 25% 0% 0%
Regional
bus
14 93% 0% 25% 0% 15%
Coach 38 76% 0% 5% 0% 15%
Source: CE (2003) in STREAM; CE (2008).
Steer Davies Gleave (2009) estimated the average occupancy for all type of coach transport in the EU at about 26 passengers. In STREAM (Table 1) this is about the same: 29 passenger s per coach (0.76 * 38). Note that the occupancy rate for coaches varies with the type of transport. Regular long distance intercity coach lines have the lowest occupancy rates (usually around 25). Tourist coach trips of more than one-day have the highest occupancy rates: on average 42 passengers per coach (Steer Davies Gleave, 2009).
2.4 Comparison of modes in specific cases
Based on the basic data for different modalities specific cases are elaborated. Comparisons are made for climate effects (CO2 emissions) and the air pollutant emissions (NOx and Particulate Matter2). Two distance classes are distinguished here: ‘short range’ represents distances of 0-50 km, which are typical for commuter travel and local traffic; ‘long range' implies distances exceeding 100 km. The emissions are based on the average occupancy rate, the average transport to/from bus stops/terminals (assumed to be travelled by city bus) and detouring rate. For the average vehicle occupancy rate, a range is provided based on best-case and worst-case scenarios.
2.4.1 Results for short range transport The results for short range passenger transport are presented in Figure 1, Figure 2 and Figure 3 (for CO2, NOx and PM10 emissions, respectively). From these graphs it is clear that on average the collective transport modes have lower emissions compared to individual modes. Mopeds and IC trains are the most energy efficient. Only with an occupancy rate above the average (of about 1.6 passenger per car) passenger cars can compete with public transport. Although buses fall within the category of low CO2 emission modes, city buses as well as regional buses pollute a relatively high amount of NOx. The graphs make clear that the performance of bus transport in comparison to other modes is particularly sensitive to the occupancy rate. Public transport buses with low occupancy rates perform hardly better than cars, while buses with high occupancy rates can have much better environmental performances.
2 Other types of PM emissions related to the wear and tear of a vehicle are not included here.

12 October 2011 4.596.1 – Bus and coach transport for greening mobility
Coaches are not included in these graphs, but with their much higher occupancy rates than public transport buses (two to three times higher!), they have much lower CO2 emissions than all other modes (less than 50 g/ passenger-km, about the same level as the intercity train), and they are also competitive in terms of air pollutant emissions.
Figure 1 Comparison of competing modes on their CO2 (g/pass-km); short range
CO2 (g/pass-km); short range; day average; 2010
0
50
100
150
200
250
Car (p
etrol)
Car (d
iese
l)
Car (L
PG)
Moped
Moto
rcyc
le
City b
us
Regio
nal bus
Tram
Metro
Reg. t
rain (e
lec.)
Reg. t
rain (d
iesel)
IC tr
ain (e
lec.)
Average util. 1 pass. 2 pass. 3 pass. 4 pass.
Source: STREAM, CE (2008).
Figure 2 Comparison of competing modes on their NOx emissions (g/pass-km); short range
NOx (g/pass-km); short range; day average; 2010
0,00,20,40,60,81,01,21,4
Car (p
etrol)
Car (d
iese
l)
Car (L
PG)
Moped
Moto
rcyc
le
City b
us
Regio
nal bus
Tram
Metro
Reg. t
rain (e
lec.)
Reg. t
rain (d
iesel)
IC tr
ain (e
lec.)
Average util. 1 pass. 2 pass. 3 pass. 4 pass.
Source: STREAM, CE (2008).

13 October 2011 4.596.1 – Bus and coach transport for greening mobility
Figure 3 Comparison of competing modes on their PM emissions (g/pass-km); short range
PM10 (g/pass-km); short range; day average; 2010
0,00
0,02
0,04
0,06
0,08
0,10
0,12
Car (p
etrol)
Car (d
iese
l)
Car (L
PG)
Mope
d
Moto
rcyc
le
City b
us
Regio
nal bu
sTra
mM
etro
Reg. t
rain (e
lec.)
Reg. t
rain (d
iesel)
IC tr
ain
(ele
c.)
Average util. 1 pass. 2 pass. 3 pass. 4 pass.
Source: STREAM, CE (2008); emissions of wear & tear are not included.
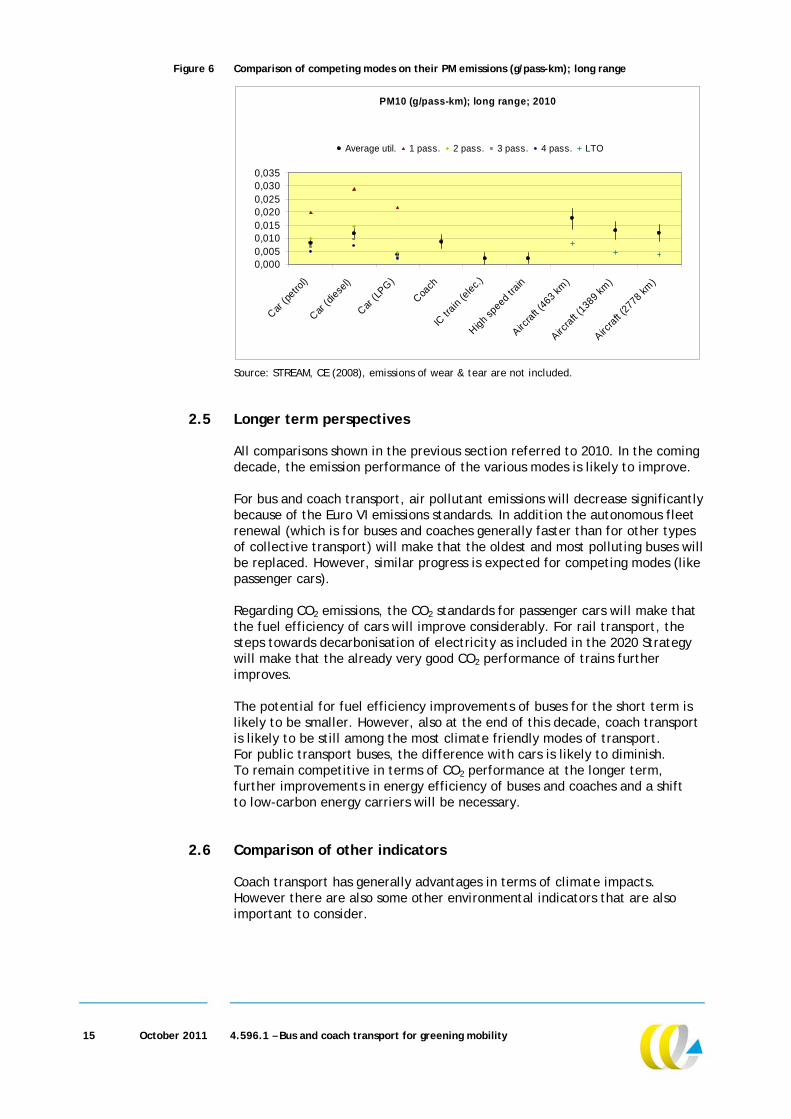
2.4.2 Results for long range transport The modes that are competing on long distance transport (> 100 km) are different than the typical modes for short distance. Public transport buses mainly operate at shorter distances, while coach transport is particularly important in medium and long distance. The cases for the long range for CO2, NOx and PM10 are presented in Figure 4, Figure 5 and Figure 6, respectively. On long distances, the coach is the most energy efficient transport mode, followed by the electric intercity train. In this context it should be mentioned that the electricity mix in some other countries is more in favour of rail, making that in some cases this is just the other way around. The CO2 emissions per passenger of a passenger car are equal to the emissions of a coach in (exceptional) case that the car carries four passengers. However, with one or two persons per car and even with the assumed average for long distance car transport of 2.5, the emissions of coach transport are much lower. CO2 emissions from aviation are much higher than all other modes, up to even four to eight times higher than the CO2 emissions of a coach. Looking at air pollutant emissions, a coach emits on average a relatively high amount of NOx compared to the other modes: only aviation and cars with less than two passengers emit more. Concerning Particulate Matter only cars on LPG and electric trains score better. Passenger cars on petrol and diesel can compete with coaches depending on the occupancy rate.

14 October 2011 4.596.1 – Bus and coach transport for greening mobility
Figure 4 Comparison of competing modes on their CO2 emissions (g/pass-km): long range
CO2 (g/pass-km); long range; 2010
050
100150200250300350400450
Car (p
etro
l)
Car (d
iese
l)
Car (L
PG)
Coach
IC tr
ain
(ele
ctric)
High sp
eed
train
Aircra
ft (4
63 km
)
Aircra
ft (1
389
km)
Aircra
ft (2
778
km)
Average util. 1 pass. 2 pass. 3 pass. 4 pass. CO2-eq
Source: STREAM, CE (2008).
Note: The climate impacts of non-CO2 emission from aircraft at high altitude are included.
Figure 5 Comparison of competing modes on their NOx emissions (g/pass-km); long range
NOx (g/pass-km); long range; 2010
0,00,10,20,30,40,50,60,70,80,9
Car (p
etrol)
Car (d
iese
l)
Car (L
PG)
Coach
IC tr
ain (e
lec.)
High speed tr
ain
Aircra
ft (4
63 km)
Aircra
ft (1
389 km)
Aircra
ft (2
778 km)
Average util. 1 pass. 2 pass. 3 pass. 4 pass. LTO
Source: STREAM, CE (2008).
15 October 2011 4.596.1 – Bus and coach transport for greening mobility
Figure 6 Comparison of competing modes on their PM emissions (g/pass-km); long range
PM10 (g/pass-km); long range; 2010
0,0000,0050,0100,0150,0200,0250,0300,035
Car (p
etrol)
Car (d
iese
l)
Car (L
PG)
Coach
IC tr
ain (e
lec.)
High speed tr
ain
Aircra
ft (4
63 km)
Aircra
ft (1
389 km)
Aircra
ft (2
778 km)
Average util. 1 pass. 2 pass. 3 pass. 4 pass. LTO
Source: STREAM, CE (2008), emissions of wear & tear are not included.
2.5 Longer term perspectives
All comparisons shown in the previous section referred to 2010. In the coming decade, the emission performance of the various modes is likely to improve. For bus and coach transport, air pollutant emissions will decrease significantly because of the Euro VI emissions standards. In addition the autonomous fleet renewal (which is for buses and coaches generally faster than for other types of collective transport) will make that the oldest and most polluting buses will be replaced. However, similar progress is expected for competing modes (like passenger cars). Regarding CO2 emissions, the CO2 standards for passenger cars will make that the fuel efficiency of cars will improve considerably. For rail transport, the steps towards decarbonisation of electricity as included in the 2020 Strategy will make that the already very good CO2 performance of trains further improves. The potential for fuel efficiency improvements of buses for the short term is likely to be smaller. However, also at the end of this decade, coach transport is likely to be still among the most climate friendly modes of transport. For public transport buses, the difference with cars is likely to diminish. To remain competitive in terms of CO2 performance at the longer term, further improvements in energy efficiency of buses and coaches and a shift to low-carbon energy carriers will be necessary.
2.6 Comparison of other indicators
Coach transport has generally advantages in terms of climate impacts. However there are also some other environmental indicators that are also important to consider.
16 October 2011 4.596.1 – Bus and coach transport for greening mobility
First of all, transport noise is a serious problem in many EU countries, with severe nuisance and health impacts. Both road, rail and air transport contribute significantly to this. In general a bus makes more noise than a car, but as for air emissions, this is more or less compensated by the higher efficiency (more passengers per vehicles). The impacts per passenger- kilometre are on average in the same range. Accident rates of bus and coach transport differ widely per country, just as for other modes. On average, the external costs of accidents of bus and coach transport are more than 60% lower than for passenger cars (CE, INFRAS, ISI, 2011). Compared to passenger cars and rail transport, bus and coach transport have relatively low infrastructure costs. In addition they require much less parking space per passenger than cars. Comparisons have shown that the total socio-economic costs3 of a bus or coach per vehicle-kilometre are on average about four to five times higher than for a passenger car (CE, 2004). With an average number of passengers that is on average about eight times higher for public transport to even ten to fifteen times higher for coaches (see Paragraph 2.3), it is clear that the total socio-costs per passenger-kilometre of bus and coach transport are much (about two to four times) lower than for passenger cars. The socio-economic costs of bus and coach transport are even lower than for rail transport, because of the relatively high costs of rail infrastructure (CE, 2004). For more details on external and infrastructure costs, we refer to the studies mentioned above.
3 This includes the costs of the environmental impacts (air pollution, noise, climate change)
and other socio-economic impacts (accidents and infrastructure).

17 October 2011 4.596.1 – Bus and coach transport for greening mobility
3 EU White Paper on Transport
3.1 Introduction
In the 2011 White Paper on Transport4, the European Commission announced forty concrete initiatives for the next decade. They are aimed at building a competitive transport system that will increase mobility, remove major barriers in key areas and fuel economic growth and employment. At the same time, the Commission set specific objectives for greenhouse gas reduction in transport in its Roadmap for decarbonisation5, which is further elaborated in the White Paper: a dramatic reduction of Europe's dependence on imported oil and a cut in the carbon emissions of transport by 60% by 2050 compared to 1990 levels. The 2011 White Paper is the successor of the 2001 White Paper (Time to decide) for which in 2006 a mid-term review took place. In this chapter we summarise the main overall policy targets from the White Paper (Paragraph 3.2) and the main policy issues related to bus and coach transport (Paragraph 3.3).
3.2 Overall targets
The overall target of the EU is to reduce greenhouse gas emissions by 80-95% below 1990 levels by 2050. The sector specific target for the transport sector is to reduce greenhouse gas emissions by at least 60% below 1990 levels by 2050. By 2030 greenhouse gas emissions should be reduced by 20% below the level of 2008. In the text box the ten goals formulated as benchmarks for achieving the 60% reduction target (and the other objectives of the White Paper) are listed.
4 White Paper - Roadmap to a Single European Transport Area – Towards a competitive and
resource efficient transport system SEC (2001) 359, 28 March 2011.
5 A Roadmap for moving to a competitive low-carbon economy in 2050, SEC (2011) 289.
18 October 2011 4.596.1 – Bus and coach transport for greening mobility
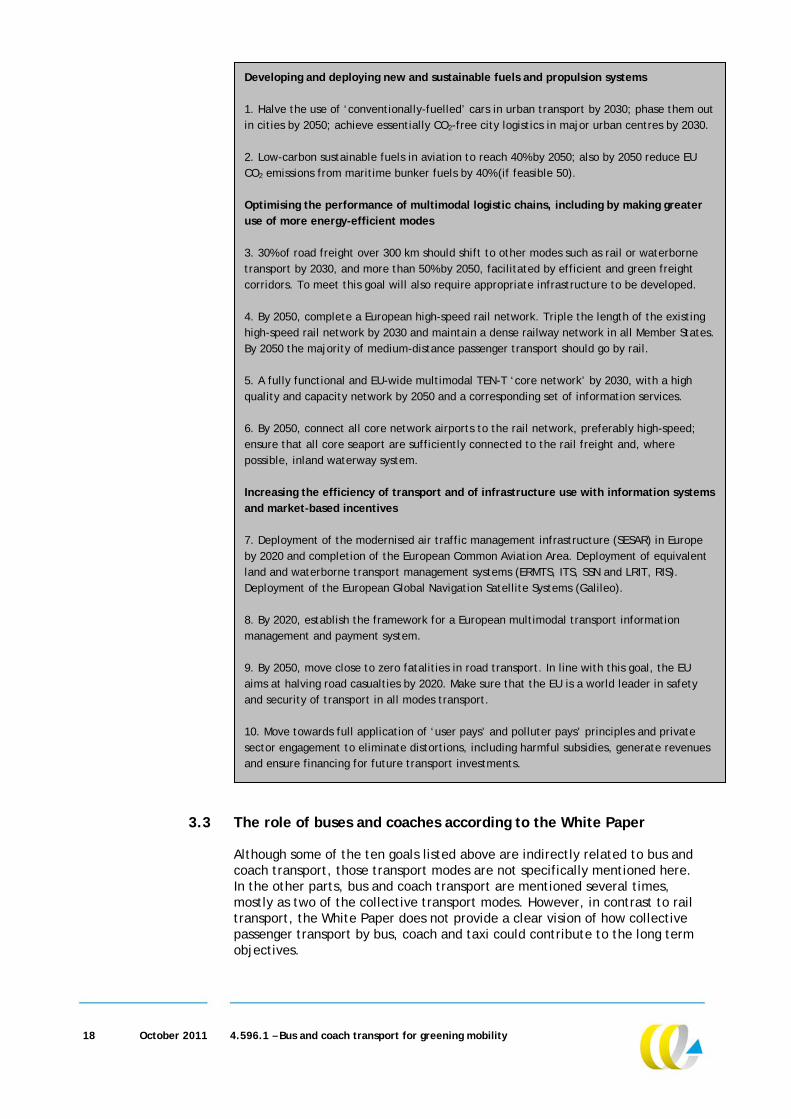
3.3 The role of buses and coaches according to the White Paper
Although some of the ten goals listed above are indirectly related to bus and coach transport, those transport modes are not specifically mentioned here. In the other parts, bus and coach transport are mentioned several times, mostly as two of the collective transport modes. However, in contrast to rail transport, the White Paper does not provide a clear vision of how collective passenger transport by bus, coach and taxi could contribute to the long term objectives.
Developing and deploying new and sustainable fuels and propulsion systems
1. Halve the use of ‘conventionally-fuelled’ cars in urban transport by 2030; phase them out in cities by 2050; achieve essentially CO2-free city logistics in major urban centres by 2030.
2. Low-carbon sustainable fuels in aviation to reach 40% by 2050; also by 2050 reduce EU CO2 emissions from maritime bunker fuels by 40% (if feasible 50). Optimising the performance of multimodal logistic chains, including by making greater use of more energy-efficient modes
3. 30% of road freight over 300 km should shift to other modes such as rail or waterborne transport by 2030, and more than 50% by 2050, facilitated by efficient and green freight corridors. To meet this goal will also require appropriate infrastructure to be developed.
4. By 2050, complete a European high-speed rail network. Triple the length of the existing high-speed rail network by 2030 and maintain a dense railway network in all Member States. By 2050 the majority of medium-distance passenger transport should go by rail.
5. A fully functional and EU-wide multimodal TEN-T ‘core network’ by 2030, with a high quality and capacity network by 2050 and a corresponding set of information services.
6. By 2050, connect all core network airports to the rail network, preferably high-speed; ensure that all core seaport are sufficiently connected to the rail freight and, where possible, inland waterway system. Increasing the efficiency of transport and of infrastructure use with information systems and market-based incentives
7. Deployment of the modernised air traffic management infrastructure (SESAR) in Europe by 2020 and completion of the European Common Aviation Area. Deployment of equivalent land and waterborne transport management systems (ERMTS, ITS, SSN and LRIT, RIS). Deployment of the European Global Navigation Satellite Systems (Galileo).
8. By 2020, establish the framework for a European multimodal transport information management and payment system.
9. By 2050, move close to zero fatalities in road transport. In line with this goal, the EU aims at halving road casualties by 2020. Make sure that the EU is a world leader in safety and security of transport in all modes transport.
10. Move towards full application of ‘user pays’ and polluter pays’ principles and private sector engagement to eliminate distortions, including harmful subsidies, generate revenues and ensure financing for future transport investments.
19 October 2011 4.596.1 – Bus and coach transport for greening mobility
Below we summarise the ways bus and coach transport is mentioned in the White Paper. First of all, the White Paper mentions that the energy efficiency improvements of vehicles and cleaner fuels will result in emission reductions, but that these are not likely to achieve the necessary percentage of emission reduction. Also the problem of congestion will not be solved by those developments. Therefore large volumes should be consolidated for transfers over long distances. For passenger transport this implies greater use of rail transport, buses and coaches. In order to shift passengers from individual transport modes to the collective transport modes (including private coach transport), the White Paper mentions that the integration of modal networks should be improved. Different public/collective transport stations should be linked together and should be transformed into multimodal connection platforms for passengers, and access of coaches to these terminals should be guaranteed. Thirdly, the quality, accessibility and reliability of transport infrastructure and services become more and more important in the next years to promote the use of collective transport. The availability of information on travel times, alternatives and multimodal connections can also be identified as an important factor in order to ensure seamless door-to-door mobility. Consequently, in case a higher share of travel by collective transport can be reached together with minimum service obligations, the density and frequency of services can be increased, which will result in a virtuous circle for public transport modes. Fourthly, large fleets of urban buses can also play a significant role in the introduction of alternative propulsion systems and fuels. These can contribute substantially to the reduction of the carbon intensity of urban transport. Fleets of urban buses can serve as a test bed for new technologies and can provide the opportunity to early market deployment. Zooming in on the urban context, urban transport is responsible for a quarter of CO2 emissions from transport. According to the White Paper, a mixed strategy is needed to reduce emissions and congestion in the urban context. This strategy should include land use planning, pricing schemes, efficient public transport services and infrastructure for non-motorised modes and charging/refuelling of clean vehicles. Overall, the policy strategies of the White Paper give various opportunities for a further development and increasing modal shares of bus and coach transport. However, public transport gets more attention than private bus transport, while (as we have seen in Chapter 2) particularly coach transport has high environmental benefits. The White Paper does not mention clear targets nor a strategy for increasing the share of coach transport. The development of the potential of coach transport and travel in short, medium and long distances is therefore a subject that deserves further (policy) attention.

20 October 2011 4.596.1 – Bus and coach transport for greening mobility
21 October 2011 4.596.1 – Bus and coach transport for greening mobility
4 The potential of bus and coach transport for greening transport
4.1 Introduction
In the previous two chapters we saw that bus and particularly coach transport can have important environmental benefits and that they fit well within the long term transport strategy set out in the 2011 White Paper on Transport. However, we also saw that continuous progress of the environmental performance is important to remain a relatively ‘green’ mode of transport. In this chapter, we will focus on the way bus and coach transport could further contribute to the greening of transport. Both the greening of bus and coach transport itself and policies for increasing the share of bus and coach transport are briefly summarised. First we discuss the impacts of emission standards and fuel efficiency improvements (Paragraph 4.2). Next we will discuss the options for the further greening of bus and coach transport. First, in Paragraph 4.3, the existing options for improving fuel efficiency of internal-combustion-engine-powered buses and coaches. Next, Paragraph 4.4 summarises the potential application of alternative energy carriers in buses and coaches to reduce CO2 and air polluting emissions is. In Paragraph 4.5 the issue of logistic optimisations is very briefly discussed as well. Finally in Paragraph 4.6, we will discuss policies that could contribute to exploiting the potential of bus and coach transport in the greening of transport.
4.2 Emission standards and short term development
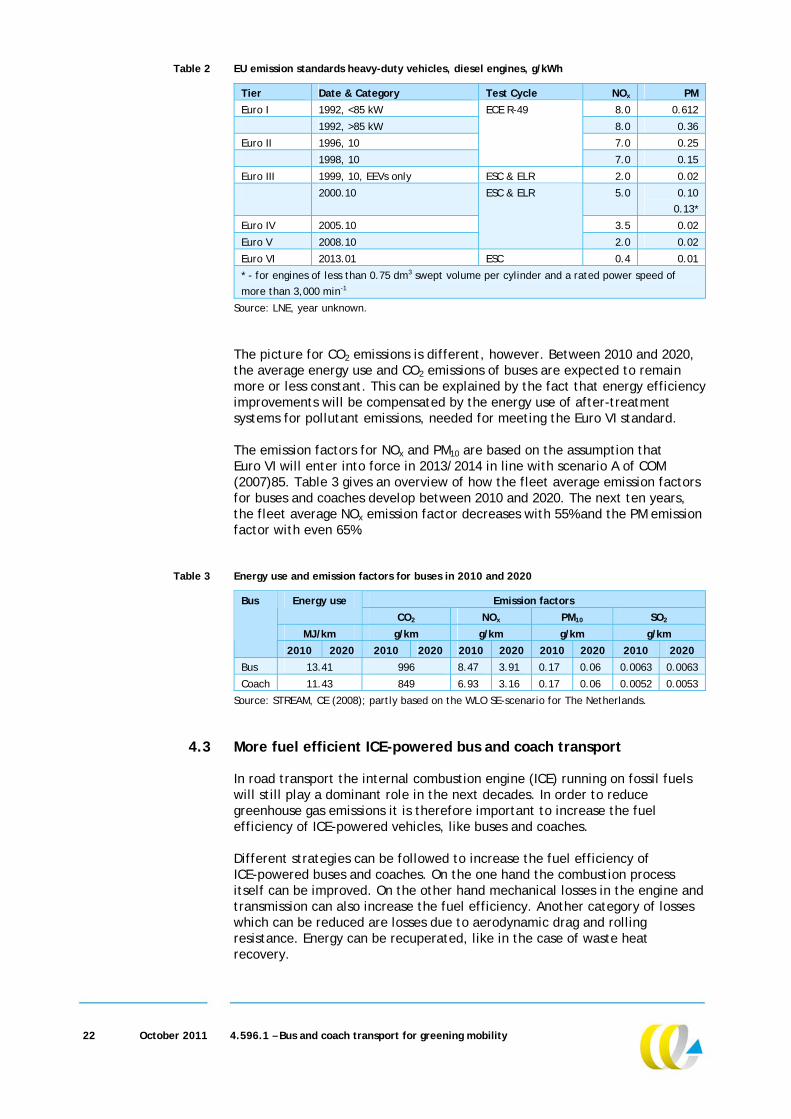
Due to the existence of European emission standards, the fleet of buses and coaches will become greener over time. New buses and coaches should comply with the emission standards for heavy-duty vehicles as mentioned in Table 2. As can be seen Euro V is currently the standard for new vehicles, which from January 2013 will be replaced by Euro VI as the new standard. Depending on the fleet turnover6 the share of Euro VI will increase in the coming years, whereof Euro I and II will be fased out over time. As can be seen from Table 2, the differences in environmental performance of diesel engines are substantial.
6 Fleet renewal for buses and coaches is generally faster than for other types of collective
transport, see also Paragraph 2.5.
22 October 2011 4.596.1 – Bus and coach transport for greening mobility
Table 2 EU emission standards heavy-duty vehicles, diesel engines, g/kWh
Tier Date & Category Test Cycle NOx PM
Euro I 1992, <85 kW 8.0 0.612
1992, >85 kW 8.0 0.36
Euro II 1996, 10 7.0 0.25
1998, 10
ECE R-49
7.0 0.15
Euro III 1999, 10, EEVs only ESC & ELR 2.0 0.02
2000.10 5.0 0.10
0.13*
Euro IV 2005.10 3.5 0.02
Euro V 2008.10
ESC & ELR
2.0 0.02
Euro VI 2013.01 ESC 0.4 0.01
* - for engines of less than 0.75 dm3 swept volume per cylinder and a rated power speed of
more than 3,000 min-1
Source: LNE, year unknown. The picture for CO2 emissions is different, however. Between 2010 and 2020, the average energy use and CO2 emissions of buses are expected to remain more or less constant. This can be explained by the fact that energy efficiency improvements will be compensated by the energy use of after-treatment systems for pollutant emissions, needed for meeting the Euro VI standard. The emission factors for NOx and PM10 are based on the assumption that Euro VI will enter into force in 2013/2014 in line with scenario A of COM (2007)85. Table 3 gives an overview of how the fleet average emission factors for buses and coaches develop between 2010 and 2020. The next ten years, the fleet average NOx emission factor decreases with 55% and the PM emission factor with even 65%.
Table 3 Energy use and emission factors for buses in 2010 and 2020
Emission factors Energy use
CO2 NOx PM10 SO2
MJ/km g/km g/km g/km g/km
Bus
2010 2020 2010 2020 2010 2020 2010 2020 2010 2020
Bus 13.41 996 8.47 3.91 0.17 0.06 0.0063 0.0063
Coach 11.43 849 6.93 3.16 0.17 0.06 0.0052 0.0053
Source: STREAM, CE (2008); partly based on the WLO SE-scenario for The Netherlands.
4.3 More fuel efficient ICE-powered bus and coach transport
In road transport the internal combustion engine (ICE) running on fossil fuels will still play a dominant role in the next decades. In order to reduce greenhouse gas emissions it is therefore important to increase the fuel efficiency of ICE-powered vehicles, like buses and coaches. Different strategies can be followed to increase the fuel efficiency of ICE-powered buses and coaches. On the one hand the combustion process itself can be improved. On the other hand mechanical losses in the engine and transmission can also increase the fuel efficiency. Another category of losses which can be reduced are losses due to aerodynamic drag and rolling resistance. Energy can be recuperated, like in the case of waste heat recovery.

23 October 2011 4.596.1 – Bus and coach transport for greening mobility
For heavy-duty vehicles used for freight transport the reduction potential related to part load efficiency is limited. However, in the case of city buses the options related to part load efficiency can result in significant benefits, because of the dynamic driving pattern of those vehicles. Especially for city buses hybridisation can be a good option to reduce greenhouse gas emissions. It could improve their fuel efficiency by possibly dozens of percents. Hybridisation of coaches will lead to lower reductions, because coaches do not have the dynamic driving pattern of city buses, which brake and accelerate very often. By applying hybridisation not only CO2 emissions are reduced, but regenerative braking also reduces brake wear, and so saves PM emissions. Another reduction measure, worth mentioning when talking about buses and coaches, is the use of low resistance tyres. Approximately 6% of CO2 emissions can be saved when conventional tyres are replaced by low rolling resistance tyres. Also improved aerodynamics of buses could contribute to fuel efficiency improvements and so greenhouse gas reduction. Although not a technical measure, eco-driving can also reduce emissions. By adapting the driving style, fuel use and thus CO2 emissions can be saved. This includes a proactive driving style, optimal use of gears and avoiding of unnecessary braking. Also checking and adjusting tyre pressure on a regular basis can be part of eco-driving. Special training programmes are developed to train drivers. Right after training and depending on the driver style of the driver the reduction potential can be up to 20-25%, however on the longer term and on average a reduction potential of 5-10% is more realistic (Sharpe, 2009).
4.4 Alternative energy carriers and power-trains for buses and coaches
Because road transport is by far the largest source of greenhouse gas emissions in the transport sector and because road transport also has the fastest fleet turnover, most of the R&D on alternative fuels and power-trains focuses on road transport. In this section, we will pay attention to the application of the use of alternative energy carriers and power-trains in buses and coaches.
4.4.1 Gas powered buses There are different types of natural gas, which can be applied in bus and coach transport: Compressed Natural Gas (CNG) Liquefied Natural Gas (LNG) Bio-CNG and bio-LNG In case of CNG, natural gas is compressed, as the name already suggests, where in case of LNG liquid gas is stored in a cryogenic way (at a temperature of around minus 160 Centigrade). Because of the high octane number of natural gas, it is more energy efficient than petrol. When comparing buses equipped with CNG engines (model year 2004) with diesel engines (also model year 2004) the CNG engines produce 49% lower NOx and 84% lower PM emissions. CO2 emissions of natural gas vehicles (NGVs) will approximately be 10-20% lower compared to diesel vehicles.
24 October 2011 4.596.1 – Bus and coach transport for greening mobility
CNG buses already have been applied in different European countries. However, reliability and high capital costs are still points of concern. Another disadvantage of NGVs is the infrastructure needed for refuelling, which makes it not a practical application on the near-term for most heavy-duty vehicles. However, bus operations usually already use dedicated, central refuelling infrastructure and therefore for many types of buses, this barrier does not really exist. Because of the lower energy density of CNG, the storage of CNG in the vehicle itself can also be a problem. For buses, the loss of storage may be acceptable, where in case of passenger cars this loss of storage may be an important barrier for the application. Due to differences in the energy density of CNG and LNG CNG is mostly used for city buses where LNG is more suitable for coaches (because of the on average longer distances). Besides regular CNG and LNG, there is also bio-CNG and bio-LNG, which means that the gas is produced from green gas. Green gas can be biogas from for example co-digestion of corn and manure or landfill gas. Bio-CNG can be distributed through the conventional natural gas infrastructure, where certificates are used to assure the share of bio-CNG, but bio-CNG can also be tanked directly. Green gas vehicles can save up to 80% of the CO2 emissions of a diesel vehicle in case of bio-CNG from landfill gas; for bio-CNG from co-digestion the savings are lower.
4.4.2 Liquid biofuels Biofuels are used on a large scale, because these are used in blends with conventional fuels, for example up to 10% for bio ethanol. Fatty Acid Methyl Ester (FAME or better known as biodiesel) can be blended up to 7% in conventional fuels without engine adaptations. A higher share of biofuels in a blend is also possible, but this requires adaptations to the engine, like has been done in case of flexi-fuel vehicles. For example blends of B30 (30% FAME) or B100 (purely FAME) also exist. The sustainability of biofuels has been heavily debated. It is not possible to provide exact emission reduction potentials for these fuels, because the emission potential depends on the feedstock and production pathway used to produce the biofuel. In case of B100 produced from deep-frying oil, CO2 emissions can be saved up to 90%. Biofuels made from vegetable oils, like soy and palm oil, can reduce only a maximum percentage of 50%. This percentage is influenced by the type of land used for production. There are concerns regarding indirect land use change (ILUC). The competition for land use and limited biomass resources may limit the application and net greenhouse gas reduction potential of liquid biofuels considerably, on the long term.
4.4.3 Electric and plug-in hybrid buses Trolley buses are already a proven technology in various big cities. In comparison to tram and light-rail systems trolley buses are less expensive. Nowadays these trolley bus systems are turned into hybrid systems (with a small diesel engine or battery), which makes it possible to also travel short distance without the overhead wires of the trolley buses (Hill et al., 2009). In the Netherlands different pilot projects are subsidised by the Dutch government in which buses with plug-in hybrid technologies are being tested. For example, in Rotterdam hybrid buses, equipped with a large battery package enabling the bus to drive on electricity for a couple of hours, are being tested. The buses can be charged at night (Agentschap NL, 2011).
25 October 2011 4.596.1 – Bus and coach transport for greening mobility
4.4.4 Hydrogen The R&D on hydrogen and fuel cells mainly focuses on passenger cars. However, there are also some projects in Europe which demonstrate the application of hydrogen fuel cells in buses. The production of hydrogen and transporting the hydrogen to the tank stations is very expensive due to safety reasons. Because of the high (investment) costs a large scale application of hydrogen vehicles is uncertain. The reduction potential of hydrogen is determined by the production method and the energy used for producing hydrogen (TNO, CE, 2011).
4.5 Logistic optimisations
We concluded before that the performance of bus and coach transport in comparison to other modes is particularly sensitive to the occupancy rate. For this reason not only technical improvements are relevant, but also logistic optimisations can contribute to the greening of bus and coach transport. This means that the size of the bus is aligned as much as possible with number of passenger. A specific example of this is including taxis in the collective transport system, particularly in rural areas and at off-peak hours. Other options in this field are optimisation of the frequency of public buses, reduction of empty drives and detouring, innovative incentive schemes and services, partnerships and technologies with proven high passenger occupancy, such as Bus Rapid Transit (BRT). In Paragraph 2.3, we already note that the lower occupancy rates for public transport buses can at least partly be explained by public service obligations, which require also some less profitable lines with low occupancy rates to be maintained. Therefore some further innovations in this area may certainly contribute to higher occupancy rates. In addition, occupancy of bus and coach transport could be improved by stimulating those types of bus and coach transport that have the highest occupancy rates, so in particular coach travel. This is further elaborated in the next section.
4.6 Policy considerations
Bus and particularly coach transport have significant environmental and efficiency advantages over other modes, in particular passenger cars. Therefore they can be an important element in the strategy for meeting the long term objectives of the White Paper. However, only buses with sufficiently high occupancy rates have true environmental benefits. Therefore, particularly in the domain of public transport buses where occupancy rates are on average much lower than for coaches, the focus should be on stimulation of collective bus transport with high occupancy rates. This means that in off-peak periods or rural areas, buses are not always a rational environmental friendly option and to be stimulated. Vans, taxis or even regular cars can in such cases be more efficient.

26 October 2011 4.596.1 – Bus and coach transport for greening mobility
There are many practical options for improving the share of bus and coach transport as well as increasing their occupancy rates. The IRU has developed a guide with various practical options7, which includes the following: Better infrastructure (e.g. central and convenient locations of terminals
and bus/coach stops, dedicated bus and coach lanes, park & ride facilities, priority to buses and coaches at junctions).
Information and new technologies (e.g. real-time information to customers, online planning, localisation technologies, order bus services).
Improved accessibility (e.g. for people with reduced mobility). Effective and fast ticketing (electronically and on streets integrated
ticketing services for all companies and transport modes). Marketing (e.g. mobility management, surveys, direct marketing). Quality of service and satisfaction of customer needs (e.g. by training
drivers). Security (e.g. lighting at bus/coach stops). Proactive promotion framework for collective transport. Raising awareness of green transport. Contracting and operators’ added value. Note that some of these measures require government action, other are mostly within the domain of coach and bus companies. Overall it is important to emphasise that in order to fully exploit the potential of bus and coach transport, an overall policy framework for how to increase the share of collective passenger transport by buses and coaches would be beneficial. There is a wide range of government policy instruments that could stimulate the position of bus and coach transport and that could be part of such a framework (Hill et al., 2010). Below we summarise the main ones. First of all, generic economic instruments for decarbonising transport (carbon taxes or emission trading) and for reducing the other costs of transport (rational infrastructure pricing based on infrastructure and external costs) can provide strong incentives for a shift to bus and coach transport. This could be complemented with awareness raising campaigns for the greening of transport. Secondly, various government policy measures directly aimed at bus and coach transport could be considered to stimulate these modes, e.g. (see for more practical measures also the aforementioned list developed by IRU): Further development and improvement of infrastructure and information
technologies. Allowing coaches to use bus lanes and prioritising them at junctions. Opening the intercity coach market, particularly in countries where
medium and long distance coach lines are not yet allowed. Amendments to the EU Regulation regarding driving times and rest periods
(EC 561/2006) in order to better match with specific issues related to passenger transport.
Harmonisation of VAT rates across the various (collective) transport modes. Promotion of collective transport in general (and/or by bus and coach in
particular).
7 See: http://www.busandcoach.travel/download/smart_movepractical_solutions_final.pdf
27 October 2011 4.596.1 – Bus and coach transport for greening mobility
Thirdly, there is broad range of policy instruments aimed at passenger cars which could help to improve the competitiveness and modal share of bus and coach transport. This includes policies like: Parking policies. Speed policy (harmonisation of bus and car motorway speeds limits,
e.g. at 90 or 100 km/h). Car-free and environmental zones in cities. Congestion pricing. Vehicle taxation for cars. Finally, particularly for the longer term, it is important to consider also policies aimed at further improving the environmental performance of bus and coach transport. Competing modes will improve their environmental performance considerably over the next decade(s). In order to keep their advantages, buses and coaches should improve their fuel efficiency, further reduce their air pollutant emissions and make a shift to low-carbon energy carriers. Important instruments in such a policy strategy could be CO2 regulation for buses and coaches (as is already discussed for trucks as well) and pilots and incentives for low-carbon energy carriers.

28 October 2011 4.596.1 – Bus and coach transport for greening mobility
29 October 2011 4.596.1 – Bus and coach transport for greening mobility
5 Conclusions and recommendations
5.1 Environmental performance of various modes of transport
Bus and particularly coach transport have important environmental benefits compared to competing modes, in particular compared to passenger cars and aviation. However, the performance of bus and coach transport in comparison to other modes is particularly sensitive to the occupancy rate. The average CO2 emissions of coach transport are the best in class for long distance transport (together with electric trains, depending on electricity mix). The greenhouse gas emissions of coaches are much lower than cars (only fully occupied cars with four persons can come close). They are even four to eight times lower than for aviation. Public transport buses have also lower climate impacts than cars, but as the occupancy rates are on average lower than for coaches, the differences are much smaller. Where CO2 emissions are often relatively low, coaches and buses emit relatively high amounts of air pollutants (particulate matter and NOx). For public transport buses these emissions per passenger are currently higher than for an average car. The level of pollutant emissions per passenger for cars and coaches is roughly in the same range and it depends on the fuel type and occupancy rate which mode scores better. In the coming decade, air pollutant emission factors of bus and coach transport will improve significantly because of the Euro VI emissions standards. In addition the autonomous fleet renewal will make that the oldest and most polluting buses are replaced. However similar progress is expected in competing modes (e.g. passenger cars). Regarding the further reduction of CO2 emissions, bus and coach transport will on the short term probably show less progress than cars and rail transport. This is the results of the CO2 regulation of cars, the 2020 targets for electricity and the fact that energy efficiency improvements for buses and coaches will be compensated by the energy use of after-treatment systems for pollutant emissions, needed for meeting the Euro VI standards. However, also at the end of this decade, coach transport is likely to be still among the most climate friendly modes of transport. However, for public buses, the advantage is likely to diminish. To remain competitive in terms of CO2 performance at the longer term, both for buses and coaches further improvements in energy efficiency and a shift to low-carbon energy carriers will be needed. Regarding other environmental and socio-economic impacts, we conclude that bus and coach transport have generally important advantages over passenger cars. The total socio-costs per passenger-kilometre of bus or coach transport are estimated to be two to four times lower than for passenger cars. They are also lower than for rail transport, because of the relatively high costs of rail infrastructure (CE, 2004).

30 October 2011 4.596.1 – Bus and coach transport for greening mobility
5.2 Greening of bus and coach transport
In road transport the internal combustion engine running on fossil fuels will still play a dominant role in the next decades. In order to reduce greenhouse gas emissions and air polluting emissions it is therefore important to increase the fuel efficiency of ICE-powered buses and coaches. Different strategies can be followed to increase the fuel efficiency of ICE-powered buses and coaches: Improving the efficiency of the combustion process itself. Reduction of losses in the engine and transmission, including hybridisation
(particularly relevant for city buses). Reduction of losses due to aerodynamic drag and rolling resistance
(e.g. more aerodynamic designs and low resistance tyres). Eco-driving. In addition to fuel efficiency improvements, also a shift to low-carbon energy carriers is necessary. This is likely to take several decades. It is not yet clear which energy carrier will be the main low-carbon option for buses and coaches. The main candidates are gas (particularly biogas), electric and hydrogen. As the performance of bus and coach transport in comparison to other modes is particularly sensitive to the occupancy rate, also logistic optimisations, including within the mobility and travel chain, can contribute to the greening of bus and coach transport. Examples are innovative incentive schemes and services, partnerships and technologies with proven high passenger occupancy, such as Bus Rapid Transit (BRT).
5.3 Policy considerations for greening mobility by increasing the share of bus and coach transport
Bus and coach transport could very well contribute to the main objectives of the 2011 EU White Paper on transport. However, although bus and coach transport are mentioned several times, they do not play a prominent role in the strategy of the White Paper. Moreover, the White Paper does not provide a clear vision of how the potential of collective passenger transport by bus and coach could be fully exploited. To exploit this potential, it seems that a more elaborated overall policy framework for how to increase the share of collective passenger transport by buses and coaches is needed. Various policy instruments could be part of such a framework: Generic instruments (e.g. carbon taxes, emission trading or rational
infrastructure pricing (based on infrastructure and external costs) to provide incentives for a shift to bus and coach transport).
Policy instruments aimed at directly stimulating bus and coach transport (e.g.: improved infrastructure, such as bus/coach lanes, Park & Ride facilities or multimodal terminals; opening of intercity coach markets, improving regulation regarding driving times and rest periods, harmonisation of VAT rates across all modes and promotion of collective transport modes).
Policy instruments aimed at passenger cars which could help to improve the competitiveness and modal share of bus and coach transport, e.g. parking policies, harmonisation of speed policy (e.g. motorway speeds of at 90 or 100 km/h), car-free and environmental zones, congestion pricing and vehicle taxation for cars.

31 October 2011 4.596.1 – Bus and coach transport for greening mobility
Policies for further improving the environmental performance of bus and coach transport, e.g. vehicle regulation for buses and coaches (as is already discussed for trucks as well), pilots and incentives for low-carbon energy carriers.
In addition many more practical options should be considered for improving bus and coach travel (e.g. improved ticketing, marketing, quality of service, accessibility, security).

32 October 2011 4.596.1 – Bus and coach transport for greening mobility

33 October 2011 4.596.1 – Bus and coach transport for greening mobility
Literature
Agentschap NL, 2011 E-Busz dieselhybrides in Rotterdam Via: http://www.agentschapnl.nl/programmas-regelingen/e-busz-dieselhybrides-rotterdam Last access: 6 October 2011 CE, 2003 H. van Essen, O. Bello, J. Dings, R. van den Brink (RIVM) To shift or not to shift, that’s the question : the environmental performance of freight and passenger transport modes in the light of policy making Delft : CE Delft, 2003
CE, 2004 J.P.L. Vermeulen, B.H. Boon, H.P. van Essen, L.C. den Boer, J.M.W. Dings, F.R. Bruinsma (VU), M.J. Koetse (VU) The price of transport : overview of the social costs of transport Delft : CE Delft, 2004 CE, 2008 L.C. den Boer, F.P.E. Brouwer, H.P. van Essen Studie naar Transport Emissions van Alle Modaliteiten (STREAM) Delft : CE Delft, 2008 CE, 2010 B.E. Kampman, H.J. Croezen, G.M. Verbraak, F.P.E. Brouwer Rijden en varen op gas : kosten en milieueffecten van aardgas en groen gas in transport Delft : CE Delft, 2010 CE, INFRAS, ISI, 2011 Huib van Essen, Arno Schroten, Matthijs Otten (CE Delft), Daniel Sutter, Christoph Schreyer, Remo Zandonella, Markus Maibach (INFRAS), Claus Doll (Fraunhofer ISI) External Costs of Transport in Europe - Update Study for 2008 Delft : CE Delft, 2011 Hill et al., 2009 Nikolas Hill, Tom Hazeldine, Johannes von Einem , Alison Pridmore, David Wynn (all AEA) Alternative Energy Carriers and Powertrains to Reduce GHG from Transport Paper 2 produced as part of contract ENV.C.3/SER/2008/0053 between European Commission Directorate-General Environment and AEA Technology plc Via: www.eutransportghg2050.eu http://www.eutransportghg2050.eu/cms/assets/EU-Transport-GHG-2050-Paper-2-Alt-energy-carriers-and-powertrains-21-12-09-FINAL.pdf
34 October 2011 4.596.1 – Bus and coach transport for greening mobility
Hill et al., 2010 N. Hill, I. Skinner, H. van Essen and R. Smokers Towards the decarbonisation of EU’s transport sector by 2050 Final report produced under the contract ENV.C.3/SER/2008/0053 between European Commission Directorate-General Environment and AEA Technology plc Via: www.eutransportghg2050.eu http://www.eutransportghg2050.eu/cms/assets/EU-Transport-GHG-2050-Final-Report-22-06-10.pdf IRU, (-) Doubling the use of collective passenger transport by bus and coach : Practical Solutions, First edition Paris : International Road Union, (-) Via: http://www.busandcoach.travel/download/smart_movepractical_ solutions_final.pdf Last access: 10 October 2011 LNE, (-) Euronormen voor voertuigen Via: http://www.lne.be/themas/milieu-en-mobiliteit/milieuvriendelijke-voertuigen/ecoscore-en-euronormen/euronormen-voor-voertuigen/euronormen-voor-voertuigen/#Emissienormen_voor_vrachtwagens Last access: 6 October 2011
Sharpe, 2009 Ruben Sharpe (TNO) Technical options for fossil fuel based road transport Paper produced as part of contract ENV.C.3/SER/2008/0053 between European Commission Directorate-General Environment and AEA Technology plc Via: www.eutransportghg2050.eu http://www.eutransportghg2050.eu/cms/assets/Paper-1-preliminary.pdf Steer Davies Gleave, 2009 Study of passenger transport by coach London : Steer Davies Gleave, 2009 TNO, CE, 2011 R. Verbeek (TNO), B. Kampman (CE Delft) Brandstoffen voor het wegverkeer: Kenmerken en perspectief, Factsheets Delft : TNO/CE Delft, 2011