CD30-REDIRECTED CHIMERIC ANTIGEN RECEPTOR T CELLS …
143
CD30-REDIRECTED CHIMERIC ANTIGEN RECEPTOR T CELLS TARGET EMBRYONAL CARCINOMA VIA ANTIGEN-DEPENDENT AND FAS/FASL INTERACTIONS Lee Kyung Hong A dissertation submitted to the faculty at the University of North Carolina at Chapel Hill in partial fulfillment of the requirements for the degree of Doctor of Philosophy in the Department of Microbiology and Immunology. Chapel Hill 2018 Approved by: Gianpietro Dotti Barbara Savoldo Shehzad Sheikh Roland Tisch Yisong Wan Jason Whitmire
Transcript of CD30-REDIRECTED CHIMERIC ANTIGEN RECEPTOR T CELLS …

CD30-REDIRECTED CHIMERIC ANTIGEN RECEPTOR T CELLS TARGET EMBRYONAL
CARCINOMA VIA ANTIGEN-DEPENDENT AND FAS/FASL INTERACTIONS
Lee Kyung Hong
A dissertation submitted to the faculty at the University of North Carolina at Chapel Hill in partial
fulfillment of the requirements for the degree of Doctor of Philosophy in the Department of Microbiology
and Immunology.
Chapel Hill
2018
Approved by:
Gianpietro Dotti
Barbara Savoldo
Shehzad Sheikh
Roland Tisch
Yisong Wan
Jason Whitmire

ii
© 2018
Lee Kyung Hong
ALL RIGHTS RESERVED

iii
ABSTRACT
Lee Kyung Hong: CD30-Redirected Chimeric Antigen Receptor T Cells Target Embryonal Carcinoma
via Antigen-dependent and Fas/FasL Interactions
(Under the direction of Gianpietro Dotti)
Embryonal carcinomas (ECs) and mixed testicular germ cell tumors (TGCTs) containing EC
express CD30 and are the most aggressive TGCT subtypes. Chimeric antigen receptor T cells (CAR-Ts)
combine the cytotoxic properties of T cells with the antigen specificity of monoclonal antibodies to target
antigen-expressing cells, such as infected or cancerous cells. CAR-Ts targeting CD30 (CD30.CAR-Ts)
have shown robust anti-tumor activity against Hodgkin’s lymphoma, but have not been tested against
solid tumors. We tested whether CD30.CAR-Ts could also target ECs using in vitro and in vivo models.
CD30.CAR-Ts exhibited anti-tumor activity in vitro against the human EC cell lines Tera-1, Tera-2 and
NCCIT, and putative EC stem cells identified by Hoechst dye staining. Cytolytic activity of CD30.CAR-
Ts was complemented by sustained proliferation and pro-inflammatory cytokine production. CD30.CAR-
Ts also demonstrated anti-tumor activity in an in vivo xenograft NSG mouse model of metastatic EC.
Remarkably, we observed that CD30.CAR-Ts, while targeting CD30+ EC tumor cells through the CAR
(i.e. antigen-dependent targeting), also eliminated surrounding CD30– EC cells in an antigen-independent
manner via cell-cell contact-dependent Fas/FasL interaction. In addition, inducing Fas (CD95) expression
in CD30+ but Fas– EC was sufficient to improve CD30.CAR-T anti-tumor activity. Overall, these data
suggest that CD30.CAR-Ts can be used as a novel immunotherapy for ECs. Additionally, Fas/FasL
interaction between tumor cells and CAR-Ts can be exploited to reduce tumor escape due to
heterogeneous antigen expression or to improve CAR-T anti-tumor activity.

iv
To my parents, Drs. Hyundae and Gwiryung Hong.

v
ACKNOWLEDGMENTS
To my mentors Dr. Gianpietro Dotti and Dr. Barbara Savoldo, thank you for the invaluable
guidance you have given me during my PhD training. I am grateful to have been given the opportunity to
contribute to the exciting and growing field of cancer immunotherapy. To the Savoldo/Dotti laboratory
members, thank you for making every day coming into lab exciting, intellectually stimulating, and most
of all a great place to work. I appreciate your helpful discussions, both formal and informal, in making me
a better scientist.
Many thanks also go to the mentors who have inspired me along the way. Dr. Susan Henning as
advisor for the UNC Advocates for MD/PhD Women in Science (AMPWIS) student group, thank you for
your encouragement and example. Thanks to the UNC MD/PhD program leadership – Dr. Mohanish
Deshmukh, Dr. Toni Darville, Alison Regan, Carol Herrion, Dr. Kimryn Rathmell (former), and Dr.
Eugene Orringer (former). In particular, I wouldn’t be where I am today without Dr. Orringer, who
recruited me to UNC and instilled me with confidence that I could fulfill my dream of becoming a
physician-scientist. Dr. “O,” I miss you and hope to do you proud.
Finally, many thanks go to my family and friends who have loved and supported me through the
many ups and downs of my training. A special thanks goes to my parents, who have shown me
unconditional support for choosing the MD/PhD career path. I dedicate this part of my scientific journey
to them.

vi
TABLE OF CONTENTS
LIST OF TABLES ..................................................................................................................................... viii
LIST OF FIGURES ..................................................................................................................................... ix
LIST OF ABBREVIATIONS ...................................................................................................................... xi
CHAPTER 1: INTRODUCTION ................................................................................................................. 1
1.1 Tumor infiltrating lymphocyte (TIL) therapy for solid tumors ........................................................... 1
1.2 Engineered T cell receptor (TCR) T cell therapy for solid tumors ...................................................... 2
1.3 Chimeric antigen receptor (CAR) T cell therapy for solid tumors ...................................................... 3
1.4 Development of CD30-specific CAR-Ts (CD30.CAR-Ts) ................................................................. 6
CHAPTER 2: CD30.CAR-Ts TARGET EMBRYONAL CARCINOMA ................................................. 10
2.1 Introduction ....................................................................................................................................... 10
2.2 Methods ............................................................................................................................................. 12
2.3 Results ............................................................................................................................................... 18
2.4 Discussion .......................................................................................................................................... 23
2.5 Authorship Contributions .................................................................................................................. 26
2.6 Figures ............................................................................................................................................... 27
2.7 Tables ................................................................................................................................................. 50
CHAPTER 3: DISCUSSION ...................................................................................................................... 56
3.1 CD30 is an ideal EC antigen to target by CAR-T therapy ................................................................. 56

vii
3.2 CD30.CAR-Ts utilize Fas/FasL interactions to target ECs with
heterogeneous antigen expression .................................................................................................. 57
3.3 CD30.CAR-Ts introduce Fas/FasL interactions in a localized manner ............................................. 58
3.4 Improvements to CD30.CAR-Ts for optimal T cell trafficking and persistence in vivo ................... 60
APPENDIX 1: EPIGENETIC DYSFUNCTION IN TURNER SYNDROME IMMUNE CELLS ........... 64
APPENDIX 2: COMBINATION CENTRAL TOLERANCE AND PERIPHERAL CHECKPOINT
BLOCKADE UNLEASHES ANTI-MELANOMA IMMUNITY ............................................................. 76
REFERENCES…………………………………………………………………………………………... 110

viii
LIST OF TABLES
Table 1.1: Comparison of Adoptive T Cell Therapies……………………………………………………... 9
Table 2.1: List of differentially expressed apoptosis and p53-related genes between
NCCIT and Tera-1 cells…………………………………………………………………………..51
Table 2.2: List of differentially expressed apoptosis and p53-related genes between
NCCIT and Tera-2 cells…………………………………………………………………………..53
Table 2.3: List of differentially expressed apoptosis and p53-related genes between
Tera-1 and Tera-2 cells…………………………………………………………………………...55

ix
LIST OF FIGURES
Figure 1.1: Chimeric antigen receptor (CAR) evolution…………………………………………………... 8
Figure 2.1: CD30 is expressed by EC cell lines and primary ECs.………………………………………..27
Figure 2.2: CD30.CAR-Ts exhibit cytotoxic activity against EC cell lines in vitro….…………………...29
Figure 2.3: EC-derived SP cells are targeted by CD30.CAR-Ts…………………………………………. 30
Figure 2.4: CD30.CAR-Ts localize to EC tumors and exhibit anti-tumor activity in vivo………………..32
Figure 2.5: CD30.CAR-Ts eliminate Tera-1 CD30– cells in a cell contact-dependent
but antigen-independent manner…………………………………………………………………. 34
Figure 2.6: Functional Fas-FasL interaction is critical for the elimination of
CD30– EC cells and enhances anti-tumor activity of CD30.CAR-Ts…………………………….36
Figure 2.S1: CD30.CAR-T characteristics……………………………………………………………….. 38
Figure 2.S2: Co-culture of CD30.CAR-Ts and tumor cells……………………………………………….40
Figure 2.S3: CD30.CAR-Ts proliferate and secrete pro-inflammatory cytokines
in response to EC cell lines………………………………………………………………………. 42
Figure 2.S4: CD30.CAR-T expansion and anti-tumor activity in vivo…………………………………… 43
Figure 2.S5: Tera-1 CD30– cells are eliminated by CAR-Ts in a cell contact-dependent
but antigen-independent manner…………………………………………………………………. 45
Figure 2.S6: Functional Fas-FasL interaction is critical for the elimination of
CD30– EC cells by CD30.CAR-Ts………………………………………………………………. 47

x
Figure 2.S7: Tera-2 cells are susceptible to antigen-independent killing by CD30.CAR-Ts,
while NCCIT cells are resistant to CD30.CAR-T targeting……………………………………... 48
Figure 3.1: Model for CD30.CAR-Ts targeting both CD30+ and CD30– EC cells………………………..63

xi
LIST OF ABBREVIATIONS
ALCL Anaplastic large cell lymphoma
ANOVA Analysis of variance
BLI Bioluminescence
CAIX Carbonic anhydrase 9
CAR Chimeric antigen receptor
CAR-Ts Chimeric antigen receptor T cells
CD30.28-T CD30-redirected chimeric antigen receptor T cell with CD28 endodomain
CD30.BB-T CD30-redirected chimeric antigen receptor T cell with 4-1BB endodomain
CD30.CAR-T CD30-redirected chimeric antigen receptor T cell
CEA Carcinoembryonic antigen
CFSE Carboxyfluorescein succinimidyl ester
CRS Cytokine release syndrome
CTLs Cytotoxic T lymphocytes
DR Death receptor
EBV Epstein-Barr virus
EC Embryonal carcinoma
EGFRvIII Epidermal growth factor receptor variant III
FAP Fibroblast activation protein

xii
Fc Constant fragment
FDA Food and Drug Administration
FR Folate receptor
Fv Variable fragment
GBM Glioblastoma multiforme
HBSS Hank’s Balanced Salt Solution
HL Hodgkin’s Lymphoma
HLA Human leukocyte antigen
IACUC Institutional Animal Care and Use Committee
IFNγ Interferon gamma
IHC Immunohistochemistry
IL-2 Interleukin-2
IL-15 Interleukin-15
i.v. Intravenous
mAb Monoclonal antibody
MHC Major histocompatibility complex
MMAE Monomethyl auristatin E
NSG NOD/SCID/γcnull
NS-TGCTs Non-seminoma testicular germ cell tumors
PD1/PDL1 Programmed cell death 1/programmed death ligand 1

xiii
RANTES regulated on activation, normal T cell expressed and secreted; also known as chemokine
ligand 5 (CCL5)
scFv Single-chain variable fragment
TCRs T cell receptors
TGCTs Testicular germ cell tumors
TILs Tumor infiltrating lymphocytes
TNFα Tumor necrosis factor alpha
TRAIL TNF-related apoptosis-inducing ligand
VEGFR Vascular endothelial growth factor receptor

1
CHAPTER 1: INTRODUCTION
Boosting the immune system to kill cancer cells has a more than 100-year history, beginning in
1891 when William Coley, upon observing that cancer patients with infections showed better tumor control,
used a mixture of heat-killed bacteria to induce regression of inoperable sarcomas (1). Adoptive T cell
therapy harnesses the properties of cytotoxic T lymphocytes (CTLs), an arm of the adaptive immune
system, to circulate systemically, migrate, and target unwanted cells such as infected and/or cancerous cells
while sparing normal cells. As “living drugs,” T cells have multiple advantages over conventional therapies
such as the ability to a) mount a specific cytotoxic immune response against target cells which can involve
recruitment of other immune cells, b) proliferate in response to antigen stimulation, and c) survive long-
term in vivo (1). T cell therapies against solid tumors, which pose their own unique challenges compared
to hematological malignancies, have been tested in clinical trials over the past thirty years with varying
success. Here, advances in adoptive T cell therapy and the evolution of chimeric antigen receptor T cells
(CAR-Ts) against solid tumors, with an emphasis on CD30-specific CAR-Ts, will be discussed.
1.1 Tumor infiltrating lymphocyte (TIL) therapy for solid tumors
Tumor infiltrating lymphocytes (TILs) were first described in the 1970s as potentially being
associated with favorable prognosis as a consequence of increased immune surveillance (2;3). Further
evidence that TILs had a T cell phenotype and the presence of HLA in breast cancer (4;5), melanoma (6;7)
and renal cell carcinoma (8) suggested that, rather than playing a passive role, TILs exhibited anti-tumor
activity mediated by a robust and specific immune response against the cancer cells. Indeed, more recent
studies in ovarian cancer (9), colorectal cancer (10), breast cancer (11), and melanoma (12) have supported
the overarching hypothesis in the immunotherapy field that TILs with an activated pro-inflammatory
phenotype directly contribute to tumor cell lysis and an overall favorable clinical response.

2
Early clinical trials using TILs for melanoma showed promising results with 60% objective
response (12;13), but relied on the use of recombinant IL-2 to expand TIL numbers in vitro after isolation
from tumor biopsies. These protocols were further modified, for example by continuous administration of
recombinant IL-2 (14), lymphodepletion prior to TIL infusion (15-17), or more recently using short-term
cultured TILs (18) to further improve TIL expansion and persistence after infusion in patients. Based on
these early results for melanoma, TIL clinical trials were subsequently expanded for other cancers. For
renal cell carcinoma, TIL therapy with recombinant IL-2 showed a 9.1% complete response and 25.5%
partial response (19). In addition, 29% of patients who received TILs with continuous infusions of IL-2
showed an objective tumor response (14). Stage III non-small cell lung carcinoma patients (20) and
epithelial ovarian cancer patients (21) also showed an improvement in reduced local relapse and improved
disease-free survival compared to standard chemotherapy alone.
However, many hurdles remained for TIL therapy that limited its applicability. Only a fraction of
cancer patients qualified for TIL therapy based on several criteria: a) a resectable tumor that is TIL positive,
b) TILs that can be successfully isolated and expanded, and c) TILs that exhibit anti-tumor activity (22).
Because of the high number of TILs required (on the order of 1010-11), in vitro expansion was laborious and
took several weeks (23;24) and was not feasible for some TILs (25). In addition, whether TILs contain
tumor specific CTLs was difficult to test due to limited numbers of TILs and the requirement for fresh
viable autologous and allogeneic tumor cells for screening purposes. Several studies even showed mixed
results or little benefit of TIL therapy (8;26;27). Subsequently, engineered T cells containing either T cell
receptors (TCRs) or chimeric antigen receptors (CARs) were tested to develop an adoptive T cell therapy
that used lower T cell numbers while maintaining tumor antigen specificity.
1.2 Engineered T cell receptor (TCR) T cell therapy for solid tumors
TILs have a limited T cell receptor (TCR) beta-chain variable region usage (28;29), suggesting that
selecting for or engineering TCRs against tumor-associated antigens could be an alternative approach to
generating sufficient T cell numbers with pre-defined functional avidity. This approach would significantly

3
shorten the manufacturing process compared to TILs, which require higher T cell numbers. Engineered
TCRs can also recognize both extracellular and intracellular targets that are MHC-presented, thus
broadening the scope of tumor-associated antigens to target compared to CARs, which only recognize
extracellular antigens.
Morgan et al (30) published the first report of MART-1 TCR T cells mediating tumor regression.
Subsequent studies combining MART-1 TCR T cells with dendritic cell vaccination resulted in tumor
regression among 69% of participants (31). TCR T cells against other melanoma antigens such as gp100
(32) and NY-ESO-1 (33) showed promising results, though these trials had small cohorts. NY-ESO-1 TCR
T cells, in particular, have been further tested in multiple myeloma with 50% progression-free survival (34)
and synovial cell sarcoma with 61% objective response (33;35). Other tumor-associated antigens such as
CEA (36) and cancer testis antigens MAGE-A3 (37;38) and MAGE-A4 (39) have been targeted using TCR
T cell therapy.
However, there are several limitations to engineered TCRs. First, the number of patients who can
benefit from TCR therapy is limited based on HLA haplotype (40). TCR affinity for cancer targets, as
opposed to viral peptides, is typically in the low micromolar range since many tumor-associated antigens
are derived from self antigens (41); this low affinity can further limit the activation and cytotoxicity of
engineered TCR T cells. In addition, new unintended specificities may derive from mispairing with
endogenous chains or as consequence of artificial enhancement of affinity (42;43). Finally, tumor cells can
escape TCR T cell targeting by downregulating HLA expression (44). An alternative approach, which does
not rely on HLA expression and antigen presentation, was also needed.
1.3 Chimeric antigen receptor (CAR) T cell therapy for solid tumors
Chimeric antigen receptors (CARs) are designed based on endogenous T cell activation through
the TCR (Fig.1A), which requires engagement of the extracellular receptor with its cognate antigen
presented on HLA in order to induce downstream signal transduction through the CD3ζ endodomain. CARs
were first described by Gross and colleagues (45), who replaced the Vα and Vβ extracellular domains of
4
the TCR with heavy and light chain Fv domains. They showed that the chimeric receptor endowed T cells
with the ability to recognize its target antigen in a non-MHC restricted manner and induced T cell activation
and IL-2 production. Chimeric antigen receptor T cells (CAR-Ts), unlike engineered TCR T cells, do not
rely on pairing for proper activation through the receptor. Instead, the extracellular single-chain variable
fragment (scFv) of the CAR recognizes the target antigen in a MHC-independent manner and with higher
affinity than TCRs (46).
Over its 20-plus year history, CARs have undergone several major modifications to improve its
function (Fig.1B). The first major milestone in CAR development was when Zelig Eshhar and colleagues
fused a scFv to a transmembrane domain and intracellular CD3ζ endodomain, called the T-body or first-
generation CAR (47). Eshhar’s group subsequently showed CAR-T lytic activity against ovarian cancer
cell lines (48), Neu/HER2 expressing transformed cells (49), and B cell lymphomas (50). However, these
first-generation CARs were unable to activate resting or naïve T lymphocytes, and CAR-Ts produced
limited amounts of cytokines (51). Second-generation CARs integrated endodomains from co-stimulatory
molecules traditionally provided as “signal 2” of TCR-mediated activation, such as CD28 (52), ICOS (53),
CD134 (OX40R) (54), and CD137 (4-1BB) (55) to further enhance T cell proliferation and cytokine
production. CAR-Ts have also been further engineered to express cytokines or co-stimulatory ligands to
further support their proliferation and/or migration to tumor sites (56).
CARs used today are comprised of series of domains: an extracellular domain that recognizes a
target antigen, a hinge/spacer domain to extend the extracellular domain from the cell surface, a
transmembrane domain, and endodomain(s). The extracellular domain contains the antigen-binding
domain, most commonly derived from a scFv of a monoclonal antibody (mAb), along with a hinge/spacer
domain derived from immunoglobulin-like CH2-CH3 (Fc) domains of immunoglobulin G (IgG), CD8α, or
CD28 (57). The optimal length of the spacer domain is empirically determined depending on the target
antigen (46), sometimes directly affecting the affinity of CAR-Ts to their target antigen (58). The

5
endodomain transmits T cell signals to induce activation in a similar manner to TCR-mediated activation
(47).
Early pre-clinical models showed promising improvements (52;54), and were more specifically
designed against solid tumor antigens prostate-specific membrane antigen (PSMA) (59) and CEA (60), or
the leukemia/lymphoma antigen CD19 which is the most commonly studied CAR to date (55;61-63). Third-
generation CARs, which incorporate an additional co-stimulatory molecule, showed enhanced cytokine
production, sustained proliferation, and better tumor control in vivo compared to either co-stimulatory
molecule alone (64-66), but clinical experience with third-generation CARs is limited (67). CAR-Ts have
been further engineered to express cytokines or co-stimulatory ligands to further improve T cell persistence,
homing, and anti-tumor activity in vivo, or “armored” CARs (56).
Clinical trials using CAR-Ts for solid tumors have also had mixed results. Perhaps not surprisingly,
initial clinical trials with first-generation CAR-Ts, such as the CD171 CAR for neuroblastoma (68) and
CAIX CAR for metastatic renal cell carcinoma (69) showed limited CAR-T persistence after infusion.
Another first-generation CAR-T targeting folate receptor alpha for ovarian cancer showed successful
engraftment but poor anti-tumor efficacy (70). Second-generation CAR-Ts against EGFR variant III
(EGFRvIII) (71;72) and IL13Rα2 (73) are under active investigation for glioblastoma (GBM). In addition
to targeting protein antigens, investigators have developed CAR-Ts against a cancer-specific glycoform of
MUC-1 for metastatic seminal vesicle cancer (74). Others have focused on targeting tumor stroma, such as
fibroblast associated protein (FAP) CAR-T cells (75) with clinical trials ongoing for mesothelioma, or
targeting vasculature (VEGFR-2) associated with tumor angiogenesis (76). The most promising clinical
outcomes to date have been in HER2-specific CAR-Ts for sarcoma (77) in which 4 out of 19 subjects
achieved stable disease, GD2 CAR-Ts for neuroblastoma with 3 out of 11 in complete remission (78), and
HER1 CAR-Ts for lung cancer showing partial response in 2 out of 11 subjects (79). Overall, the use of
TILs, engineered TCRs, and CARs has shown some advantages and disadvantages related to the design and
6
manufacturing process, as well as to target antigens. A comparison between these adoptive T cell therapies
is summarized in Table 1.
1.4 Development of CD30-specific CAR-Ts (CD30.CAR-Ts)
CD30 (encoded by TNFRSF8) is a member of the TNF receptor superfamily that was initially
discovered in Reed-Sternberg cells of Hodgkin’s Lymphoma (HL) (80-83). Its extracellular domain can be
cleaved to produce a soluble form, which can be released into the serum (84), but importantly antibody
binding of CD30 is unaffected even in the presence of soluble CD30 (85). CD30 ligand (CD30L, or CD153),
also a member of the TNF family, can be membrane-bound or soluble. Binding of CD30 with its ligand
induces downstream signal transduction and activation of NF-kB (86); however, its function is variable
depending on context and target cells. While CD30 function in normal cells like lymphocytes is unclear,
CD30 has been shown to promote cell proliferation and survival in transformed embryonic stem cells (87).
Because of its limited expression in normal tissues and high expression in Reed-Sternberg cells,
CD30 has been targeted by multiple investigators using monoclonal antibodies. Initial studies were done in
1992 using the anti-CD30 murine monoclonal antibody Ber-H2 and showed tumor localization but no anti-
tumor activity (88). Other CD30-targeting antibodies, such as Ber-H2 conjugated to the Saproin toxin
(89;90) or human anti-CD30 monoclonal antibody (91) showed modest responses. Brentuximab vedotin
(BV), an antibody-drug conjugate of an anti-CD30 antibody with a potent anti-microtubule cytotoxin
monomethyl auristatin E (MMAE) (92), has shown the highest response rates to date for anti-CD30
antibody therapy (93-95) and was subsequently approved by the FDA in 2011 for relapsed HL (84).
At around the same time in the mid-1990s, a CD30 chimeric antigen receptor was being developed
to engineer into T cells (CD30.CAR-T). The first-generation CD30.CAR-T consisted of an extracellular
single-chain anti-CD30 antibody fragment and Fc-epsilon-I-gamma receptor signaling endodomain and
showed specific lysis of CD30-expressing HL cell lines in vitro (85;96). Epstein-Barr-virus specific T cells
transduced with a CD30.CAR also showed lytic activity against both autologous EBV+ HL cells through

7
the native TCR and EBV-CD30+ HL cells through the CAR (97). Importantly, although a subpopulation of
activated T cells express CD30, CD30.CAR-Ts did not impair adaptive immune responses (97).
Second-generation CD30.CAR-Ts incorporating the CD28 endodomain (56) have subsequently
been tested in phase I clinical trials for CD30-expressing HL and anaplastic large-cell lymphoma (ALCL)
patients without pre-conditioning chemotherapy, eight of whom had brentuximab-refractory disease, with
one complete response and one partial response (98). In another phase I trial using CD30.CAR-Ts with the
4-1BB endodomain, HL and ALCL patients with pre-conditioning chemotherapy showed a partial response
in 7 out of 18 patients, and biopsied tissues showed CAR-T trafficking with reduction of tumor CD30
expression (99). However, CD30.CAR-Ts have not yet been tested against solid tumors. In Chapter 2, I
describe the novel use of CD30.CAR-Ts against embryonal carcinomas (ECs), a solid tumor, and
specifically how Fas/FasL interactions between tumor and T cells contribute to elimination of both antigen-
positive and antigen-negative (bystander) tumor cells. Finally, in Chapter 3, I discuss the broader
implications of targeting the Fas/FasL pathway and how to further improve CAR-T immunotherapy against
solid tumors.
8
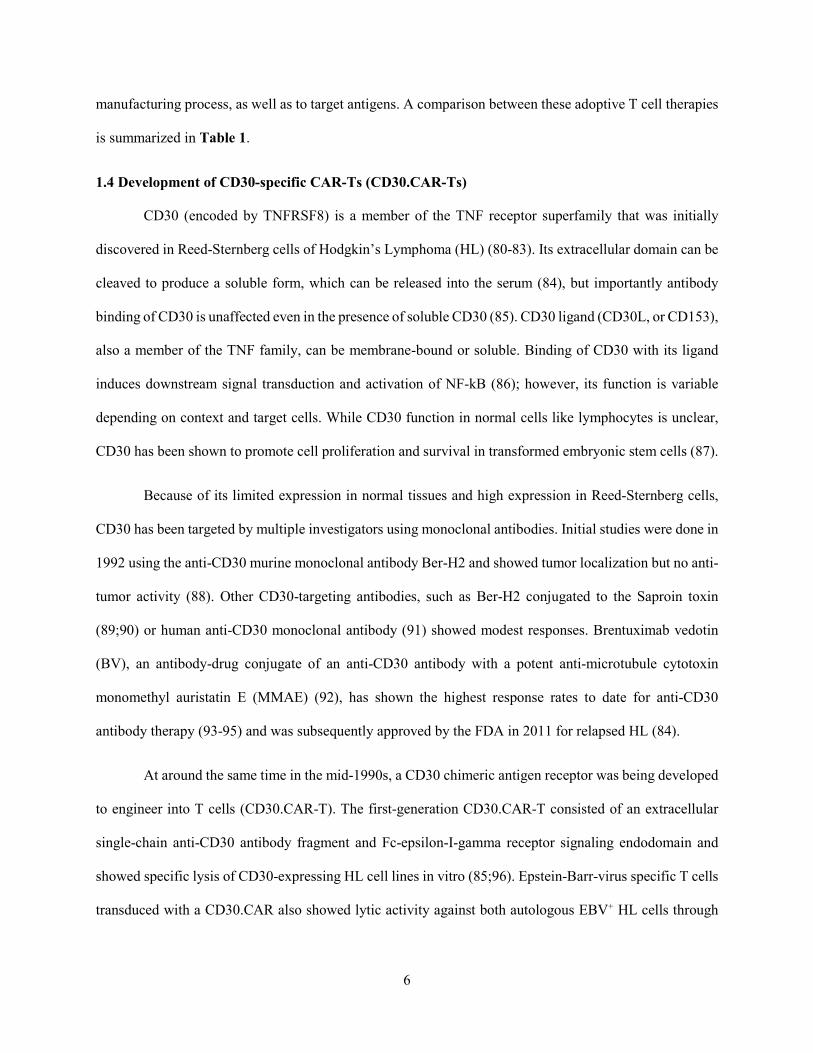
Figure 1.1: Chimeric antigen receptor (CAR) evolution. (A) Schematic of T cell receptor (TCR)
signaling, which requires signal 1 (TCR engagement with its cognate peptide presented on MHC), signal 2
(co-stimulation by CD28, 4-1BB, or other co-stimulatory molecules), and signal 3 (cytokine milieu) for
optimal activation. (B) Schematic of CAR design, in chronological order from left to right showing
incorporation of co-stimulatory domains (second- and third-generation CARs) as well as the addition of
cytokine or co-stimulatory ligand expression by T cells (“armored” CAR). Adapted from (57).

9
Pros Cons
Tumor infiltrating lymphocytes
(TILs) • Polyclonal repertoire
enables targeting multiple
antigens and potentially
minimizes tumor escape
• Likely enriched for T cell
subsets that already show
anti-tumor activity
• Long manufacturing process
(8-12 weeks)
• Difficult to isolate (requires
tumor biopsy and presence
of TILs)
Engineered T Cell Receptors
(TCRs) • Target both extracellular
and intracellular antigens
presented on MHC
• Can signal through TCR
with as little as 1 MHC-
peptide complex present on
target cells
• Pre-defined antigen
specificity
• Limited to specific HLA
haplotype
• Tumor cells can escape by
MHC downregulation
• Relies on co-stimulation
from target cells
• Potential formation of
mispaired TCRs with
unintended specificities
Engineered Chimeric Antigen
Receptors (CARs) • Bypasses MHC restriction
and co-stimulation
• High affinity
• Other non-protein antigens,
such as glycoproteins and
glycolipids, can be targeted
• Pre-defined antigen
specificity
• Only extracellular antigens
can be targeted
• Requires sufficient number
of antigens to initiate T cell
activation
• Immune response may be
directed against the CAR
(ex. HAMA), which can be
minimized by using
humanized scFvs
Table 1.1: Comparison of Adoptive T Cell Therapies

10
CHAPTER 2: CD30.CAR-Ts TARGET EMBRYONAL CARCINOMA1
2.1 Introduction
Testicular germ cell tumors (TGCTs), sub-categorized as seminomas and non-seminomas (NS-
TGCTs), are the most common malignancies in male adolescents and young adults (100), and incidence
continues to rise in the United States and worldwide (101). Pure embryonal carcinomas (EC), a subtype of
NS-TGCTs derived from malignant embryonic stem cells, accounts for 2% of all TGCTs (102). More
commonly, EC is a histologic component in 85% of mixed TGCTs in which multiple subtypes are present
(102), and the presence of EC is associated with poor outcomes (103). While orchiectomy is curative in
patients with localized (i.e. stage 1) NS-TGCTs (104), patients with metastatic disease and those
presenting with primary mediastinal tumors, even when cured, often develop long-term chemotherapy-
related side effects that reduce their life expectancy (105). In addition, patients who relapse after
chemotherapy have poor prognosis, with an overall survival rate of only 30-40% (106). Therefore,
immunotherapy may be beneficial in improving overall survival while reducing chemotherapy-associated
morbidities.
CD30 antigen expression is a distinctive feature of ECs and an attractive target for
immunotherapy (107). CD30 is a TNF superfamily member with a pro-survival role in transformed stem
cells (87). Furthermore, CD30 is stably expressed by ECs at diagnosis and at relapse, and the persistence
of CD30+ tumor cells post-chemotherapy is considered a negative prognostic factor (108). Targeting
CD30 by brentuximab, a toxin-conjugated anti-CD30 monoclonal antibody (mAb), has led to partial
responses in 2 out of 3 TGCT patients in a phase 2 open-label multicenter study (109). In a separate
1 Lee Kyung Hong, Yuhui Chen, Christof Chiu Smith, Stephanie Montgomery, Benjamin Vincent, Gianpietro Dotti,
Barbara Savoldo

11
study, 22% of patients with mixed TGCTs treated with brentuximab achieved objective but transient
clinical responses (110).
Chimeric antigen receptor (CAR)-based technology overcomes some of the limitations of mAb-
based immunotherapy because CARs combine the antigen specificity of a mAb with intrinsic properties
of T lymphocytes (111). CARs are chimeric proteins in which an Ab single-chain variable fragment
(scFv), as an extracellular receptor, is fused with T cell effector and co-stimulatory intracellular domains
(112). In sharp contrast to mAbs, CAR-expressing T lymphocytes (CAR-Ts) can persist long-term,
migrate to the tumor site following chemokine gradients such as CXCL12 in TGCTs (103), and exploit
multiple lytic functions (113). CD30-redirected CAR T cells (CD30.CAR-Ts) have shown anti-tumor
activity in vitro and in vivo in preclinical lymphoma models (97;114), and more recently in patients with
Hodgkin’s lymphomas and CD30+ non-Hodgkin’s lymphomas (98;99). However, CD30.CAR-Ts have
not yet been explored in solid tumors. Here, we demonstrated the anti-tumor activity of CD30.CAR-Ts
against CD30+ ECs and discovered a mechanistic link between the lytic activity of CD30.CAR-Ts against
bystander CD30– ECs and the Fas/FasL pathway. Furthermore, we showed that inducing Fas expression
in otherwise Fas– EC cells enhanced CD30.CAR-T-mediated tumor elimination. These results support the
use of CD30.CAR-Ts as a novel form of immunotherapy for CD30+ TGCTs.

12
2.2 Methods
Tumor cell lines. The Hodgkin’s lymphoma-derived cell line HDLM-2 was obtained from the
German Collection of Cell Cultures (DMSZ, Braunschweig, Germany). The Burkitt’s lymphoma-derived
cell line Raji, the EC-derived cell lines NCCIT, Tera-1, and Tera-2, the neuroblastoma-derived cell line
Lan-1, and the leukemia-derived cell line K562 were obtained from American Type Culture Collection
(ATCC). K562 cells were transduced with a retroviral vector encoding human CD19 to constitutively
express CD19. Similarly, Lan-1 cells were transduced with a retroviral vector encoding human CD30 to
constitutively express CD30. For CD95 overexpression in NCCIT cells, the full-length human CD95 was
cloned into the retroviral vector PLX encoding the puromycin resistance gene. For CD95 knockdown in
Tera-1 cells, we used the previously described CD95 siRNA pSUPER vectors (115). The retroviral vector
encoding eGFP-Firefly-Luciferase (eGFP-FFLuc) was used to label either tumor cells or CD30.CAR-Ts
for in vivo studies (56). Raji, K562, Lan-1 and NCCIT cells were maintained in culture with RPMI 1640
medium (Gibco) supplemented with 10% fetal bovine serum (Corning), 1X penicillin-streptavidin
(Invitrogen), and 2 mM GlutaMax (Invitrogen). Tera-1 and Tera-2 cells were maintained with McCoy’s
5A media (Corning) with 15% FBS, 1X penicillin-streptavidin, and 2 mM GlutaMax. Cells were
maintained in culture in a humidified atmosphere containing 5% CO2 at 37°C. Tumor cell lines were
routinely tested to exclude contamination with mycoplasma and assessed for the expression of CD30 by
flow cytometry to confirm identity.
Retroviral constructs and transduction of T lymphocytes. We constructed two second-
generation CD30.CARs encoding either the CD28 (CD30.28) or 4-1BB (CD30.BB) endodomains
coupled with the CD3ζ endodomain (Fig. S1A) using the previously reported CD30-specific single-chain
variable fragment (scFv) (97). Non-transduced T cells from matched donors or T cells transduced with a
CD19.CAR encoding the CD28 endodomain (63) were used as controls for in vitro and in vivo
experiments, respectively. Transient retroviral supernatants were produced using 293T cells as previously
described (56). Peripheral blood mononuclear cells isolated from buffy coats of healthy volunteer blood

13
donors (Gulf Coast Regional Blood Center, Houston, TX) were transduced to express the CD30.CARs or
CD19.CAR and maintained in culture as previously described (116).
Flow cytometry. The following mAbs conjugated with phycoerythrin (PE), fluorescein
isothiocyanate (FITC), allophycocyanin (APC), APC-H7, Alexa Fluor 647 (AF 647), Alexa Fluor 700,
Brilliant Violet (BV) 711, and/or peridinin chlorophyll protein (Per-CP) were used: CD3, CD4, CD8,
CD30 (Clone Ber-H3), CD33, CD45, CD45RA, CD45RO, CD95, CCR7, Ganglioside GD2 (GD2) and
active caspase 3 (BD Biosciences). Rabbit anti-cleaved caspase 7 and Alexa Fluor 488-conjugated goat
anti-rabbit IgG mAbs were purchased from Cell Signaling Technologies. CAR expression by T cells was
detected using a goat anti-mouse F(ab’)2 antibody (Jackson Immuno). To detect CD19.CAR we used a
specific anti-idiotype antibody (Clone 233-4A) generated by immunizing mice with the anti-CD19 scFv
followed by APC-conjugated rat anti-mouse IgG secondary mAb (BD Biosciences). For absolute number
calculations, samples were analyzed using CountBright absolute counting beads per manufacturer’s
instructions (Thermo Fisher). For intracellular staining, cells were stained with surface antibodies, then
washed and fixed with Cytofix/Cytoperm (BD), followed by intracellular staining in 1X permeabilization
buffer per manufacturer’s instructions. Samples were analyzed using a FACSCanto II flow cytometer
(BD), and data were analyzed by FlowJo (Treestar). At least 10,000 positive events were collected for
each sample. FACS sorting was also performed using CD30-PE or CD95-PE labeled tumor cells on an
Aria III flow cytometer (BD; UNC Flow Cytometry Core Facility).
Side Population (SP) staining by Hoechst dye/Dye Cycle Violet and cell sorting. For SP
analysis, cells were incubated in HBSS (Life Technologies) containing 2% FBS, 10 mM HEPES (Life
Technologies), and either 10 µg/mL Hoechst 33342 (Sigma-Aldrich) or 10 µM Vybrant DyeCycle Violet
(DCV) (Life Technologies) for 90 min at 37°C. Cells were then washed with ice cold HBSS and FACS
sorted or labeled with CD30-PE for flow cytometry analysis. To detect the SP fluorescent phenotype,
Hoechst 33342 samples were excited using a 355nm UV laser on a LSRII/Fortessa flow cytometer (BD)
while DCV samples were excited using a 405 nm violet laser on an Aria III flow cytometer.

14
Corresponding band-pass filter sets were: blue 450-50 bp/450 LP, 610-20 bp/690 LP (LSRII/Fortessa)
and 450-50 bp/502 LP (Aria III).
Cytotoxicity assay. The cytotoxic activity of transduced effector cells was evaluated using a 6-
hour 51Cr release assay as previously described (16). Labeled target cells were: Raji (CD30–), HDLM-2
(CD30+), Tera-2, and NCCIT.
In vitro co-culture. Adherent tumor cell lines were plated at 0.1 - 0.25 × 10⁶ cells/mL in a 24-
well tissue culture plate one day prior to the addition of CD30.CAR-Ts or CD19.CAR-Ts at various
effector/target (E:T) ratios. After five days in culture at 37°C, cells were collected using Versene (UNC
Tissue Culture Facility) for non-enzymatic dissociation of tumor cells, washed in PBS, labeled with
fluorescent CD3-APCH7 and CD30-FITC mAbs and analyzed by flow cytometry. In experiments with
Lan-1/WT or Lan-1/CD30 control tumor cells, remaining cells were labeled with CD3-APCH7 and GD2-
PE (Clone 14.G2a) mAbs. In experiments where CD19.CAR-Ts and K562 cells were used, remaining
cells were also labeled with CD33-APC mAb. Transwell assays were performed using 0.4 μm transwells
(EMD Millipore) in 24-well tissue culture plates.
Carboxyfluorescein succinimidyl ester (CFSE)-based proliferation assay. CD30.CAR-Ts and
control T cells were labeled with CFSE following manufacturer's instructions (Invitrogen) and co-
cultured with tumor cells at 5:1 E:T ratio. On day 5, cells were collected, labeled with CD3-APCH7,
CD4-PECy7, and CD8-APC mAbs (BD Biosciences), and analyzed for CFSE dilution by flow cytometry.
In separate co-culture experiments, tumor cells were labeled with CFSE and plated one day prior to the
addition of control T cells and CD30.CAR-Ts. Five days later cells were collected and CFSE+ tumor cells
were identified by flow cytometry.
Enzyme-linked immunosorbent assay (ELISA). The release of IL-2 and IFNγ by CD30.CAR-
Ts was quantified using specific ELISAs (R&D Systems) in supernatants collected after 24 hours from T
cells co-cultured with tumor cells.

15
Reverse transcription quantitative polymerase chain reaction. Cells were lysed and RNA was
extracted using the RNeasy Mini kit (Qiagen) and reverse transcribed into cDNA (Superscript VILO,
Invitrogen). Human ABCG2, SOX2, and CD95L (FasL) mRNA expression was quantified using Taqman
probes (Applied Biosystems) on a Quantstudio 6 PCR machine (Applied Biosystems) using β-actin as
housekeeping gene control (Invitrogen).
Xenograft mouse models. To measure in vivo the growth of EC cells, we used two orthotopic
models in 6–12 week-old NOD/SCID/γcnull (NSG) male mice. In the first model, Tera-2 eGFP-FFLuc
cells were re-suspended in DPBS (Corning) and injected directly into the left testis (2 × 10⁶ cells/mice)
(117). In the second model, Tera-2 eGFP-FFLuc cells were re-suspended in Matrigel (Corning) and
engrafted under the left kidney capsule (0.25 × 10⁶ cells/mice) (118). To assess anti-tumor activity of
CD30.CAR-Ts, mice received T cells (1 × 10⁷ cells/mouse) intravenously via tail vein injection 14 days
later, when the bioluminescence emission (BLI) of the tumor was consistently measurable. To monitor T
cell localization and expansion, mice were engrafted with wild type (WT) Tera-2 cells, and infused 21
days later with 1 × 10⁷ control or CD30.CAR-Ts transduced with eGFP-FFLuc. The IVIS imaging system
(Xenogen; UNC Biomedical Imaging Research Center) was used to monitor tumor growth or T cell
expansion and localization. Briefly, a constant region of interest was drawn over the tumor regions and
the intensity of the signal measured as total flux (photon/sec) as previously described (118).
Mouse tissue processing and immunohistochemistry (IHC). T cell-treated mice with tumor
engrafted in kidney or testis were sacrificed and tumors were fixed in 10% neutral buffered formalin
(Fisher Scientific), processed in 3 μm longitudinal planes, and stained for hematoxylin/eosin (H&E) and
anti-human CD3 mAb (UNC Lineberger Animal Histopathology Core Facility). Blood samples
normalized to 100μL total volume and spleen samples were also harvested, lysed to remove red blood
cells (ACK Lysis Buffer, Gibco), and stained with anti-human CD45 and CD3 for detection of T cells.
For detection of CD30, mouse tissues and human testes tissue arrays (US Biomax) were stained with anti-
human CD30 mAb (Clone Ber-H2, Dako; UNC Translational Pathology Laboratory). H score is the

16
cumulative score of the frequency of positive cells x score calculated by a membrane staining algorithm,
which scores cells based on membrane staining intensity, while the frequency of CD30+ cells is the
percent total positive staining cells (UNC Translational Pathology Laboratory). Tumors collected from
tumor bearing mice were counted by a board-certified veterinary pathologist (S. Montgomery) blinded to
experimental conditions. A random tumor field containing at least 80% tumor and positively labeled CD3
cells was selected and, depending on tumor size, up to ten high power (400X) fields of view were
examined using a grid matrix approach as previously described (118). Two samples from mice treated
with either CD30.28-Ts or CD30.BB-Ts had sheets of positive cells that were too numerous to count
(TNTC) and were not included in the quantitative analysis.
RNA-Seq. Briefly, total RNA was extracted from EC cell lines and mRNA libraries were
prepared (TruSeq Stranded mRNA Library Prep, Illumina) and sequenced on the Illumina HiSeq4000
platform (UNC High-Throughput Sequencing Facility) using paired-end 100-bp reads, with 84 million
reads on average (range 49–139 million). RNA-seq data was aligned with STAR alignment (v2.4.2) and
quantified with Salmon (v0.6.0). Differential gene expression analysis was performed using the R
DESEq2 package (https://genomebiology.biomedcentral.com/articles/10.1186/s13059-014-0550-8).
Among all significantly expressed genes between NCCIT, TERA1, and TERA2 cell lines (FDR p-value <
=0.05), expression was further filtered to genes contained within the KEGG Apoptosis and the Biocarta
p53 pathway signatures (https://www.ncbi.nlm.nih.gov/pubmed/10592173;
https://doi.org/10.1089/152791601750294344).
Statistical analysis. All in vitro data are presented as mean ± SEM. A two sided, paired Student’s
T test was used to determine the statistical significance of differences between groups, and p-values less
than .05 were accepted as indicating a significant difference. When multiple comparison analyses were
required, statistical significance was evaluated by one-way ANOVA or repeated-measures ANOVA for
matched donors followed by two-sided paired Student’s T test as needed for comparing two groups.

17
Statistical significance for differences in tumor growth in vivo were evaluated by one-way ANOVA.
Differences in survival curves for mouse experiments were compared by log-rank (Mantel-Cox) test.
Study approval. All mouse experiments were performed in accordance with University of North
Carolina Animal Husbandry and Institutional Animal Care and Use Committee (IACUC) guidelines and
were approved by UNC IACUC.

18
2.3 Results
EC cell lines and TGCT tissue specimens express CD30. We assessed the expression of CD30
in three human EC cell lines (Tera-1, Tera-2, and NCCIT) by flow cytometry, and used wild type Lan-1
(Lan-1/WT) and CD30+ Lan-1 (Lan-1/CD30) cells as negative and positive controls, respectively. The
HDLM-2 Hodgkin’s lymphoma cell line that constitutively expresses CD30 (119) was also used as a
positive control. All EC cell lines expressed CD30 but also contained a fraction of CD30–/dim cells, which
were more prominent in the Tera-1 cell line (Fig.2.1A). We next examined CD30 expression by
immunohistochemistry (IHC) in human tissue microarrays (TMA) that include normal testes, seminomas,
and NS-TGCTs. Normal testes and seminomas did not display CD30 staining (Fig.2.1B). In contrast, up
to 70% of EC specimens exhibited a moderate to strong, granular, membranous and Golgi CD30 staining
pattern (Fig.2.1B). When the pattern of CD30 expression was scored using computational analysis and
analyzed as H score (Fig.2.1C) or as frequency of positive cells (Fig.2.1D), CD30 was routinely
expressed only by primary ECs (p<0.001, one-way ANOVA), although with some heterogeneity.
CD30.CAR-Ts target CD30+ EC cell lines and their side population (SP) cells. We
engineered T cells to express either CD30.28 or CD30.BB CARs (Fig.2.S1A). Transduction efficiency
was consistently >90% for both constructs (Fig.2.S1B), and CD30.CAR-Ts expanded in vitro in the
presence of cytokines (Fig.2.S1C). CD30.CAR-Ts showed phenotypic characteristics of stem cell-like,
effector-memory and central-memory T cells (Fig.2.S1D).
CD30.CAR-Ts lysed CD30+ tumor cells at higher frequencies compared to control T cells
(Ctr.Ts), while sparing CD30– tumor cells in short-term 51Cr release assays (Fig.2.2A). CD30.CAR-Ts
also effectively eliminated CD30+ tumor cells in long-term co-culture experiments. Specifically, using
effector:target (E:T) ratios ranging from 1:5 to 5:1, both CD30.28-Ts and CD30.BB-Ts exhibited anti-
tumor activity against all three EC cell lines tested (Fig.2.2B-D and 2.S2B-D). Of note, while
CD30.CAR-Ts efficiently eliminated Tera-1 (Fig.2.2B and 2.S2B) and Tera-2 (Fig.2.2C and 2.S2C) cells
at low E:T ratios (1:1, 1:2 and 1:5), they could only control NCCIT cell growth at the highest 5:1 E:T

19
ratio (Fig.2.2D). CD30.CAR-Ts targeted Lan-1/CD30 cells while neither Ctr.Ts nor CD30.CAR-Ts
eliminated Lan-1/WT cells (Fig.2.S2A). Both CD30.28-Ts and CD30.BB-Ts showed robust proliferation
in response to EC cells, as assessed by CFSE dilution assays (Fig.2.S3A), confirming both endodomains
provided adequate co-stimulation. Additionally, CD30.CAR-Ts secreted IFNγ and IL-2 upon stimulation
with EC cells (Fig.2.S3B,C). In summary, CD30.CAR-Ts showed selective activation by CD30+ EC cells
and anti-tumor activity in vitro.
Cancer stem cells are a subpopulation of tumor cells with stem cell characteristics that can
contribute to tumor relapse (120). Taking in consideration the germinal origin of ECs, we examined if EC
cell lines contain putative cancer stem cells using the Hoechst 33342 staining for detection of SP cells
(121). While all EC lines had a proportion of SP cells, Tera-1 cells showed the highest frequency of SP
cells (15-30%) (Fig.2.3A). SP cells retained the expression of CD30 (Fig.2.3A) and exhibited cancer stem
cell characteristics based on the expression of the stem cell-associated markers ABCG2 (122) and SOX2
(123) (Fig.2.3B), and their capacity to differentiate to non-SP cells (121) (Fig.2.3C). Importantly,
CD30.CAR-Ts targeted sorted SP cells in co-culture assays (Fig.2.3D). Therefore, CD30.CAR-Ts can
target both differentiated and stem cell-like CD30+ EC cells.
CD30.CAR-Ts localize to EC tumors and exhibit anti-tumor activity in vivo. To model EC in
vivo, we inoculated NSG mice with luciferase-labeled Tera-2 tumor cells directly into the testes (117).
Tera-2 cells successfully engrafted, as detected by bioluminescence (BLI) (Fig.2.4A) and retained
expression of CD30 in situ as assessed by IHC (Fig.2.4B). However, tumors engrafted in mouse testes
rarely metastasized to extragonadal sites. As intraperitoneal or intravenous administration of EC cells in
NSG mice resulted in poor tumor engraftment (data not shown) and because metastatic TGCTs typically
arise in midline locations and retroperitoneum (124), we engrafted Tera-2 cells orthotopically under the
kidney capsule as a clinically relevant model of metastatic EC. When analyzed by IHC, tumors were
located under the renal capsule, sometimes infiltrating into the subjacent cortex or deeper into the medulla
(Fig.2.S4D). In this tumor model, luciferase-labeled CD30.CAR-Ts injected intravenously via tail vein

20
(i.v.) consistently localized and accumulated at the tumor site. While CD30.BB-Ts showed increased
accumulation early after injection, CD30.28-Ts showed better long-term persistence compared to that of
controls (Ctr.Ts) or CD30.BB-Ts (Fig.2.4C and 2.S4A). T cells were detectable in the blood (Fig.2.S4B)
and spleen (Fig.2.S4C) in all treatment groups between day 30–45 post T cell infusion. In tumor
specimens collected between day 30–45 post T cell infusion, we observed infiltrating CD3+ T cells that
occasionally formed small clusters (Fig.2.S4D). However, no significant differences in CD3+ T cell
infiltration between Ctr-T and CD30.CAR-T treated groups were observed (Fig.2.4D).
To test CD30.CAR-T anti-tumor activity, luciferase-labeled EC cells were engrafted in the kidney
and tumor growth measured by BLI. When tumors in the kidney showed consistent increase in BLI, mice
received i.v. unlabeled Ctr.Ts or CD30.CAR-Ts. Both CD30.28-Ts and CD30.BB-Ts reduced the tumor
growth compared to Ctr.Ts (Fig.2.4E and 2.S4E), but CD30.28-Ts provided better survival when using
tumor BLI of 5 x 10⁷ p/s as a survival cutoff (Fig.2.4F).
CD30– EC cells are eliminated by CD30.CAR-Ts via antigen-independent, but cell-cell
contact-dependent mechanisms. While not displaying lytic activity against CD30– tumor cells alone in
short-term (Fig.2.2A) or long-term (Fig.2.S2A) assays, CD30.CAR-Ts completely eliminated Tera-1
cells, which contain a mixture of CD30+ and CD30– cells (Fig.2.1A), in 5-day co-culture assays
(Fig.2.2B). To dissect this phenomenon, we co-cultured CD30.CAR-Ts with CD30– flow-sorted Tera-1
cells (Fig.2.5A) and found that they were no longer eliminated (Fig.2.5B), with no detectable IFNγ or IL-
2 released in culture supernatants (Fig.2.S5B). In addition, when unselected Tera-1 cells were co-cultured
with CD30.CAR-Ts at very low E:T ratios, CD30+ Tera-1 cells were preferentially eliminated over the
CD30– fraction (Fig.2.5C). Similar results were observed with CD30.BB-Ts (Fig.2.S5). We found no
evidence of CD30 upregulation in CD30– Tera-1 cells when these cells were exposed to soluble factors
released by CD30.CAR-Ts such as IFNγ and TNFα, or when exposed to co-culture supernatants (data not
shown). By contrast, we observed that Tera-1 cells were eliminated in a CD30 antigen-independent
manner by activated CAR-Ts. To conclusively support this observation, we co-cultured Tera-1 cells with

21
CD19.CAR-Ts, which target the CD19 antigen that is not expressed by EC cells, in the presence of
CD19– (K562/WT) or CD19+ (K562/CD19+) target cells to induce CAR-T activation. As shown in
Fig.2.5D, CD19.CAR-Ts eliminated Tera-1 cells only in the presence of K562/CD19+ cells. Furthermore,
the elimination of Tera-1 cells was T cell-tumor cell contact-dependent since the anti-tumor effects were
abolished when CD19.CAR-Ts and K562/CD19+ cells were separated from Tera-1 cells using a transwell
(Fig.2.5E). These data suggest that CD30.CAR-Ts, upon activation through the CAR, can eliminate the
fraction of Tera-1 cells that is CD30– cells in a cell-cell contact dependent, but antigen-independent
mechanism.
Fas/FasL pathway mediates the elimination of CD30– EC cells and improves the elimination
of CD30+ EC cells by CD30.CAR-Ts. Fas-FasL (CD95/CD95L) interactions between tumor cells and
cytotoxic T lymphocytes contribute to tumor cell death (125). CAR-Ts also upregulate FasL upon
receptor engagement (126;127), and Tera-1 cells express Fas (Fig.2.6A). Since the CD30– fraction of
Tera-1 cells also retains Fas expression (Fig.2.6B), we investigated whether CD30.CAR-Ts utilize the
Fas/FasL pathway to eliminate the CD30– fraction of Tera-1 cells. CD30.28-Ts upregulated FasL upon
CAR engagement with EC cells after 4 hours in vitro (Fig.2.6C). In contrast, EC cell lines neither
expressed FasL mRNA nor secreted FasL in culture supernatants (data not shown). When co-cultured
with CD30.28-Ts, the CD30– fraction of Tera-1 cells showed caspase 3 activity (Fig.2.6D), which is
primarily triggered by the Fas/FasL pathway (125). By contrast, cell death of the CD30+ fraction was
primarily caused by granzyme B/perforin-mediated membrane damage as detected by cleaved caspase 7
(128;129) (Fig.2.6E). When CD95 was knocked down in Tera-1 cells via specific siRNA (115) (Tera-
1/CD95 KO, Fig.2.6F), we found reduced caspase 3 activity among CD30– Tera-1 cells compared to
wildtype Tera-1 cells when co-cultured with CD30.28-Ts (Fig.2.6G). Similar Fas/FasL-mediated effects
were observed when the experiments were repeated using CD30.BB-Ts (Fig.2.S6).
To assess if the pattern of antigen-independent Fas/FasL mediated elimination of tumor cells was
broadly applicable, we evaluated CD95 on the two other EC tumor cell lines Tera-2 and NCCIT. Notably,

22
Tera-2 cells that express CD95 (Fig.2.6A) were similarly targeted via antigen-independent Fas/FasL
killing by CD19.CAR-Ts (Fig.2.S7A), but not NCCIT cells (Fig.2.S7B) that lack CD95 expression
(Fig.2.6A). Interestingly NCCIT cells appeared constitutively more resistant to CD30.CAR-T mediated
killing (Fig.2.2D and 2.S7C) and showed significantly decreased expression of apoptosis-related genes by
RNA-Seq (notably p53, Fas, and TRAIL receptor) compared to either Tera-1 or Tera-2, which showed
greater co-clustering of apoptosis-related gene expression patterns (Fig.2.S7D and Supplemental Table).
However, when engineered to express CD95 (NCCIT/CD95+, Fig.2.6H), NCCIT cells were more
efficiently eliminated by CD30.28-Ts (Fig.2.6I). These data suggest that introducing Fas/FasL
interactions via CD95 overexpression on EC cells is sufficient to improve CD30.CAR-T anti-tumor
activity.

23
2.4 Discussion
Investigation of novel drugs for the treatment of ECs and TGCTs in general did not significantly
progress in the past few decades, and the outcome of patients treated with new drugs remains poor with
an overall survival rate of 30–40% (106). As previously identified in Hodgkin’s lymphoma (97;98),
CD30 expression by ECs can be exploited to develop targeted therapies in these malignancies. CD30 is
found on ECs at diagnosis and its expression is retained in a significant number of patients who
progressed after multiple chemotherapy regimens (108). Promising results have been reported using
brentuximab vedotin in relapsed TGCT patients enrolled in clinical studies (110;130) and clinical
outcome will likely be further improved in combination with other agents.
Here we propose CD30.CAR-Ts as a valuable approach to enhance the therapeutic index of
CD30-targeted therapies in ECs. We recently reported that autologous CD30.CAR-Ts were safe in
patients with relapsed CD30+ lymphomas, with promising anti-tumor activity documented even in the
absence of a conditioning regimen before infusing CD30.CAR-Ts (98). In our preclinical study using
CD30+ ECs, we show that CD30.CAR-Ts can selectively target human EC cell lines, localize at the tumor
site in vivo and control tumor growth.
The presence of the EC subtype among NS-TGCTs correlates with higher rates of relapse after
chemotherapy (103), which may be driven, at least in part, by the intrinsic stem cell properties of ECs
(131). Cancer stem cells, which differentiate into multiple tumor cell types, are indeed often resistant to
chemotherapy and act as a reservoir of tumor cells that ultimately leads to recurrence (132). Herszfeld et
al. specifically linked CD30 expression to enhanced tumorigenic features among transformed
hematopoietic stem cells (87). Because CD30 expression is retained by putative EC stem cells identified
as SP cells (121), targeting this molecule with CAR-Ts may prove significantly advantageous to
ultimately overcome the drug resistance of these tumor cells. Therefore, CD30.CAR-Ts may potentially
reduce the chance of relapse by eliminating the reservoir of stem cell-like ECs, in addition to
differentiated ECs.

24
Another common cause of tumor escape and relapse after targeted immunotherapy is the
heterogeneous expression of target antigens within the tumor. For example, some leukemia patients
showed emergence of CD19– leukemic cells after adoptive transfer of CD19-specific CAR-Ts due to
selection of alternatively spliced CD19 isoforms (133). Similarly, tumor escape due to antigen loss has
been observed in patients with glioblastoma treated with EGFRvIII-specific CAR-Ts (134). Bi-specific
CAR-Ts which target two antigens simultaneously (135;136) can reduce tumor escape, but my also
increase the risk of toxicities in normal tissues due to on-target off-tumor effects, especially in solid
tumors, which frequently share antigens with normal tissues. Here we show that the observed Fas-FasL
interaction between ECs and CD30.CAR-Ts may represent a novel way to overcome tumor escape
associated with antigen heterogeneity. Specifically, we observed that CD30.CAR-Ts can target CD30– EC
cells in a contact-dependent manner via Fas/FasL interaction. While eradicating CD30+ EC cells via
perforin/granzyme B-mediated mechanisms, CD30.CAR-Ts also upregulate FasL and eliminate
surrounding CD30– tumor cells, if they express the CD95 molecule, via caspase 3 activation.
The Fas/FasL pathway is highly relevant in tumor immunology (137;138), and Fas agonist mAbs
have been developed to activate the apoptotic cascade in tumor cells (139). However, this strategy was
not clinically developed due to the systemic toxicities caused by the nonselective targeting of CD95
expressing cells in normal tissues, such as hepatocytes (140;141). In this regard, the FasL mechanism
exploited by CAR-Ts, which is cell-cell contact dependent, is more regulated than systemic Fas targeting
by mAbs, since upregulation of FasL by CAR-Ts only occurs at the tumor site after antigen-specific
engagement. Nevertheless, while our data indicate that the Fas/FasL pathway is critical for CD30.CAR-Ts
to eliminate surrounding antigen-negative tumor cells, tumor cells can downregulate Fas (137;142;143) or
develop non-functional Fas mutations as in EC (144) to escape immune cell targeting. The EC cell line
NCCIT is a typical example of Fas– tumor cell line, and we observed that this cell line is indeed more
resistant to the cytolytic activity of CD30.CAR-Ts. This effect can be reverted, however, by promoting
expression of functional Fas in these cells. These data thus highlight an innovative approach to exploit the

25
Fas/FasL pathway in adoptive T cell immunotherapy and specifically in CAR-T-based therapies. We have
previously reported that oncolytic viruses that specifically infect and replicate within tumor cells can be
armed to attract CAR-Ts at the tumor site and sustain their proliferation by releasing RANTES and IL-15,
respectively (145). In light of our novel results, we can speculate that oncolytic viruses further engineered
to cause high expression of functional Fas selectively in tumor cells will be valuable when combined with
CAR-T therapy to promote both antigen-dependent CAR-mediated and antigen-independent Fas/FasL
mediated elimination of tumor cells.
Although effective in targeting CD30+, CD30– EC cells and EC stem-like EC cells in vitro,
CD30.CAR-Ts did not completely eradicate EC tumors in vivo in our aggressive EC model in which the
tumor is engrafted within the kidney. CD30.CAR-Ts upon i.v. inoculation localized at the tumor and
showed some level of expansion within the tumor. However, the observed localization, expansion and
persistence of CD30.CAR-Ts in our model remained suboptimal to fully eradicate the tumor. Several
strategies have been proposed to further enhance CAR-T migration, infiltration and persistence within the
tumor, such as engineering CAR-Ts to express heparanase to degrade tumor extracellular matrix (118) or
constitutive expression of cytokines (146;147). In addition, combination with other agents may also
improve the anti-tumor activity of CAR-Ts. For instance, PD-L1 is highly expressed in some EC tumors
(148). While PD1/PD-L1 blockades as single agents may not be effective in TGCTs due to its low
mutation rates (149), these inhibitors may prevent the exhaustion of CD30.CAR-Ts that express PD1
upon activation (150).
In summary, we found that CD30.CAR-Ts represent a clinically applicable strategy in patients
with ECs. We have demonstrated that CD30.CAR-Ts are effective against ECs targeting both
differentiated and stem cell-like EC cells. We also highlighted the relevance of the Fas/FasL pathway in
CAR-T function and how this pathway can be exploited to counter tumor escape due to the
downregulation of the targeted antigen by tumor cells, as well as to enhance cytolytic activity of CAR-Ts.
Finally, since CD30 is expressed in other solid tumors such as neoplasms with chondroid differentiation

26
that still have dismal outcomes (151), CD30.CAR-Ts represent a novel and promising treatment for other
CD30+ non-lymphomatous malignancies.
2.5 Authorship Contributions
LKH, GD and BS designed the experiments. LKH conducted the experiments and analyzed the
data. YC created the CD30.CAR-T retroviral plasmid constructs and performed validation studies using a
Hodgkin’s Lymphoma model. CCS and BV performed the RNA-Seq data analysis. SM described and
performed quantitative analysis of tissue slides in a blinded fashion. LKH, GD and BS wrote the
manuscript, and all authors edited and approved the manuscript.

27
2.6 Figures
Figure 2.1: CD30 is expressed by EC cell lines and primary ECs. (A) CD30 expression was detected
on EC tumor cell lines Tera-1, Tera-2 and NCCIT by flow cytometry using the anti-human CD30 mAb
(Clone Ber-H3). The neuroblastoma cell lines Lan-1/WT and Lan-1/CD30 were used as CD30 negative
and positive control, respectively. The Hodgkin’s lymphoma cell line HDLM-2 was used as a naturally-
expressing CD30 control tumor cell line. Frequency of positive cells and mean fluorescent intensity
28
(MFI) are indicated. (B) Representative IHC for CD30 expression with nuclear counterstain in human
tissue microarray (TMA) including normal testes, seminoma (stage I T1N0M0), and ECs (stage I
T2N0M0) at 10X magnification, scale bar=100μm. IHC was performed using the anti-human CD30 mAb
(Clone Ber-H2). (C,D) Cumulative analysis of CD30 expression for the TMA shown as H score (C), an
algorithm calculated based on membrane staining frequency and intensity, or as frequency of positive
cells (D). For both panels, each data point represents one tissue sample with mean ± SEM for each group
of tissues/tumors. ***=p<0.001, one-way ANOVA.

29
Figure 2.2: CD30.CAR-Ts exhibit cytotoxic activity against EC cell lines in vitro. (A) 51Cr release
assay of control T cells (Ctr.T), CD30.28-Ts and CD30.BB-Ts against tumor cell lines indicated (mean ±
SEM, n = 4 donors). ns=not significant, *=p<0.05, **=p<0.01, ***=p<0.001, repeated measures one-way
ANOVA comparing individual effector:target (E:T) ratios. (B-D) Ctr.T or CD30.CAR-Ts were co-
cultured with the EC cell line Tera-1 (B), Tera-2 (C) or NCCIT (D). By day 5 remaining EC cells
(CD30+) and T cells (CD3+) were collected and analyzed by flow cytometry. Representative flow plots at
1:1 (B,C) or 5:1 (D) E:T ratios (left panels) and cumulative data for remaining frequency of CD30+ cells
for all E:T ratios tested (right panels) are shown (mean ± SEM, n = 4–5 donors). *=p<0.05, **=p<0.01,
***=p<0.001, two-sided, paired Student’s T test.

30
Figure 2.3: EC-derived SP cells are targeted by CD30.CAR-Ts. (A) Flow cytometry plots of Hoechst
33342-stained tumor cell lines in which percentages of SP and non-SP cells are shown for each tumor cell
line (upper panels). Histograms of CD30 expression and MFI on pre-gated SP and non-SP cells are shown
(lower panels). Raji cells were used as CD30– control cells. (B) Tera-1 SP and non-SP cells were
identified by dye cycle violet staining and FACS-sorted. RNA was extracted, retro-transcribed and
amplified by RT-qPCR to measure the expression of the stem cell markers ABCG2 and SOX2. Each bar
represents the mean ± SEM of three biological replicates. (C) SP cells were sorted from the Tera-1 cell

31
line and cultured in vitro for 6 weeks. SP-sorted cells regenerated both SP and non-SP cells. (D) Ctr.T or
CD30.CAR-Ts were co-cultured with SP-sorted Tera-1 cells at a 1:1 E:T ratio for 5 days, followed by
flow cytometry analysis to detect remaining CD3+ T cells and CD30+ tumor cells. Flow cytometry plots
of one representative donor are shown (n = 2).

32
Figure 2.4: CD30.CAR-Ts localize to EC tumors and exhibit anti-tumor activity in vivo. (A)
Representative in vivo IVIS imaging of NSG mice inoculated with 2 × 10⁶ Tera-2 cells labeled with

33
eGFP-FFLuc into the left testis. (B) Representative hematoxylin/eosin (H&E) and human CD30 IHC
staining of EC tumors growing in the testis are shown at 4X magnification, scale bar=250 μm. (C) NSG
mice were inoculated with Tera-2 cells under the left kidney capsule and, 21 days later, infused i.v. with 1
× 107 eGFP-FFLuc-labeled CD30.CAR-Ts or CD19.CAR-Ts (Ctr.T). Representative IVIS images
indicating CAR-T localization and expansion (left panel) and cumulative BLI (right panel) are shown
(mean ± SEM, n=3–4 per group, 2 independent experiments). **=p<0.001, one-way ANOVA at day 12.
(D) T cell-treated mice were sacrificed at day 30–45 post tumor inoculation and tumors were stained with
anti-human CD3 mAb to detect tumor-infiltrating T lymphocytes. CD3+ T cells were counted at 400x
magnification with the tumor covering at least 80% of the field of view in a blinded fashion. Cumulative
quantification of CD3+ T cell counts are shown (mean ± SEM, n=1–3 per group, 4 independent
experiments). ns=not significant, one-way ANOVA. (E) NSG mice were inoculated with Tera-2 cells
labeled with eGFP-FFLuc under the left kidney capsule and received 1 × 10⁷ CD30.CAR-Ts or
CD19.CAR-Ts (Ctr.T) i.v. by day 15. Representative IVIS images indicating tumor growth (left panel)
and cumulative BLI (right panel) are illustrated (mean ± SEM, n = 4–5 per group, 2 independent
experiments). **=p<0.001, one-way ANOVA at day 42. (F) Cumulative Kaplan-Meier survival curve of
BLI <5 x 10⁷ p/s for 2 independent experiments. *=p<0.05 by log-rank (Mantel-Cox) test.

34
Figure 2.5: CD30.CAR-Ts eliminate Tera-1 CD30– cells in a cell contact-dependent but antigen-
independent manner. (A) Tera-1 cells were FACS-sorted to obtain CD30+ and CD30– cells. Histogram
shows CD30 expression on sorted cells. (B) Sorted Tera-1 CD30+ and CD30– cells were labeled with
CFSE and co-cultured with either Ctr.Ts or CD30.28-Ts for 5 days. Cells were then collected and
evaluated by flow cytometry to quantify T cells (CD3+) and tumor cells (CFSE+). Representative flow
plots (top panels) and cumulative data (bottom panels) summarizing CFSE+ tumor cell frequency (mean ±

35
SEM, n = 4 donors) are shown. ns = not significant, **=p<0.01, two-sided, paired Student’s T test. (C)
Tera-1 cells were labeled with CFSE and co-cultured for 5 days with CD30.28-Ts at decreasing E:T ratios
ranging from 1:1 to 1:15. Representative plots (left columns) and CD30 histograms (right columns) of
CFSE+ Tera-1 cells with cumulative data (right graph) for remaining tumor cells calculated with flow
cytometry-based counting beads are shown (mean ± SEM, n = 5 donors). *=p<0.05, **=p<0.01, two-
sided, paired Student’s T test. (D) Tera-1 cells were co-cultured with CD19.CAR-Ts in the presence of
either K562/WT or K562/CD19+ cells at 1:1:1 ratio for 5 days. Cells were then collected and evaluated by
flow cytometry to quantify T cells (CD3+) and tumor cells (CD30+). Shown are representative flow
cytometry plots of CD3+ T cells and CD30+ EC cells pre-gated to exclude CD33+ K562 cells (left panels)
and cumulative data summarizing tumor cell numbers (right panels). Dashed line represents the initial
Tera-1 cell number (mean ± SEM, n=5 donors). *=p<0.05, two-sided, paired Student’s T test. (E) Tera-1
cells were plated in the lower chamber of a 0.4μm transwell-plate 24 hours prior to plating CD19.CAR-Ts
and either K562/WT or K562/CD19+ cells in the upper chamber at 1:1:1 ratio for 5 days. Tera-1 cells in
the lower chamber were then collected and counted by flow cytometry. Cumulative data are shown,
dashed line represents the initial cell number (mean ± SEM, n = 7 donors). ns=not significant, *=p<0.05,
two-sided, paired Student’s T test.

36
Figure 2.6: Functional Fas-FasL interaction is critical for the elimination of CD30– EC cells and
enhances anti-tumor activity of CD30.CAR-Ts. (A) Flow cytometry histograms showing CD95

37
expression and MFI in EC cell lines. T cells stimulated with anti-CD3/CD28 mAbs were used as positive
control for CD95 expression. (B) CD95 expression on pre-gated CD30+ or CD30– Tera-1 cells. (C) RT-
qPCR cumulative data for FasL mRNA expression among Ctr.T or CD30.28-Ts cultured alone or with
EC cells at a 5:1 E:T ratio for 4 hours at 37°C (mean ± SEM, n = 6 donors). FasL mRNA expression was
normalized to β-actin mRNA. ns = not significant, ***=p<0.0001, two-sided paired Student’s T test. (D-
E) Active caspase 3 and cleaved caspase 7 were assessed by flow cytometry in Tera-1 cells co-cultured
with Ctr.T or CD30.28-Ts at 1:2 or 1:5 E:T ratio for 18 hours, respectively. Representative flow plots (left
panels) and cumulative data (right panels) of active caspase 3 frequency (D) or cleaved caspase 7 MFI (E)
among Tera-1 CD30– and CD30+ cells, respectively are shown (mean ± SEM, n = 5 donors). *=p<0.05,
**=p<0.01, two-sided, paired Student’s T test. (F) CD95 expression on pre-gated CD30– cells for Tera-
1/WT or Tera-1 cells transduced with CD95 shRNA and FACS-sorted based on CD95– expression (Tera-
1/CD95 KO) is shown. CD95 frequency and MFI for Tera-1/CD95 KO cells are indicated. (G) Tera-
1/WT or Tera-1/CD95 KO cells were co-cultured with Ctr.Ts or CD30.28-Ts at 1:5 E:T ratio for 18
hours. Representative flow plots (left panels) and cumulative data (right panels) for active caspase 3
among Tera-1 CD30– cells are shown (mean ± SEM, n = 4 donors). ns = not significant, ***=p<0.001,
two-sided, paired Student’s T test. (H) CD95 expression on NCCIT/WT cells and NCCIT cells
transduced to express CD95 (NCCIT/CD95+). CD95 frequency and MFI for NCCIT/CD95+cells are
indicated. (I) NCCIT/WT or NCCIT/CD95+ cells were co-cultured with Ctr.Ts or CD30.28-Ts at 1:2 E:T
ratio for 5 days. Representative flow plots (left panels) and cumulative data (right panels) showing
remaining tumor cells are illustrated (mean ± SEM, n = 4 donors). ns = not significant, *=p<0.05, two-
sided, paired Student’s T test.

38
Figure 2.S1: CD30.CAR-T characteristics. (A) Schematic of CD30.CARs encoding either the CD28
(CD30.28-T) or the 4-1BB (CD30.BB-T) endodomains. The anti-CD30 scFv domain (aCD30 scFv) was
cloned in frame with CD8α hinge and transmembrane domain (TM) and either CD28 or 4-1BB
endodomains with CD3z. (B) CAR transduction efficiency was detected by flow cytometry using an anti-
mouse Alexa Fluor 647-conjugated F(ab’)2 antibody. Representative histograms (top panels) and
cumulative data (bottom panels) are shown (mean ± SEM, n=7 donors). ***=p<0.001, repeated-measures
ANOVA. (C) Cumulative data for CAR-T expansion in vitro at day 2/3 and day 7 post transduction
39
(mean ± SEM, n=5 donors). *=p<0.05, repeated-measures ANOVA. (D) CAR-T immunophenotype by
day 7 post-transduction. Representative plots pre-gated on CD3+ T cells (top panels) and cumulative data
for CCR7+CD45RA+ stem cell-like memory T cells (top graph) (23) and CD45RA–CD45RO+ central and
effector memory T cells (bottom graph) are shown (mean ± SEM, n=5 donors). ns=not significant, two-
sided, paired Student’s T test.

40
Figure 2.S2: Co-culture of CD30.CAR-Ts and tumor cells. (A) Representative flow plots (left panels)
and cumulative data (right panels) of 5-day co-culture assays of CD30.CAR-Ts with Lan-1/WT (CD30–)
or Lan-1/CD30 (CD30+) tumor cells labeled with anti-GD2 mAb (mean ± SEM, n=4 donors). ns=not
significant, **=p<0.01, ***=p<0.001, two-sided, paired Student’s T test. (B-D) Representative flow plots

41
of CD30.CAR-T co-cultures with Tera-1 (B) or Tera-2 (C) cells at the 1:2 and 1:5 E:T ratios, and of
CD30.CAR-T co-culture with NCCIT cells (D) at 1:1 and 2.5:1 E:T ratios.

42
Figure 2.S3: CD30.CAR-Ts proliferate and secrete pro-inflammatory cytokines in response to EC
cell lines. (A) Representative histograms (left panels) and cumulative data (right panels) of CFSE dilution
of CFSE-labeled CD3+ Ctr.Ts, CD30.28-Ts and CD30.4-1BB-Ts after 5 days alone or in co-culture with
tumor cells (mean ± SEM of CFSE MFI, n=5 donors). ns=not significant, *=p<0.05, **=p<0.01,
***=p<0.001, two-sided, paired Student’s T test. (B-C) Cumulative quantification by ELISA of IFNγ (B)
and IL-2 (C) released in co-culture supernatant after 24 hours by Ctr.Ts, CD30.28-Ts and CD30.4-1BB-
Ts with either CD30+ or CD30- tumor cells at 1:1 E:T ratio (mean ± SEM, n=5 donors). ns= not
significant, *=p<0.05, **=p<0.01, ***=p<0.001, two-sided, paired Student’s T test.

43
Figure 2.S4: CD30.CAR-T expansion and anti-tumor activity in vivo. (A) NSG mice were inoculated
with Tera-2 cells under the left kidney capsule and, 21 days later, infused i.v. with 1 × 10⁷ eGFP-FFLuc-
labeled CD30.CAR-Ts or CD19.CAR-Ts (Ctr.T). BLI from individual mice are shown (n=3-4 per group,
2 independent experiments). **=p<0.001, one-way ANOVA at day 12. (B-C) T cell-treated mice were
sacrificed at day 30-45 post tumor inoculation, and blood samples (B) and spleens (C) were collected to
detect human CD45+CD3+ T cells. Blood samples were normalized to 100μL total volume. Cumulative
quantification of %CD45+CD3+ T cells are shown (mean ± SEM; n=1-5 per group, 4 independent
experiments). (D) Tumors were harvested at day 30-45 post tumor inoculation and stained for
hematoxylin/eosin (H&E) or anti-human CD3 mAb to detect tumor-infiltrating T lymphocytes. Positive
samples displayed moderate to strong, diffuse cytoplasmic labeling for CD3, at 4X magnification, scale
bar=200μm. Arrow=tumor, *=CD3 T cell clusters. (E) NSG mice were inoculated with Tera-2 cells

44
labeled with eGFP-FFLuc under the left kidney capsule and received 1 × 10⁷ CD30.CAR-Ts or
CD19.CAR-Ts (Ctr.T) i.v. by day 15. BLI from individual mice are illustrated (n=4-5 per group, 2
independent experiments). **=p<0.001, one-way ANOVA at day 42.

45
Figure 2.S5: Tera-1 CD30– cells are eliminated by CAR-Ts in a cell contact-dependent but antigen-
independent manner. (A) Sorted Tera-1 CD30+ and CD30– cells were labeled with CFSE and co-
cultured with either Ctr.Ts or CD30.BB-Ts for 5 days, and then analyzed by flow cytometry. Shown are
representative flow plots (top panels) and cumulative data (bottom panels) summarizing tumor cell
frequency (mean ± SEM, n=4 donors). *=p<0.05, **=p<0.01, two-sided, paired Student’s T test. (B)
Cumulative data for IFNγ (top panels) and IL-2 (bottom panels) release by Ctr.Ts, CD30.28-Ts and

46
CD30.4-1BB-Ts in the supernatant of co-culture with Tera-1 CD30+ or CD30– cells at 1:1 E:T ratio are
shown (mean ± SEM, n=4 donors). ns= not significant, *=p<0.05, **=p<0.01, ***=p<0.001, two-sided
paired Student’s T test. (C) Representative plots (left columns) and CD30 histograms (right columns) of
CFSE+ Tera-1 cells co-cultured for 5 days with CD30.BB-Ts at decreasing E:T ratios and cumulative data
(right graph) for remaining tumor cells calculated with flow cytometry-based counting beads are shown
(mean ± SEM, n=5 donors). ns=not significant, *=p<0.05, **=p<0.01, two-sided, paired Student’s T test.

47
Figure 2.S6: Functional Fas-FasL interaction is critical for the elimination of CD30– EC cells by
CD30.CAR-Ts. (A) FasL mRNA expression measured by RT-qPCR of CD30.BB-Ts cultured alone or
with EC cells at a 5:1 E:T ratio for 4 hours at 37°C. Expression is normalized to housekeeping gene β-
actin. n=6 independent experiments; **=p<0.001 by two-sided, paired Student’s T test. (B-C)
Representative flow plots (left panels) of active caspase 3 (B) or cleaved caspase 7 (C) staining pre-gated
on Tera-1 CD30– or CD30+ cells after co-culture with Ctr.Ts or CD30.BBTs for 18 hours at 37°C and
cumulative data (right panels) are shown (mean ± SEM, n=5 donors). *=p<0.05, **=p<0.001, two-sided,
paired Student’s T test. (D) Tera-1/WT or Tera-1/CD95 KO cells were co-cultured with Ctr.Ts or
CD30.BB-Ts at 1:5 E:T ratio for 18 hours. Representative flow plots (left panels) and cumulative data
(right panels) for active caspase 3 among Tera-1 CD30– cells are shown (mean ± SEM, n=4 donors).
**=p<0.001, two-sided, paired Student’s T test.

48
Figure 2.S7: Tera-2 cells are susceptible to antigen-independent killing by CD30.CAR-Ts, while
NCCIT cells are resistant to CD30.CAR-T targeting. (A-B) Tera-2 (A) and NCCIT (B) cells were co-
cultured with CD19.CAR-Ts in the presence of either K562/WT or K562/CD19+ cells at 1:1:1 ratio for 5
days, and then analyzed by flow cytometry to detect T cells (CD3+) and CD30+ EC cells after excluding
CD33+ K562 cells. Cell numbers were calculated using flow cytometry-based counting beads.
Representative flow plots (left panels) and cumulative data (right panels) summarizing tumor cell

49
numbers with the dashed lines indicating initial tumor cell numbers are shown (mean ± SEM, n=5
donors). ns=not significant, *=p<0.05, two-sided, paired Student’s T test. (C) 51Cr release assay of control
T cells (Ctr.T), CD30.28-Ts and CD30.BB-Ts against NCCIT cells (mean ± SEM, n=4 donors). ns=not
significant, repeated measures one-way ANOVA comparing individual effector:target (E:T) ratios. (D)
Heatmap showing expression of differentially expressed genes between NCCIT, Tera-1, and Tera-2 cells
within the MSigDB KEGG Apoptosis and Biocarta c2 p53 pathways, scaled by samples. Dendrogram
represents hierarchical clustering based upon complete linkage of the Euclidean distances of gene
expression.

50
2.7 Tables
Name Fold_Change pValue FDR FDR_pValue Pathway
TNFRSF10C|8794 66.04886 3.00E-27 1.75E-25 1.21E-25 Apoptosis
FAS|355 41.49672 3.68E-45 5.67E-43 5.93E-43 Apoptosis
IRAK1|3654 37.22048 2.12E-23 9.85E-22 6.81E-22 Apoptosis
BAX|581 13.61859 3.21E-13 6.53E-12 4.70E-12 Apoptosis
IL1A|3552 10.06591 1.74E-17 5.39E-16 4.01E-16 Apoptosis
IRAK3|11213 6.468845 4.77E-09 5.90E-08 3.65E-08 Apoptosis
TP53|7157 5.769441 2.28E-09 2.96E-08 2.04E-08 Apoptosis
IL1RAP|3556 4.534274 4.38E-05 0.000258 0.000185669 Apoptosis
AKT3|10000 3.833167 4.69E-12 8.41E-11 6.29E-11 Apoptosis
PIK3CB|5291 2.863943 5.62E-06 4.00E-05 2.92E-05 Apoptosis
PPP3CC|5533 2.863359 3.18E-05 0.000193 0.000143559 Apoptosis
CASP8|841 2.800288 4.70E-06 3.40E-05 2.52E-05 Apoptosis
TNFRSF1A|7132 2.602997 3.28E-05 0.000198 0.000143559 Apoptosis
BCL2L1|598 2.529618 0.013219 0.037486 0.03224637 Apoptosis
CASP7|840 2.484147 0.001036 0.004231 0.003474941 Apoptosis
CYCS|54205 2.302319 0.006106 0.019478 0.016115773 Apoptosis
TNFRSF10B|8795 2.21098 0.00061 0.002669 0.00213417 Apoptosis
PIK3CD|5293 2.043929 0.01553 0.042942 0.036768477 Apoptosis
NFKBIA|4792 1.907605 0.001278 0.005095 0.004065303 Apoptosis
TNFRSF10A|8797 1.739238 0.030244 0.074595 0.064069802 Apoptosis
CAPN1|823 1.682036 0.26243 0.403895 0.370625045 Apoptosis
RELA|5970 1.671595 0.152998 0.270074 0.256590082 Apoptosis
PRKAR2B|5577 1.446705 0.167047 0.28839 0.269084695 Apoptosis
NFKB1|4790 1.377542 0.174565 0.298168 0.270240809 Apoptosis
PRKAR1A|5573 1.308662 0.180944 0.306422 0.27744725 Apoptosis
PRKX|5613 1.230738 0.408733 0.555538 0.530694185 Apoptosis
CASP3|836 1.229529 0.492671 0.632681 0.619687895 Apoptosis
IL1R1|3554 1.181133 0.629068 0.745153 0.753036565 Apoptosis
TNFRSF10D|8793 1.143618 0.654343 0.763955 0.767019413 Apoptosis
PPP3CB|5532 1.085238 0.725897 0.817087 0.828861566 Apoptosis
AKT2|208 1.071054 0.795687 0.866276 0.883486841 Apoptosis
IKBKB|3551 1.023179 0.925571 0.951552 0.951425781 Apoptosis
CHUK|1147 1.021913 0.92225 0.949446 0.951425781 Apoptosis
CASP6|839 1.01198 0.959633 0.974305 0.96563033 Apoptosis
ENDOD1|23052 1.006705 0.978079 0.985916 0.978078592 Apoptosis
PRKAR1B|5575 0.964554 0.94092 0.961799 0.95878506 Apoptosis
PIK3R1|5295 0.949455 0.815978 0.879873 0.899811369 Apoptosis
CFLAR|8837 0.874773 0.631428 0.746934 0.753036565 Apoptosis
DFFB|1677 0.81684 0.327852 0.47439 0.439867876 Apoptosis
TNFSF10|8743 0.775089 0.657445 0.766141 0.767019413 Apoptosis
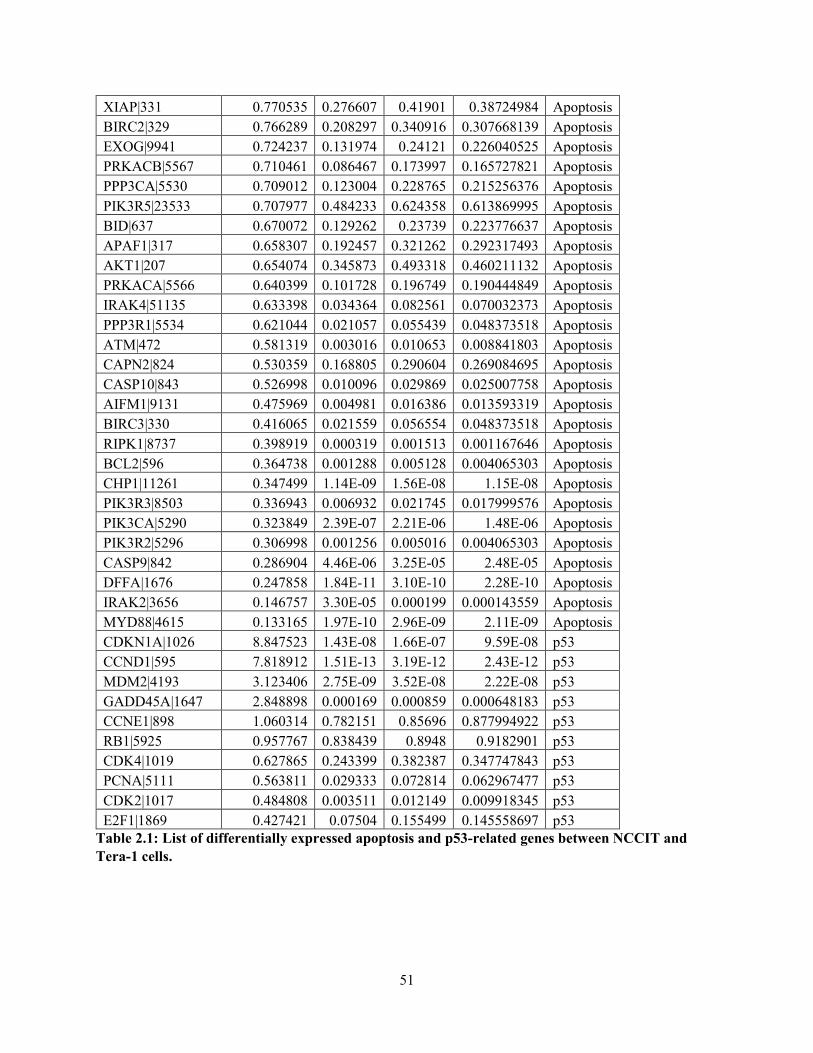
51
XIAP|331 0.770535 0.276607 0.41901 0.38724984 Apoptosis
BIRC2|329 0.766289 0.208297 0.340916 0.307668139 Apoptosis
EXOG|9941 0.724237 0.131974 0.24121 0.226040525 Apoptosis
PRKACB|5567 0.710461 0.086467 0.173997 0.165727821 Apoptosis
PPP3CA|5530 0.709012 0.123004 0.228765 0.215256376 Apoptosis
PIK3R5|23533 0.707977 0.484233 0.624358 0.613869995 Apoptosis
BID|637 0.670072 0.129262 0.23739 0.223776637 Apoptosis
APAF1|317 0.658307 0.192457 0.321262 0.292317493 Apoptosis
AKT1|207 0.654074 0.345873 0.493318 0.460211132 Apoptosis
PRKACA|5566 0.640399 0.101728 0.196749 0.190444849 Apoptosis
IRAK4|51135 0.633398 0.034364 0.082561 0.070032373 Apoptosis
PPP3R1|5534 0.621044 0.021057 0.055439 0.048373518 Apoptosis
ATM|472 0.581319 0.003016 0.010653 0.008841803 Apoptosis
CAPN2|824 0.530359 0.168805 0.290604 0.269084695 Apoptosis
CASP10|843 0.526998 0.010096 0.029869 0.025007758 Apoptosis
AIFM1|9131 0.475969 0.004981 0.016386 0.013593319 Apoptosis
BIRC3|330 0.416065 0.021559 0.056554 0.048373518 Apoptosis
RIPK1|8737 0.398919 0.000319 0.001513 0.001167646 Apoptosis
BCL2|596 0.364738 0.001288 0.005128 0.004065303 Apoptosis
CHP1|11261 0.347499 1.14E-09 1.56E-08 1.15E-08 Apoptosis
PIK3R3|8503 0.336943 0.006932 0.021745 0.017999576 Apoptosis
PIK3CA|5290 0.323849 2.39E-07 2.21E-06 1.48E-06 Apoptosis
PIK3R2|5296 0.306998 0.001256 0.005016 0.004065303 Apoptosis
CASP9|842 0.286904 4.46E-06 3.25E-05 2.48E-05 Apoptosis
DFFA|1676 0.247858 1.84E-11 3.10E-10 2.28E-10 Apoptosis
IRAK2|3656 0.146757 3.30E-05 0.000199 0.000143559 Apoptosis
MYD88|4615 0.133165 1.97E-10 2.96E-09 2.11E-09 Apoptosis
CDKN1A|1026 8.847523 1.43E-08 1.66E-07 9.59E-08 p53
CCND1|595 7.818912 1.51E-13 3.19E-12 2.43E-12 p53
MDM2|4193 3.123406 2.75E-09 3.52E-08 2.22E-08 p53
GADD45A|1647 2.848898 0.000169 0.000859 0.000648183 p53
CCNE1|898 1.060314 0.782151 0.85696 0.877994922 p53
RB1|5925 0.957767 0.838439 0.8948 0.9182901 p53
CDK4|1019 0.627865 0.243399 0.382387 0.347747843 p53
PCNA|5111 0.563811 0.029333 0.072814 0.062967477 p53
CDK2|1017 0.484808 0.003511 0.012149 0.009918345 p53
E2F1|1869 0.427421 0.07504 0.155499 0.145558697 p53
Table 2.1: List of differentially expressed apoptosis and p53-related genes between NCCIT and
Tera-1 cells.

52
Name Fold_Change pValue FDR FDR_pValue Pathway
TNFRSF10C|8794 79.26094277 1.03E-32 4.89E-31 8.20E-31 Apoptosis
FAS|355 49.14248522 3.28E-57 4.13E-55 5.25E-55 Apoptosis
IRAK1|3654 18.37371162 4.28E-16 7.32E-15 5.27E-15 Apoptosis
ENDOD1|23052 7.985109511 2.83E-24 8.26E-23 6.47E-23 Apoptosis
IRAK3|11213 6.661140836 8.56E-11 8.77E-10 6.23E-10 Apoptosis
IL1RAP|3556 4.78794376 3.87E-07 2.46E-06 1.72E-06 Apoptosis
AKT3|10000 4.735314364 2.67E-16 4.68E-15 3.57E-15 Apoptosis
TP53|7157 4.708863682 1.28E-10 1.28E-09 8.52E-10 Apoptosis
CAPN2|824 4.632079192 1.16E-17 2.26E-16 2.06E-16 Apoptosis
PPP3CC|5533 4.484936372 8.25E-17 1.50E-15 1.32E-15 Apoptosis
IL1R1|3554 4.0038805 6.53E-08 4.68E-07 3.26E-07 Apoptosis
TNFRSF10D|8793 3.910728218 1.33E-11 1.50E-10 1.18E-10 Apoptosis
IL1A|3552 3.371677521 4.68E-05 0.000207626 0.000159389 Apoptosis
BAX|581 3.239081791 0.004621537 0.012995841 0.010874204 Apoptosis
BCL2|596 3.170192119 3.18E-08 2.38E-07 1.75E-07 Apoptosis
PIK3CB|5291 2.995854416 1.89E-07 1.26E-06 8.88E-07 Apoptosis
NFKBIA|4792 2.962036551 1.03E-10 1.04E-09 7.14E-10 Apoptosis
PRKX|5613 2.858434188 5.70E-07 3.54E-06 2.47E-06 Apoptosis
BID|637 2.667998681 2.03E-10 1.98E-09 1.30E-09 Apoptosis
CASP7|840 2.494259887 1.03E-06 6.16E-06 4.36E-06 Apoptosis
APAF1|317 2.377093942 0.000573774 0.002022795 0.001639353 Apoptosis
TNFRSF10A|8797 2.361111555 1.39E-05 6.74E-05 5.05E-05 Apoptosis
PRKAR2B|5577 2.224876745 0.00040566 0.00148278 0.001201955 Apoptosis
TNFRSF10B|8795 2.101415936 4.67E-05 0.000207093 0.000159389 Apoptosis
NFKB1|4790 1.959142734 0.000455298 0.001640874 0.001324502 Apoptosis
CAPN1|823 1.737886255 0.160489296 0.261007713 0.239983993 Apoptosis
MYD88|4615 1.714524906 0.067065316 0.12837042 0.11295211 Apoptosis
TNFRSF1A|7132 1.673030501 0.008968732 0.023139645 0.019391852 Apoptosis
BIRC2|329 1.581622732 0.022653717 0.051422627 0.045307435 Apoptosis
CYCS|54205 1.575978476 0.102329084 0.181548919 0.163726534 Apoptosis
ATM|472 1.482179343 0.00854319 0.022181487 0.018724801 Apoptosis
PRKAR1B|5575 1.392864048 0.429548655 0.557031724 0.512893916 Apoptosis
IKBKB|3551 1.290258908 0.146665347 0.243419775 0.223490053 Apoptosis
PPP3CA|5530 1.285699308 0.206619053 0.318571134 0.287469986 Apoptosis
CASP6|839 1.262992281 0.201863979 0.312636352 0.283317865 Apoptosis
CFLAR|8837 1.131022895 0.452614601 0.578809576 0.530074239 Apoptosis
RELA|5970 1.111006079 0.777321358 0.847211102 0.827247746 Apoptosis
EXOG|9941 1.103317481 0.641557327 0.739821742 0.69829369 Apoptosis
BIRC3|330 1.042290371 0.908751185 0.939805503 0.932052497 Apoptosis
BCL2L1|598 0.945207316 0.836476146 0.890501537 0.874746297 Apoptosis
CASP3|836 0.898415078 0.62654425 0.728193285 0.686623836 Apoptosis
AKT2|208 0.879699656 0.592000376 0.700290937 0.654049791 Apoptosis

53
PRKACA|5566 0.871280349 0.592732623 0.700628567 0.654049791 Apoptosis
CASP8|841 0.858989207 0.406247061 0.53514454 0.501077521 Apoptosis
PRKACB|5567 0.836574947 0.324255818 0.452074501 0.421796186 Apoptosis
PRKAR1A|5573 0.80816873 0.247267191 0.366744683 0.339931928 Apoptosis
CHUK|1147 0.787157479 0.164941721 0.266674437 0.244358105 Apoptosis
PPP3CB|5532 0.784398382 0.257719604 0.378223507 0.346513754 Apoptosis
PIK3CD|5293 0.781382066 0.456540662 0.582409349 0.530074239 Apoptosis
PIK3R2|5296 0.778369745 0.413874247 0.542293105 0.501077521 Apoptosis
AKT1|207 0.772623031 0.512768653 0.631871396 0.581865138 Apoptosis
RIPK1|8737 0.759618272 0.260286316 0.381221849 0.347048421 Apoptosis
PIK3R3|8503 0.741552067 0.157724857 0.257426211 0.238075256 Apoptosis
PPP3R1|5534 0.674137699 0.044818057 0.091308429 0.079315613 Apoptosis
TNFSF10|8743 0.595871863 0.416520689 0.544577064 0.501077521 Apoptosis
PIK3R1|5295 0.588467302 0.011804416 0.029296413 0.024851401 Apoptosis
IRAK2|3656 0.549876835 0.101224801 0.180052911 0.163595638 Apoptosis
IRAK4|51135 0.544756549 0.001662357 0.005256548 0.004432951 Apoptosis
DFFA|1676 0.506572856 0.000402698 0.001473188 0.001201955 Apoptosis
XIAP|331 0.4424645 0.0006659 0.002316421 0.001869194 Apoptosis
CHP1|11261 0.409030306 2.26E-09 1.97E-08 1.39E-08 Apoptosis
AIFM1|9131 0.323699451 2.23E-06 1.24E-05 8.71E-06 Apoptosis
PIK3CA|5290 0.31678786 6.53E-08 4.68E-07 3.26E-07 Apoptosis
DFFB|1677 0.309244044 1.13E-06 6.69E-06 4.65E-06 Apoptosis
CASP10|843 0.18763365 5.21E-11 5.48E-10 4.17E-10 Apoptosis
CASP9|842 0.17407903 6.57E-11 6.85E-10 5.00E-10 Apoptosis
PIK3R5|23533 0.149417544 0.000101385 0.000422166 0.000337952 Apoptosis
CDKN1A|1026 11.77883444 3.35E-13 4.40E-12 3.83E-12 p53
CCND1|595 7.939426569 2.68E-16 4.70E-15 3.57E-15 p53
MDM2|4193 3.044055534 4.40E-09 3.69E-08 2.52E-08 p53
GADD45A|1647 1.834063727 0.002200594 0.006773922 0.00577205 p53
PCNA|5111 1.255117695 0.114926298 0.199813481 0.182061462 p53
RB1|5925 1.182573312 0.41089585 0.539300803 0.501077521 p53
CDK2|1017 1.143256088 0.372636685 0.501122645 0.471782586 p53
CCNE1|898 0.883146498 0.388482809 0.517008684 0.485603511 p53
CDK4|1019 0.677339083 0.338303354 0.467656132 0.436520457 p53
E2F1|1869 0.346079916 0.013166234 0.032194502 0.027358409 p53
Table 2.2: List of differentially expressed apoptosis and p53-related genes between NCCIT and
Tera-2 cells.

54
Name Fold_Change pValue FDR FDR_pValue Pathway
MYD88|4615 12.46815897 9.72E-16 3.49E-14 2.59E-14 Apoptosis
BCL2|596 8.516785329 3.11E-16 1.17E-14 9.97E-15 Apoptosis
ENDOD1|23052 7.739959562 2.88E-23 1.82E-21 1.53E-21 Apoptosis
CAPN2|824 5.977170799 0.003289396 0.011130576 0.012531031 Apoptosis
BID|637 3.851649622 7.23E-08 8.47E-07 9.64E-07 Apoptosis
APAF1|317 3.542182649 2.97E-06 2.44E-05 2.64E-05 Apoptosis
IRAK2|3656 3.462398782 0.027041372 0.064429955 0.069784186 Apoptosis
TNFRSF10D|8793 3.258378276 6.01E-05 0.000351323 0.000356425 Apoptosis
IL1R1|3554 3.256809204 8.18E-05 0.000462777 0.000451047 Apoptosis
PIK3R2|5296 2.528139083 0.005068455 0.015990515 0.018430746 Apoptosis
ATM|472 2.49856432 2.24E-06 1.88E-05 2.11E-05 Apoptosis
BIRC3|330 2.488279962 0.00791459 0.023239096 0.026381966 Apoptosis
PRKX|5613 2.255896724 0.001556888 0.005913995 0.00673249 Apoptosis
PIK3R3|8503 2.214207744 0.036231183 0.082173687 0.085249842 Apoptosis
BIRC2|329 2.036362364 5.02E-05 0.000299121 0.00032103 Apoptosis
DFFA|1676 2.00954999 0.002842337 0.00986931 0.011369348 Apoptosis
RIPK1|8737 1.876810569 0.011261469 0.031098676 0.034650673 Apoptosis
PPP3CA|5530 1.786965985 0.003820001 0.012620842 0.014213958 Apoptosis
NFKBIA|4792 1.518498686 0.033784393 0.077597968 0.080679147 Apoptosis
PPP3CC|5533 1.507991004 0.080990826 0.156451628 0.164032054 Apoptosis
PRKAR2B|5577 1.507799462 0.058185199 0.119775731 0.124128424 Apoptosis
EXOG|9941 1.496709406 0.094323525 0.176622497 0.177550165 Apoptosis
PRKAR1B|5575 1.405070189 0.437659316 0.569711399 0.593436361 Apoptosis
NFKB1|4790 1.387362294 0.180753251 0.29437152 0.307665109 Apoptosis
PRKACA|5566 1.340983855 0.251300117 0.379575176 0.402080187 Apoptosis
TNFRSF10A|8797 1.323315195 0.254649058 0.383166013 0.403404449 Apoptosis
CFLAR|8837 1.26852714 0.376265851 0.511567466 0.552316846 Apoptosis
IKBKB|3551 1.24003076 0.373474464 0.508835497 0.552316846 Apoptosis
CASP6|839 1.227976307 0.364928833 0.500282716 0.545687974 Apoptosis
AKT3|10000 1.20897357 0.394195141 0.529308251 0.564164017 Apoptosis
AKT1|207 1.168980204 0.764759514 0.840944682 0.874010873 Apoptosis
CHP1|11261 1.164235554 0.384849686 0.519871784 0.559781362 Apoptosis
PRKACB|5567 1.161607122 0.445690474 0.576676857 0.594253966 Apoptosis
FAS|355 1.128421539 0.552646459 0.671096484 0.669874496 Apoptosis
TNFRSF10C|8794 1.089868879 0.715801296 0.803193488 0.845447955 Apoptosis
PPP3R1|5534 1.071665477 0.734737155 0.817673109 0.84574061 Apoptosis
PIK3CB|5291 1.023586178 0.916722043 0.945861136 0.964970571 Apoptosis
IL1RAP|3556 1.00290616 0.991930184 0.994451846 0.996976712 Apoptosis
CAPN1|823 0.99840346 0.996976712 0.997714697 0.996976712 Apoptosis
IRAK3|11213 0.988597882 0.97100733 0.981414212 0.995904954 Apoptosis
CASP7|840 0.973477737 0.914498768 0.944321746 0.964970571 Apoptosis
PIK3CA|5290 0.969045368 0.877462799 0.920095147 0.942241932 Apoptosis

55
TNFRSF10B|8795 0.928498048 0.722229128 0.807584899 0.845447955 Apoptosis
IRAK4|51135 0.850964937 0.407953414 0.542393434 0.576507065 Apoptosis
AKT2|208 0.811729236 0.442267579 0.57384549 0.594253966 Apoptosis
TP53|7157 0.781983264 0.317621325 0.451899412 0.488133505 Apoptosis
TNFSF10|8743 0.781293076 0.702638858 0.794403205 0.838971771 Apoptosis
CHUK|1147 0.761538351 0.19503154 0.31242497 0.325052566 Apoptosis
CASP3|836 0.72174756 0.217893286 0.340947844 0.35574414 Apoptosis
PPP3CB|5532 0.712740614 0.078592894 0.152898592 0.163309909 Apoptosis
AIFM1|9131 0.675718708 0.088548547 0.167690744 0.170695994 Apoptosis
CYCS|54205 0.668468007 0.083788996 0.160664505 0.165509128 Apoptosis
RELA|5970 0.660513234 0.28637487 0.418594833 0.444854167 Apoptosis
TNFRSF1A|7132 0.6303822 0.03826975 0.085839801 0.088741449 Apoptosis
CASP9|842 0.615013855 0.214045046 0.336346338 0.353063994 Apoptosis
PIK3R1|5295 0.614513493 0.041206331 0.091154035 0.092859337 Apoptosis
PRKAR1A|5573 0.609609401 0.011095633 0.030716563 0.034650673 Apoptosis
XIAP|331 0.56685483 0.005973984 0.018414361 0.021240833 Apoptosis
IRAK1|3654 0.463666898 0.009453425 0.026885244 0.030250961 Apoptosis
PIK3CD|5293 0.381720587 0.003158346 0.010777138 0.012325253 Apoptosis
DFFB|1677 0.379813205 0.000668203 0.002853953 0.003144485 Apoptosis
BCL2L1|598 0.363098051 0.001435298 0.005506771 0.006379102 Apoptosis
CASP10|843 0.360988629 0.001282598 0.005015545 0.005863306 Apoptosis
IL1A|3552 0.327784688 1.17E-06 1.04E-05 1.17E-05 Apoptosis
CASP8|841 0.302178695 9.55E-09 1.33E-07 1.39E-07 Apoptosis
PIK3R5|23533 0.251195017 0.0203725 0.050986098 0.056199999 Apoptosis
BAX|581 0.233032518 5.87E-06 4.50E-05 4.70E-05 Apoptosis
TIMP3|7078 3.807469864 4.97E-05 0.000297352 0.00032103 p53
CDK2|1017 2.320657916 0.000397915 0.001825975 0.001989575 p53
PCNA|5111 2.187994451 0.001682802 0.006313055 0.007047907 p53
CDKN1A|1026 1.242686496 0.466095373 0.595617163 0.606302925 p53
RB1|5925 1.216359365 0.320337612 0.454773083 0.488133505 p53
CDK4|1019 1.068061553 0.867546058 0.912416713 0.942241932 p53
CCND1|595 0.979846591 0.935851731 0.958009472 0.977464002 p53
MDM2|4193 0.956158011 0.821050083 0.881830963 0.899780913 p53
E2F1|1869 0.847764335 0.781888716 0.853935864 0.882594738 p53
CCNE1|898 0.822984104 0.360058513 0.496061983 0.543484548 p53
GADD45A|1647 0.626866347 0.083653584 0.160475787 0.165509128 p53
Table 2.3: List of differentially expressed apoptosis and p53-related genes between Tera-1 and
Tera-2 cells.

56
CHAPTER 3: DISCUSSION
Despite intensive research for almost two decades, CAR-T therapy for solid tumors has yet to
match the success rates of the CD19.CAR-Ts for leukemia/lymphoma patients (152). There are several
major obstacles, both in the design process as well as after infusion into patients, that limit CAR-T
therapeutic efficacy. Our data support the use of CD30.CAR-Ts as a novel and effective form of
immunotherapy against EC, in particular the relevance of Fas/FasL interactions for CAR-T targeting of
solid tumors. The limitations of CD30.CAR-T therapy will also be discussed, as well as several
engineering strategies to improve CD30.CAR-T anti-tumor efficacy.
3.1 CD30 is an ideal EC antigen to target by CAR-T therapy
A major challenge in targeting solid tumors by CAR-T therapy is the limited number of candidate
antigens, as many tumor-associated antigens are also shared with normal tissues (153). The ideal target
antigen should: a) be expressed at the cell surface at sufficient levels to be recognized by the CAR, b) be
expressed in most tumor cells, especially cancer stem cells which are a tumor subpopulation that
contributes to relapse (132) and c) be expressed in a sufficient number of patients with little to no
expression in essential normal tissues (154). Choosing appropriate target antigens is critical for safety, as
toxicities related to “on-target off-tumor” effects due to improper CAR-T activation against normal
tissues have limited further treatment in patients (155). In an extreme case, a patient with colon cancer
that metastasized to the lungs and liver who was treated with ERBB2-specific CAR-Ts developed acute
respiratory distress syndrome due to low-level ERBB2 expression in lung tissue and died five days after
the initial infusion (156). These symptoms are mechanistically linked to elevated levels of IL-6 and IFN-γ
released by innate immune cells and infused T cells, respectively, termed cytokine release syndrome
(CRS) (155).

57
Based on these criteria, CAR-Ts have been designed to target classes of antigens: a) Antigens
with novel peptide sequences due to gene mutation or posttranslational modifications (neoantigens), such
as EGFRvIII or glycosylated MUC1, b) antigens which are normally expressed only during fetal
development or at immunoprivileged sites, such as CEA or cancer-testis antigens like NY-ESO-1, or c)
antigens expressed at higher than normal levels on tumor cells compared to non-malignant host cells, such
as mesothelin (152). Although neoantigens are most ideal for CAR-T targeting because they are
exclusively expressed by tumor cells, these antigens are typically unique to individuals and are generally
not scalable for multiple patients (157).
CD30 is an ideal target for CAR-T immunotherapy against ECs, as it is highly expressed on ECs
both at diagnosis and after disease progression (108). Although the function of CD30 in ECs is unclear,
Herszfeld et al. specifically linked CD30 expression to enhanced tumorigenic features among transformed
hematopoietic stem cells (87), and we show that CD30 is also expressed on EC cells with stem cell-like
properties. Furthermore, CD30 expression in TGCTs is correlated with worse outcomes, such as increased
rates of metastasis and decreased progression-free survival (108); therefore, patients with increased risk of
disease progression are also likely to benefit from CD30-targeted therapy. Promising results have been
reported using brentuximab vedotin in relapsed TGCT patients enrolled in clinical studies (110;130). In
our preclinical study using CD30+ ECs, we show that CD30.CAR-Ts can selectively target both
differentiated and stem cell-like EC cells, reducing the chance of relapse.
3.2 CD30.CAR-Ts utilize Fas/FasL interactions to target ECs with heterogeneous antigen
expression
Tumor cells can escape CAR-T targeting either in an indirect manner due heterogeneous
expression of the target antigen in a subpopulation of cells, such as EGFRvIII in glioblastoma (158), or in
a direct manner by downregulating targeted antigens (159;160) or modifying antigens (73) to escape
immune surveillance. In the past, one strategy to overcome tumor escape has been to target more than one
antigen present on tumor cells. For example, CAR-Ts targeting two different antigens, but where one

58
receptor bears only the CD3ζ endodomain and the other contains only the co-stimulatory endodomain, has
been used to generate an optimal anti-tumor response only in the presence of both antigens (161;162).
Alternatively, CAR-Ts which contain two different extracellular receptors fused together (tandem CARs)
or as separate receptors (bispecific CARs) have been designed to prevent tumor escape by antigen
downregulation (163). Specific examples include the CD19/CD20 bispecific CAR-Ts for B cell
lymphoma (135) and HER2/IL13Rα2 bispecific CAR-Ts (164) or tandem CAR-Ts (165) for
glioblastoma. However, the configuration of the extracellular receptor could impact the efficacy of these
bispecific CAR-Ts, and optimal designs are still empirically determined (154).
We show that Fas-FasL interaction between ECs and CD30.CAR-Ts may represent a novel way
to overcome tumor escape associated with antigen heterogeneity. Specifically, in Tera-1 cells with Fas+
expression and a mixed population of CD30+ and CD30– cells, we show that both fractions are eliminated
upon CD30.CAR-T activation. This phenomenon is consistent with known observations that TGCTs are
highly susceptible to chemotherapy agents, which induce cell death via the death receptor pathways
(166;167). Others have subsequently shown that EC upregulates Fas downstream of p53 in response to
cisplatin chemotherapy (168), showing a direct link between chemotherapy susceptibility and Fas
signaling. Fas/FasL signaling is also important for drug-induced apoptosis in multiple cancers such as
leukemia (169), neuroblastoma (170), and hepatoma (171). Therefore, it is plausible that CAR-Ts can
utilize FasL to target multiple cancers with heterogeneous antigen expression.
3.3 CD30.CAR-Ts introduce Fas/FasL interactions in a localized manner
An important mechanism by which cytotoxic T lymphocytes (CTLs) induce cell death is the
engagement of Fas ligand and TNF-related apoptosis-inducing ligand (TRAIL) with their corresponding
death receptors Fas, DR4, and DR5 on tumor cells (172). Specifically, upon ligand binding the death
receptors stabilize into complexes, induce activation, and recruit adaptor proteins to form the death-
inducing signaling complex (DISC), the activation platform for pro-caspase-8 and subsequent cleavage of
caspases 3, 6, and 7 (137;173). In a similar manner, granzyme B/perforin lytic granules secreted by CTLs

59
can also trigger apoptotic and/or necrotic cell death through caspases 3 or 7 (174). Granzyme B can also
induce cell death in a caspase-independent manner by altering mitochondrial membrane permeability
(174). Granzyme A, the other primary granzyme secreted by CTLs, induces cell death by cleaving SET,
leading to single-strand DNA breaks with inhibition of DNA repair (175). To augment tumor cell death,
multiple investigators have targeted the Fas/FasL pathway but these therapies had severe toxicities
limiting their clinical use. For example, the Fas agonistic antibody Jo2 or RK-8, was efficient in killing
tumor cells but also resulted in extensive liver damage due to both direct and indirect effects on
hepatocyte cell death (176;177).
We observe that CD30.CAR-Ts, upon activation by receptor engagement, selectively upregulates
FasL expression and targets both CD30+ and CD30– EC cells in a contact-dependent manner. Specifically,
while CD30.CAR-Ts eradicate CD30+ EC cells via perforin/granzyme B-mediated mechanisms, they also
eliminate surrounding CD30– tumor cells, if they express the CD95 molecule, via caspase 3 activation.
Therefore, in contrast to systemic antibody treatment, CD30.CAR-Ts engage in localized Fas/FasL
interactions and may represent a safer alternative.
Nevertheless, tumor cells can also downregulate Fas expression as a mechanism of immune
escape. For example, reduced Fas expression has been previously reported in colon carcinomas in part
due to DNA hypermethylation of a CpG-rich region within the Fas promoter (142). Fas mutations have
also been described in 62.5% of EC lesions (144). The NCCIT cell line is an example of a resistant tumor
cell line that show Fas downregulation, possibly due to its expression of a mutant p53 which is non-
functional (178). Our RNA-Seq data also suggest that NCCIT cells have decreased expression of p53
compared to the EC cell lines Tera-1 and Tera-2, with corresponding decreased expression of apoptosis-
related genes. Nevertheless, we demonstrate that inducing Fas overexpression in NCCIT cells is sufficient
to improve CD30.CAR-T anti-tumor activity. These results suggest that the downstream Fas signaling
transduction pathway is intact in NCCIT cells, and that Fas/FasL interactions can be manipulated to
improve CD30.CAR-T targeting even at low E:T ratios.

60
3.4 Improvements to CD30.CAR-Ts for optimal T cell trafficking and persistence in vivo
CAR-Ts, similarly to other T cell therapies, show limited persistence after infusion not only in
pre-clinical models like what we observed, but also in phase I clinical trials. For example, HER2-specific
CAR-Ts did not expand after infusion in the peripheral blood, though cells trafficking to the tumor site
could be detected at low levels for more than 6 weeks (77). In a clinical trial using FR CAR-Ts for
ovarian cancer, T cells were undetectable in the blood but persisted at low levels in tumors (70). For GD2
CAR-Ts, the duration of persistence was shown to be associated with the percentage of CD4+ cells and
central memory cells (CD45RO+CD62L+) in the infused product (78). Even among the CAR-Ts that show
long-term persistence, multiple factors can prevent optimal T cell trafficking to the tumor site, such as
decreased expression of appropriate chemokine receptors (56;179) or physical barriers such as abnormal
vasculature (180) or collagen (181).
To both improve CAR-T anti-tumor activity and avoid systemic toxicity with intravenous
delivery, some investigators have performed intratumoral administration of T cells. For example,
intracranial delivery of the IL13-zetakine CAR-Ts for recurrent glioblastoma resulted in transient anti-
glioma responses was observed in 2 out of 3 patients as well as increased tumor necrosis at the site of T
cell administration (182). Intrahepatic delivery of CEA-directed CAR-Ts through percutaneous hepatic
artery infusions for liver metastasis was also well-tolerated (183). Other investigators are engineering new
delivery mechanisms, such as implantable biopolymer devices (184) that bring CAR-Ts directly to the
surface of the tumor site.
CAR-Ts have also been modified to support T cell trafficking and persistence in vivo. Co-
transduction of CAR-Ts with appropriate chemokine receptors enhances T cell localization and anti-
tumor activity, such as CCR2 for CCL2-secreting malignant pleural mesotheliomas (185) or
neuroblastoma (179). CAR-Ts engineered to express heparanase, the only known mammalian enzyme to
cleave heparan sulphate proteoglycans and otherwise downregulated among in vitro cultured CAR-Ts,
showed improved tumor infiltration by ECM degradation and enhanced CAR-T anti-tumor activity (118).
61
CAR-Ts expressing the pro-survival cytokine IL-15 show greater expansion, decreased PD-1 expression,
and improved anti-tumor activity (146). More recently, investigators showed that CAR-Ts expressing IL-
18 have a T-bethi FOXO1lo pro-inflammatory effector phenotype with enhanced anti-tumor activity
against pancreatic cancers (186) and melanoma (187). Nishio et al. (145) combined CAR-T cells with an
oncolytic adenovirus armed with the chemokine RANTES and the cytokine IL-15 to improve tumor cell
killing, CAR-T cell migration and overall survival in a mouse model of neuroblastoma without overt
toxicities to CAR-Ts. An intriguing application of our results would be to engineer oncolytic viruses to
selectively induce high levels of Fas in tumor cells, which would synergize with CAR-T therapy to
promote both antigen-dependent CAR-mediated and antigen-independent Fas/FasL mediated elimination
of tumor cells.
Alternatively, combining T cell therapy with other treatment modalities such as peripheral
immune checkpoint blockade or oncolytic viruses may create a synergistic anti-tumor response. For
example, therapeutic PD-1 or PD-L1 blockade shows favorable responses in patients with pre-existing
TILs that are otherwise negatively regulated by PD-1/PD-L1 mediated adaptive resistance (188;189). In
the first phase I clinical trial combining CAR-T cell therapy with PD-1 inhibition, lymphodepletion prior
to CAR-T therapy resulted in increased circulating levels of IL-15 & CAR-T expansion but surprisingly
PD-1 inhibition did not further enhance expansion or persistence (190). PD-L1 is highly expressed in
some EC tumors (148), and in a case study one EC patient was reported to respond to anti-PD-1 therapy
(43). While PD1/PD-L1 blockade as single agents may not be effective in TGCTs due to its low mutation
rates (149), these inhibitors may prevent the exhaustion of CD30.CAR-Ts that express PD1 upon
activation (150).
In conclusion, we demonstrate that CD30.CAR-Ts represent a clinically applicable strategy in
patients with ECs, who are at increased risk of relapse after chemotherapy and who otherwise have
limited treatment options. CD30.CAR-Ts target both differentiated and stem cell-like EC cells. We also
show that CD30.CAR-Ts, upon antigen engagement, upregulate FasL to enhance CAR-T cytolytic

62
activity against antigen-expressing cells while also countering tumor escape due to heterogeneous antigen
expression (Fig.3.1). More broadly, CD30.CAR-Ts could be used to target other CD30-expressing solid
tumors, such as neoplasms with chondroid differentiation (151).

63
Figure 3.1: Model for CD30.CAR-Ts targeting both CD30+ and CD30– EC cells. CD30.CAR-Ts
become activated by engagement of its extracellular receptor with CD30, initiating tumor cell death by
both upregulation of FasL and of granzyme B/perforin. CD30– EC cells are targeted by activated
CD30.CAR-Ts through Fas/FasL interactions at the cell surface.
64
APPENDIX 1: EPIGENETIC DYSFUNCTION IN TURNER SYNDROME IMMUNE CELLS 2
Introduction
Turner Syndrome (TS) is a common chromosomal abnormality, occurring in about 1:4000 live
births, which describes phenotypic females with either partial or complete absence of one sex
chromosome (191). TS in named for Dr. Henry Turner who in 1938 published his study describing seven
women with short stature, sexual immaturity, cubits valgus, webbed neck and low posterior hairline
(192). In the mid 1950s, advances in cytogenetic identification of chromosomes discovered that patients
with TS were missing an X chromosome (193). The absence of this sex chromosome results in
characteristic TS clinical findings: short stature, webbed neck, lymphedema of hands and feet, ovarian
failure and recurrent otitis media (Table 1) (194).
In non-Turner 46 XX females, one copy of the X chromosomes is inactivated to achieve some
degree of balanced gene expression between males and females. Thus, absence of one sex chromosome,
on the surface, would not be predicted to have any effect. However, X-inactivation is incomplete. In 46
XX females 15% of the genes on the silenced X chromosome escape inactivation and continue to be
expressed from both chromosomes. Most genes escaping X-inactivation are pseudoautosomal genes
located on the short arm of the X chromosome and have homologous genes on the Y chromosome.
Therefore, most abnormalities seen in TS are thought to be due to haploinsufficiency of genes that are
normally expressed by both X chromosomes (Fig. 1A) (191;195).
In 1965, after analyzing hundreds of karyotypes of patients with various forms of gonadal
dysgenesis, Dr. Malcolm Ferguson-Smith proposed that short stature and congenital malformations found
in TS were due to gene deletions from the short arm of the missing X chromosome. He hypothesized that
some genes on the silenced X chromosome escape inactivation (196). His observations were confirmed in
2 This appendix previously appeared in the journal Current Allergy and Asthma Reports. The original citation is as
follows: Thrasher B, Hong LK, Whitmire JK, Su MA. “Epigenetic Dysfunction in Turner Syndrome Immune Cells.”
Curr Allergy Asthma Rep 2016 May;16(5):36.
65
future chromosomal banding and molecular studies with the identification of the short stature homeobox-
containing gene (SHOX). SHOX is a pseudoautosomal gene that escapes X-inactivation and is highly
expressed in osteogenic tissue. Haploinsufficiency for SHOX in TS is the major contributor to growth
failure in TS (197).
Knowledge of TS has increased exponentially since it was first described in 1938. With better
recognition and routine health exams physicians are able to treat some of the comorbidities associated
with TS, such as growth failure and ovarian insufficiency. However, there is still much to be learned
about other comorbidities associated with TS, particularly immune abnormalities. This review will
discuss the current literature regarding TS and associated immune abnormalities and will highlight the
role of a pseudoautosomal gene recently discovered to affect CD4+ T cells’ ability to clear chronic viral
infection.
Turner Syndrome is associated with immune abnormalities
In addition to the wide array of anatomical and physiological features and comorbidities, TS
patients have a predisposition to immune mediated diseases, including chronic otitis media (OM). The
pathogenic mechanism underlying this susceptibility to otitis media is unclear. One hypothesis is that
craniofacial features of TS predisposes to chronic OM (198). Another hypothesis is that an underlying
immune deficiency may be a component of TS and contribute to chronic otitis media. Consistent with this
latter possibility, TS patients have abnormal immune alterations in T cell and immunoglobulin subsets,
reduced levels of serum IgG and IgM, increased IgA and decreased levels of circulation T and B
lymphocytes (199-201). However, these findings are not conclusive, as other studies looking for immune
abnormalities in TS subjects did not find major immunological deficiencies (202-204). Thus, some
though not all studies suggested that TS subjects might have an immune deficiency that predisposes to
chronic OM.

66
TS patients have decreased expression of UTX, a histone modifying enzyme
Based on the underlying genetic basis for TS, it is likely that immune deficiencies in TS are
primarily due to direct effects of haploinsufficient X-chromosome genes. To screen for candidate genes
that are haploinsufficient in TS patients, Cook et al. performed a microarray analysis on peripheral blood
mononuclear cells (PBMCs) comparing control females to TS subjects with confirmed 45X karyotype
(205). 1169 unique genes showed differential expression, including 35 on the X chromosome. In
particular, Ubiquitously Transcribed Tetratricopeptide repeat on chromosome X (UTX, encoded by Utx
or Kdm6a located at Xp11.3 (206)) was among the top 10 genes with the largest decrease in expression
and the only gene among these candidates that escapes X-inactivation (207).
UTX is a histone modifying protein that epigenetically regulates expression of its target genes.
Epigenetics refers to any process that causes changes in gene expression without changes in the DNA
sequence (208). For this review, we will focus on chromatin modifications as epigenetic mechanisms of
regulation (209). Chromatin, the condensed packaging of DNA, consist of nucleosomes that contain 146
base pairs of DNA tightly wound around histones (210). These histones contain amino acid residues on
“tails” exposed around the nucleosome core that can be biochemically modified, such as methylation,
acetylation, and phosphorylation, to alter gene expression. Histone H3 lysine 27 trimethylation
(H3K27me3) is a repressive modification typically found in heterochromatin or transcriptionally silenced
loci. H3K27 methylation status is enzymatically regulated by methyltransferases, such as Ezh2, that adds
methyl groups to suppress transcription of its target genes (211). Conversely, the Jumonji D3 (Jmjd3)
family of H3K27 demethylases, comprising of Jmjd3 and UTX, remove methyl groups and enable gene
expression (Fig. 1B) (212).
UTX, as the name implies, is ubiquitously expressed and plays a major role in several cell
processes, such as embryonic development (213;214), cell cycle regulation (215), hematopoiesis (216),

67
and cancer pathogenesis (217;218). Of note, genetic deficiency of either the KMT2D gene or the UTX
gene results in the genetic disorder Kabuki syndrome (KS), a rare congenital disorder that is also
associated with immune abnormalities such as recurrent OM (205;206), reduced immunoglobulin levels,
hypogammaglobulinemia, poor vaccine response and reduced memory T and B lymphocytes (219;220)
These clinical findings suggest that UTX may also be critical for regulating T cell development and/or
immune function.
UTX regulates T follicular helper cell (Tfh)-mediated clearance of chronic viral infection
Naïve CD4+ T cells, upon antigenic stimulation, become activated and can differentiate into
several T helper subsets depending on the local cytokine milieu. To achieve this carefully orchestrated
immune response, differentiating CD4+ T cells upregulate a specific subset of genes, such as subset-
defining transcription factors and effector molecules, and repress non-subset specific genes (210). This
epigenetic “framework” allows both flexibility for naive T cells to differentiate into multiple unique
subsets as well as specificity in gene expression (221). During chronic viral infection, T follicular helper
(Tfh) cells, in particular, are critical for generating an appropriate B cell antibody response. Tfh cells were
initially described as a CXCR5hi CD4+ T cell subset within human tonsils, lymphoid tissues that are
subjected to high antigenic burden from both nonpathogenic and pathogenic exposures (222). Within
follicles of secondary lymphoid tissues, B cells require CXCR5 expression to migrate to germinal centers
(GCs) as sites of B cell maturation; thus, T cell expression of CXCR5 enables Tfh cells to co-localize
with B cells. Tfh-B cell interactions through T cell receptor-major histocompatibility complex class II
(TCR-MHCII) engagement and through signaling proteins, such as SAP, CD40-CD40L and ICOS,
promote B cell somatic hypermutation, class switching and IgG antibody formation (223-226).
Importantly, murine and human Tfh surface markers and master transcription factor expression of B-cell
lymphoma 6 (Bcl6) is highly conserved (222), making mouse models of chronic infection an ideal model
to study Tfh function.

68
Several human genetic immunodeficiencies have revealed an important role for Tfh cells in
clearing viral infection. For example, X-linked lymphoproliferative disease (XLP) patients with a Sh2d1a
genetic mutation resulting in loss of SAP expression are at a profound increased risk for Epstein-Barr
Virus infections and have nearly absent GCs (222). In addition, Tfh deficiency has been associated with
poor neutralizing antibody response in chronic viral infections like HIV (227). Finally, otitis-prone
children following infection displayed reduced cytokine-secreting memory T cells and a poor IgG
response relative to children not prone to OM, suggesting poor T cell help to B cell antibody responses in
children with chronic OM (228). Understanding how Tfh cell differentiation and function is regulated,
therefore, is critical for boosting the anti-viral immune response.
Cook et al recently demonstrated that UTX supports T follicular helper cells (Tfh cells) that are
needed for B cell antibody generation during chronic viral infection (205). Mice with a conditional UTX
deficiency in T cells (UTX-TCD mice) showed normal clearance of acute viral infection but elevated
viral titers after chronic viral infection that persisted even after clearance by control mice. This impaired
immunity to chronic viral infection was associated with decreased Tfh cells, fewer germinal centers, and
impaired virus-specific IgG production. Mechanistically, UTX is required for proper Tfh differentiation
and the induction of Tfh-specific gene expression, such as ICOS and SLAMF6, while inhibiting Th1-
specific gene expression. In UTX-deficient Tfh cells, decreased gene expression corresponded to
increased H3K27 methylation status for the majority of Tfh-specific genes, consistent with decreased
demethylase activity. Finally, mice that are heterozygous for T cell-specific UTX deficiency show
partially attenuated viral loads, suggesting that UTX function for Tfh-dependent clearance of chronic viral
infection is dose dependent (205).
TS patients have decreased Tfh cells which may increase predisposition to chronic OM

69
Overall, these data suggest that UTX may be haploinsufficient in TS patients with functional
consequences for Tfh-dependent clearance of chronic OM. To test whether UTX deficiency results in Tfh
cell deficiency in TS subjects, total naïve (CD45RA+), antigen-experienced (CD45RO+) CD4+ cells and
CD4+CXCR5+ cells were measured. In humans, CD4+CXCR5+ cells in peripheral blood have been
associated with antibody production, which allows them to serve as a measurable substitute of Tfh (229).
No significance was noted in total, naïve and antigen-experienced CD4+ T cells between TS subjects and
controls. However, the frequency of CD4+ CXCR5+ T cells were reduced by 2-fold in TS subjects
compared to controls (205). This suggests that decreased UTX expression in TS patients might increase
their predisposition to viral infections due to Tfh cell deficiency.
UTX may also affect other T cell subsets in a demethylase-dependent and independent manner
In addition to its H3K27 demethylase activity, UTX can also regulate gene expression in a
demethylase-independent manner through protein interactions with chromatin remodeling complexes,
such as Brg1, and transcriptional protein complexes. For example, UTX interacts with Th1-specific
transcription factor T-bet and the Brg1-containing SWI/SNF remodeling complex in primary human T
cells to upregulate interferon-gamma (Ifng) expression (230). Interestingly, siRNA inhibition of UTX
with transfection of a demethylase-inactive mutant rescued chromatin remodeling at the Ifng promoter
similarly to demethylase-sufficient UTX (230). In embryonic development, UTX deficiency in male mice
can be compensated by UTY, a homologue of UTX expressed on the Y chromosome but with no
demethylase activity (214;231). Furthermore, the development of male embryos deficient in both UTX
and Jmjd3, and therefore all known H3K27me3 demethylase activity, was similar to that of embryos
lacking Jmjd3 alone (231). Therefore, UTX demethylase activity is dispensable for embryonic
development.

70
Recent work demonstrated that UTX may play an important role in T cell differentiation and
effector functions. For example, T cell-specific UTX and Jmjd3-deficient mice showed increased
numbers of CD4SP mature thymocytes but decreased peripheral T cell numbers (232). This effect was
due to increased H3K27me3 with corresponding decreased expression of S1PR1, the sphingosine receptor
required for mature thymocytes to exit the thymus (232). Furthermore, demethylase-defunct UTY failed
to rescue CD4SP thymocyte S1PR1 expression in UTX and Jmjd3-deficient males, supporting the notion
that H3K27 demethylase activity directly results in S1PR1 expression. Deficiency in either UTX or Jmjd3
alone in CD4+ T cells resulted in a milder phenotype, suggesting that UTX and Jmjd3 have overlapping
H3K27 demethylase activity (232). Conversely, ChIP-Seq experiments in UTX-deficient T cells reveal
several gene loci for which gene expression is different relative to controls but no H3K27 methylation
changes were detected (205;232). Overall, UTX demethylase function is highly gene-specific – as in,
specifically targets the gene expression of a select number of genes rather than regulate global
H3K27me3 homeostasis - but also has demethylase-independent activity critical for its function in vivo.
Whether UTX regulates other T cell subsets important for viral clearance, such as CD4+ Th1 cells or
CD8+ cytotoxic T cells, is unknown.
Conclusions and future directions
TS association with autoimmune diseases and chronic otitis media suggest that TS patients have
abnormal immune alterations in T cell and immunoglobulin subsets. However, studies looking for
immune abnormalities are inconclusive. Most recently postulated as to why TS patients are predisposed to
chronic viral infections is reduced expression of UTX, which serves as an epigenetic modulator in T cell
development. This suggests that TS subjects have aberrant regulation of immune pathways, which
increases their susceptibility to infections. Mechanistically UTX can explain why TS subjects have
recurrent OM, but it doesn’t explain why TS patients are an increased risk of autoimmune diseases such
as hypothyroidism and celiac disease. In regards to autoimmunity, TS patients are believed to have

71
defective regulatory T cells (Tregs) that fail to inhibit proliferation of effector T cells (204). On the other
hand, a different study showed no difference in Treg frequencies or function in TS patients (233). The
mechanism underlying defective Tregs remains elusive. Recently, DNA methylation patterns, another
epigenetic modification, of multiple autosomal genes involved in bone remodeling, glucose sensitivity
and ovarian function have been reported to be altered in TS (234). Thus, it is feasible that multiple
epigenetic mechanisms of gene regulation are dysregulated in TS.
From a therapeutic viewpoint, no pre-scheduled program of immune surveillance for TS patients
has been recommended. Large-scale studies evaluating immunoglobulin levels, T and B cell lymphocytes
at different time intervals are needed to determine if an immune surveillance schedule is warranted. If TS
subjects are found to have immune alterations, treatment with IVIG supplementation and frequency of
infections will need to be analyzed. Also, clinical studies evaluating the immune response in TS patients
to chronic viral illnesses and vaccines are needed to evaluate for immune alterations. Even though more
work needs to be done in the field of immunity and TS, the discovery of UTX as a gene with decreased
expression in TS and the mechanism by which UTX affects T cell differentiation is an important step in
developing new therapeutic opportunities correcting immune alterations at the cellular level.

72
Figure 1. (A) TS patients are haploinsufficient in pseudoautosomal genes. Because pseudoautosomal
genes escape inactivation, they are expressed from 2 copies of the X chromosomes in 46XX females.
They are also expressed on the Y chromosome, so are expressed from 2 copies in 46XY males. In 45XO
TS females, however, they are only expressed from 1 X chromosome, so may be haploinsufficient in TS.

73
(B) Model: UTX deficiency in TS patients predisposes to chronic viral infection due to impaired Tfh
differentiation. In 46XX females haplosufficient for UTX, Tfh cells differentiate from naïve CD4+ T cells
through UTX-specific H3K27 demethylase activity. H3K27 demethylation results in increased expression
of Tfh-specific genes and adequate Tfh help for B cell maturation, anti-viral antibody production, and
viral clearance. However, in TS patients and in UTX-deficient mice, UTX haploinsufficiency results in
decreased circulating Tfh cells due to H3K27 methylation and transcriptional suppression of Tfh-specific
genes.

74
Characteristics Prevalence (%)
Growth Abnormalities
• Short Stature
• Small for Gestational Age at Birth
90
Reproductive Abnormalities
- Ovarian Failure 90
Dermatologic Abnormalities
• Multipe Pigmented Nevi
• Lymphedema of the extremities
• Vitiligo
• Alopecia
70
Neck Abnormalities
• Webbed Neck
• Low Posterior Hairline
70
Chest Abnormalities
• Shield Chest
• Wide Spaced Nipples
70
Otologic Abnormalities
• Otitis Media
• Hearing Loss – Conductive or Sensorineural
50
Renal Abnormalities
• Horseshoe Kidney
• Renal Agenesis
50
Cardiovascular Abnormalities
• Coartation of the Aorta
• Hypertension
• Bicuspid Aortic Valves
50
Skeletal Abnormalities
• Short 4th Metacarpals
• Madelung Deformities
• Cubitus Valgus
50
Endocrine Abnormalities
• Autoimmune Hypothyroidism
• Carbohydrate Intolerance
50
Gastrointestinal Abnormalities
• Fatty Liver Disease
• Celiac Disease
30

75
Table 1: Characteristics and Comorbidities in Turner Syndrome. Clinical characteristics of TS
patients with prevalence are shown. Immune complications are highlighted in bold. Characteristics
secondary to lymphatic obstruction are italicized.

76
APPENDIX 2: COMBINATION CENTRAL TOLERANCE AND PERIPHERAL CHECKPOINT
BLOCKADE UNLEASHES ANTI-MELANOMA IMMUNITY3
Introduction
Augmenting endogenous anti-melanoma T cell responses through blockade of immune
checkpoints has proven effective as a therapeutic strategy against metastatic melanoma (235).
Ipilimumab, a monoclonal antibody targeting the co-inhibitory immune checkpoint protein CTLA-4 on T
cells, was the first systemic treatment to show prolonged overall survival in patients with metastatic
cutaneous melanoma (236). However, aCTLA-4 antibody provides disease control in only 22% of
patients (236;237), with long-term benefit in <10% of patients (236;238). Thus, for most metastatic
melanoma patients, the anti-melanoma T cell response after CTLA-4 blockade continues to be
inadequate. Since the approval of ipilimumab by the FDA in 2011, two other immune checkpoint
inhibitors, which target the co-inhibitory immune checkpoint protein PD-1, have been approved on the
basis of randomized clinical studies (239-241). Despite improved efficacy with treatments targeting PD-1,
many patients still have only transient responses or do not respond to these therapies. What constrains the
anti-melanoma effects of checkpoint inhibitors is currently unclear (242).
Central T cell tolerance mechanisms protect against the development of autoimmunity, but also
limit anti-tumor immunity (243-245). A key mediator of central tolerance is the Autoimmune Regulator
(Aire) gene, a transcriptional activator expressed predominantly in medullary thymic epithelial cells
(mTECs). There, Aire promotes expression of tissue-restricted self-antigens (TSAs), so that self-reactive
thymocytes that recognize these TSAs with high affinity undergo negative selection. A subset of Aire-
regulated TSA’s is expressed by both melanocytes and melanoma cells. As a consequence, while purging
self-reactive T cells that recognize melanocyte antigens, Aire also removes T cells capable of recognizing
3 This appendix previously appeared in the Journal of Clinical Investigation Insight. The original citation is as
follows: Bakhru P, Zhu M, Wang H-H, Hong LK, Khan I, Mouchess M, Gulati A, Starmer J, Hou Y, Sailer D, Lee
S, Zhao F, Kirkwood JM, Moschos S, Fong L, Anderson MS, Su MA. “Combination central tolerance and
peripheral checkpoint blockade unleashes antimelanoma immunity.” JCI Insight 2017;2(18):e93265.

77
and eradicating melanoma cells. In humans, protection from melanoma has been associated with distinct
AIRE single nucleotide polymorphisms (SNPs), which can decrease stability of Aire mRNA (246). This
protection is associated with increased frequency of T cell clones recognizing MAGE-1, a self/melanoma
antigen expressed in the thymus. Together, these findings support a model in which Aire deficiency
prevents deletion of T cell clones that recognize self/melanoma antigens to promote a more robust T cell-
mediated anti-tumor response.
While Aire limits anti-melanoma immunity through its function in the thymus, CTLA-4 and other
checkpoint proteins limit T cell responses through their activity in the immunologic periphery (247).
Upon T cell receptor (TCR) activation, T cells upregulate checkpoint proteins that attenuate the T cell
response (248). CTLA-4, for example, dampens early T cell activation by inducing inhibitory downstream
T cell receptor signaling and competitive inhibition of CD28-mediated coactivation. The distinct
mechanisms of actions of Aire and checkpoint proteins led us to hypothesize that blockade of central
Aire-mediated tolerance may interact with blockade of peripheral checkpoint inhibition to enhance T cell
mediated anti-melanoma immunity.
We report here that Aire deficiency and anti-CTLA-4 (aCTLA-4) antibody in combination have
an additive effect in diminishing melanoma outgrowth and prolonging survival in melanoma-bearing
mice. A pool of melanoma-reactive, cytolytic CD4+ T cells that escape thymic deletion in the setting of
Aire deficiency are further activated by checkpoint inhibition in the periphery, leading to enhanced anti-
tumor effect. Additionally, combination therapy using pharmacologic depletion of Aire-expressing
mTECs (249), and inhibition of CTLA-4 significantly prolonged survival in melanoma-bearing mice
compared to either strategy alone. Finally, an Aire single nucleotide polymorphism (SNP) (rs1055311) is
associated with response to ipilimumab therapy in metastatic melanoma patients, as part of the E1608
clinical trial (250). These findings point to Aire-mediated central tolerance as a key mechanism limiting
the efficacy of checkpoint inhibitors and provide pre-clinical evidence for combining central and
peripheral tolerance blockade to expand the anti-tumor immune response.

78
Results
Aire deficiency enhances anti-melanoma effects of CTLA-4 blockade in mice. A dominant
Aire G228W mutation results in partial loss of Aire function (251), and mice with one copy of this
mutation (AireGW/+ mice) have increased anti-melanoma immunity (245). We used AireGW/+ mice to test
the hypothesis that Aire deficiency and peripheral checkpoint inhibition have additive effects in
increasing anti-melanoma immunity. CTLA-4 is a co-inhibitory immune checkpoint protein induced by T
cell activation. In Aire-sufficient (WT) mice challenged with B16 melanoma, aCTLA-4 antibody
administration did not alter melanoma growth or host survival (Figure 1A and B), a finding consistent
with previous reports (252;253). In AireGW/+ mice, on the other hand, aCTLA-4 antibody decreased
melanoma growth and improved host survival compared to isotype control (Figure 1A and B). These
results suggest that Aire deficiency and aCTLA-4 antibody administration in combination have additive
effects in decreasing B16 melanoma growth and improving host survival.
Human Aire polymorphism is associated with response to aCTLA-4. We investigated
whether the interaction between Aire deficiency and aCTLA-4 antibody in melanoma-bearing mice might
also have relevance in melanoma patients. Monoclonal aCTLA-4 IgG1 (ipilimumab) was the first
checkpoint inhibitor to obtain FDA approval for patients with advanced melanoma. However, only 10-
20% of patients respond to treatment (236;254;255), and the factors that determine response are unclear.
Multiple Aire polymorphisms, including one that may negatively affect mRNA Aire stability (246), have
been associated with protection from melanoma development. This suggested that Aire polymorphisms
that disrupt Aire function may enhance anti-melanoma immunity in humans. Based on our findings in
mice, we sought to test whether Aire polymorphisms may be associated with response to ipilimumab.
We focused on 5 Aire polymorphisms (rs1800522, rs2075876, rs56393821, rs1800520,
rs1055311) that have previously been associated with melanoma protection. 79 patients with metastatic
melanoma participating in the E1608 study, a randomized phase 2 study of ipilimumab versus ipilimumab
plus GM-CSF (250), were genotyped for these 5 Aire polymorphisms. All 79 patients included in this

79
study were randomized to the ipilimumab-alone arm. The rs1055311 TT polymorphism, which has
previously been associated with protection from melanoma development (246), was present in 6/79
patients (7.6%). Presence of the rs1055311 TT polymorphism was associated with increased probability
of progression free survival (Fisher’s exact test p=0.036; Figure 1C) and trend toward increased
probability of overall survival, although this did not reach statistical significance [(log rank p=0.13);
Figure 1D]. A caveat of these findings is the small number of patients harboring the rs1055311 TT
polymorphism, which may reflect the melanoma-protective property of this SNP. These data suggest that
this Aire SNP may be associated with response to ipilimumab in metastatic melanoma and should be
validated in a larger scale study.
CD4+ T cells from Aire-deficient mice have increased cytolytic capacity. We next sought to
delineate the cellular mechanism underlying enhanced anti-melanoma immunity with combined Aire
deficiency and CTLA-4 blockade. While it is known that Aire deficiency rescues melanoma-reactive
CD4+ and CD8+ T cells from thymic deletion (244;245), whether enhanced anti-tumor immunity in Aire-
deficient mice is mediated by CD4+ or CD8+ T cells is unclear. To determine this, we purified CD4+ or
CD8+ T cells from either AireGW/+ or WT littermates and transferred these cells into immunodeficient
RAG−/− recipients. Recipients were then inoculated with syngeneic B16 melanoma cells. Reduced tumor
growth and improved survival was associated with CD4+ T cells from AireGW/+ compared to WT
donors (Figure 2A and 2B). In contrast, CD8+ T cells from AireGW/+ and WT donors had similar effects
on tumor growth and survival (Supp. Figure 1A and B). While the absolute number of CD4+ T cells was
not significantly increased (Figure 2C), Aire deficiency was associated with increased expression of Ki67,
a marker of proliferation, on transferred CD4+ T cells (Figure 2D). Neither CD8+ absolute numbers nor
Ki67 expression, however, was increased with Aire deficiency (Supp. Figure 1C and D). These data
suggest the possibility that CD4+ T cells may mediate enhanced melanoma rejection in Aire deficiency.
Although CD8+ T cells are recognized as a T cell subset capable of killing cancer cells, CD4+ T
cells also possess direct cytolytic capacity against tumors (256;257). In particular, CD4+ T cells marked

80
by Killer cell lectin-like receptor subfamily G member 1 (KLRG1) express high levels of cytotoxicity-
associated genes (258). Interestingly, frequency of KLRG1+ tumor infiltrating lymphocytes (TILs) was
increased in recipients of CD4+ T cells from AireGW/+ compared to WT donors (Figure 2E, top).
Additionally, the frequency of TILs expressing the cytolytic protein, granzyme B, was increased in
recipients of CD4+ T cells from AireGW/+ compared to WT donors (Figure 2E, bottom). To test whether
Aire-deficient CD4+ T cells have increased cytolytic capacity, we incubated purified AireGW/+ or WT
CD4+ splenocytes with Cell-Trace Violet (CTV)-labeled B16 melanoma cell targets. A greater loss of
B16 cells occurred with AireGW/+ compared to WT CD4+ T cells (Figure 2F). Similar numbers of B16
cells remained, on the other hand, after incubation with AireGW/+ and WT non-CD4+ T cells (Supp.
Figure 1E). Increased B16 cytolysis by AireGW/+ CD4+ T cells is mediated by granzyme, since addition
of a granzyme inhibitor (3,4 dichloroisocoumarin) abrogated this effect (Figure 2G). Together, these
findings suggest a critical role for cytolytic CD4+ T cells in mediating the enhanced melanoma rejection
associated with Aire deficiency.
Additive effect of Aire deficiency and anti-CTLA-4 antibody on CD4+ T cell responses. We
next examined the T cell response in AireGW/+ mice treated with aCTLA-4 antibody. The frequency of
Ki67+ CD4+ TILs was highest in AireGW/+ mice treated with aCTLA-4 antibody, compared to isotype
control-treated AireGW/+ mice or aCTLA-4 antibody treated WT mice (Figure 3A), which suggests that
Aire deficiency and aCTLA-4 antibody cooperate to increase TIL proliferation. Furthermore, frequency
of CD4+ T cells expressing markers associated with cytolytic activity (KLRG1, granzyme B) were also
highest in AireGW/+ mice treated with aCTLA-4 antibody (Figure 3B). Among CD8+ T cells, Aire
deficiency and aCTLA-4 antibody did not have additive effects in increasing the frequency of Ki67+ or
KLRG1+ cells (Supp. Figure 2). In aCTLA-4 antibody treated mice, Aire deficiency increased the
frequency of Granzyme B+ CD8+ T cells; notably, however, in all groups, the frequency of Granzyme B+
cells among CD8+ T cells was quite low (<2% on average). In sum, these findings suggest that Aire
deficiency and CTLA-4 blockade have additive effects primarily through activating CD4+ T cells.

81
Interestingly, aCTLA-4 antibody administration in AireGW/+ mice increased the frequency of
splenic as well as tumor-infiltrating CD4+FOXP3+ regulatory T cells (Tregs) (Supp. Figure 3A-D).
Furthermore, the ratio of effector-to-regulatory T cells (Teff:Treg) was similar, or lower, in Aire-deficient
mice treated with aCTLA-4 antibody for both CD4+CD25− Teff cells and CD8+ Teff cells (Supp. Figure
3E, F). Thus, depletion of Tregs does not underlie the additive anti-melanoma effect of Aire deficiency
and CTLA-4 blockade.
Aire deficiency enhances anti-melanoma effects of CTLA-4 blockade in a CD4+ TCR Tg
mouse model. We have previously reported that the self/melanoma antigen TRP-1 is expressed in the
thymus under the control of Aire (245). We therefore sought to determine whether TRP-1 specific T cells
might underlie the additive anti-melanoma effects of Aire deficiency and CTLA-4 blockade. To
determine the antigen-specificity of activated cells, we used an IL-2 ELISPOT assay to detect rare
antigen-specific T cells in the spleen of melanoma-bearing mice. As expected, Aire deficiency, with or
without aCTLA-4 antibody administration, did not affect the frequency of IL-2 producing T cells reactive
against the irrelevant foreign antigen, Ovalbumin (OVA, Figure 3C, left). In contrast, Aire-deficient mice
treated with isotype control antibody harbored an expanded population of IL-2 producing T cells reactive
against TRP-1. Moreover, aCTLA-4 antibody treatment of Aire-deficient mice further expanded the
precursor frequency of IL-2 producing T cells reactive against TRP-1 (Figure 3C, right). Thus, increased
melanoma rejection in AireGW/+ mice treated with aCTLA-4 antibody is accompanied by expansion of T
cells recognizing TRP-1 self/melanoma antigen.
Given this finding, we used a CD4+ TCR Tg model to test whether CD4+ T cells reactive against
TRP-1 may mediate the additive effects of blocking Aire and CTLA-4 in combination. TRP-1 T cell
receptor (TCR) Transgenic (Tg) mice are an MHCII restricted mouse model in which CD4+ T cells
recognize the melanoma antigen TRP-1 (259). In Aire sufficient (WT) TRP1-TCR Tg mice challenged
with B16 melanoma, aCTLA-4 antibody administration did not affect melanoma growth or host survival
(Figure 4A, B). In AireGW/+ TRP1-TCR Tg littermates, on the other hand, aCTLA-4 antibody
82
completely prevented tumor growth, with survival of all mice up to 50 days after tumor inoculation.
These findings suggest that TRP-1 specific CD4+ T cells may mediate the additive anti-melanoma effects
of Aire deficiency and aCTLA-4 antibody administration in combination.
Vitiligo is a T cell-mediated autoimmune condition associated with effective melanoma
immunotherapy (260). Notably, peri-orbital and tail vitiligo (Figure 4C) was observed in AireGW/+ TRP-
1 TCR Tg mice treated with aCTLA-4 antibody, reminiscent of epidermal vitiligo described in (261).
These findings provide evidence that Aire deficiency and CTLA-4 blockade also have additive effects in
autoimmune destruction of melanocytes.
aCTLA-4 antibody does not impair thymic negative selection of TRP-1 TCR Tg T cells. In our
working model, we hypothesize that Aire deficiency and aCTLA-4 antibody have additive anti-melanoma
effects due to their function at distinct sites. Whereas Aire functions in the thymus, aCTLA-4 antibody
functions in the immune periphery. However, it is possible that this model is incorrect and that anti-
CTLA-4 may also function through altering thymocyte development. To test this possibility, we treated
TRP-1 TCR Tg mice with either isotype control or aCTLA-4 antibody. TRP-1 TCR Tg CD4 single
positive (CD4SP) T cells undergo negative selection in an Aire-dependent manner (245) and therefore can
be used to assess aCTLA-4 antibody effects. As expected, Aire deficiency results in defective negative
selection, as demonstrated by the increased %CD4SP cells in thymi of AireGW/+ mice compared to WT
(Supp. Figure 4). In contrast, no change in %CD4SP was seen between aCTLA-4 and isotype control
antibody treatment in WT thymi. These findings suggest that CTLA-4 blockade does not inhibit thymic
negative selection of melanoma-reactive CD4+ T cells. Instead, aCTLA-4 antibody may be functioning
in an extrathymic manner to enhance anti-melanoma immunity.
Aire deficiency does not exacerbate colitis severity in aCTLA-4 antibody treated mice. Immune-
related colitis is a frequent ipilimumab-mediated toxicity in metastatic melanoma patients and can be life-
threatening (236;262). Likewise in mice, intestinal mucosal inflammation in experimental autoimmune
colitis is exacerbated by aCTLA-4 antibody administration (263). Whether Aire deficiency promotes the

83
colitogenic effects of CTLA-4 blockade, however, is not known. This question is of direct clinical
relevance because exacerbation of immune-mediated adverse events is a potential limiting factor in
combining CTLA-4 blockade with additional immune modulating therapies.
We utilized an autoimmune colitis model induced by adoptive transfer of naïve T cells into
RAG−/− recipients (264) to test the combinatorial effects of Aire deficiency and CTLA-4 blockade on
colitis severity. Naïve CD4+ (CD25− CD45RBhigh) effector T cells from WT or AireGW/+ mice were
transferred into RAG-/- mice, and reconstituted recipients were treated with aCTLA-4 or isotype control
antibody. As expected based on prior studies (263), aCTLA-4 antibody treatment of recipients
reconstituted with WT cells resulted in more severe weight loss compared to no treatment or isotype
control antibody (Figure 5A). Consistent with this finding, aCTLA-4 antibody administration was
associated with more severe colonic inflammation by histological evaluation than control treatment in
recipients of WT cells (Figure 5B and C). Importantly, weight loss and colonic inflammation was not
exacerbated by Aire deficiency in donors, even if recipients were treated with anti-CTLA-4 antibody.
Thus, in this model of immune-mediated colitis, Aire deficiency does not exacerbate the colitogenic
effects of aCTLA-4 antibody treatment. This finding is consistent with previous studies reporting that
Aire does not regulate development of colitogenic T cells (265;266).
Anti-RANKL antibody enhances the immunotherapeutic effects of checkpoint inhibition in
melanoma-bearing mice. mTEC survival and Aire expression are dependent on RANKL signaling, so
that RANKL blockade with anti-RANKL (aRANKL) antibody depletes Aire-expressing mTECs in adult
mice (249). This loss of Aire+ mTECS is associated with rescue of TRP-1 specific CD4+ T cells from
negative selection in the thymus (Supp. Figure 5). aRANKL antibody thus represents a pharmacologic
means to induce transient Aire deficiency through Aire-expressing mTEC depletion. Since anti-tumor
effects of checkpoint inhibition could be enhanced by genetic Aire deficiency, we tested the effects of
concurrent administration of aRANKL and aCTLA-4 antibodies on anti-melanoma immunity. This

84
treatment combination is clinically appealing since aRANKL antibody is FDA-approved for bone
metastases, osteoporosis, and other indications, so has a well-known safety profile (267).
Treatment with aRANKL and/or aCTLA-4 antibodies, however, did not have additive effects on
improving survival in melanoma-bearing C57BL/6 polyclonal mice (data not shown). Previous studies
have shown that vaccination with B16-GM-CSF (GVAX) potentiates anti-B16 melanoma immune
response through activation of innate immune cells and enhancing presentation of tumor antigens to T
cells (253;268). Furthermore, addition of GM-CSF secreting tumor vaccine to CTLA-4 blockade results
in longer overall survival in patients with metastatic melanoma (250). We therefore utilized GVAX-
vaccinated C57BL/6 mice to evaluate the effects of aRANKL and aCTLA-4 antibodies (Figure 6A).
C57BL/6 polyclonal mice were administered aRANKL or isotype control antibody and challenged with 2
x 104 B16 melanoma cells. At days 3, 6, and 10 following melanoma inoculation, mice were treated with
aCTLA-4 antibody/GVAX or GVAX alone. As expected from prior reports (253), aCTLA-4
antibody/GVAX combination therapy was more effective than GVAX alone in prolonging host survival
(Figure 6B). Of note, combination therapy with aRANKL/aCTLA-4 antibody/GVAX significantly
improved host survival compared to isotype control/aCTLA-4 antibody/GVAX therapy or aRANKL
antibody/GVAX (Figure 6B). This suggests that, in the context of GVAX, aRANKL antibody and
aCTLA-4 antibody have additive effects in improving host survival in response to melanoma challenge.
To assess treatment effects on CD4+ T cells, we analyzed CD4+ TILs in GVAX treated mice.
Mice received either anti-RANKL or isotype control antibody, were inoculated with 105 B16 melanoma
cells, and then received either anti-CTLA-4/GVAX or isotype control/GVAX. The frequency of
Ki67+CD4+ T cells was significantly higher with aRANKL/aCTLA4/GVAX, compared to iso/aCTLA-
4/GVAX therapy (Figure 6C). Additionally, the frequency of KLRG1+ and Granzyme B+ CD4+ T cells
was increased in the aRANKL/aCTLA4/GVAX-treated compared to the control groups (Figure 6D).
These findings indicate that aRANKL and aCTLA4 antibodies cooperate to increase the frequency of
tumor-infiltrating CD4+ T cells expressing cytolytic markers.

85
Discussion
We report here that genetic Aire mutations in mice and protective Aire SNPs in humans are
associated with increased efficacy of aCTLA-4 antibody. Additionally, we report that pharmacologic
inhibition of Aire function with aRANKL antibody is sufficient to enhance the effects of CTLA-4
checkpoint inhibition. Findings in this paper suggest a model (Supp. Figure 6) in which Aire normally
purges self/melanoma antigen-reactive CD4+ T cells in the thymus, which limits the number of
self/melanoma antigen-reactive CD4+ T cells available for peripheral activation by checkpoint inhibition.
Genetic Aire deficiency or aRANKL antibody administration allows self/melanoma reactive T cells to
escape negative selection in the thymus, and the increased pool of self/melanoma-reactive T cells
available for targeting by aCTLA-4 antibody enhances the efficacy of CTLA-4 blockade in immune
rejection of melanoma.
In addition to aRANKL antibody, another therapeutic approach to increasing the pool of
self/melanoma-reactive T cells in the periphery is through adoptive cellular transfer of self/melanoma-
reactive T cells. Indeed, ex vivo expansion and reinfusion of T cells specific for self/melanoma antigens
have beneficial effect for some patients who fail conventional therapy (257;269). Of note, recent reports
have demonstrated increased efficacy of adoptive cellular transfer when combined with aCTLA-4
antibody (270;270). These findings provide additional supportive evidence that repopulating the periphery
with self/melanoma reactive T cells enhances the effects of CTLA-4 blockade. Anti-RANKL antibody
administration provides the advantage of being a relatively straightforward therapy when compared to
adoptive cellular transfer, so may be simpler to adapt to the clinical setting. Importantly, our data
demonstrate the effects of anti-RANKL antibody prior to B16 inoculation. The effect of anti-RANKL
antibody on already-established tumors will be the focus of future studies.
Anti-CTLA-4 antibody treatment has been reported to have pleiotropic effects on T cells, which
include intratumoral Treg depletion and promoting increased Teff:Treg ratios (252;256;271;272).
Interestingly, however, Aire deficiency and CTLA-4 blockade in combination did not result in

86
intratumoral Treg depletion in our studies. Instead, decreased melanoma growth with Aire deficiency and
CTLA-4 blockade was associated with increased intratumoral CD4+ T cell KLRG1 expression, and
cytolytic protein expression. These findings add to recent reports that CD4+ T cells have direct anti-tumor
effect, especially if clonally expanded (256;273), and that aCTLA-4 antibody treatment activates tumor-
reactive cytotoxic CD4+ T cells (274).
CTLA-4 blockade is associated with colitis and other immune related adverse events (236;262).
This finding is not surprising since genetic deficiency of CTLA-4 in mice results in lymphoproliferation
and multiple autoimmune manifestations (275;276). Colitis can be life threatening and is the most
common ipilimumab related toxicity in metastatic melanoma patients. Therefore, it is important to
consider whether potential treatment modalities to be used in combination with CTLA-4 blockade will
exacerbate colitis. We show in this study that lack of Aire function does not add to the severity of colitis
in anti-CTLA-4 antibody treated hosts. This result may seem unexpected since Aire has a well-known
role in preventing organ-specific autoimmune disease (277). Previous studies, however, have also
reported that Aire does not regulate colitogenic T cell development (265;266), possibly because
colitogenic T cells may be directed against non-self proteins such as colonic microbiota antigens. Thus,
combination of central tolerance blockade and checkpoint inhibition may improve therapeutic index,
compared to checkpoint inhibition alone.
Anti-RANKL antibody represents a pharmacologic means to block central tolerance and can
enhance the effects of checkpoint inhibitors in mice. In addition to its role in mTEC development,
RANKL has a well-recognized role in the development, function, and survival of osteoclasts (278). For
these effects, aRANKL antibody (denosumab) is FDA approved for treatment of osteoporosis in
postmenopausal women (279) and other bone-related diseases (267). There is therefore substantial
clinical experience with aRANKL antibody in patients, which should facilitate clinical testing to
repurpose aRANKL antibody as an immunotherapy for the treatment of metastatic melanoma. Because
the thymus involutes with age, whether thymus output can be manipulated in adults for therapeutic
87
purpose is an open question. The median age at diagnosis of melanoma is 59 years, when thymic function
is often assumed to be minimal. Multiple studies in mice and humans suggest that thymic function
remains active in adults. Thymic output has been reported to continue in aged mice (280) and thymic
function is measurable in adult humans up to age 76 (281). Our data that aRANKL antibody increases
thymic output of TRP-1 specific T cells in adult mice [Supp. Figure 5 and (249)] supports the possibility
that thymus function can be altered for therapeutic purpose in adults. Of note, a case report of a patient
with metastatic melanoma who was concomitantly treated with anti-RANKL and anti-CTLA-4 antibodies
also supports further study of this combination therapy (282).
Finally, checkpoint inhibitors have been shown to have a therapeutic effect in a number of
different cancers, including prostate and renal cancer (283). Thus, central tolerance blockade by aRANKL
as a strategy to enhance the efficacy of checkpoint inhibition may be relevant in multiple cancer settings.

88
Materials and Methods
Mice. C57BL/6 AireGW/+ mice (251) and C57BL/6 AireGW/+ TRP-1 TCR Tg RAG−/− mice
(245) were housed and bred in sterile, specific pathogen-free mouse facilities at the University of North
Carolina at Chapel Hill (UNC-CH) and University of California, San Francisco (USCF). C57BL/6 Aire
wild-type (WT) littermate controls were used in all experiments. Recombination activating gene
(RAG1)−/− mice were purchased from the Jackson Laboratory.
Antibodies and Flow cytometry. Anti-CD4 (clone RM4-5), anti-CD3 (clone 145-2c11), anti-
Ki67 (clone SolA15), anti-KLRG1 (clone 2F1), anti- Granzyme B (clone NGZB), anti-FOXP3 (clone
FJK-16s), and anti-CD25 (clone PC61.5) antibodies were purchased from eBioscience. Anti-CD8a (clone
5H10) antibody was purchased from Invitrogen. Intracellular staining for cytokines and FOXP3 were
performed as in (245). All samples were run on a Dako CyAn flow cytometer (Beckman-Coulter) and
analyzed using FlowJo (TreeStar).
Isolation of tumor-infiltrating lymphocytes. Tumor-infiltrating lymphocytes (TIL) were
isolated as previously described (245). Tumors were dissected and minced before incubation with
collagenase type I/IV and DNase I. Lymphocytes were then enriched on Percoll density gradient prior to
flow cytometric analysis.
B16 melanoma and antibody administration. B16-F10 is a TRP-1-expressing C57BL/6-
derived spontaneous melanoma cell line originally purchased from the American Tissue Culture
Condition. B16 melanoma cells were cultured as described in (284). Mice were injected subcutaneously
with 1×10⁵ B16 melanoma cells as in (245). Tumor measurements and survival were determined as
described in (249).
For immunotherapy experiments, anti-CTLA-4 monoclonal antibody (mAb; clone 9D9; 100
μg/mouse, BioXcell) or IgG isotype control antibody (clone MPC-11; 100 μg/mouse, BioXcell) were
injected intraperitoneally (i.p.) on days 3, 6 and 9 following B16 melanoma cell injection as described in

89
(52). For combination antibody administration experiments, anti-RANKL antibody (clone IKK22/5; 100
μg/mouse, BioXcell) or isotype control antibody (clone 2A3; 100 μg/mouse, BioXcell) was injected every
other day for a total of six doses. 19 days following treatment initiation, mice were subcutaneously
injected with 2x10⁴ B16-F10 melanoma cells for survival analysis and 1x10⁵ for immune-phenotyping.
On days 3, 6, and 10 following melanoma inoculations, anti-CTLA-4 antibody/GVAX therapy was
administered as described in (253).
Adoptive transfer of magnetically isolated (using Miltenyi Biotec beads) CD4+ and CD8+ T cells
from spleen of WT and AireGW/+ mice were performed in a 1:1 donor:recipient ratio into C57BL/6
RAG−/− recipients using retro-orbital intravenous (i.v.) route of injection. After 7 days, recipients were
injected subcutaneously with 1×10⁵ B16-F10 melanoma cells. Tumor growth, survival, and development
of vitiligo were monitored daily.
In vitro B16 cytotoxicity assay. Splenocytes from WT and AireGW/+ melanoma-bearing
C57BL/6 mice were purified using CD4 beads (Miltenyi Biotec) and cultured in vitro with 5 µg/ml TRP-
1 peptide at 37°C. Following overnight incubation, peptide-primed CD4+ and non-CD4+ T cells were
harvested and used for in vitro cytotoxicity assay with B16-F10 melanoma cells. To determine in vitro
killing of tumor targets, B16 cells were loaded with 0.5 mM Cell-Trace Violet and co-incubated for 12-14
hrs with peptide-primed CD4+ and non-CD4+ cells. Proliferation of Cell-Trace Violet B16 cells was
analyzed by flow cytometry and quantified using CountBright© Absolute counting beads (Thermo-Fisher
Scientific). 3, 4 Dichloroisocoumarin; a serine protease inhibitor (Enzo Life Sciences; 25 μM) was used
for pan-granzyme inhibition.
In vitro IL-2 ELISPOT assay. ELISPOT assays for IL-2 release (BD Biosciences) were
performed on splenic CD4+ CD25− effector T (Teff) cells from B16-F10 tumor-bearing C57BL/6 WT or
AireGW/+ mice. CD4+ CD25− Teff cells were enriched by magnetic beads (Miltenyi Biotec). 5×10⁵
cells were plated for 20-22 hours on 96-well plates, which had been pre-coated with anti-mouse purified
IL-2 antibody overnight. Cells were left unstimulated in media (negative control) or stimulated with

90
PMA-Ionomycin (positive control). Cells were incubated in separate wells with 5 µg/ml of TRP1
(NCGTCRPGWRGAACNQKILTVR) purchased from Genemed Synthesis Inc. and OVA
(ISQAVHAAHAEINEAGR) peptides purchased from InvivoGen. Culturing of the plates, washing, and
counterstaining were performed according to manufacturers’ instructions. Visualization and analysis of
the spots were performed on the ImmunoSpot counter (Cellular Technology Ltd). IL-2 response of
stimulated cultures was calculated by subtracting the number of spot-forming colonies in the negative
unstimulated control from the number of spot forming colonies in the wells stimulated by peptides/5×105
cells.
Single Nucleotide Polymorphism (SNP) Genotyping. Peripheral blood mononuclear cells
(PBMC) collected as part of the ECOG-ACRIN Cancer Research Group study E1608 (250) were kindly
provided by the ECOG-ACRIN Central Biorepository and Pathology Facility. Following DNA extraction
from PBMC, SNP genotyping assays (Applied Biosystems Taqman) were performed by the UNC-CH
Mammalian Genotyping Core for the following SNPs of the Aire gene: rs1800522/rs1133779, rs2075876,
rs56393821, rs1800520, and rs1055311. Genotyping for rs1055311 was confirmed by Sanger sequencing
using two primers flanking exon 6 of the Aire gene (Forward sequence: 5'-
GAATGCAGGCTGTGGGAACT-3’; Reverse sequence: 5’-AAGAGGGGCGTCAGCAATG-3’; product
size 441bp).
Experimental Colitis. CD4+ cells were enriched from WT and AireGW/+ female donor spleens
using the CD4+ T cell Isolation Kit II (Miltenyi Biotec) according to manufacturer instructions. Cells
were labeled and sorted for CD4+ CD25- CD45RBhi cells by fluorescence-activated cell sorting, as
previously described (285). 5×10⁵ cells were injected i.p. into 4-7 week old RAG-/- recipient mice. 3
days after transfer, recipient mice were injected i.p. with 100μg of isotype (clone MPC-11, BioXCell) or
anti-CTLA4 (clone 9D9, BioXCell) antibody at 3-day intervals. Weights were measured weekly from
initial cell transfer. Lack of survival was defined as death or weight loss >20%.

91
Colon Histopathology. Colons were harvested at 10 weeks after adoptive transfer or earlier if
weight loss of 20% was noted. Specimens were fixed in 10% formalin, sectioned (5 microns) and stained
with Hematoxylin and Eosin. Scoring for inflammation was performed as described (286;287).
Statistics. R, PRISM 5.0 (GraphPad Software, Inc.) and Microsoft Office Excel software (2013)
were used to analyze data. T-tests were used to compare differences between 2 groups. One-way ANOVA
and t-tests with p-values adjusted using Hommel’s correction for multiple comparisons (288) were used
to compare differences between more than 2 groups. Survival curves were compared by Mann-Whitney
U-test. P-values of <0.05 were considered significant.
Study approval. Study approval for human samples was obtained from the ECOG Laboratory
Science & Pathology, and Executive Review Committees. All animal studies were approved by the
Animal Care and Use Committees at UNC-CH and UCSF.
Author contributions
PB, MLZ, HHW, LKH, IK, MM, YH, DS performed the experiments and performed statistical analyses.
PB, MLZ and MAS wrote the paper and prepared figures. JS, SL and FZ performed statistical analyses.
ASG, JK, SM, LF, MSA helped design experiments and reviewed the final manuscript. MZ, MSA, MAS
formulated the concept.
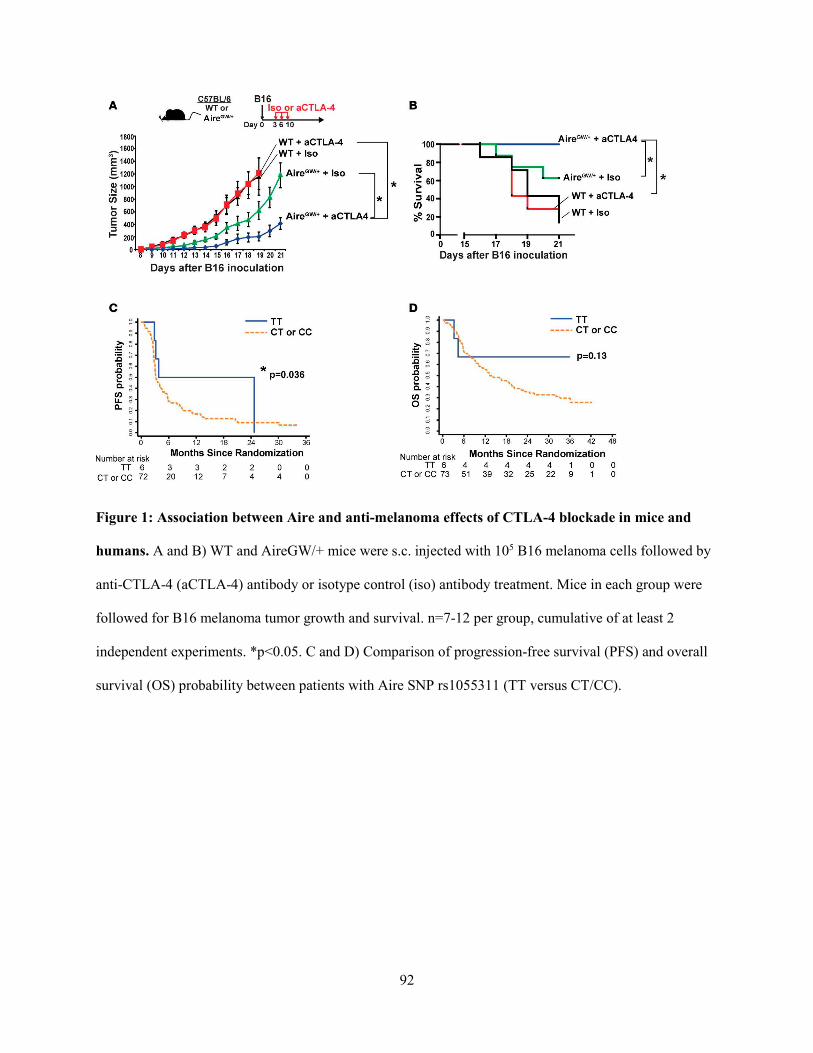
92
Figure 1: Association between Aire and anti-melanoma effects of CTLA-4 blockade in mice and
humans. A and B) WT and AireGW/+ mice were s.c. injected with 105 B16 melanoma cells followed by
anti-CTLA-4 (aCTLA-4) antibody or isotype control (iso) antibody treatment. Mice in each group were
followed for B16 melanoma tumor growth and survival. n=7-12 per group, cumulative of at least 2
independent experiments. *p<0.05. C and D) Comparison of progression-free survival (PFS) and overall
survival (OS) probability between patients with Aire SNP rs1055311 (TT versus CT/CC).

93
Figure 2: Aire deficiency increases CD4+ T cell cytolytic function to reduce melanoma growth.
CD4+ splenocytes were transferred from WT and AireGW/+ donors into RAG-/- recipients, followed by
subcutaneous B16 melanoma injection on Day 7. Recipients were followed for tumor growth and
survival. A and B) B16 melanoma tumor growth and survival was measured after B16 inoculation in
recipients; n=15 per group, *p<0.05. **p<0.01. C-E) Tumor-infiltrating lymphocytes (TIL) were
harvested on Day 19 following B16 melanoma inoculation in recipients of either WT or AireGW/+ CD4+
splenocytes. Absolute numbers of CD4+ tumor-infiltrating cells are shown in (C). ns=not significant.
Representative flow cytometry plots and average cumulative frequencies of Ki67+ (D), KLRG1+ and
Granzyme B+ (E), among CD4+ T cells. *p<0.05, **p<0.01. F) Representative flow cytometry histograms

94
and average absolute cell trace violet-labeled B16 cell numbers after co-incubation with WT and AireGW/+
CD4+ T cells. G) Average relative B16 cell numbers after co-incubation with CD4+ T cells from WT and
AireGW/+ mice along with pan-granzyme inhibitor (3, 4 Dichloroisocoumarin).

95
Figure 3: Additive effect of Aire deficiency and anti-CTLA-4 antibody on T cell responses. A-B)
Tumor-infiltrating lymphocytes (TIL) were harvested on Day 19 following B16 melanoma inoculation in
WT and AireGW/+ mice treated with aCTLA-4 or iso antibody. Representative flow cytometry plots and
average cumulative frequencies of Ki67+ (A), KLRG1+ and Granzyme B+ (B) among CD4+ T cells. n=9-
12 in each group, *p<0.05, 727 **p<0.01. C) ELISPOT with splenocytes harvested on Day 14 following

96
B16 melanoma inoculation in WT and AireGW/+ mice treated with anti-CTLA-4 antibody (aCTLA-4) or
isotype control antibody (iso). Cumulative spot forming cells (SFC)/5×105 cells secreting IL-2 with OVA
and TRP-1 was analyzed. Each data point represents an individual animal. *p<0.05, n.s=not significant.

97
Figure 4: Additive anti-melanoma effect of Aire deficiency and anti-CTLA-4 antibody in TRP-1
CD4+ TCR Tg mice. A and B) Aire sufficient (WT) and AireGW/+ TRP-1 TCR Tg mice were s.c. injected
with 105 B16 melanoma cells followed by anti-CTLA-4 antibody (aCTLA-4) or isotype control antibody
(Iso) treatment, as outlined. Mice in each group were followed for B16 melanoma tumor growth (A) and
survival (B). n=7-12 per group, cumulative of at least 2 independent experiments. *p<0.05. C) Examples
of periporbital and tail vitiligo in AireGW/+ mice treated with anti-CTLA-4 antibody.

98
Figure 5: Aire deficiency does not exacerbate the development of experimental autoimmune colitis
associated with anti-CTLA4 antibody treatment. A) Percent initial body weight of RAG-/- recipients
after transfer of WT or AireGW/+ CD4+ CD25- CD45RBhi splenocytes. After transfer, recipients were
treated with anti-CTLA-4 antibody (aCTLA4), untreated, or treated with isotype control antibody (iso).
Cumulative data from two independent experiments are shown. *p<0.05 comparing anti-CTLA-4
antibody treatment versus untreated/isotype control antibody treatment in recipients of WT cells. n.s.=not
significant. B) Representative Hematoxylin and Eosin stained sections of descending colons and C)
average histopathological scores of colons from recipients of CD4+ CD25- CD45RBhi splenocytes derived
from WT and AireGW/+ mice and administered aCTLA-4 or untreated/isotype control antibody (-). Gray
arrowheads = immune cell infiltration in lamina propria; black arrowheads = immune cell infiltration in
the submucosa. *p<0.05; n.s.=not significant.

99
Figure 6: Combination aRANKL and aCTLA-4 antibody administration enhances immune
rejection of melanoma. A) Schematic of treatment regimen, in which anti-RANKL (aRANKL) or
isotype control (iso) antibody was injected every other day for 11 days, followed by s.c. B16 melanoma
injection (2x10⁴ cells) on Day 18. GVAX with or without anti-CTLA-4 antibody was given on days 3, 6,
and 10 following melanoma injection. B) Survival curves in GVAX treated mice receiving indicated
combinations of therapy. n=10 for each group. *p<0.05. Tumor-infiltrating lymphocytes (TIL) were
harvested on Day 19 following 105 B16 melanoma cell inoculation. Representative flow cytometry plots

100
and average cumulative frequencies of Ki67+ (C), KLRG1+ and Granzyme B+ (D) among CD4+ T cells
was measured. n=9-12 in each group, *p<0.05, **p<0.01. ***p<0001.
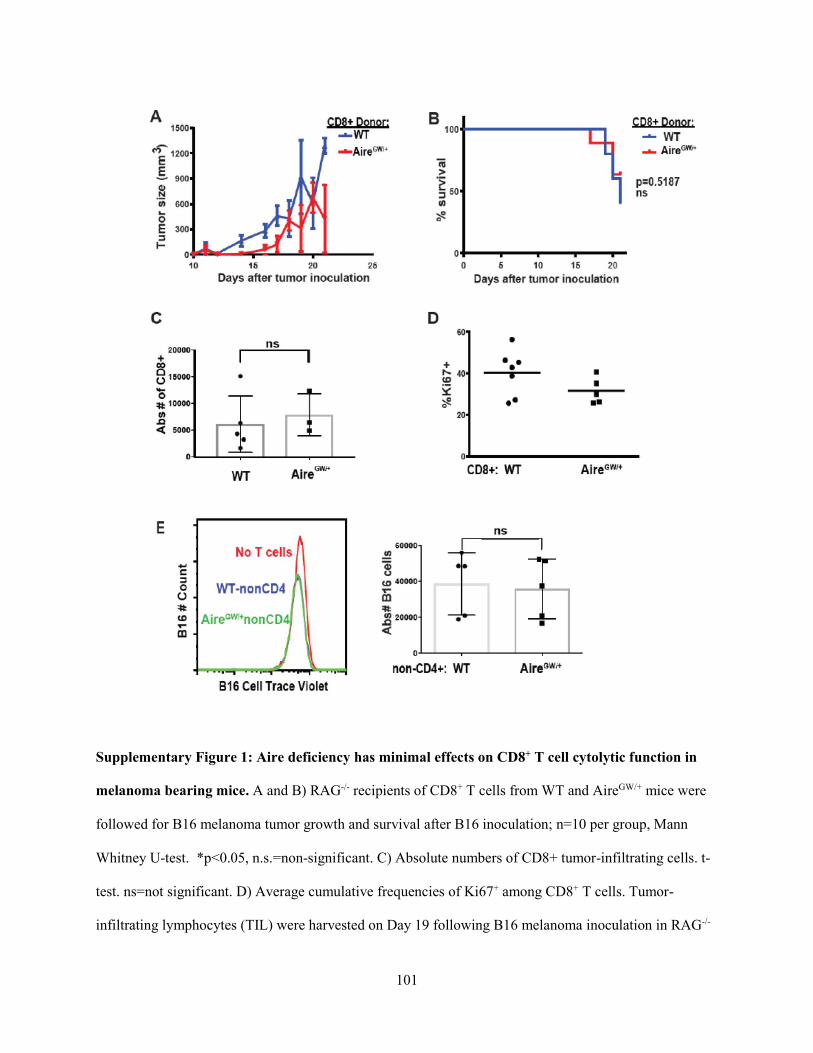
101
Supplementary Figure 1: Aire deficiency has minimal effects on CD8+ T cell cytolytic function in
melanoma bearing mice. A and B) RAG-/- recipients of CD8+ T cells from WT and AireGW/+ mice were
followed for B16 melanoma tumor growth and survival after B16 inoculation; n=10 per group, Mann
Whitney U-test. *p<0.05, n.s.=non-significant. C) Absolute numbers of CD8+ tumor-infiltrating cells. t-
test. ns=not significant. D) Average cumulative frequencies of Ki67+ among CD8+ T cells. Tumor-
infiltrating lymphocytes (TIL) were harvested on Day 19 following B16 melanoma inoculation in RAG-/-

102
recipients of CD8+ T cells from WT and AireGW/+ donor mice. t-test. ns=not significant. E) Representative
flow cytometry histogram comparison and average absolute B16 cell numbers of cell trace violet-labeled
B16 cells after co-incubation with non-CD4+ T cells from WT and AireGW/+ mice. t-test. ns=not
significant.

103
Supplementary Figure 2: Modest effect of Aire deficiency and anti-CTLA-4 antibody on CD8+ T
cell responses. Tumor-infiltrating lymphocytes (TIL) were harvested on Day 19 following B16
melanoma inoculation in WT and AireGW/+ mice treated with aCTLA-4 or iso antibody. Representative
flow cytometry plots and average cumulative frequencies of Ki67+, KLRG1+, and Granzyme B+ among

104
CD8+ T cells. n=9-12 in each group. One-way ANOVA with Tukey’s multiple comparisons test. ns=not
significant, *p<0.05.

105
Supplementary Figure 3: Anti-CTLA-4 antibody treatment in Aire deficient mice does not decrease
Treg population. Splenocytes and tumor-infiltrating lymphocytes (TIL) were harvested on Day 19
following B16 melanoma inoculation in WT and AireGW/+ mice treated with anti-CTLA-4 antibody
(aCTLA-4) or isotype control antibody (Iso). A) Representative flow cytometry plots of FOXP3 and
CD25 expression and (B) average cumulative frequencies of FOXP3+ Tregs within CD4+ splenocyte
population. C) Representative flow cytometry plots of FOXP3 and CD25 expression and (D) average
cumulative frequencies of FOXP3+ Tregs within CD4+ TIL population. E and F) Average cumulative
ratio of CD4+ Teffs : FOXP3+ Tregs (E) and CD8+ T cells : FOXP3+ Tregs (F). One-way ANOVA with
Tukey’s multiple comparisons test. *p<0.05, **p<0.01, n.s= not significant.

106
Supplementary Figure 4: anti-CTLA-4 antibody does not impair negative selection of TRP-1
specific CD4+ T cells. A) Representative flow cytometric plots of CD4+ and CD8+ thymocytes from
AireGW/+ or WT TRP-1 TCR Tg mice. WT TRP-1 TCR Tg were treated with either isotype control
antibody (iso) or anti-CTLA-4 antibody (aCTLA-4). B) Cumulative frequency (mean +/- SD) of CD4
single positive (SP) cells. One-way ANOVA with Tukey’s multiple comparisons test. *p<.05. n.s.=not
significant.

107
Supplementary Figure 5: anti-RANKL antibody impairs negative selection of TRP-1 specific CD4+
single positive T cells. Representative flow cytometric plots of CD4+ and CD8+ thymocytes from TRP-1
TCR Tg mice treated with isotype control antibody (iso) or anti-RANKL antibody (aRANKL). Mean +/-
SD shown. t-test. **p<.01.

108
Supplementary Figure 6: Model of mechanism underlying additive anti-melanoma effects of
combination central and peripheral tolerance blockade. A) In the thymus, Aire in mTECs promotes
self/melanoma antigen expression, which results in negative selection of self/melanoma-reactive CD4+ T
cells. As a result, the efficacy of checkpoint inhibition is limited by the scarcity of melanoma-reactive T
cells in the periphery. B) Aire deficiency or transient depletion of Aire-expressing mTECs with anti-
RANKL (aRANKL) antibody rescues self/melanoma antigen-reactive effector CD4+ T cells from

109
negative selection. This expansion of the melanoma-reactive T cell pool available for activation by
checkpoint inhibitors enhances anti-melanoma immunity.

110
REFERENCES
(1) Elert E. Calling cells to arms. Nature 2013; 504(7480):S2-S3.
(2) Underwood JC. Lymphoreticular infiltration in human tumours: prognostic and biological
implications: a review. Br J Cancer 1974; 30(6):538-548.
(3) Ioachim HL. The stromal reaction of tumors: an expression of immune surveillance. J Natl Cancer
Inst 1976; 57(3):465-475.
(4) Rowe DJ, Beverley PC. Characterisation of breast cancer infiltrates using monoclonal antibodies
to human leucocyte antigens. Br J Cancer 1984; 49(2):149-159.
(5) Whiteside TL, Miescher S, Hurlimann J, Moretta L, von F, V. Clonal analysis and in situ
characterization of lymphocytes infiltrating human breast carcinomas. Cancer Immunol
Immunother 1986; 23(3):169-178.
(6) van Duinen SG, Ruiter DJ, Broecker EB, van der Velde EA, Sorg C, Welvaart K et al. Level of
HLA antigens in locoregional metastases and clinical course of the disease in patients with
melanoma. Cancer Res 1988; 48(4):1019-1025.
(7) Lopez Nevot MA, Garcia E, Pareja E, Bonal FJ, Martin J, Ruiz-Cabello F et al. Differential
expression of HLA class I and II antigens in primary and metastatic melanomas. J Immunogenet
1986; 13(2-3):219-227.
(8) Bukowski RM, Sharfman W, Murthy S, Rayman P, Tubbs R, Alexander J et al. Clinical results and
characterization of tumor-infiltrating lymphocytes with or without recombinant interleukin 2 in
human metastatic renal cell carcinoma. Cancer Res 1991; 51(16):4199-4205.
(9) Sato E, Olson SH, Ahn J, Bundy B, Nishikawa H, Qian F et al. Intraepithelial CD8+ tumor-
infiltrating lymphocytes and a high CD8+/regulatory T cell ratio are associated with favorable
prognosis in ovarian cancer. Proc Natl Acad Sci U S A 2005; 102(51):18538-18543.
(10) Galon J, Costes A, Sanchez-Cabo F, Kirilovsky A, Mlecnik B, Lagorce-Pages C et al. Type,
density, and location of immune cells within human colorectal tumors predict clinical outcome.
Science 2006; 313(5795):1960-1964.
(11) Loi S. Tumor-infiltrating lymphocytes, breast cancer subtypes and therapeutic efficacy.
Oncoimmunology 2013; 2(7):e24720.
(12) Aebersold P, Hyatt C, Johnson S, Hines K, Korcak L, Sanders M et al. Lysis of autologous
melanoma cells by tumor-infiltrating lymphocytes: association with clinical response. J Natl
Cancer Inst 1991; 83(13):932-937.
(13) Rosenberg SA, Packard BS, Aebersold PM, Solomon D, Topalian SL, Toy ST et al. Use of tumor-
infiltrating lymphocytes and interleukin-2 in the immunotherapy of patients with metastatic
melanoma. A preliminary report. N Engl J Med 1988; 319(25):1676-1680.
(14) Kradin RL, Kurnick JT, Lazarus DS, Preffer FI, Dubinett SM, Pinto CE et al. Tumour-infiltrating
lymphocytes and interleukin-2 in treatment of advanced cancer. Lancet 1989; 1(8638):577-580.
111
(15) Pockaj BA, Sherry RM, Wei JP, Yannelli JR, Carter CS, Leitman SF et al. Localization of
111indium-labeled tumor infiltrating lymphocytes to tumor in patients receiving adoptive
immunotherapy. Augmentation with cyclophosphamide and correlation with response. Cancer
1994; 73(6):1731-1737.
(16) Dudley ME, Wunderlich JR, Yang JC, Sherry RM, Topalian SL, Restifo NP et al. Adoptive cell
transfer therapy following non-myeloablative but lymphodepleting chemotherapy for the treatment
of patients with refractory metastatic melanoma. J Clin Oncol 2005; 23(10):2346-2357.
(17) Rosenberg SA, Yang JC, Sherry RM, Kammula US, Hughes MS, Phan GQ et al. Durable complete
responses in heavily pretreated patients with metastatic melanoma using T-cell transfer
immunotherapy. Clin Cancer Res 2011; 17(13):4550-4557.
(18) Besser MJ, Shapira-Frommer R, Treves AJ, Zippel D, Itzhaki O, Hershkovitz L et al. Clinical
responses in a phase II study using adoptive transfer of short-term cultured tumor infiltration
lymphocytes in metastatic melanoma patients. Clin Cancer Res 2010; 16(9):2646-2655.
(19) Figlin RA, Pierce WC, Kaboo R, Tso CL, Moldawer N, Gitlitz B et al. Treatment of metastatic
renal cell carcinoma with nephrectomy, interleukin-2 and cytokine-primed or CD8(+) selected
tumor infiltrating lymphocytes from primary tumor. J Urol 1997; 158(3 Pt 1):740-745.
(20) Ratto GB, Zino P, Mirabelli S, Minuti P, Aquilina R, Fantino G et al. A randomized trial of adoptive
immunotherapy with tumor-infiltrating lymphocytes and interleukin-2 versus standard therapy in
the postoperative treatment of resected nonsmall cell lung carcinoma. Cancer 1996; 78(2):244-251.
(21) Fujita K, Ikarashi H, Takakuwa K, Kodama S, Tokunaga A, Takahashi T et al. Prolonged disease-
free period in patients with advanced epithelial ovarian cancer after adoptive transfer of tumor-
infiltrating lymphocytes. Clin Cancer Res 1995; 1(5):501-507.
(22) Johnson LA, June CH. Driving gene-engineered T cell immunotherapy of cancer. Cell Res 2017;
27(1):38-58.
(23) Muul LM, Director EP, Hyatt CL, Rosenberg SA. Large scale production of human lymphokine
activated killer cells for use in adoptive immunotherapy. J Immunol Methods 1986; 88(2):265-275.
(24) Topalian SL, Muul LM, Solomon D, Rosenberg SA. Expansion of human tumor infiltrating
lymphocytes for use in immunotherapy trials. J Immunol Methods 1987; 102(1):127-141.
(25) Shimizu Y, Iwatsuki S, Herberman RB, Whiteside TL. Effects of cytokines on in vitro growth of
tumor-infiltrating lymphocytes obtained from human primary and metastatic liver tumors. Cancer
Immunol Immunother 1991; 32(5):280-288.
(26) Figlin RA, Thompson JA, Bukowski RM, Vogelzang NJ, Novick AC, Lange P et al. Multicenter,
randomized, phase III trial of CD8(+) tumor-infiltrating lymphocytes in combination with
recombinant interleukin-2 in metastatic renal cell carcinoma. J Clin Oncol 1999; 17(8):2521-2529.
(27) Dreno B, Nguyen JM, Khammari A, Pandolfino MC, Tessier MH, Bercegeay S et al. Randomized
trial of adoptive transfer of melanoma tumor-infiltrating lymphocytes as adjuvant therapy for stage
III melanoma. Cancer Immunol Immunother 2002; 51(10):539-546.

112
(28) Sensi M, Traversari C, Radrizzani M, Salvi S, Maccalli C, Mortarini R et al. Cytotoxic T-
lymphocyte clones from different patients display limited T-cell-receptor variable-region gene
usage in HLA-A2-restricted recognition of the melanoma antigen Melan-A/MART-1. Proc Natl
Acad Sci U S A 1995; 92(12):5674-5678.
(29) Salvi S, Segalla F, Rao S, Arienti F, Sartori M, Bratina G et al. Overexpression of the T-cell receptor
beta-chain variable region TCRBV14 in HLA-A2-matched primary human melanomas. Cancer
Res 1995; 55(15):3374-3379.
(30) Morgan RA, Dudley ME, Wunderlich JR, Hughes MS, Yang JC, Sherry RM et al. Cancer
regression in patients after transfer of genetically engineered lymphocytes. Science 2006;
314(5796):126-129.
(31) Chodon T, Comin-Anduix B, Chmielowski B, Koya RC, Wu Z, Auerbach M et al. Adoptive
transfer of MART-1 T-cell receptor transgenic lymphocytes and dendritic cell vaccination in
patients with metastatic melanoma. Clin Cancer Res 2014; 20(9):2457-2465.
(32) Johnson LA, Morgan RA, Dudley ME, Cassard L, Yang JC, Hughes MS et al. Gene therapy with
human and mouse T-cell receptors mediates cancer regression and targets normal tissues expressing
cognate antigen. Blood 2009; 114(3):535-546.
(33) Robbins PF, Morgan RA, Feldman SA, Yang JC, Sherry RM, Dudley ME et al. Tumor regression
in patients with metastatic synovial cell sarcoma and melanoma using genetically engineered
lymphocytes reactive with NY-ESO-1. J Clin Oncol 2011; 29(7):917-924.
(34) Rapoport AP, Stadtmauer EA, Binder-Scholl GK, Goloubeva O, Vogl DT, Lacey SF et al. NY-
ESO-1-specific TCR-engineered T cells mediate sustained antigen-specific antitumor effects in
myeloma. Nat Med 2015; 21(8):914-921.
(35) Robbins PF, Kassim SH, Tran TL, Crystal JS, Morgan RA, Feldman SA et al. A pilot trial using
lymphocytes genetically engineered with an NY-ESO-1-reactive T-cell receptor: long-term follow-
up and correlates with response. Clin Cancer Res 2015; 21(5):1019-1027.
(36) Parkhurst MR, Yang JC, Langan RC, Dudley ME, Nathan DA, Feldman SA et al. T cells targeting
carcinoembryonic antigen can mediate regression of metastatic colorectal cancer but induce severe
transient colitis. Mol Ther 2011; 19(3):620-626.
(37) Morgan RA, Chinnasamy N, Abate-Daga D, Gros A, Robbins PF, Zheng Z et al. Cancer regression
and neurological toxicity following anti-MAGE-A3 TCR gene therapy. J Immunother 2013;
36(2):133-151.
(38) Linette GP, Stadtmauer EA, Maus MV, Rapoport AP, Levine BL, Emery L et al. Cardiovascular
toxicity and titin cross-reactivity of affinity-enhanced T cells in myeloma and melanoma. Blood
2013; 122(6):863-871.
(39) Kageyama S, Ikeda H, Miyahara Y, Imai N, Ishihara M, Saito K et al. Adoptive Transfer of MAGE-
A4 T-cell Receptor Gene-Transduced Lymphocytes in Patients with Recurrent Esophageal Cancer.
Clin Cancer Res 2015; 21(10):2268-2277.

113
(40) Clay TM, Custer MC, Sachs J, Hwu P, Rosenberg SA, Nishimura MI. Efficient transfer of a tumor
antigen-reactive TCR to human peripheral blood lymphocytes confers anti-tumor reactivity. J
Immunol 1999; 163(1):507-513.
(41) Aleksic M, Liddy N, Molloy PE, Pumphrey N, Vuidepot A, Chang KM et al. Different affinity
windows for virus and cancer-specific T-cell receptors: implications for therapeutic strategies. Eur
J Immunol 2012; 42(12):3174-3179.
(42) Bendle GM, Linnemann C, Hooijkaas AI, Bies L, de Witte MA, Jorritsma A et al. Lethal graft-
versus-host disease in mouse models of T cell receptor gene therapy. Nat Med 2010; 16(5):565-70,
1p.
(43) van Loenen MM, de BR, Amir AL, Hagedoorn RS, Volbeda GL, Willemze R et al. Mixed T cell
receptor dimers harbor potentially harmful neoreactivity. Proc Natl Acad Sci U S A 2010;
107(24):10972-10977.
(44) Hicklin DJ, Marincola FM, Ferrone S. HLA class I antigen downregulation in human cancers: T-
cell immunotherapy revives an old story. Mol Med Today 1999; 5(4):178-186.
(45) Gross G, Waks T, Eshhar Z. Expression of immunoglobulin-T-cell receptor chimeric molecules as
functional receptors with antibody-type specificity. Proc Natl Acad Sci U S A 1989; 86(24):10024-
10028.
(46) Harris DT, Kranz DM. Adoptive T Cell Therapies: A Comparison of T Cell Receptors and
Chimeric Antigen Receptors. Trends Pharmacol Sci 2016; 37(3):220-230.
(47) Eshhar Z, Waks T, Gross G, Schindler DG. Specific activation and targeting of cytotoxic
lymphocytes through chimeric single chains consisting of antibody-binding domains and the
gamma or zeta subunits of the immunoglobulin and T-cell receptors. Proc Natl Acad Sci U S A
1993; 90(2):720-724.
(48) Hwu P, Shafer GE, Treisman J, Schindler DG, Gross G, Cowherd R et al. Lysis of ovarian cancer
cells by human lymphocytes redirected with a chimeric gene composed of an antibody variable
region and the Fc receptor gamma chain. J Exp Med 1993; 178(1):361-366.
(49) Stancovski I, Schindler DG, Waks T, Yarden Y, Sela M, Eshhar Z. Targeting of T lymphocytes to
Neu/HER2-expressing cells using chimeric single chain Fv receptors. J Immunol 1993;
151(11):6577-6582.
(50) Gross G, Levy S, Levy R, Waks T, Eshhar Z. Chimaeric T-cell receptors specific to a B-lymphoma
idiotype: a model for tumour immunotherapy. Biochem Soc Trans 1995; 23(4):1079-1082.
(51) Brocker T, Karjalainen K. Signals through T cell receptor-zeta chain alone are insufficient to prime
resting T lymphocytes. J Exp Med 1995; 181(5):1653-1659.
(52) Finney HM, Lawson AD, Bebbington CR, Weir AN. Chimeric receptors providing both primary
and costimulatory signaling in T cells from a single gene product. J Immunol 1998; 161(6):2791-
2797.
(53) Guedan S, Chen X, Madar A, Carpenito C, McGettigan SE, Frigault MJ et al. ICOS-based chimeric
antigen receptors program bipolar TH17/TH1 cells. Blood 2014; 124(7):1070-1080.

114
(54) Finney HM, Akbar AN, Lawson AD. Activation of resting human primary T cells with chimeric
receptors: costimulation from CD28, inducible costimulator, CD134, and CD137 in series with
signals from the TCR zeta chain. J Immunol 2004; 172(1):104-113.
(55) Milone MC, Fish JD, Carpenito C, Carroll RG, Binder GK, Teachey D et al. Chimeric receptors
containing CD137 signal transduction domains mediate enhanced survival of T cells and increased
antileukemic efficacy in vivo. Mol Ther 2009; 17(8):1453-1464.
(56) Di Stasi A., De AB, Rooney CM, Zhang L, Mahendravada A, Foster AE et al. T lymphocytes
coexpressing CCR4 and a chimeric antigen receptor targeting CD30 have improved homing and
antitumor activity in a Hodgkin tumor model. Blood 2009; 113(25):6392-6402.
(57) Wang Z, Guo Y, Han W. Current status and perspectives of chimeric antigen receptor modified T
cells for cancer treatment. Protein Cell 2017.
(58) Hudecek M, Sommermeyer D, Kosasih PL, Silva-Benedict A, Liu L, Rader C et al. The
nonsignaling extracellular spacer domain of chimeric antigen receptors is decisive for in vivo
antitumor activity. Cancer Immunol Res 2015; 3(2):125-135.
(59) Maher J, Brentjens RJ, Gunset G, Riviere I, Sadelain M. Human T-lymphocyte cytotoxicity and
proliferation directed by a single chimeric TCRzeta /CD28 receptor. Nat Biotechnol 2002;
20(1):70-75.
(60) Haynes NM, Trapani JA, Teng MW, Jackson JT, Cerruti L, Jane SM et al. Rejection of syngeneic
colon carcinoma by CTLs expressing single-chain antibody receptors codelivering CD28
costimulation. J Immunol 2002; 169(10):5780-5786.
(61) Imai C, Mihara K, Andreansky M, Nicholson IC, Pui CH, Geiger TL et al. Chimeric receptors with
4-1BB signaling capacity provoke potent cytotoxicity against acute lymphoblastic leukemia.
Leukemia 2004; 18(4):676-684.
(62) Kowolik CM, Topp MS, Gonzalez S, Pfeiffer T, Olivares S, Gonzalez N et al. CD28 costimulation
provided through a CD19-specific chimeric antigen receptor enhances in vivo persistence and
antitumor efficacy of adoptively transferred T cells. Cancer Res 2006; 66(22):10995-11004.
(63) Savoldo B, Ramos CA, Liu E, Mims MP, Keating MJ, Carrum G et al. CD28 costimulation
improves expansion and persistence of chimeric antigen receptor-modified T cells in lymphoma
patients. J Clin Invest 2011; 121(5):1822-1826.
(64) Pule MA, Straathof KC, Dotti G, Heslop HE, Rooney CM, Brenner MK. A chimeric T cell antigen
receptor that augments cytokine release and supports clonal expansion of primary human T cells.
Mol Ther 2005; 12(5):933-941.
(65) Zhong XS, Matsushita M, Plotkin J, Riviere I, Sadelain M. Chimeric antigen receptors combining
4-1BB and CD28 signaling domains augment PI3kinase/AKT/Bcl-XL activation and CD8+ T cell-
mediated tumor eradication. Mol Ther 2010; 18(2):413-420.
(66) Carpenito C, Milone MC, Hassan R, Simonet JC, Lakhal M, Suhoski MM et al. Control of large,
established tumor xenografts with genetically retargeted human T cells containing CD28 and
CD137 domains. Proc Natl Acad Sci U S A 2009; 106(9):3360-3365.
115
(67) Till BG, Jensen MC, Wang J, Qian X, Gopal AK, Maloney DG et al. CD20-specific adoptive
immunotherapy for lymphoma using a chimeric antigen receptor with both CD28 and 4-1BB
domains: pilot clinical trial results. Blood 2012; 119(17):3940-3950.
(68) Park JR, Digiusto DL, Slovak M, Wright C, Naranjo A, Wagner J et al. Adoptive transfer of
chimeric antigen receptor re-directed cytolytic T lymphocyte clones in patients with
neuroblastoma. Mol Ther 2007; 15(4):825-833.
(69) Lamers CH, Sleijfer S, Vulto AG, Kruit WH, Kliffen M, Debets R et al. Treatment of metastatic
renal cell carcinoma with autologous T-lymphocytes genetically retargeted against carbonic
anhydrase IX: first clinical experience. J Clin Oncol 2006; 24(13):e20-e22.
(70) Kershaw MH, Westwood JA, Parker LL, Wang G, Eshhar Z, Mavroukakis SA et al. A phase I
study on adoptive immunotherapy using gene-modified T cells for ovarian cancer. Clin Cancer Res
2006; 12(20 Pt 1):6106-6115.
(71) Morgan RA, Johnson LA, Davis JL, Zheng Z, Woolard KD, Reap EA et al. Recognition of glioma
stem cells by genetically modified T cells targeting EGFRvIII and development of adoptive cell
therapy for glioma. Hum Gene Ther 2012; 23(10):1043-1053.
(72) Johnson LA, Scholler J, Ohkuri T, Kosaka A, Patel PR, McGettigan SE et al. Rational development
and characterization of humanized anti-EGFR variant III chimeric antigen receptor T cells for
glioblastoma. Sci Transl Med 2015; 7(275):275ra22.
(73) Brown CE, Alizadeh D, Starr R, Weng L, Wagner JR, Naranjo A et al. Regression of Glioblastoma
after Chimeric Antigen Receptor T-Cell Therapy. N Engl J Med 2016; 375(26):2561-2569.
(74) You F, Jiang L, Zhang B, Lu Q, Zhou Q, Liao X et al. Phase 1 clinical trial demonstrated that
MUC1 positive metastatic seminal vesicle cancer can be effectively eradicated by modified Anti-
MUC1 chimeric antigen receptor transduced T cells. Sci China Life Sci 2016; 59(4):386-397.
(75) Kakarla S, Chow KK, Mata M, Shaffer DR, Song XT, Wu MF et al. Antitumor effects of chimeric
receptor engineered human T cells directed to tumor stroma. Mol Ther 2013; 21(8):1611-1620.
(76) Chinnasamy D, Yu Z, Theoret MR, Zhao Y, Shrimali RK, Morgan RA et al. Gene therapy using
genetically modified lymphocytes targeting VEGFR-2 inhibits the growth of vascularized syngenic
tumors in mice. J Clin Invest 2010; 120(11):3953-3968.
(77) Ahmed N, Brawley VS, Hegde M, Robertson C, Ghazi A, Gerken C et al. Human Epidermal
Growth Factor Receptor 2 (HER2) -Specific Chimeric Antigen Receptor-Modified T Cells for the
Immunotherapy of HER2-Positive Sarcoma. J Clin Oncol 2015; 33(15):1688-1696.
(78) Louis CU, Savoldo B, Dotti G, Pule M, Yvon E, Myers GD et al. Antitumor activity and long-term
fate of chimeric antigen receptor-positive T cells in patients with neuroblastoma. Blood 2011;
118(23):6050-6056.
(79) Feng K, Guo Y, Dai H, Wang Y, Li X, Jia H et al. Chimeric antigen receptor-modified T cells for
the immunotherapy of patients with EGFR-expressing advanced relapsed/refractory non-small cell
lung cancer. Sci China Life Sci 2016; 59(5):468-479.

116
(80) Stein H, Mason DY, Gerdes J, O'Connor N, Wainscoat J, Pallesen G et al. The expression of the
Hodgkin's disease associated antigen Ki-1 in reactive and neoplastic lymphoid tissue: evidence that
Reed-Sternberg cells and histiocytic malignancies are derived from activated lymphoid cells. Blood
1985; 66(4):848-858.
(81) Durkop H, Latza U, Hummel M, Eitelbach F, Seed B, Stein H. Molecular cloning and expression
of a new member of the nerve growth factor receptor family that is characteristic for Hodgkin's
disease. Cell 1992; 68(3):421-427.
(82) Schwab U, Stein H, Gerdes J, Lemke H, Kirchner H, Schaadt M et al. Production of a monoclonal
antibody specific for Hodgkin and Sternberg-Reed cells of Hodgkin's disease and a subset of
normal lymphoid cells. Nature 1982; 299(5878):65-67.
(83) Falini B, Pileri S, Pizzolo G, Durkop H, Flenghi L, Stirpe F et al. CD30 (Ki-1) molecule: a new
cytokine receptor of the tumor necrosis factor receptor superfamily as a tool for diagnosis and
immunotherapy. Blood 1995; 85(1):1-14.
(84) Pierce JM, Mehta A. Diagnostic, prognostic and therapeutic role of CD30 in lymphoma. Expert
Rev Hematol 2017; 10(1):29-37.
(85) Hombach A, Heuser C, Sircar R, Tillmann T, Diehl V, Pohl C et al. An anti-CD30 chimeric receptor
that mediates CD3-zeta-independent T-cell activation against Hodgkin's lymphoma cells in the
presence of soluble CD30. Cancer Res 1998; 58(6):1116-1119.
(86) Aizawa S, Nakano H, Ishida T, Horie R, Nagai M, Ito K et al. Tumor necrosis factor receptor-
associated factor (TRAF) 5 and TRAF2 are involved in CD30-mediated NFkappaB activation. J
Biol Chem 1997; 272(4):2042-2045.
(87) Herszfeld D, Wolvetang E, Langton-Bunker E, Chung TL, Filpczyk AA, Houssami S et al. CD30
is a survival factor and a biomarker for transformed human pluripotent stem cells. Nat Biotechnol
2006; 24(3):351-357.
(88) Falini B, Flenghi L, Fedeli L, Broe MK, Bonino C, Stein H et al. In vivo targeting of Hodgkin and
Reed-Sternberg cells of Hodgkin's disease with monoclonal antibody Ber-H2 (CD30):
immunohistological evidence. Br J Haematol 1992; 82(1):38-45.
(89) Falini B, Bolognesi A, Flenghi L, Tazzari PL, Broe MK, Stein H et al. Response of refractory
Hodgkin's disease to monoclonal anti-CD30 immunotoxin. Lancet 1992; 339(8803):1195-1196.
(90) Tazzari PL, Bolognesi A, de TD, Falini B, Lemoli RM, Soria MR et al. Ber-H2 (anti-CD30)-saporin
immunotoxin: a new tool for the treatment of Hodgkin's disease and CD30+ lymphoma: in vitro
evaluation. Br J Haematol 1992; 81(2):203-211.
(91) Ansell SM, Horwitz SM, Engert A, Khan KD, Lin T, Strair R et al. Phase I/II study of an anti-
CD30 monoclonal antibody (MDX-060) in Hodgkin's lymphoma and anaplastic large-cell
lymphoma. J Clin Oncol 2007; 25(19):2764-2769.
(92) Francisco JA, Cerveny CG, Meyer DL, Mixan BJ, Klussman K, Chace DF et al. cAC10-vcMMAE,
an anti-CD30-monomethyl auristatin E conjugate with potent and selective antitumor activity.
Blood 2003; 102(4):1458-1465.

117
(93) Younes A, Bartlett NL, Leonard JP, Kennedy DA, Lynch CM, Sievers EL et al. Brentuximab
vedotin (SGN-35) for relapsed CD30-positive lymphomas. N Engl J Med 2010; 363(19):1812-
1821.
(94) Fanale MA, Forero-Torres A, Rosenblatt JD, Advani RH, Franklin AR, Kennedy DA et al. A phase
I weekly dosing study of brentuximab vedotin in patients with relapsed/refractory CD30-positive
hematologic malignancies. Clin Cancer Res 2012; 18(1):248-255.
(95) Gopal AK, Chen R, Smith SE, Ansell SM, Rosenblatt JD, Savage KJ et al. Durable remissions in
a pivotal phase 2 study of brentuximab vedotin in relapsed or refractory Hodgkin lymphoma. Blood
2015; 125(8):1236-1243.
(96) Hombach A, Heuser C, Sircar R, Tillmann T, Diehl V, Pohl C et al. Characterization of a chimeric
T-cell receptor with specificity for the Hodgkin's lymphoma-associated CD30 antigen. J
Immunother 1999; 22(6):473-480.
(97) Savoldo B, Rooney CM, Di SA, Abken H, Hombach A, Foster AE et al. Epstein Barr virus specific
cytotoxic T lymphocytes expressing the anti-CD30zeta artificial chimeric T-cell receptor for
immunotherapy of Hodgkin disease. Blood 2007; 110(7):2620-2630.
(98) Ramos CA, Ballard B, Zhang H, Dakhova O, Gee AP, Mei Z et al. Clinical and immunological
responses after CD30-specific chimeric antigen receptor-redirected lymphocytes. J Clin Invest
2017; 127(9):3462-3471.
(99) Wang CM, Wu ZQ, Wang Y, Guo YL, Dai HR, Wang XH et al. Autologous T Cells Expressing
CD30 Chimeric Antigen Receptors for Relapsed or Refractory Hodgkin Lymphoma: An Open-
Label Phase I Trial. Clin Cancer Res 2017; 23(5):1156-1166.
(100) Oosterhuis JW, Looijenga LH. Testicular germ-cell tumours in a broader perspective. Nat Rev
Cancer 2005; 5(3):210-222.
(101) Diez-Torre A, Silvan U, Diaz-Nunez M, Arechaga J. The role of microenvironment in testicular
germ cell tumors. Cancer Biol Ther 2010; 10(6):529-536.
(102) Jacobsen GK, Barlebo H, Olsen J, Schultz HP, Starklint H, Sogaard H et al. Testicular Germ Cell
l Tumours in Denmark 1976–1980 Pathology of 1058 Consecutive Cases. Acta Radiologica:
Oncology 1984; 23(4):239-247.
(103) Gilbert DC, Al-Saadi R, Thway K, Chandler I, Berney D, Gabe R et al. Defining a New Prognostic
Index for Stage I Nonseminomatous Germ Cell Tumors Using CXCL12 Expression and Proportion
of Embryonal Carcinoma. Clin Cancer Res 2016; 22(5):1265-1273.
(104) Chovanec M, Hanna N, Cary KC, Einhorn L, Albany C. Management of stage I testicular germ cell
tumours. Nat Rev Urol 2016; 13(11):663-673.
(105) Abouassaly R, Fossa SD, Giwercman A, Kollmannsberger C, Motzer RJ, Schmoll HJ et al.
Sequelae of treatment in long-term survivors of testis cancer. Eur Urol 2011; 60(3):516-526.
(106) Carver BS, Motzer RJ, Kondagunta GV, Sogani PG, Sheinfeld J. Late relapse of testicular germ
cell tumors. Urol Oncol 2005; 23(6):441-445.

118
(107) Pallesen G, Hamilton-Dutoit SJ. Ki-1 (CD30) antigen is regularly expressed by tumor cells of
embryonal carcinoma. Am J Pathol 1988; 133(3):446-450.
(108) Giannatempo P, Paolini B, Miceli R, Raggi D, Nicolai N, Fare E et al. Persistent CD30 expression
by embryonal carcinoma in the treatment time course: prognostic significance of a worthwhile
target for personalized treatment. J Urol 2013; 190(5):1919-1924.
(109) Albany C, Feldman DR, Garbo LE, Einhorn LH. Antitumor activity of brentuximab vedotin in
CD30 positive refractory germ cell tumors. J.Clin.Oncol. 31[suppl. 6], 327. 2013.
Ref Type: Abstract
(110) Necchi A, Anichini A, Raggi D, Giannatempo P, Magazzu D, Nicolai N et al. Brentuximab Vedotin
in CD30-Expressing Germ Cell Tumors After Chemotherapy Failure. Clin Genitourin Cancer
2016; 14(4):261-264.
(111) Dotti G, Gottschalk S, Savoldo B, Brenner MK. Design and development of therapies using
chimeric antigen receptor-expressing T cells. Immunol Rev 2014; 257(1):107-126.
(112) Fesnak AD, June CH, Levine BL. Engineered T cells: the promise and challenges of cancer
immunotherapy. Nat Rev Cancer 2016; 16(9):566-581.
(113) Sadelain M, Brentjens R, Riviere I. The basic principles of chimeric antigen receptor design.
Cancer Discov 2013; 3(4):388-398.
(114) Hombach AA, Gorgens A, Chmielewski M, Murke F, Kimpel J, Giebel B et al. Superior
Therapeutic Index in Lymphoma Therapy: CD30(+) CD34(+) Hematopoietic Stem Cells Resist a
Chimeric Antigen Receptor T-cell Attack. Mol Ther 2016; 24(8):1423-1434.
(115) Dotti G, Savoldo B, Pule M, Straathof KC, Biagi E, Yvon E et al. Human cytotoxic T lymphocytes
with reduced sensitivity to Fas-induced apoptosis. Blood 2005; 105(12):4677-4684.
(116) Xu Y, Zhang M, Ramos CA, Durett A, Liu E, Dakhova O et al. Closely related T-memory stem
cells correlate with in vivo expansion of CAR.CD19-T cells and are preserved by IL-7 and IL-15.
Blood 2014; 123(24):3750-3759.
(117) Douglas ML, Boucaut KJ, Antalis TM, Higgins C, Pera MF, Stuttgen MA et al. An orthotopic
xenograft model of human nonseminomatous germ cell tumour. British Journal of Cancer 2001;
85:608-611.
(118) Caruana I, Savoldo B, Hoyos V, Weber G, Liu H, Kim ES et al. Heparanase promotes tumor
infiltration and antitumor activity of CAR-redirected T lymphocytes. Nat Med 2015; 21(5):524-
529.
(119) Drexler HG, Leber BF, Norton J, Yaxley J, Tatsumi E, Hoffbrand AV et al. Genotypes and
immunophenotypes of Hodgkin's disease-derived cell lines. Leukemia 1988; 2(6):371-376.
(120) Wang T, Shigdar S, Gantier MP, Hou Y, Wang L, Li Y et al. Cancer stem cell targeted therapy:
progress amid controversies. Oncotarget 2015; 6(42):44191-44206.
119
(121) Hirschmann-Jax C, Foster AE, Wulf GG, Nuchtern JG, Jax TW, Gobel U et al. A distinct "side
population" of cells with high drug efflux capacity in human tumor cells. Proc Natl Acad Sci U S
A 2004; 101(39):14228-14233.
(122) Ding XW, Wu JH, Jiang CP. ABCG2: a potential marker of stem cells and novel target in stem cell
and cancer therapy. Life Sci 2010; 86(17-18):631-637.
(123) Clark AT. The stem cell identity of testicular cancer. Stem Cell Rev 2007; 3(1):49-59.
(124) Bosl GJ, Motzer RJ. Testicular germ-cell cancer. N Engl J Med 1997; 337(4):242-253.
(125) Waring P, Mullbacher A. Cell death induced by the Fas/Fas ligand pathway and its role in
pathology. Immunol Cell Biol 1999; 77(4):312-317.
(126) Kunkele A, Johnson AJ, Rolczynski LS, Chang CA, Hoglund V, Kelly-Spratt KS et al. Functional
Tuning of CARs Reveals Signaling Threshold above Which CD8+ CTL Antitumor Potency Is
Attenuated due to Cell Fas-FasL-Dependent AICD. Cancer Immunol Res 2015; 3(4):368-379.
(127) Haynes NM, Smyth MJ, Kershaw MH, Trapani JA, Darcy PK. Fas-ligand-mediated lysis of erbB-
2-expressing tumour cells by redirected cytotoxic T lymphocytes. Cancer Immunol Immunother
1999; 47(5):278-286.
(128) Saini RV, Wilson C, Finn MW, Wang T, Krensky AM, Clayberger C. Granulysin delivered by
cytotoxic cells damages endoplasmic reticulum and activates caspase-7 in target cells. J Immunol
2011; 186(6):3497-3504.
(129) Andrade F, Roy S, Nicholson D, Thornberry N, Rosen A, Casciola-Rosen L. Granzyme B directly
and efficiently cleaves several downstream caspase substrates: implications for CTL-induced
apoptosis. Immunity 1998; 8(4):451-460.
(130) Albany C, Feldman DR, Garbo LE, Einhorn LH. Antitumor activity of brentuximab vedotin in
CD30 positive refractory germ cell tumors. J Clin Oncol 2013; 31[suppl. 6]:327.
(131) van de Geijn GJ, Hersmus R, Looijenga LH. Recent developments in testicular germ cell tumor
research. Birth Defects Res C Embryo Today 2009; 87(1):96-113.
(132) Werbowetski-Ogilvie TE, Bhatia M. Pluripotent human stem cell lines: what we can learn about
cancer initiation. Trends Mol Med 2008; 14(8):323-332.
(133) Sotillo E, Barrett DM, Black KL, Bagashev A, Oldridge D, Wu G et al. Convergence of Acquired
Mutations and Alternative Splicing of CD19 Enables Resistance to CART-19 Immunotherapy.
Cancer Discov 2015; 5(12):1282-1295.
(134) O'Rourke DM, Nasrallah MP, Desai A, Melenhorst JJ, Mansfield K, Morrissette JJD et al. A single
dose of peripherally infused EGFRvIII-directed CAR T cells mediates antigen loss and induces
adaptive resistance in patients with recurrent glioblastoma. Sci Transl Med 2017; 9(399).
(135) Zah E, Lin MY, Silva-Benedict A, Jensen MC, Chen YY. T Cells Expressing CD19/CD20
Bispecific Chimeric Antigen Receptors Prevent Antigen Escape by Malignant B Cells. Cancer
Immunol Res 2016; 4(6):498-508.

120
(136) Feldmann A, Arndt C, Bergmann R, Loff S, Cartellieri M, Bachmann D et al. Retargeting of T
lymphocytes to PSCA- or PSMA positive prostate cancer cells using the novel modular chimeric
antigen receptor platform technology "UniCAR". Oncotarget 2017; 8(19):31368-31385.
(137) O' Reilly E, Tirincsi A, Logue SE, Szegezdi E. The Janus Face of Death Receptor Signaling during
Tumor Immunoediting. Front Immunol 2016; 7:446.
(138) Bremer E. Targeting of the tumor necrosis factor receptor superfamily for cancer immunotherapy.
ISRN Oncol 2013; 2013:371854.
(139) Trauth BC, Klas C, Peters AM, Matzku S, Moller P, Falk W et al. Monoclonal antibody-mediated
tumor regression by induction of apoptosis. Science 1989; 245(4915):301-305.
(140) Galle PR, Hofmann WJ, Walczak H, Schaller H, Otto G, Stremmel W et al. Involvement of the
CD95 (APO-1/Fas) receptor and ligand in liver damage. J Exp Med 1995; 182(5):1223-1230.
(141) Ogasawara J, Watanabe-Fukunaga R, Adachi M, Matsuzawa A, Kasugai T, Kitamura Y et al.
Lethal effect of the anti-Fas antibody in mice. Nature 1993; 364(6440):806-809.
(142) Petak I, Danam RP, Tillman DM, Vernes R, Howell SR, Berczi L et al. Hypermethylation of the
gene promoter and enhancer region can regulate Fas expression and sensitivity in colon carcinoma.
Cell Death Differ 2003; 10(2):211-217.
(143) Wu J, Nihal M, Siddiqui J, Vonderheid EC, Wood GS. Low FAS/CD95 expression by CTCL
correlates with reduced sensitivity to apoptosis that can be restored by FAS upregulation. J Invest
Dermatol 2009; 129(5):1165-1173.
(144) Takayama H, Takakuwa T, Tsujimoto Y, Tani Y, Nonomura N, Okuyama A et al. Frequent Fas
gene mutations in testicular germ cell tumors. Am J Pathol 2002; 161(2):635-641.
(145) Nishio N, Diaconu I, Liu H, Cerullo V, Caruana I, Hoyos V et al. Armed oncolytic virus enhances
immune functions of chimeric antigen receptor-modified T cells in solid tumors. Cancer Res 2014;
74(18):5195-5205.
(146) Hoyos V, Savoldo B, Quintarelli C, Mahendravada A, Zhang M, Vera J et al. Engineering CD19-
specific T lymphocytes with interleukin-15 and a suicide gene to enhance their anti-
lymphoma/leukemia effects and safety. Leukemia 2010; 24(6):1160-1170.
(147) Quintarelli C, Vera JF, Savoldo B, Giordano Attianese GM, Pule M, Foster AE et al. Co-expression
of cytokine and suicide genes to enhance the activity and safety of tumor-specific cytotoxic T
lymphocytes. Blood 2007; 110(8):2793-2802.
(148) Fankhauser CD, Curioni-Fontecedro A, Allmann V, Beyer J, Tischler V, Sulser T et al. Frequent
PD-L1 expression in testicular germ cell tumors. Br J Cancer 2015; 113(3):411-413.
(149) Litchfield K, Levy M, Huddart RA, Shipley J, Turnbull C. The genomic landscape of testicular
germ cell tumours: from susceptibility to treatment. Nat Rev Urol 2016; 13(7):409-419.
(150) Gargett T, Yu W, Dotti G, Yvon ES, Christo SN, Hayball JD et al. GD2-specific CAR T Cells
Undergo Potent Activation and Deletion Following Antigen Encounter but can be Protected From
Activation-induced Cell Death by PD-1 Blockade. Mol Ther 2016; 24(6):1135-1149.

121
(151) Cheng J, Zhu H, Choi JK. CD30 Expression in Pediatric Neoplasms, Study of 585 Cases. Pediatr
Dev Pathol 2017; 20(3):191-196.
(152) Newick K, Moon E, Albelda SM. Chimeric antigen receptor T-cell therapy for solid tumors. Mol
Ther Oncolytics 2016; 3:16006.
(153) Li H, Zhao Y. Increasing the safety and efficacy of chimeric antigen receptor T cell therapy. Protein
Cell 2017; 8(8):573-589.
(154) Lim WA, June CH. The Principles of Engineering Immune Cells to Treat Cancer. Cell 2017;
168(4):724-740.
(155) Brudno JN, Kochenderfer JN. Toxicities of chimeric antigen receptor T cells: recognition and
management. Blood 2016; 127(26):3321-3330.
(156) Morgan RA, Yang JC, Kitano M, Dudley ME, Laurencot CM, Rosenberg SA. Case report of a
serious adverse event following the administration of T cells transduced with a chimeric antigen
receptor recognizing ERBB2. Mol Ther 2010; 18(4):843-851.
(157) Liu XS, Mardis ER. Applications of Immunogenomics to Cancer. Cell 2017; 168(4):600-612.
(158) Congdon KL, Gedeon PC, Suryadevara CM, Caruso HG, Cooper LJ, Heimberger AB et al.
Epidermal growth factor receptor and variant III targeted immunotherapy. Neuro Oncol 2014; 16
Suppl 8:viii20-viii25.
(159) Marincola FM, Jaffee EM, Hicklin DJ, Ferrone S. Escape of human solid tumors from T-cell
recognition: molecular mechanisms and functional significance. Adv Immunol 2000; 74:181-273.
(160) Leen AM, Rooney CM, Foster AE. Improving T cell therapy for cancer. Annu Rev Immunol 2007;
25:243-265.
(161) Lanitis E, Poussin M, Klattenhoff AW, Song D, Sandaltzopoulos R, June CH et al. Chimeric
antigen receptor T Cells with dissociated signaling domains exhibit focused antitumor activity with
reduced potential for toxicity in vivo. Cancer Immunol Res 2013; 1(1):43-53.
(162) Wilkie S, van Schalkwyk MC, Hobbs S, Davies DM, van der Stegen SJ, Pereira AC et al. Dual
targeting of ErbB2 and MUC1 in breast cancer using chimeric antigen receptors engineered to
provide complementary signaling. J Clin Immunol 2012; 32(5):1059-1070.
(163) Grada Z, Hegde M, Byrd T, Shaffer DR, Ghazi A, Brawley VS et al. TanCAR: A Novel Bispecific
Chimeric Antigen Receptor for Cancer Immunotherapy. Mol Ther Nucleic Acids 2013; 2:e105.
(164) Hegde M, Corder A, Chow KK, Mukherjee M, Ashoori A, Kew Y et al. Combinational targeting
offsets antigen escape and enhances effector functions of adoptively transferred T cells in
glioblastoma. Mol Ther 2013; 21(11):2087-2101.
(165) Hegde M, Mukherjee M, Grada Z, Pignata A, Landi D, Navai SA et al. Tandem CAR T cells
targeting HER2 and IL13Ralpha2 mitigate tumor antigen escape. J Clin Invest 2016; 126(8):3036-
3052.

122
(166) Masters JR, Osborne EJ, Walker MC, Parris CN. Hypersensitivity of human testis-tumour cell lines
to chemotherapeutic drugs. Int J Cancer 1993; 53(2):340-346.
(167) Petak I, Houghton JA. Shared pathways: death receptors and cytotoxic drugs in cancer therapy.
Pathol Oncol Res 2001; 7(2):95-106.
(168) Kerley-Hamilton JS, Pike AM, Li N, DiRenzo J, Spinella MJ. A p53-dominant transcriptional
response to cisplatin in testicular germ cell tumor-derived human embryonal carcinoma. Oncogene
2005; 24(40):6090-6100.
(169) Friesen C, Herr I, Krammer PH, Debatin KM. Involvement of the CD95 (APO-1/FAS)
receptor/ligand system in drug-induced apoptosis in leukemia cells. Nat Med 1996; 2(5):574-577.
(170) Fulda S, Sieverts H, Friesen C, Herr I, Debatin KM. The CD95 (APO-1/Fas) system mediates drug-
induced apoptosis in neuroblastoma cells. Cancer Res 1997; 57(17):3823-3829.
(171) Muller M, Strand S, Hug H, Heinemann EM, Walczak H, Hofmann WJ et al. Drug-induced
apoptosis in hepatoma cells is mediated by the CD95 (APO-1/Fas) receptor/ligand system and
involves activation of wild-type p53. J Clin Invest 1997; 99(3):403-413.
(172) Mocarski ES, Kaiser WJ, Livingston-Rosanoff D, Upton JW, Daley-Bauer LP. True grit:
programmed necrosis in antiviral host defense, inflammation, and immunogenicity. J Immunol
2014; 192(5):2019-2026.
(173) Guicciardi ME, Gores GJ. Life and death by death receptors. FASEB J 2009; 23(6):1625-1637.
(174) Cullen SP, Martin SJ. Mechanisms of granule-dependent killing. Cell Death Differ 2008;
15(2):251-262.
(175) Fan Z, Beresford PJ, Oh DY, Zhang D, Lieberman J. Tumor suppressor NM23-H1 is a granzyme
A-activated DNase during CTL-mediated apoptosis, and the nucleosome assembly protein SET is
its inhibitor. Cell 2003; 112(5):659-672.
(176) Nishimura Y, Hirabayashi Y, Matsuzaki Y, Musette P, Ishii A, Nakauchi H et al. In vivo analysis
of Fas antigen-mediated apoptosis: effects of agonistic anti-mouse Fas mAb on thymus, spleen and
liver. Int Immunol 1997; 9(2):307-316.
(177) Jodo S, Kung JT, Xiao S, Chan DV, Kobayashi S, Tateno M et al. Anti-CD95-induced lethality
requires radioresistant Fcgamma RII+ cells. A novel mechanism for fulminant hepatic failure. J
Biol Chem 2003; 278(9):7553-7557.
(178) Burger H, Nooter K, Boersma AW, Kortland CJ, Stoter G. Lack of correlation between cisplatin-
induced apoptosis, p53 status and expression of Bcl-2 family proteins in testicular germ cell tumour
cell lines. Int J Cancer 1997; 73(4):592-599.
(179) Craddock JA, Lu A, Bear A, Pule M, Brenner MK, Rooney CM et al. Enhanced tumor trafficking
of GD2 chimeric antigen receptor T cells by expression of the chemokine receptor CCR2b. J
Immunother 2010; 33(8):780-788.
(180) Peske JD, Woods AB, Engelhard VH. Control of CD8 T-Cell Infiltration into Tumors by
Vasculature and Microenvironment. Adv Cancer Res 2015; 128:263-307.

123
(181) Ochsenbein AF, Sierro S, Odermatt B, Pericin M, Karrer U, Hermans J et al. Roles of tumour
localization, second signals and cross priming in cytotoxic T-cell induction. Nature 2001;
411(6841):1058-1064.
(182) Brown CE, Badie B, Barish ME, Weng L, Ostberg JR, Chang WC et al. Bioactivity and Safety of
IL13Ralpha2-Redirected Chimeric Antigen Receptor CD8+ T Cells in Patients with Recurrent
Glioblastoma. Clin Cancer Res 2015; 21(18):4062-4072.
(183) Katz SC, Burga RA, McCormack E, Wang LJ, Mooring W, Point GR et al. Phase I Hepatic
Immunotherapy for Metastases Study of Intra-Arterial Chimeric Antigen Receptor-Modified T-cell
Therapy for CEA+ Liver Metastases. Clin Cancer Res 2015; 21(14):3149-3159.
(184) Smith TT, Moffett HF, Stephan SB, Opel CF, Dumigan AG, Jiang X et al. Biopolymers
codelivering engineered T cells and STING agonists can eliminate heterogeneous tumors. J Clin
Invest 2017; 127(6):2176-2191.
(185) Moon EK, Carpenito C, Sun J, Wang LC, Kapoor V, Predina J et al. Expression of a functional
CCR2 receptor enhances tumor localization and tumor eradication by retargeted human T cells
expressing a mesothelin-specific chimeric antibody receptor. Clin Cancer Res 2011; 17(14):4719-
4730.
(186) Chmielewski M, Abken H. CAR T Cells Releasing IL-18 Convert to T-Bet(high) FoxO1(low)
Effectors that Exhibit Augmented Activity against Advanced Solid Tumors. Cell Rep 2017;
21(11):3205-3219.
(187) Hu B, Ren J, Luo Y, Keith B, Young RM, Scholler J et al. Augmentation of Antitumor Immunity
by Human and Mouse CAR T Cells Secreting IL-18. Cell Rep 2017; 20(13):3025-3033.
(188) Herbst RS, Soria JC, Kowanetz M, Fine GD, Hamid O, Gordon MS et al. Predictive correlates of
response to the anti-PD-L1 antibody MPDL3280A in cancer patients. Nature 2014; 515(7528):563-
567.
(189) Tumeh PC, Harview CL, Yearley JH, Shintaku IP, Taylor EJ, Robert L et al. PD-1 blockade induces
responses by inhibiting adaptive immune resistance. Nature 2014; 515(7528):568-571.
(190) Heczey A, Louis CU, Savoldo B, Dakhova O, Durett A, Grilley B et al. CAR T Cells Administered
in Combination with Lymphodepletion and PD-1 Inhibition to Patients with Neuroblastoma. Mol
Ther 2017; 25(9):2214-2224.
(191) Davenport ML. Approach to the patient with Turner syndrome. J Clin Endocrinol Metab 2010;
95(4):1487-1495.
(192) Turner HH. A syndrome of infantilism, congenital webbed neck, and cubitus valgus.
Endocrinology 1938; 23:566-574.
(193) FORD CE, JONES KW, POLANI PE, DE ALMEIDA JC, BRIGGS JH. A sex-chromosome
anomaly in a case of gonadal dysgenesis (Turner's syndrome). Lancet 1959; 1(7075):711-713.
(194) Lleo A, Moroni L, Caliari L, Invernizzi P. Autoimmunity and Turner's syndrome. Autoimmun Rev
2012; 11(6-7):A538-A543.

124
(195) Berletch JB, Yang F, Xu J, Carrel L, Disteche CM. Genes that escape from X inactivation. Hum
Genet 2011; 130(2):237-245.
(196) Ferguson-Smith MA. KARYOTYPE-PHENOTYPE CORRELATIONS IN GONADAL
DYSGENESIS AND THEIR BEARING ON THE PATHOGENESIS OF MALFORMATIONS. J
Med Genet 1965; 2(2):142-155.
(197) Blaschke RJ, Rappold GA. SHOX: growth, Leri-Weill and Turner syndromes. Trends Endocrinol
Metab 2000; 11(6):227-230.
(198) Makishima T, King K, Brewer CC, Zalewski CK, Butman J, Bakalov VK et al. Otolaryngologic
markers for the early diagnosis of Turner syndrome. Int J Pediatr Otorhinolaryngol 2009;
73(11):1564-1567.
(199) Cacciari E, Masi M, Fantini MP, Licastro F, Cicognani A, Pirazzoli P et al. Serum
immunoglobulins and lymphocyte subpopulations derangement in Turner's syndrome. J
Immunogenet 1981; 8(5):337-344.
(200) Jensen K, Petersen PH, Nielsen EL, Dahl G, Nielsen J. Serum immunoglobulin M, G, and A
concentration levels in Turner's syndrome compared with normal women and men. Hum Genet
1976; 31(3):329-334.
(201) Mock, Markert UR, Vogelsang H, Jager L. Selective T-cell deficiency in Turner's syndrome. J
Investig Allergol Clin Immunol 2000; 10(5):312-313.
(202) Stenberg AE, Sylven L, Magnusson CG, Hultcrantz M. Immunological parameters in girls with
Turner syndrome. J Negat Results Biomed 2004; 3:6.
(203) Rongen-Westerlaken C, Rijkers GT, Scholtens EJ, van EA, Wit JM, van den Brande JL et al.
Immunologic studies in Turner syndrome before and during treatment with growth hormone. The
Dutch Growth Hormone Working Group. J Pediatr 1991; 119(2):268-272.
(204) Lee YA, Kim HR, Lee JS, Jung HW, Kim HY, Lee GM et al. CD4+ FOXP3+ Regulatory T Cells
Exhibit Impaired Ability to Suppress Effector T Cell Proliferation in Patients with Turner
Syndrome. PLoS One 2015; 10(12):e0144549.
(205) Cook KD, Shpargel KB, Starmer J, Whitfield-Larry F, Conley B, Allard DE et al. T Follicular
Helper Cell-Dependent Clearance of a Persistent Virus Infection Requires T Cell Expression of the
Histone Demethylase UTX. Immunity 2015; 43(4):703-714.
(206) Stagi S, Gulino AV, Lapi E, Rigante D. Epigenetic control of the immune system: a lesson from
Kabuki syndrome. Immunol Res 2016; 64(2):345-359.
(207) Greenfield A, Carrel L, Pennisi D, Philippe C, Quaderi N, Siggers P et al. The UTX gene escapes
X inactivation in mice and humans. Hum Mol Genet 1998; 7(4):737-742.
(208) Weinhold B. Epigenetics: the science of change. Environ Health Perspect 2006; 114(3):A160-
A167.
(209) Dwivedi RS, Herman JG, McCaffrey TA, Raj DS. Beyond genetics: epigenetic code in chronic
kidney disease. Kidney Int 2011; 79(1):23-32.

125
(210) Wei G, Wei L, Zhu J, Zang C, Hu-Li J, Yao Z et al. Global mapping of H3K4me3 and H3K27me3
reveals specificity and plasticity in lineage fate determination of differentiating CD4+ T cells.
Immunity 2009; 30(1):155-167.
(211) Vire E, Brenner C, Deplus R, Blanchon L, Fraga M, Didelot C et al. The Polycomb group protein
EZH2 directly controls DNA methylation. Nature 2006; 439(7078):871-874.
(212) Hong S, Cho YW, Yu LR, Yu H, Veenstra TD, Ge K. Identification of JmjC domain-containing
UTX and JMJD3 as histone H3 lysine 27 demethylases. Proc Natl Acad Sci U S A 2007;
104(47):18439-18444.
(213) Agger K, Cloos PA, Christensen J, Pasini D, Rose S, Rappsilber J et al. UTX and JMJD3 are histone
H3K27 demethylases involved in HOX gene regulation and development. Nature 2007;
449(7163):731-734.
(214) Shpargel KB, Sengoku T, Yokoyama S, Magnuson T. UTX and UTY demonstrate histone
demethylase-independent function in mouse embryonic development. PLoS Genet 2012;
8(9):e1002964.
(215) Wang JK, Tsai MC, Poulin G, Adler AS, Chen S, Liu H et al. The histone demethylase UTX enables
RB-dependent cell fate control. Genes Dev 2010; 24(4):327-332.
(216) Thieme S, Gyarfas T, Richter C, Ozhan G, Fu J, Alexopoulou D et al. The histone demethylase
UTX regulates stem cell migration and hematopoiesis. Blood 2013; 121(13):2462-2473.
(217) van HG, Dalgliesh GL, Davies H, Chen L, Bignell G, Greenman C et al. Somatic mutations of the
histone H3K27 demethylase gene UTX in human cancer. Nat Genet 2009; 41(5):521-523.
(218) Van der Meulen J, Sanghvi V, Mavrakis K, Durinck K, Fang F, Matthijssens F et al. The
H3K27me3 demethylase UTX is a gender-specific tumor suppressor in T-cell acute lymphoblastic
leukemia. Blood 2015; 125(1):13-21.
(219) Lin JL, Lee WI, Huang JL, Chen PK, Chan KC, Lo LJ et al. Immunologic assessment and KMT2D
mutation detection in Kabuki syndrome. Clin Genet 2015; 88(3):255-260.
(220) Hoffman JD, Ciprero KL, Sullivan KE, Kaplan PB, McDonald-McGinn DM, Zackai EH et al.
Immune abnormalities are a frequent manifestation of Kabuki syndrome. Am J Med Genet A 2005;
135(3):278-281.
(221) Wilson CB, Rowell E, Sekimata M. Epigenetic control of T-helper-cell differentiation. Nat Rev
Immunol 2009; 9(2):91-105.
(222) Crotty S. Follicular helper CD4 T cells (TFH). Annu Rev Immunol 2011; 29:621-663.
(223) Brooks DG, Teyton L, Oldstone MB, McGavern DB. Intrinsic functional dysregulation of CD4 T
cells occurs rapidly following persistent viral infection. J Virol 2005; 79(16):10514-10527.
(224) Fahey LM, Wilson EB, Elsaesser H, Fistonich CD, McGavern DB, Brooks DG. Viral persistence
redirects CD4 T cell differentiation toward T follicular helper cells. J Exp Med 2011; 208(5):987-
999.

126
(225) Deenick EK, Ma CS. The regulation and role of T follicular helper cells in immunity. Immunology
2011; 134(4):361-367.
(226) Bauquet AT, Jin H, Paterson AM, Mitsdoerffer M, Ho IC, Sharpe AH et al. The costimulatory
molecule ICOS regulates the expression of c-Maf and IL-21 in the development of follicular T
helper cells and TH-17 cells. Nat Immunol 2009; 10(2):167-175.
(227) Petrovas C, Koup RA. T follicular helper cells and HIV/SIV-specific antibody responses. Curr
Opin HIV AIDS 2014; 9(3):235-241.
(228) Sharma SK, Casey JR, Pichichero ME. Reduced memory CD4+ T-cell generation in the circulation
of young children may contribute to the otitis-prone condition. J Infect Dis 2011; 204(4):645-653.
(229) Morita R, Schmitt N, Bentebibel SE, Ranganathan R, Bourdery L, Zurawski G et al. Human blood
CXCR5(+)CD4(+) T cells are counterparts of T follicular cells and contain specific subsets that
differentially support antibody secretion. Immunity 2011; 34(1):108-121.
(230) Miller SA, Mohn SE, Weinmann AS. Jmjd3 and UTX play a demethylase-independent role in
chromatin remodeling to regulate T-box family member-dependent gene expression. Mol Cell
2010; 40(4):594-605.
(231) Morales TC, Laugesen A, Helin K. Utx is required for proper induction of ectoderm and mesoderm
during differentiation of embryonic stem cells. PLoS One 2013; 8(4):e60020.
(232) Manna S, Kim JK, Bauge C, Cam M, Zhao Y, Shetty J et al. Histone H3 Lysine 27 demethylases
Jmjd3 and Utx are required for T-cell differentiation. Nat Commun 2015; 6:8152.
(233) Su MA, Stenerson M, Liu W, Putnam A, Conte F, Bluestone JA et al. The role of X-linked FOXP3
in the autoimmune susceptibility of Turner Syndrome patients. Clin Immunol 2009; 131(1):139-
144.
(234) Rajpathak SN, Deobagkar DD. Evidence for epigenetic alterations in Turner syndrome opens up
feasibility of new pharmaceutical interventions. Curr Pharm Des 2014; 20(11):1778-1785.
(235) Pardoll DM. The blockade of immune checkpoints in cancer immunotherapy. Nat Rev Cancer
2012; 12(4):252-264.
(236) Hodi FS, O'Day SJ, McDermott DF, Weber RW, Sosman JA, Haanen JB et al. Improved survival
with ipilimumab in patients with metastatic melanoma. N Engl J Med 2010; 363(8):711-723.
(237) Schadendorf D, Hodi FS, Robert C, Weber JS, Margolin K, Hamid O et al. Pooled Analysis of
Long-Term Survival Data From Phase II and Phase III Trials of Ipilimumab in Unresectable or
Metastatic Melanoma. J Clin Oncol 2015; 33(17):1889-1894.
(238) Wolchok JD, Kluger H, Callahan MK, Postow MA, Rizvi NA, Lesokhin AM et al. Nivolumab plus
ipilimumab in advanced melanoma. N Engl J Med 2013; 369(2):122-133.
(239) Ribas A, Puzanov I, Dummer R, Schadendorf D, Hamid O, Robert C et al. Pembrolizumab versus
investigator-choice chemotherapy for ipilimumab-refractory melanoma (KEYNOTE-002): a
randomised, controlled, phase 2 trial. Lancet Oncol 2015; 16(8):908-918.

127
(240) McArthur GA, Chapman PB, Robert C, Larkin J, Haanen JB, Dummer R et al. Safety and efficacy
of vemurafenib in BRAF(V600E) and BRAF(V600K) mutation-positive melanoma (BRIM-3):
extended follow-up of a phase 3, randomised, open-label study. Lancet Oncol 2014; 15(3):323-
332.
(241) Weber JS, D'Angelo SP, Minor D, Hodi FS, Gutzmer R, Neyns B et al. Nivolumab versus
chemotherapy in patients with advanced melanoma who progressed after anti-CTLA-4 treatment
(CheckMate 037): a randomised, controlled, open-label, phase 3 trial. Lancet Oncol 2015;
16(4):375-384.
(242) Mahoney KM, Rennert PD, Freeman GJ. Combination cancer immunotherapy and new
immunomodulatory targets. Nat Rev Drug Discov 2015; 14(8):561-584.
(243) Gotter J, Brors B, Hergenhahn M, Kyewski B. Medullary epithelial cells of the human thymus
express a highly diverse selection of tissue-specific genes colocalized in chromosomal clusters. J
Exp Med 2004; 199(2):155-166.
(244) Trager U, Sierro S, Djordjevic G, Bouzo B, Khandwala S, Meloni A et al. The immune response
to melanoma is limited by thymic selection of self-antigens. PLoS One 2012; 7(4):e35005.
(245) Zhu ML, Nagavalli A, Su MA. Aire deficiency promotes TRP-1-specific immune rejection of
melanoma. Cancer Res 2013; 73(7):2104-2116.
(246) Conteduca G, Ferrera F, Pastorino L, Fenoglio D, Negrini S, Sormani MP et al. The role of AIRE
polymorphisms in melanoma. Clin Immunol 2010; 136(1):96-104.
(247) Chambers CA, Cado D, Truong T, Allison JP. Thymocyte development is normal in CTLA-4-
deficient mice. Proc Natl Acad Sci U S A 1997; 94(17):9296-9301.
(248) Page DB, Postow MA, Callahan MK, Allison JP, Wolchok JD. Immune modulation in cancer with
antibodies. Annu Rev Med 2014; 65:185-202.
(249) Khan IS, Mouchess ML, Zhu ML, Conley B, Fasano KJ, Hou Y et al. Enhancement of an anti-
tumor immune response by transient blockade of central T cell tolerance. J Exp Med 2014;
211(5):761-768.
(250) Hodi FS, Lee S, McDermott DF, Rao UN, Butterfield LH, Tarhini AA et al. Ipilimumab plus
sargramostim vs ipilimumab alone for treatment of metastatic melanoma: a randomized clinical
trial. JAMA 2014; 312(17):1744-1753.
(251) Su MA, Giang K, Zumer K, Jiang H, Oven I, Rinn JL et al. Mechanisms of an autoimmunity
syndrome in mice caused by a dominant mutation in Aire. J Clin Invest 2008; 118(5):1712-1726.
(252) Simpson TR, Li F, Montalvo-Ortiz W, Sepulveda MA, Bergerhoff K, Arce F et al. Fc-dependent
depletion of tumor-infiltrating regulatory T cells co-defines the efficacy of anti-CTLA-4 therapy
against melanoma. J Exp Med 2013; 210(9):1695-1710.
(253) van EA, Hurwitz AA, Allison JP. Combination immunotherapy of B16 melanoma using anti-
cytotoxic T lymphocyte-associated antigen 4 (CTLA-4) and granulocyte/macrophage colony-
stimulating factor (GM-CSF)-producing vaccines induces rejection of subcutaneous and metastatic
tumors accompanied by autoimmune depigmentation. J Exp Med 1999; 190(3):355-366.

128
(254) O'Day SJ, Maio M, Chiarion-Sileni V, Gajewski TF, Pehamberger H, Bondarenko IN et al. Efficacy
and safety of ipilimumab monotherapy in patients with pretreated advanced melanoma: a
multicenter single-arm phase II study. Ann Oncol 2010; 21(8):1712-1717.
(255) Wolchok JD, Neyns B, Linette G, Negrier S, Lutzky J, Thomas L et al. Ipilimumab monotherapy
in patients with pretreated advanced melanoma: a randomised, double-blind, multicentre, phase 2,
dose-ranging study. Lancet Oncol 2010; 11(2):155-164.
(256) Quezada SA, Simpson TR, Peggs KS, Merghoub T, Vider J, Fan X et al. Tumor-reactive CD4(+)
T cells develop cytotoxic activity and eradicate large established melanoma after transfer into
lymphopenic hosts. J Exp Med 2010; 207(3):637-650.
(257) Hunder NN, Wallen H, Cao J, Hendricks DW, Reilly JZ, Rodmyre R et al. Treatment of metastatic
melanoma with autologous CD4+ T cells against NY-ESO-1. N Engl J Med 2008; 358(25):2698-
2703.
(258) Curran MA, Kim M, Montalvo W, Al-Shamkhani A, Allison JP. Combination CTLA-4 blockade
and 4-1BB activation enhances tumor rejection by increasing T-cell infiltration, proliferation, and
cytokine production. PLoS One 2011; 6(4):e19499.
(259) Muranski P, Boni A, Antony PA, Cassard L, Irvine KR, Kaiser A et al. Tumor-specific Th17-
polarized cells eradicate large established melanoma. Blood 2008; 112(2):362-373.
(260) Gogas H, Ioannovich J, Dafni U, Stavropoulou-Giokas C, Frangia K, Tsoutsos D et al. Prognostic
significance of autoimmunity during treatment of melanoma with interferon. N Engl J Med 2006;
354(7):709-718.
(261) Harris JE, Harris TH, Weninger W, Wherry EJ, Hunter CA, Turka LA. A mouse model of vitiligo
with focused epidermal depigmentation requires IFN-gamma for autoreactive CD8(+) T-cell
accumulation in the skin. J Invest Dermatol 2012; 132(7):1869-1876.
(262) Beck KE, Blansfield JA, Tran KQ, Feldman AL, Hughes MS, Royal RE et al. Enterocolitis in
patients with cancer after antibody blockade of cytotoxic T-lymphocyte-associated antigen 4. J Clin
Oncol 2006; 24(15):2283-2289.
(263) Liu Z, Geboes K, Hellings P, Maerten P, Heremans H, Vandenberghe P et al. B7 interactions with
CD28 and CTLA-4 control tolerance or induction of mucosal inflammation in chronic experimental
colitis. J Immunol 2001; 167(3):1830-1838.
(264) Powrie F, Leach MW, Mauze S, Caddle LB, Coffman RL. Phenotypically distinct subsets of CD4+
T cells induce or protect from chronic intestinal inflammation in C. B-17 scid mice. Int Immunol
1993; 5(11):1461-1471.
(265) Anderson MS, Venanzi ES, Chen Z, Berzins SP, Benoist C, Mathis D. The cellular mechanism of
Aire control of T cell tolerance. Immunity 2005; 23(2):227-239.
(266) Torok HP, Tonenchi L, Glas J, Schiemann U, Folwaczny C. No significant association between
mutations in exons 6 and 8 of the autoimmune regulator (AIRE) gene and inflammatory bowel
disease. Eur J Immunogenet 2004; 31(2):83-86.
(267) Chustecka Z. Denosumab Approved for Cancer Patients With Bone Metastases. Medscape 2010.
129
(268) Dranoff G, Jaffee E, Lazenby A, Golumbek P, Levitsky H, Brose K et al. Vaccination with
irradiated tumor cells engineered to secrete murine granulocyte-macrophage colony-stimulating
factor stimulates potent, specific, and long-lasting anti-tumor immunity. Proc Natl Acad Sci U S A
1993; 90(8):3539-3543.
(269) Chapuis AG, Thompson JA, Margolin KA, Rodmyre R, Lai IP, Dowdy K et al. Transferred
melanoma-specific CD8+ T cells persist, mediate tumor regression, and acquire central memory
phenotype. Proc Natl Acad Sci U S A 2012; 109(12):4592-4597.
(270) Chapuis AG, Roberts IM, Thompson JA, Margolin KA, Bhatia S, Lee SM et al. T-Cell Therapy
Using Interleukin-21-Primed Cytotoxic T-Cell Lymphocytes Combined With Cytotoxic T-Cell
Lymphocyte Antigen-4 Blockade Results in Long-Term Cell Persistence and Durable Tumor
Regression. J Clin Oncol 2016; 34(31):3787-3795.
(271) Kavanagh B, O'Brien S, Lee D, Hou Y, Weinberg V, Rini B et al. CTLA4 blockade expands
FoxP3+ regulatory and activated effector CD4+ T cells in a dose-dependent fashion. Blood 2008;
112(4):1175-1183.
(272) Quezada SA, Peggs KS, Curran MA, Allison JP. CTLA4 blockade and GM-CSF combination
immunotherapy alters the intratumor balance of effector and regulatory T cells. J Clin Invest 2006;
116(7):1935-1945.
(273) Malandro N, Budhu S, Kuhn NF, Liu C, Murphy JT, Cortez C et al. Clonal Abundance of Tumor-
Specific CD4(+) T Cells Potentiates Efficacy and Alters Susceptibility to Exhaustion. Immunity
2016; 44(1):179-193.
(274) Kitano S, Tsuji T, Liu C, Hirschhorn-Cymerman D, Kyi C, Mu Z et al. Enhancement of tumor-
reactive cytotoxic CD4+ T cell responses after ipilimumab treatment in four advanced melanoma
patients. Cancer Immunol Res 2013; 1(4):235-244.
(275) Tivol EA, Borriello F, Schweitzer AN, Lynch WP, Bluestone JA, Sharpe AH. Loss of CTLA-4
leads to massive lymphoproliferation and fatal multiorgan tissue destruction, revealing a critical
negative regulatory role of CTLA-4. Immunity 1995; 3(5):541-547.
(276) Waterhouse P, Penninger JM, Timms E, Wakeham A, Shahinian A, Lee KP et al.
Lymphoproliferative disorders with early lethality in mice deficient in Ctla-4. Science 1995;
270(5238):985-988.
(277) Nagamine K, Peterson P, Scott HS, Kudoh J, Minoshima S, Heino M et al. Positional cloning of
the APECED gene. Nat Genet 1997; 17(4):393-398.
(278) Xing L, Schwarz EM, Boyce BF. Osteoclast precursors, RANKL/RANK, and immunology.
Immunol Rev 2005; 208:19-29.
(279) Cummings SR, San MJ, McClung MR, Siris ES, Eastell R, Reid IR et al. Denosumab for prevention
of fractures in postmenopausal women with osteoporosis. N Engl J Med 2009; 361(8):756-765.
(280) Hale JS, Boursalian TE, Turk GL, Fink PJ. Thymic output in aged mice. Proc Natl Acad Sci U S
A 2006; 103(22):8447-8452.

130
(281) Poulin JF, Viswanathan MN, Harris JM, Komanduri KV, Wieder E, Ringuette N et al. Direct
evidence for thymic function in adult humans. J Exp Med 1999; 190(4):479-486.
(282) Smyth MJ, Yagita H, McArthur GA. Combination Anti-CTLA-4 and Anti-RANKL in Metastatic
Melanoma. J Clin Oncol 2016; 34(12):e104-e106.
(283) Egen JG, Kuhns MS, Allison JP. CTLA-4: new insights into its biological function and use in tumor
immunotherapy. Nat Immunol 2002; 3(7):611-618.
(284) Kruczynski A, Hill BT. Classic in vivo cancer models: three examples of mouse models used in
experimental therapeutics. Curr Protoc Pharmacol 2002; Chapter 5:Unit5.
(285) Ostanin DV, Pavlick KP, Bharwani S, D'Souza D, Furr KL, Brown CM et al. T cell-induced
inflammation of the small and large intestine in immunodeficient mice. Am J Physiol Gastrointest
Liver Physiol 2006; 290(1):G109-G119.
(286) Ostanin DV, Bao J, Koboziev I, Gray L, Robinson-Jackson SA, Kosloski-Davidson M et al. T cell
transfer model of chronic colitis: concepts, considerations, and tricks of the trade. Am J Physiol
Gastrointest Liver Physiol 2009; 296(2):G135-G146.
(287) Read S, Powrie F. Induction of inflammatory bowel disease in immunodeficient mice by depletion
of regulatory T cells. Curr Protoc Immunol 2001; Chapter 15:Unit.
(288) Hommel G. A Stagewise Rejective Multiple Test Procedure Based on a Modified Bonferroni Test.
Biometrika 1988; 75(2):383-386.