CCUS Roadmap of China
16
CCUS Roadmap of China Zhang Xiliang Institute of Energy, Environment and Economy Tsinghua University
Transcript of CCUS Roadmap of China

CCUS Roadmap of China
Zhang XiliangInstitute of Energy, Environment and Economy
Tsinghua University

Global CCS Policy Overview
2
Source: GCCSI, 2017
GCCSI Policy Index 20173(The circle size represents the number of large-scale CCS projects in the country)
Different colours represent different degrees of policy support:
• High
• Medium high
• Medium low
• Low

CCUS Roadmap of PRC published in 2014 by ADB
3
ADB CCUS Roadmap Update Project
Update on the progress achieved during 13th FYP
Revisit and revise the key numbers and conclusions of the CCUS roadmap 2014
Extension of the sector coverage◼ Cement◼ Iron and Steel◼ Hydrogen+CO2 utilization
New analysis of the role of CCUS deployment◼ Integrating CCUS deployment analysis with 2/1.5 degree
target
4

CCUS development and Deployment during 13th FYP
China's policy support for CCUS, its inherent interest and the number of large-scale CCS projects are all in the leading position in the world.CCUS deployment in 2020 could lead to 1.6 millions ton of CO2
avoidance, but far less than the targeted 10 millions as shown in the CCUS roadmap 2014CCUS deployment by sector◼ Chemical engineering sector: 1.1 million ton◼ Power generation: 0.5 million ton
◼ Barriers to CCUS deployment◼ Technology◼ Cost◼ Transport infrastructure◼ Institution
5

6project capture modetransport
modestorage/
utilizationscales status
Shanghai ShidongkouPower Plant of China Huaneng Group
capture after combustion of coal-fired power plant
by tank carutilization in food
industry or in industrial field
120,000 t/a
put into operation in 2009
intermittent operation
Tianjin green coal power project of China HuanengGroup
pre-combustion capture for IGCC
by pipelinedistance: 50 -
100km
planned EOR of Dagang Oilfield in
Tianjin60,000 t/a
Carbon capture unit completed.
Carbon storage project delayed.
Demonstration of CCUS in Shengli Oilfield, Sinopec
Capture after combustion of coal-fired power plant
by pipelinedistance: 80km
EOR of Shengli oil field
40000 t/a in the first stage, 1
million t/a in the second stage
Phase I put into operation in 2010
Shuanghuai power plant in Chongqing of China Power Investment Corporation
capture after combustion of coal-fired power plant
no
For welding protection, gas replacement of hydrogen cooling
generator in power plant, etc.
10,000 t/aput into operation in 2010, in operation
35 MW Oxygen-Enriched Combustion Project of HUST
oxygen-enriched combustion in coal-fired
power plantby tank car
marketing, utilization in industrial field
100,000 t/aBuilt in 2014,suspension of
operation
Lianyungang clean coal power system research facility
pre-combustion capture for IGCC
by pipelinegeological storage of
saline water layer30,000 t/a
put into operation in 2011, in operation
Tianjin Beitang power plant CCUS project
capture after combustion of coal-fired power plant
by tank car marketing, utilization in
food industry20,000 t/a
put into operation in 2012, in operation
Haifeng Power Plant of HuarunPower
capture after combustion of coal-fired power plant
By pipeline
utilization in food industry and geological storage of saline water
layer
20,000 t/a Operation in 2019
Resource: MI Jianfeng, Proceedings of the CSEE, Vol.39 No.9

Carbon capture project at Baima Cement Plant in Wuhu City with a CO2 capture capacity of 50Kt ton per year
7
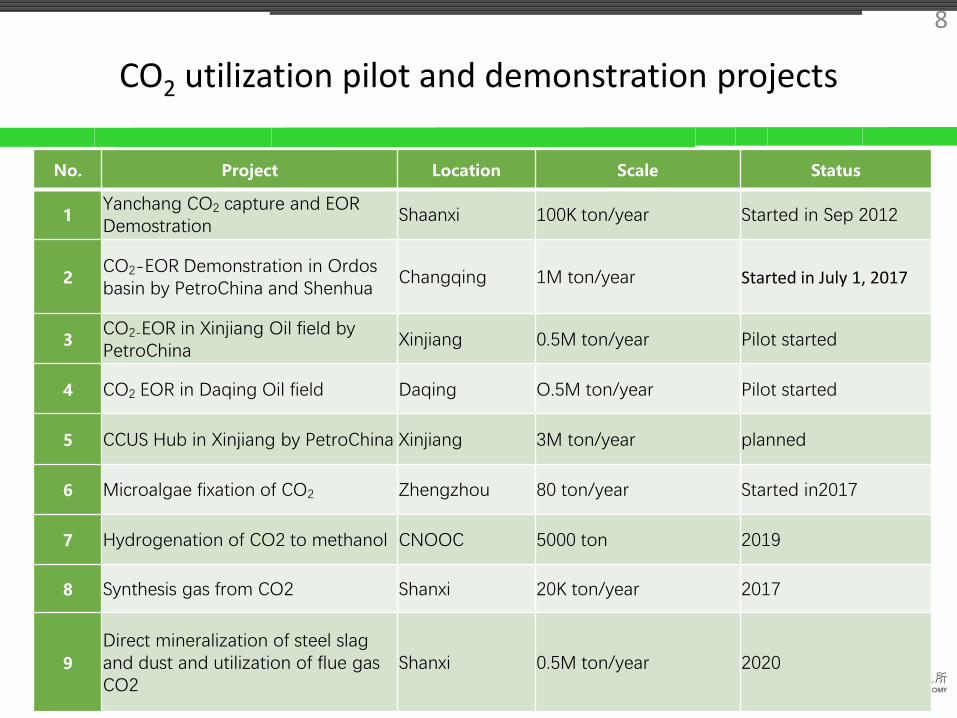
CO2 utilization pilot and demonstration projects
8
No. Project Location Scale Status
1Yanchang CO2 capture and EOR Demostration
Shaanxi 100K ton/year Started in Sep 2012
2CO2-EOR Demonstration in Ordos basin by PetroChina and Shenhua
Changqing 1M ton/year Started in July 1, 2017
3CO2-EOR in Xinjiang Oil field by PetroChina
Xinjiang 0.5M ton/year Pilot started
4 CO2 EOR in Daqing Oil field Daqing O.5M ton/year Pilot started
5 CCUS Hub in Xinjiang by PetroChina Xinjiang 3M ton/year planned
6 Microalgae fixation of CO2 Zhengzhou 80 ton/year Started in2017
7 Hydrogenation of CO2 to methanol CNOOC 5000 ton 2019
8 Synthesis gas from CO2 Shanxi 20K ton/year 2017
9
Direct mineralization of steel slag and dust and utilization of flue gas CO2
Shanxi 0.5M ton/year 2020

Energy-Related CO2 Emission, Mt/yr
9

Total primary energy supply - 2℃ Target , Gtce
10
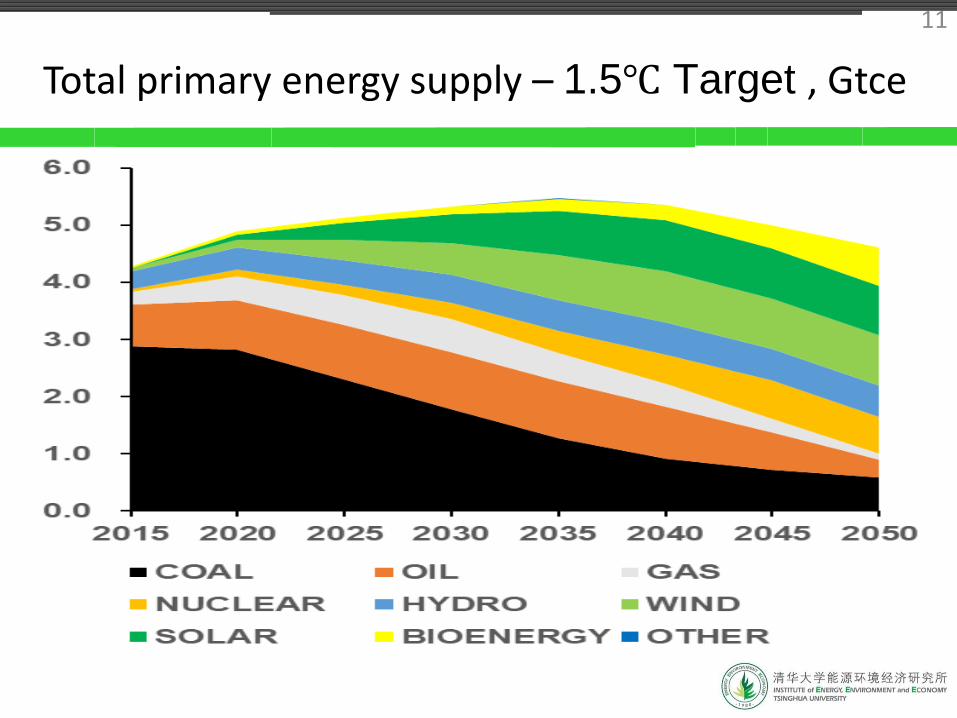
Total primary energy supply – 1.5℃ Target , Gtce
11

Carbon price , US$/t CO2 (2011 constant price)
12

Deployment of CCS, Mt/yr
13
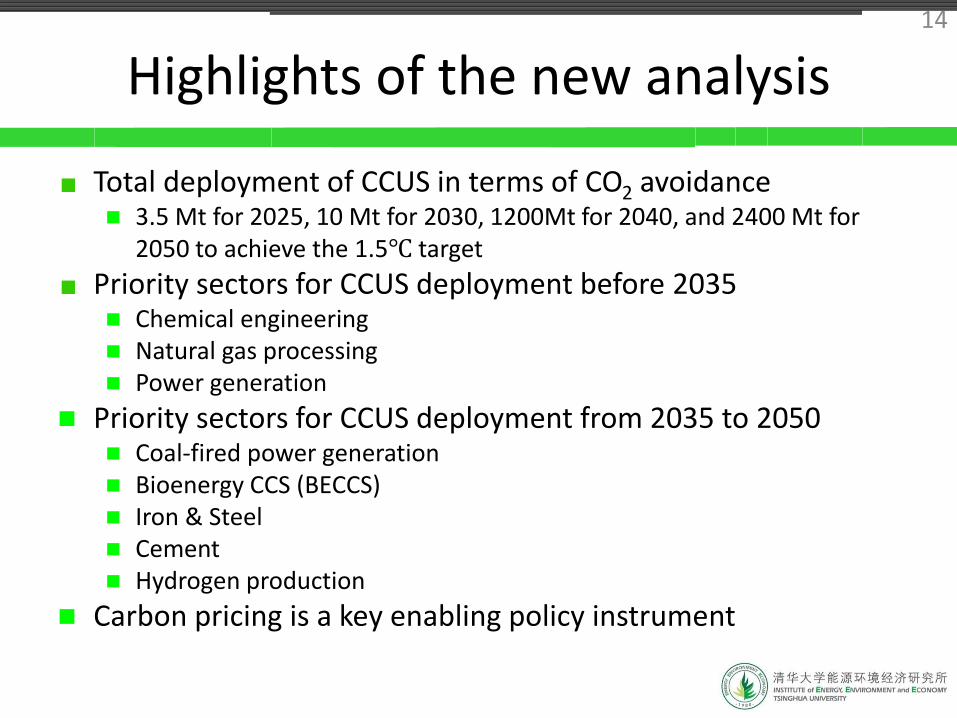
Highlights of the new analysis
Total deployment of CCUS in terms of CO2 avoidance◼ 3.5 Mt for 2025, 10 Mt for 2030, 1200Mt for 2040, and 2400 Mt for
2050 to achieve the 1.5℃ target
Priority sectors for CCUS deployment before 2035◼ Chemical engineering ◼ Natural gas processing◼ Power generation
◼ Priority sectors for CCUS deployment from 2035 to 2050◼ Coal-fired power generation◼ Bioenergy CCS (BECCS)◼ Iron & Steel◼ Cement◼ Hydrogen production
◼ Carbon pricing is a key enabling policy instrument
14

2013 20302018 2020 2025
REGIONAL ETS PILOTS
NATIONAL ETS
NATIONAL ETS
RATE-BASED MASS-BASED
PHASE ⅡDEVELOPMENT &
IMPROVEMENT
PHASE ⅠSTART & TRIAL
Primarily tradeable performance standards
It will start with the power generation and ultimately extend to 8 sectors, including iron & steel, non-ferrous metal, construction material, petrochemical engineering, chemical engineering.
Implementation roadmap of China’s national ETS