
CCENG-970 revised v3 18 10 13 - University of...
31
http://wrap.warwick.ac.uk Original citation: Boscato, Giosuè, Casalegno, Carlo, Russo, Salvatore and Mottram, J. Toby (James Toby), 1958-. (2013) Buckling of built-up columns of pultruded fiber-reinforced polymer C-sections. Journal of Composites for Construction . 04013050. ISSN 1090-0268 Permanent WRAP url: http://wrap.warwick.ac.uk/58216/ Copyright and reuse: The Warwick Research Archive Portal (WRAP) makes this work by researchers of the University of Warwick available open access under the following conditions. Copyright © and all moral rights to the version of the paper presented here belong to the individual author(s) and/or other copyright owners. To the extent reasonable and practicable the material made available in WRAP has been checked for eligibility before being made available. Copies of full items can be used for personal research or study, educational, or not-for- profit purposes without prior permission or charge. Provided that the authors, title and full bibliographic details are credited, a hyperlink and/or URL is given for the original metadata page and the content is not changed in any way. A note on versions: The version presented here may differ from the published version or, version of record, if you wish to cite this item you are advised to consult the publisher’s version. Please see the ‘permanent WRAP url’ above for details on accessing the published version and note that access may require a subscription. For more information, please contact the WRAP Team at: [email protected]
Transcript of CCENG-970 revised v3 18 10 13 - University of...

http://wrap.warwick.ac.uk
Original citation: Boscato, Giosuè, Casalegno, Carlo, Russo, Salvatore and Mottram, J. Toby (James Toby), 1958-. (2013) Buckling of built-up columns of pultruded fiber-reinforced polymer C-sections. Journal of Composites for Construction . 04013050. ISSN 1090-0268 Permanent WRAP url: http://wrap.warwick.ac.uk/58216/ Copyright and reuse: The Warwick Research Archive Portal (WRAP) makes this work by researchers of the University of Warwick available open access under the following conditions. Copyright © and all moral rights to the version of the paper presented here belong to the individual author(s) and/or other copyright owners. To the extent reasonable and practicable the material made available in WRAP has been checked for eligibility before being made available. Copies of full items can be used for personal research or study, educational, or not-for-profit purposes without prior permission or charge. Provided that the authors, title and full bibliographic details are credited, a hyperlink and/or URL is given for the original metadata page and the content is not changed in any way. A note on versions: The version presented here may differ from the published version or, version of record, if you wish to cite this item you are advised to consult the publisher’s version. Please see the ‘permanent WRAP url’ above for details on accessing the published version and note that access may require a subscription. For more information, please contact the WRAP Team at: [email protected]

1
G. Boscato, C. Casalegno, S. Russo and J. T. MOTTRAM, ‘Buckling of built-up columns of 1
pultruded FRP C-sections,’ Journal of Composites for Construction, 2
http://ascelibrary.org/doi/abs/10.1061/%28ASCE%29CC.1943-5614.0000453 3
4
Buckling of Built-up Columns of Pultruded FRP C-sections 5
Giosuè Boscato1, Carlo Casalegno2, Salvatore Russo3, and J. Toby Mottram4 6
7
ABSTRACT 8
This paper presents the test results of an experimental investigation to evaluate the buckling 9
behaviour of built-up columns of pultruded profiles, subjected to axial compression. 10
Specimens are assembled using four (off-the-shelf) channel shaped profiles of E-glass Fibre 11
Reinforced Polymer (FRP), having the similar detailing as strut members in a large FRP 12
structure that was executed in 2009 to start the restoration of the Santa Maria Paganica 13
church in L’Aquila, Italy. This church had partially collapsed walls and no roof after the 2009 14
April 6th earthquake of 6.3 magnitude. A total of six columns have been characterised with 15
two different configurations for the bolted connections joining together the channel sections 16
into a built-up strut. Test results are discussed and a comparison is made with closed form 17
equation predictions for flexural buckling resistance, and with buckling resistances 18
established from both Eigenvalue and geometric non-linear finite element analyses. Results 19
reported and discussed show that there is a significant role played by the end loading 20
condition, the composite action and imperfections. Simple closed form equations are found to 21
overestimate the flexural buckling strength, whilst the resistance by the non-linear analysis is 22 1Ph.D., Department of Construction, IUAV University of Venice, Dorsoduro 2206, 30123 Venice, Italy. E-mail: [email protected] 2Ph.D., Department of Construction, IUAV University of Venice, Dorsoduro 2206, 30123 Venice, Italy (corresponding author). E-mail: [email protected] 3Associate Professor of Structural Civil Engineering, Department of Construction, IUAV University of Venice, Dorsoduro 2206, 30123 Venice, Italy. E-mail: [email protected] 4Professor, School of Engineering, University of Warwick, Coventry CV4 7AL, UK. E-mail: [email protected]

2
seen to give a reasonably reliable numerical approach to establishing the actual buckling 23
behaviour. 24
SUBJECT HEADINGS: Buckling, pultruded built-up columns, laboratory tests, finite 25
element analysis 26
INTRODUCTION 27
The use of Fibre Reinforced Polymer (FRP) shapes and systems in construction has 28
significantly increased in recent years. The increased interest lies in the advantages over 29
traditional construction materials, such as high strength-to-weight ratio, corrosion resistance 30
and the ease of transportation and erection (Mottram 2011). 31
Pultrusion is a composite manufacturing process for the continuous production of FRP thin-32
walled shapes. One category of Pultruded (PFRP) profiles possess the same cross-sectional 33
shapes (I, H, Leg-angle, channel, box, etc.) as found in structural steelwork, but these 34
standard profiles are not as large, and have very different mechanical and structural properties 35
(Bank 2006). They consist of E-glass fibre reinforcement having layers of unidirectional 36
rovings and continuous mats in a thermoset resin based matrix, usually of a polyester or 37
vinylester polymer resin. Having a weight of only 25% of steel these profiles offer 38
lightweight structural solutions. Like steel, the tensile strength in the longitudinal direction is 39
more than 200 MPa. The longitudinal modulus of elasticity lies in the range 20-30 GPa, 40
which is 10-6 times lower than steel. The elastic modulus in the transverse direction is 0.3 of 41
the longitudinal value. The expected range for the in-plane shear modulus of elasticity of 42
PFRP material is 3 to 5 GPa. 43
The mechanical performance of individual PFRP structural profiles for frame members has 44
received attention by researchers (Bank 2006; Russo 2007; Boscato & Russo 2009; Boscato 45
et al. 2011). This is not the situation for built-up (column) members subjected to concentric 46
loading, and this form of member is the subject of a fact finding study reported in this paper. 47

3
The predominantly linear elastic mechanical properties of PFRP material (Bank 2006) leads 48
to different column response because there is neither material yielding nor gross plasticity 49
deformation. For the same cross-section dimensions the thin-walled PFRP column (of ‘I’ or 50
‘H’ shape) has the potential to fail first with a local instability buckling mode (Mottram 51
2004). Moreover, the buckling response is more related to the actual geometry of the cross-52
section than to the member’s slenderness (however this non-dimensional column length is 53
established). In general, PFRP columns of open-sectioned shape (‘H’ or ‘I’) will be subjected 54
to failure by global (flexural) buckling of the member or by local (plate) buckling of the 55
flange outstands (Barbero, Dede and Jones, 2000: Lane and Mottram 2002; Mottram, Brown 56
and Anderson 2003). 57
The local instability mode causes outstands to rotate about their intersection junction with the 58
web; this is particularly true for the wide flange (or ‘H’) profiles with height and breadth of 59
same dimensions. It has been shown via experimental investigations that axially compressed 60
H- and I-shapes can give one of two distinct types of failure, with local buckling occurring in 61
‘shorter’ columns that do not crush first, and flexural buckling prevailing when the member’s 62
effective length classify the column as ‘slender’. For intermediate slendernesses the two 63
instabilities may coexist and there might be imperfection sensitive modal coupling interaction 64
that leads to a tertiary buckling mode. Lane and Mottram (2002) have shown from axial 65
column tests with H-shapes that modal coupling lowers the buckling resistance by a few 66
percent in the transition range for column lengths between the two distinct modes of elastic 67
buckling. 68
Several research groups have contributed towards the development of knowledge to 69
understand the elastic buckling response of PFRP columns of standard shapes. From the 70
plethora of sources (refer to literature database at: 71
www2.warwick.ac.uk/fac/sci/eng/staff/jtm/pfrp_latest.pdf) a number of investigations of note 72

4
are by Barbero et al. (2000), Pecce and Cosenza (2000), Hashem and Yuan (2001), Lane and 73
Mottram (2002), Di Tommaso and Russo (2003), Mottram (2004) and Turvey and Zhang 74
(2006). None of the previous studies involved a built-up column member and so the study 75
reported in this paper is novel and will add to what we know and understand. Because of 76
practical limitations in processing capabilities the maximum size for an ‘off-the–shelve’ 77
PFRP has a cross-section area of about 13000 mm2 (for a I-profile of 610 x 178 x 12.7 mm). 78
The advantage of the built-up fabrication option is that it would allow bigger cross-sectional 79
sized members to be used in structural/civil engineering projects. 80
The structural response might be even more complex for a built-up column that is fabricated 81
from joining together (individual) standard PFRP profiles by a method of mechanical 82
fastening. Complexity could increase because of the possible interaction of buckling modes 83
within the individual shapes and the influence of composite action between them. Moreover, 84
the presence of material, geometrical and ‘loading’ imperfections is likely to have a influence 85
on how the built-up member responds and fails, when subjected to concentric compression 86
loading. 87
Presented in this paper are the test results from an experimental investigation to address and 88
evaluate the buckling characteristics of a PFRP built-up column. The column’s detailing is 89
similar to strut members in the 1050 m2 by 30 m high FRP structure located inside the church 90
of Santa Maria Paganica in L’Aquila (Russo, Boscato and Mottram 2012; Russo 2012). This 91
church lost its roof and parts of the masonry walls in the 6th April 2009 earthquake and, until 92
government funds are available for the restoration work, its fragile interior requires protection 93
from the weather. The engineered solution formulate in 120 days (Russo at al. 2012) was to 94
execute a temporary structure of FRP material (and at 8 kg per m2 it is a light weight 95
solution). To understand the measured responses the column failure results are compared 96

5
with resistances from closed form equations for flexural buckling and numerical results from 97
Eigenvalue (bifurcation buckling) and geometrical non-linear finite element analyses. 98
99
DESCRIPTION OF BUILT-UP STRUT 100
The goal of this study is to investigate the structural performance of a built-up member, 101
subjected to uniform compression, similar to those adopted in the construction of the 102
L’Aquila FRP structure shown in Figures 1(a) and 1(b). Shown in Figure 1(b) is the structural 103
system chosen to address the important design issues of second-order effects in ULS design 104
and to provide a suitable configuration for the (M14 steel) bolted gusset plate joints. Frame 105
jointing is characterized by using FRP components manufactured by two different composite 106
processing methods. The gusset plating (for in-plane isotropic properties) seen in Figure 1(b) 107
was manufactured using the bag molding process. The strut members are assembled from 108
four off-the-shelf pultruded channel-shaped sections having same cross-section dimensions 109
(152 x 43 mm) and wall thickness of 9.5 mm. 110
Figure 2(a) shows the tested built-up member’s cross-section (envelop is 152 x 171 mm) 111
comprising four channel (C) profiles, with two (back-to-back) for the web and two for the 112
flanges. Connections between the channels were made using M10 (stainless) steel bolting in 1 113
mm clearance holes. Bolts were tightened to a torque of 45 Nm. The two Cs for the web of 114
6.5 mm thickness were connected using two bolts and packing plates at spacings of 1/3rd (911 115
mm) and 2/3rd (1822 mm) along the column’s length (L is 2734 mm). As seen in Figure 2(a) 116
there is a bolted connection between a flange in the web and the web of a channel for the 117
member’s flange. In column testing the compressive force is (‘uniformly’) applied directly 118
into the web’s two C-profiles with an area of 3000 mm2. The two Cs forming the flanges are 119
present to increase the built-up column’s lateral flexural stiffness. 120

6
Geometrical and physical properties for the strut member are reported in Table 1. Column (1) 121
defines the property and Column (2) gives its notation. Listed in Column (3) are the cross-122
section’s properties (to three significant figures) for a constant (‘Nominal’) wall thickness of 123
9.5 mm in the four channels. This is the cross-section size for struts, see Figure 1, in the 124
L’Aquila temporary structure (Russo at al. 2012). The equivalent properties in Column (4) 125
are for the cross-section used in the experimental (‘Exp’) investigation, as it comprised three 126
Cs of 6.5 mm thickness (two web and one flange) and one flange C with thicker walls at 9.5 127
mm thickness. The justification for the asymmetric cross-section about the major-axis of 128
bending was to trigger second-order effects from onset of the compression loading. 129
130
EXPERIMENTAL INVESTIGATION 131
The static test configuration for the experimental investigation is illustrated in Figure 2. 132
Figure 2(a) shows the overall column specimen, which can be with or without the third-133
length (at L/3 and 2L/3) bolting (see Figure 2(d)) between the web and the flange Cs. It also 134
shows that at the mid-height section there are eight axial strain gauges (SG1 to SG8) and two 135
displacement transducers numbered [18] and [19]. Images in Figures 2(b) and 2(c) show that 136
the hinge-hinge end condition is realized by using a steel sphere placed between ‘rigid’ steel 137
plates in contact with the PFRP specimen and testing machine. A specimen is placed in the 138
testing machine so that the centre of the cross-sections area is closely aligned with the 139
compression load path. The end fixture allows for unrestrained global flexural or flexural-140
torsional instability deformation to occur. 141
This fact finding test series involved the two column configurations with labels CFG1 and 142
CFG2, having three specimens per batch. CFG1 is for the built-up member with full bolting 143
at four cross-section levels and CFG2 is for without bolting at the two 1/3rd height locations. 144
Removal of the bolting was to facilitate the release of the composite action between the web 145

7
and flange Cs, and can be expected to expose the effectiveness of using spaced bolt rows in 146
built-up members. Note that the equivalent bolting located close to the two free ends cannot 147
be removed. One objective of the study was to establish the level of composite action from 148
having made the design decision to have bolting at the 1/3rd length spacing. 149
Compression force was applied using a computer controlled universal testing machine of 600 150
tonne (6000 kN) capacity. To measure the (longitudinal) response the specimen, at L/2 (1367 151
mm), has the eight strain gauges (SG1 to SG8) shown in Figure 2(a). SG1, SG2 and SG6 are 152
on the flange C-section of 9.5 mm thickness, whilst SG3 to SG5 are on the other flange C-153
section of 6.5 mm thickness. Gauges SG7 and SG8 are positioned at the centre of the two 154
back-to-back Cs forming the the web. Measurement of lateral displacement along the Minor-155
axis and Major-axis planes was made using displacement transducers. Transducers [18] and 156
[19] are located at mid-height. For the flexural deformation about the Minor-axis there is 157
third transducer, labeled [20], that is located at L/4 (684 mm) (see Fig. 2(a)). Because the 158
half-wave length(s) for potential local instabilities was unknown no transducers were 159
involved with the requirement to pick-up deformation signaling local buckling failure. The 160
origin for the length of the column specimen is at the base of the specimen. 161
162
Test Results 163
Results for the two column configurations of CFG1 and CFG2 are plotted in Figures 3 to 8. 164
Figures 3 to 5 are for the three CFG1 specimens, whilst Figures 6 to 8 are for the three CFG2 165
columns. In each of the figures, part (a) reports, at L/2, the axial strains from SG1 to SG 8, 166
and part (b) gives the lateral displacements at L/4 from [20] and at L/2 from [18] and [19] for 167
the Major axis and Minor axis components. The plot axes are the same in part (a) for the 168
compressive strain and average compressive stress (with σ positive), calculated using the 169
(mid-height) cross-section area A from Column (4) in Table 1. The compressive stress given 170

8
in the figures is for the axial compression load alone. It does not therefore represent the 171
highest fiber compression stress due to the combination of axial and flexural deformations. 172
Because the flexural deformation can occur in two directions about the principal axes the 173
abscissa axis in part (b) of Figures 3 to 8 is specific to the test. To highlight the load carrying 174
capacity of the columns the ordinate axis in part (b) is for the applied compression force. 175
The eight strain gauge readings in Part (a) of Figures 3 to 5 show that the CFG1 cross-section 176
in tests 1 to 3 is initially compressed with a fairly uniform compressive stress. Significant 177
divergence between the eight stress-strain curves is recorded when the load exceeds 55 kN 178
(or 8.3 MPa) in test 1 (Figure 3), 117 kN (or 17.8 MPa) in test 2 (Figures 4) and 78 kN (or 179
11.8 MPa) in test 3 (Figure 5). Below this transition state the difference between the 180
minimum and maximum strains is 52%, 47% and 36% respectively. Afterwards the presence 181
of deformations associated with individual-section flexural buckling and/or built-up member 182
flexural buckling radically alters a column’s response. This behavior causes a sudden 183
increase in the difference between the minimum and maximum strains to 86%, 80% and 83%. 184
The main difference in response is observed by a relatively higher increase in the SG7 and 185
SG8 strains for the two web Cs. One reason to explain this observation is that the 186
compression loading is only applied over the web area. The flanges are free from the 187
externally applied load and are only influenced by the composite action (force transfer) at the 188
rows of bolting. Another reason is found from analyzing the results of the Eigenvalue 189
buckling analysis as it shows SG7 and SG8 are positioned in a region with relative lower 190
flexure strains. 191
The specific lateral deformation curves plotted in Figure 5(b) for CFG1 test 3 shows that the 192
(negative) displacement measured by transducer [20] at L/4, c.f. with [19], was actually 193
picking-up a deflection from the pronounced development of a C-section flexural buckling 194
failure. In CFG1 test 1 (Figure 3(b)) and CFG1 test 2 (Figure 4(b)) the equivalent 195

9
displacements recorded by [19] at L/2 and at L/4 by [20] were registering a deformation for a 196
failure by overall global (flexural) buckling. It is noted that flexural buckling of individual 197
flange Cs is also being identified by the displacement measurements from transducer [18] at 198
L/2. 199
It was found that the CFG1 columns in tests 1 and 2 ultimately failed by local crushing at one 200
end. Photographs for this failure mechanism from tests 1 and 2 are given in Figures 9(a) and 201
9(b), respectively. It is noted that based on the ratio of cross-sectional areas the average stress 202
over the web area (of 3000 mm2) at rupture is 1.8 times the average stress given in Figure 203
3(a) and 4(a). Crushing was not the expected mode of ultimate failure and its existence in 204
more than one specimen shows that load transfer into the ends of web was not uniform during 205
testing. Such non-uniformity in the stress field from the presence of geometric imperfections 206
(here from specimen and mounting fixtures on test machine) can be expected on site. It is 207
important to recognize that design for member resistance based on assuming uniform stress 208
could lead to a unsafe member that might fail with a mode not designed against. 209
From the strain gauges data reported in Figure 3(a) it is observed that the increased 210
transversal stiffness in CFG1 test 1, guaranteed by having the 1/3rd height bolting, has 211
prevented an asymmetric distribution of the direct strain profiles in the two flanges of 9.5 and 212
6 mm thickness. It is found that there is strong evidence for a nearly uniform response in the 213
full built-up section. A different strain distribution in the two flange thicknesses is observed 214
in Figures 4(a) and 5(a) for tests 2 and 3. For these CFG1 columns there is a strain divergence 215
within a group of three gauges of 60% in test 2 and 50% in test 3. This change in response is 216
showing the presence, only in the thinner flange section, of second-order deformations. 217
Taking the three strain readings from the thicker flange gauges it is seen that the difference is 218
less, at 50% in test 2 and 25% in test 3. 219

10
The measured responses of the three CFG2 columns are presented in Figures 6 to 8. As seen 220
from the curves plotted in Figures 6(a) and 7(a) there is a linearly increasing (uniform) stress 221
at mid-height up to 40 kN (or 6 MPa). On further increasing compression the strain curves 222
commence their divergence due to the non-linear response, and when one of the strain gauges 223
recorded a tensile response it was signaling the onset of global (flexural) buckling. From 224
measurements and visual inspection it is observed that, as a consequence of forces being 225
transferred from the web Cs into the flanges through the bolting only at the ends, flexural 226
deformation is induced in the flanges about the member’s Major-axis plane and there is 227
torsional deformation too. This form of buckling response was not seen in test 3. This CFG2 228
column was found to fail by local crushing at one end. 229
The reduced transversal stiffness in configuration CFG2, after removal of the bolting, 230
allowed for the generation of flexural buckling and torsional deformations in both flanges. 231
Evidence for this change in response from the CFG1 columns is seen by the higher 232
divergence in the group of strain reading reported in part (a) of Figures 6 and 7. 233
Because there is a very noticeable reduction in column axial stiffness for CFG2 test 1 in 234
Figure 6(b) and test 2 in Figure 7(b) when the load is above 40 kN the response has 235
dramatically changed by the presence of flexural buckling of the individual flange Cs that are 236
no longer connected to the web at the third-lengths. 237
238
COLUMN ANALYSIS 239
A preliminary evaluation of the resistances of the two column configurations was made using 240
three different numerical approaches with the PFRP material taken to be linear elastic (Bank 241
2006). In what follows there is a presentation on using the Engesser (1889) closed form 242
equation, and Eigenvalue (for bifurcation buckling) and geometrical non-linear finite element 243
analyses. The latter analysis provided numerical stresses and displacements for a comparison 244
11
with the measured direct stress-lateral displacements via the strains measured by gauges SG1 245
and SG8 and the y-displacement from gauge [19]. 246
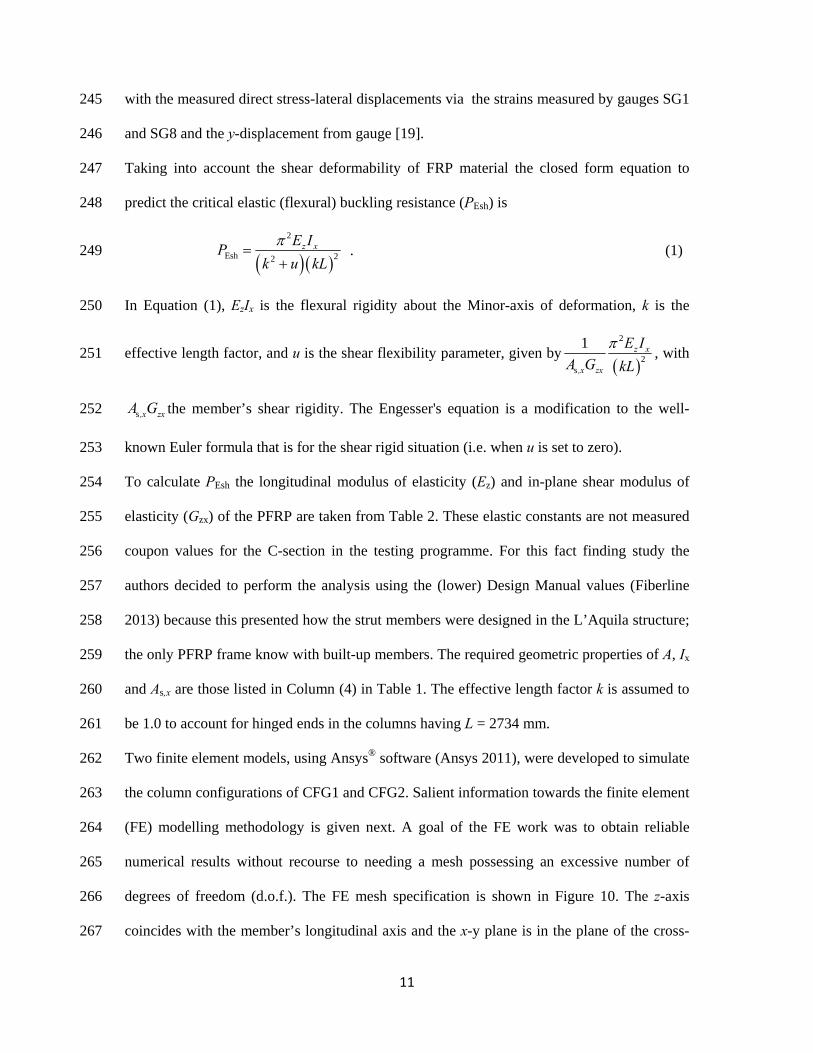
Taking into account the shear deformability of FRP material the closed form equation to 247
predict the critical elastic (flexural) buckling resistance (PEsh) is 248
2
Esh 22
z xE IP
k u kL
. (1) 249
In Equation (1), EzIx is the flexural rigidity about the Minor-axis of deformation, k is the 250
effective length factor, and u is the shear flexibility parameter, given by
2
2s
1 z x
,x zx
E I
A G kL
, with 251
s ,x zxA G the member’s shear rigidity. The Engesser's equation is a modification to the well-252
known Euler formula that is for the shear rigid situation (i.e. when u is set to zero). 253
To calculate PEsh the longitudinal modulus of elasticity (Ez) and in-plane shear modulus of 254
elasticity (Gzx) of the PFRP are taken from Table 2. These elastic constants are not measured 255
coupon values for the C-section in the testing programme. For this fact finding study the 256
authors decided to perform the analysis using the (lower) Design Manual values (Fiberline 257
2013) because this presented how the strut members were designed in the L’Aquila structure; 258
the only PFRP frame know with built-up members. The required geometric properties of A, Ix 259
and As,x are those listed in Column (4) in Table 1. The effective length factor k is assumed to 260
be 1.0 to account for hinged ends in the columns having L = 2734 mm. 261
Two finite element models, using Ansys® software (Ansys 2011), were developed to simulate 262
the column configurations of CFG1 and CFG2. Salient information towards the finite element 263
(FE) modelling methodology is given next. A goal of the FE work was to obtain reliable 264
numerical results without recourse to needing a mesh possessing an excessive number of 265
degrees of freedom (d.o.f.). The FE mesh specification is shown in Figure 10. The z-axis 266
coincides with the member’s longitudinal axis and the x-y plane is in the plane of the cross-267

12
section. Flange and web Cs were meshed over their mid-plane surfaces by four-node 268
quadrilateral shell elements. The shell element type was SHELL181, which can model the 269
linear elastic response of orthotropic materials in thin-walled sections. Regions of shell 270
elements to create the model were automatically meshed using the mapped meshing 271
algorithm (Ansys 2011). 272
The bolted connections joining the four C sections were modelled by rigid beam elements of 273
type BEAM188. They were manually assigned when building the mesh specification. At the 274
two 1/3rd lengths there were six bolts (see Figure 2(d)), with two in a vertical column to 275
connect the back-to-back Cs forming the web. At the ends of the member there were only the 276
four bolts that are used to join the four web flange outstands to the webs in the two Cs 277
forming the flanges. The location of this bolting in the x-y plane is illustrated in Figure 2(a). 278
At the free ends the web (which extends beyond the free end of the flanges) was connected to 279
a ‘rigid’ square plate that is perpendicular to the longitudinal axis of the member. To model 280
the full specimen length of 2734 mm a rigid beam element, of length 45 mm is fixed to each 281
plate and aligned with the member’s z-axis. The mesh specification had been formulated in 282
such a way to ensure that nodal locations corresponded exactly to bolt hole positions and to 283
where the displacement transducers are located. 284
Nodal d.o.f. at the end of the ‘extension’ beams were restrained in a way that models the two 285
hinges found in the experimental set-up illustrated in Figure 2. At the extreme ends, where 286
the compressive load was applied, the translational d.o.f.s in the x-direction and y-direction 287
and the rotation degree of freedom around the z-axis were restrained. Applied in the z-288
direction, for the initial load factor, is a unit (compressive) load of 1 kN. At the other end of 289
the column model the translational degree of freedom in the z-direction was also fully 290
restrained to complete the displacement boundary conditions. 291

13
The linear elastic FRP is taken to be transversely isotropic (i.e. the behaviour is the same in 292
the x- and y-directions), with the orthotropic elastic constants listed in Column (3) of Table 2. 293
Notation for the elastic constants in Column (1) is given in Column (2). 294
The Eigenvalue solution was carried out using the block Lanczos algorithm (Ansys 2011). 295
For the two simulations of CFG1 and CFG2 the first buckling mode results were extracted. 296
For column-type CFG1 the predicted critical elastic buckling is 230 kN. The buckled (mode) 297
shape is shown in Figure 11 by way of a contour plot along the length of the column for the 298
nodal displacements in the y-direction. The first (Eigenvalue) mode is characterized by 299
Minor-axis global (flexural) buckling of the flanges, accompanied by global flexural buckling 300
of the web C-sections between the bolt rows. Because a bifurcation analysis has been carried 301
out the numerical displacements do not represent the actual test displacements. The contour 302
plots presented in the three figures do allow a qualitative understanding towards the overall 303
buckling response of the built-up member with composite action from bolting at the third 304
lengths. 305
For configuration CFG2 (without bolting at the 1/3rd and 2/3rd lengths) the predicted critical 306
buckling load is much lower at 39 kN. The buckled shape is illustrated in Fig. 12(a) and, as 307
expected, it is dominated by flexural buckling of the thinner (6.5 mm) flange C section. At 308
17% of the CFG1 bifurcation load the significantly lower resistance has to be due to the 309
removal of the very beneficial influence of the composite action from having bolting at the 310
two 1/3rd length levels in CFG1. The CFG2 bolting detailing has therefore been shown to 311
have increased the buckling length of a flange C-section for flexural buckling failure to occur 312
first, and at a compression force that is five times lower than measured in CFG1 test 3 (see 313
Fig. 5). 314
Parts (b) and (c) of Fig. 12 present the Eigenvalue second and third mode shapes for CFG2, 315
with contour plotting for the x- and y-displacement, respectively. The relevance of presenting 316

14
the higher mode shapes is that they are used to define the geometric imperfections and an 317
essential contact pairing (restraining C-section separation) in the modelling methodology for 318
the non-linear FE simulations to follow. 319
A geometric non-linear FEA was also conducted in order to better understand the response of 320
the two column configurations over the loading range. The basic FE model was the same 321
described for the Eigenvalue analysis. For the non-linear analysis the compressive load was 322
applied at one end of the model through consecutive steps. The analysis was performed by 323
applying the automatic load stepping option that enables ANSYS to choose the non-linear 324
solution options, such as: the type of equation solver, the Newton-Raphson solution options, 325
the convergence criteria, the maximum number of iterations. Because the choice of these 326
options influences the speed and numerical precision of the computational solution it was a 327
prudent modeling decision to let the code decide the progression of the non-linear analysis to 328
a buckling mode of failure. 329
In order to execute the non-linear analysis, geometric imperfections were generated 330
consistently with the experimentally observed buckled shapes reproduced in the Eigenvalue 331
analysis. Imperfections are automatically generated by ANSYS® updating the geometry of 332
the FE mesh as a function of a scaling factor related to the mode shapes selected from those 333
computed and illustrated in Figs. 11 and 12. For the generic scaling factor, given notation s, 334
the FE modeling geometry is updated in such a way to have a maximum value of the 335
geometric imperfection equal to s (in the units for the FE mesh), where the position for the 336
maximum amplitude was established from the Eignevalue analysis mode shape. 337
For CFG1 it was recognized that the first mode shape, illustrated in Fig. 11, matched the one 338
experimentally observed. Imperfections were then generated on the base of this mode shape, 339
with three scaling factors (s) set at 1 mm, 2.5 mm and 5 mm. The deformed shape at the last 340
load step from the non-linear analysis is represented in Fig. 13 by a contour plot for the y-341

15
displacements. It is observed that the deformed shape is similar to the first mode shape in Fig. 342
11, calculated by the Eigenvalue analysis. The predicted ultimate load is found to be 178 to 343
213 kN, depending on the scaling factor s; the higher the value of s the lower the resistance of 344
the built-up column is. The failure load was taken as the load in the numerical solution when 345
there was a loss of static equilibrium and an absence of convergence at the next load step. 346
From column-type CFG2 the mode shapes of interest to define the geometric imperfections 347
were the first and third. These modes from the Eigenvalue analysis are illustrated in Parts (a) 348
and (c) of Fig. 12. The second mode shape, shown in Fig. 12(b), cannot be physically 349
activated because of the mechanical interaction (for the composite action) between the flange 350
and the web prevents an inner (towards the web) deflection of the 9.5 mm thick flange 351
channel. In order to eliminate any activation of the second mode shape contact pairs between 352
the thicker flange of 9.5 mm thickness and the 6.5 mm web Cs are introduced along the full 353
column height. This FE modeling feature is shown in Figure 14. Since a gap is present in the 354
FE mesh between web and flanges (because shell elements are located at the mid-surfaces of 355
their thin-walls) the “close initial gap” option is activated for contact modeling (Ansys 2011). 356
In order to activate the first buckling mode in the non-linear analysis with CFG2 it was 357
necessary to apply the geometric imperfection defining this mode shape with s equal to 5 358
mm. Three scaling factors of s = 1 mm, 2.5 mm and 5 mm were employed for the equivalent 359
imperfection associated with the third mode shape, as shown in Fig. 12(c). 360
The deformed shape at the last load step is represented in Fig. 15, together with a contour plot 361
of the displacements in the x-direction (left-sided) and y-direction (right-sided). The 362
deformed shape is characterized by lateral deformation of the thinner (6.5 mm) flange in the 363
x-direction and of the web in the y-direction. The ultimate load is found to be 45 to 56 kN, 364
depending on the scaling factor s chosen for the third mode shape; again, the larger s is the 365
lower is the resistance. 366

16
367
Comparison between numerical and test results 368
Table 3 is used to make a comparison between the experimental and numerical determined 369
resistances of columns CFG1 and CFG2. Column (1) gives the label for the six specimens 370
and Column (2) reports their ultimate test load, and when occurring their buckling load, 371
which is given between parentheses. Columns (3) and (4) give the flexural buckling 372
resistance as determined by the Euler and Engesser closed form equations, respectively. By 373
including shear deformation, PEsh (from Equation (1)) is about 5% lower; a similar percentage 374
reduction with concentrically loaded pultruded columns of H-shapes has been established by 375
Mottram et al. (2003). Columns (5) and (6) present the bifurcation and non-linear FEA results 376
employing the modelling methodology introduced above. Section properties are taken from 377
Table 1 and the elastic constants are from Table 2 (they were not determined using coupons 378
cut from the C sections in the built-up specimens). 379
A form of buckling failure was not realised with configuration CFG1 in tests 1 and 2. The 380
experimental ultimate loads of 148 kN and 249 kN were established by local compressive 381
crushing of the web at one end. The considerable difference of 68% (or 101 kN) is solely due 382
to the technical challenge of ensuring there is a uniform distribution of the load over the 383
web’s total area of 3000 mm2. A possible reason for why the failure load in test 2 exceeded 384
the upper bound Eigenvalue buckling load of 230 kN is that the shape of the out-of-385
straightness imperfection for Minor-axis flexural buckling at the beginning of testing was for 386
a higher mode. Supporting this proposal is the similar experimental response reported from 387
test number 11 (H-profile of 152x152x9.53 mm at length 3300 mm) in the series of 388
concentrically loaded column tests by Mottram et al. (2003). 389
The ultimate and buckling load of 193 kN from CFG1 test 3 is seen to be 85% of the critical 390
load of 230 kN by the Eigenvalue FEA. A higher critical elastic buckling load is to be 391

17
expected from an Eigenvalue analysis because the influence of the imperfections present in 392
testing will ensure the measured resistance is lower, if not significantly so. It is observed that 393
the buckling shape established in the FEA and presented in Fig. 11 is found to correspond to 394
that visually observed in CFG1 test 3. 395
It is found that the FEA bifurcation load is 70% of the Engesser flexural buckling resistance 396
of 331 kN. This latter is computed under the hypothesis of full composite action, whereas the 397
degree of mechanical interaction between the four channels is taken into account in the FE 398
analysis, leading to a lower buckling load that is found to be closer to the experimental 399
buckling load. This finding suggests that FEA is required to establish the buckling resistance 400
of built-up compression struts when the degree of composite action between individual 401
sections has a significant role in controlling structural performance. 402
In Fig. 16 the test data from CFG1 tests 1 to 3 for the y-displacement at mid-height is 403
compared with the equivalent non-linear prediction for a compressive force to ultimate 404
failure. Unfilled symbols are for experimental results (square for test 1, triangle for test 2 and 405
rhombus for test 3), while filled symbols are for FE results (square for s = 1 mm, triangle for 406
s = 2.5 mm and rhombus for s = 5 mm). For the FEA curves the three scaling factors are for 407
the imposed geometric imperfections in mesh specification. It can be seen that the range of s 408
values is able to simulate reasonably well the non-linear stiffness behaviour; it is noted that 409
each specimen needs a different s and crushing failure is not captured. 410
Let’s now consider the same comparison for column configuration CFG2. From testing it was 411
found that a form of buckling failure was not achieved in test 3. The bifurcation load of 39 412
kN in Column (5) of Table 3 is seen to be within 1 kN of the experimental ultimate load 413
achieved in the other two tests. For CFG2 tests 1 and 2 the load-axial displacement curves in 414
Figs. 6 and 7 show that there was a stable post-buckling branch. The FEA predicted buckling 415
shape shown in Fig. 15 is similar to that visually observed in these two tests. 416

18
In Fig. 17 the test results for column configuration CFG2 are compared with the non-linear 417
FEA outputs. The format of the figure is the same as in Fig. 16 for the CFG1 columns, except 418
that the three scaling factors (i.e. s set at 1 mm, 2.5 mm or 5 mm) are for the third buckling 419
mode shape (see Fig. 12(c)). A constant scaling factor of 5 mm was applied to the geometric 420
imperfection of a half sine wave along the column length for the first mode shape. It can be 421
seen that with scaling factors of 1 and 2.5 mm with the third mode the computational curves 422
tend to fit the measured response of test 2. Modelling requires s to be set to 5 mm for the 423
FEA curve to correspond to what was found in test 1. 424
425
CONCLUDING REMARKS 426
A fact finding study has been made on the structural response of a built-up column (envelop 427
is 152 x 171 mm) of length 2.734 m subjected to (concentric) compressive loading. To 428
understand the behavior the study combined physical testing and (linear elastic material) 429
numerical approaches. Mechanical performances from three columns, for the configuration 430
that is similar to the strut members in the FRP structure inside the church of Santa Maria 431
Paganica in L’Aquila, were found to be dependent on the end boundary conditions. Two of 432
these specimens ultimately failed at one end, by material crushing in the two channel sections 433
forming the web (there is no loading applied into the two flange channel sections). This result 434
was not expected a proiri, and its presence highlights the sensitive of FRP materials to 435
localized failure where concentrated forces are transferred into (and out of) members. 436
In a third test the mode of failure was by global flexural buckling when the compression force 437
was 193 kN. Numerical predictions of 230 kN by Eigenvalue FEA and 331 kN from the 438
Engesser closed form equation were much higher; even when the moduli of elasticity where 439
design manual value that are known to be lower than actual. This finding suggests that there 440
is not full composite action between the four channel sections, and opens up the possibility 441

19
that with additional bolting, say at the sixth length locations, the column buckling strength 442
can be further enhanced. Moreover, by combining experimental and numerical results it is 443
observed that imperfections, geometric and from other sources, have an important role in 444
establishing the structural performance of the built-up columns. 445
From non-linear FEA the ultimate compressive load was in the range 178 to 213 kN 446
depending on the magnitude of the scaling factor in the FE modelling used to define the 447
amplitude of geometric imperfections. This was found to bound the measured buckling 448
resistance from test 3. In the FE modelling it was found that by increasing the scaling factor 449
from 1 to 5 mm there was a decrease in both critical elastic buckling load and the members’ 450
initial axial stiffness. A numerical prediction was observed to be close to what was measured 451
when the scaling factor was either 2.5 or 5 mm. The initial stiffness was found to be 452
underestimated by FEA, unless the lowest geometric imperfection scaling factor of 1 mm was 453
applied. It was established that the computed buckled shape corresponds to that visually 454
observed in test 3. 455
By removing the two rows of bolted connections at the third lengths the much lower column 456
resistance of about 40 kN was determined in two of the three tests with this column 457
configuration. Material crushing at one end was one reason why the three nominally identical 458
columns failed differently. A critical elastic buckling load of 39 kN was predicted by 459
Eigenvalue FEA. It can be concluded that the bolting at third lengths was sufficient, and 460
necessary, for the built-up member to have column strength that was five times higher than if 461
the built-up strut is without the composite action. The largest scaling factor of 5 mm for the 462
first mode shape was found to be the ‘lowest’ that would activated this mode in the non-linear 463
FEA. 464
A reasonable, but not good, agreement between the equivalent numerical and the 465
experimental results was observed prior to the first non-linear branch and before buckling 466

20
deformation occurred. The post-buckling stage that followed in testing had a stable branch 467
that cannot be reliably simulated by FEA. Up to a mid-height lateral displacement of 13 mm 468
(or 1/200 of column height) there was little difference between FEA and testing for flexure 469
occurring about the minor-axis. Continuing to increasing load it was found that the deviation 470
in load-displacement response between the test columns in a group of three may become very 471
significant. The numerical-experimental comparison reported in this paper has shown that the 472
response of built-up FRP members could be challenging to reliably predict by FEA. 473
474
REFERENCES 475
Anonymous (2011). ANSYS® Multiphysics, Release 14.0, Help System, ANSYS Inc. 476
Bank, L. C. (2006). Composites for Construction - Structural Design with FRP Materials, 477
John Wiley & Sons, N.J. 478
Barbero, E. J., Dede, E. K., Jones, S. (2000). “Experimental Verification of Buckling-mode 479
Interaction in Intermediate-length Composite Columns”, International Journal of Solids and 480
Structures, 37(29), 3919-3934. 481
Boscato, G. and Russo, S. (2009). “Free Vibrations of Pultruded FRP Elements: Mechanical 482
Characterization, Analysis, and Applications”, Journal of Composite for Construction, 483
ASCE, 13(6), 565-574. 484
Boscato, G., Mottram, J., Russo, S. (2011). “Dynamic Response of a Sheet Pile of Fiber-485
Reinforced Polymer for Waterfront Barriers”, Journal of Composite for Construction, ASCE, 486
15(6), 974–984. 487
Di Tommaso, A. and Russo, S. (2003). “Shape Influence in Buckling of GFRP Pultruded 488
Columns”, Mechanics of Composite Materials, 39(4), 329-340. 489
Engesser, F. (1889). “Ueber die Knickfestigkeit gerader Stabe”, Zeitschrift für Architekter 490
und Ingenieurwsen, 35(4), 455-462 (in German). 491

21
Fiberline design manual for structural profiles in composite materials. (2013). Fiberline 492
Composites A/S, Kolding, Denmark. 493
Hashem, Z. A. and Yuan, R. L. (2001), “Short vs. Long Column Behavior of Pultruded 494
Glass-fiber Reinforced Polymer Composites”, Construction and Building Materials, 15(8), 495
369-378. 496
Lane, A. and Mottram, J.T. (2002). “The Influence of Modal Coupling upon the Buckling of 497
Concentrically Pultruded Fibre-reinforced Plastic Columns”, Proceedings of the Institution of 498
Mechanical Engineers Part L: J. Materials - Design and Applications, 216 133-144. 499
Mottram, J. T. (2004). “Determination of Critical Load for Flange Buckling in Concentrically 500
Loaded Pultruded Columns”, Composites: Part B Engineering, 35 35-47. 501
Mottram, J. T. (2011). “Does Performance Based Design with Fibre Reinforced Polymer 502
Components and Structures Provide any new Benefits and Challenges?”, The Structural 503
Engineer, 89(6), 23-27. 504
Mottram, J. T., Brown, N. D. and Anderson, D. (2003). “Physical Testing for Concentrically 505
Loaded Columns of Pultruded Glass Fibre Reinforced Plastic Profile”, Structures and 506
Buildings, 156(2), 205-219. 507
Pecce, M. and Cosenza, E. (2000). “Local Buckling Curves for the Design of FRP Profiles”, 508
Thin-Walled Structures, 37(3), 207-222. 509
Russo, S. (2012). “Experimental and Finite Element Analysis of a Very Large Pultruded FRP 510
Structure Subjected to Free Vibration”, Composite Structures, 94(3), 1097-1105. 511
Russo, S. (2007). Strutture in Composito: Sperimentazione, Teoria e Applicazioni, Edited by 512
Ulrico Hoepli, Milano, Italy (in Italian). 513
Russo, S., Boscato, G. and Mottram, J. T. (2012). “Design and Free Vibrations of a Large 514
Temporary Roof FRP structure for the Santa Maria Paganica Church in L’Aquila, Italy”. 515

22
Presented at 6th International Conference on FRP Composites in Civil Engineering (CICE 516
2012), Section 8: All-FRP and Smart FRP Structures, Paper 209, 13th-15th June 2012. 517
Turvey, G. J. and Zhang, Y. (2006). “A Computational and Experimental Analysis of the 518
Buckling, Postbuckling and Initial Failure of Pultruded GRP Columns”, Computers and 519
Structures, 84(22-23), 1527-1537. 520
521
522
Table 1. Physical and geometric properties of four channel profiles. 523
Property
(1)
Notation
(2)
Value
Nominal
(3)
Exp.
(4)
Cross-sectional area of column A 83.2 cm2 65.8 cm2
Minor-axis second moment of area Ix 1370 cm4 1250 cm4
Major-axis second moment of area Iy 3550 cm4 2840 cm4
Minor-axis shear area As,x 37.1 cm2 26.6 cm2
Major-axis shear area As,y 47.7 cm2 38.6 cm2
Bulk weight density of FRP 1850 kg/m3
Volume fraction of E-glass fibre 48%
524
525
526
Table 2. Elastic constants for the C-shape section (Fiberline 2013). 527
Definition
(1)
Notation
(2)
Value
(3)
Longitudinal modulus of elasticity Ez 23 GPa
Transverse modulus of elasticity Ex = Ey 8.5 GPa
Transverse shear modulus of elasticity Gxy 3.4 GPa
In-plane shear modulus of elasticity Gzx = Gzy 3 GPa
Major Poisson’s ratio zx = zy 0.23
Minor Poisson’s ratio xy 0.09
528
529
530
531
532

23
Table 3. Ultimate test loads and numerical elastic loads. 533
Column
specimen
(1)
Ultimate test
load
(buckling
load) [kN]
(2)
Flexural buckling load
from Euler 2
2
Ekl
EIP
[kN]
(3)
PEsh Equ. (1)
[kN]
(4)
Eigenvalue
buckling load
[kN]
(5)
Non-linear
FEA
ultimate load
[kN]
(6)
CFG1 test 1 148
349 331
230 178-213 CFG1 test 2 249
CFG1 test 3 193 (193)
CFG2 test 1 123 (40)
39 46-56 CFG2 test 2 118 (40)
CFG2 test 3 122
534
535

24
536
Figure 1. Temporary FRP structure for Santa Maria Paganica church: (a) overall construction; 537 (b) details of bolted gusset plate for frame joints. 538 539
540
541
Figure 2. Details of PFRP built-up columns: (a) member cross-section and scheme for 542 column testing; (b) actual test set-up; (c) detail of hinge end constraints; (d) M10 steel bolting 543 for composite action between the four C-sections. 544 545

25
546
Figure 3. CFG1 test 1: (a) eight direct stress-direct strain curves; (b) three load-lateral 547 displacement curves. 548 549
550
Figure 4. CFG1 test 2: a) eight direct stress-direct strain curves; (b) three load-lateral 551 displacement curves. 552 553
554
Figure 5. CFG1 test 3: a) eight direct stress-direct strain curves; (b) three load-lateral 555 displacement curves. 556 557

26
558
Figure 6. CFG2 test 1: a) eight direct stress-direct strain curves; (b) three load-lateral 559 displacement curves. 560
561
562
Figure 7. CFG2 test 2: a) eight direct stress-direct strain curves; (b) three load-lateral 563 displacement curves. 564 565
566
Figure 8. CFG2 test 3: a) eight direct stress-direct strain curves; (b) three load-lateral 567 displacement curves. 568 569

27
570
Figure 9. Local end-crushing in column-type CFG1: (a) test 1; (b) test 2. 571 572
573 574
Figure 10. Isometric view of finite elements mesh for built-up column defined in Figure 2. 575 576
577
578
Figure 11. Eigenvalue first mode shape with contour plot for lateral y-displacement for 579 column configuration CFG1. 580 581 582 583

28
584 585
Figure 12. Eigenvalue first mode shape (a), second mode shape (b) and third mode shape (c) 586 with contour plot for lateral x-displacement (a-b) and y-displacement (c) for column 587 configuration CFG2. 588 589 590 591
592
Figure 13. Non-linear FEA deformed shape via lateral y-displacement (mm) for configuration 593 CFG1. 594 595 596

29
597
Figure 14. Locations for contact pairs between web and flange and for rigid-beam elements 598 for the bolted connections when modelling column-type CFG2. 599 600 601
602
Figure 15. Non-linear FEA deformed shape using lateral x-displacment (left) and y-603 displacement (mm) (right) for configuration CFG2. 604 605 606 607

30
608 609
Figure 16. Experimental and non-linear FEA y-displacements with compression force at mid-610 height for CFG1. FEA results with three factors s for the geometric imperfection for the first 611 mode shape. 612 613 614
615 616
Figure 17. Experimental and non-linear FEA lateral y-displacements with compressive load 617 for CFG2 at mid-height. FEA results with three factors s for the geometric imperfection for 618 the third mode shape. 619