Cc 4 t14_eng
19
2014 Earnings Release Conference Call February 9 th , 2015
-
Upload
pineriweb -
Category
Investor Relations
-
view
17 -
download
0
Transcript of Cc 4 t14_eng

2014 Earnings Release Conference Call
February 9th, 2015

2/19Investor Relations | 4Q14 |
2014 Events and Highlights 3
2014 Financial Highlights 4
Product and Revenue Diversification 5
Net Interest Margin 6
Expenses and Efficiency Ratio 7
Loan Portfolio 8
Continuous Loan Portfolio Management 9
Main Sectors – Sugar and Ethanol | Agriculture| Construction 10
Main Sectors – Energy and Infrastructure 11
Loan Portfolio Quality 12
FICC 13
Pine Investimentos 14
Funding 15
Asset & Liability Management 16
Capital Adequacy Ratio (BIS), Basel III 17
2015 Guidance 18
Agenda

3/19Investor Relations | 4Q14 |
2014 Events and Highlights
1.Liquid balance sheet, with cash position of R$1.6 billion, equivalent to 48% of time deposits.
2.Expansion in the positive liquidity gap over the past years, with 12 months for credit versus 16 months for funding.
3.Diversified revenues with positive contributions from all business lines: 74.4% from Corporate Credit, 19.4% from
FICC, 3.3% from Pine Investimentos and 2.9% from Treasury.
4.Active and constant liability management with a reduction in the average cost of funding of 3.6 p.p. of the CDI rate in
the past 12 months.
5. Increase of 0.5 p.p. in the Tier I BIS ratio over 2014 reaching 13.9% of total capital, representing 26.4% higher than
the minimum required by the Brazilian Central Bank.
6.Execution of two transactions of the Pine-DEG partnership, totaling US$43 million in 2014.
7.16th largest bank in derivative transactions and the 2nd largest in commodity derivatives segment according to CETIP
– OTC Clearing House.

4/19Investor Relations | 4Q14 |
4.8% 4.3%
2013 2014
NIM Evolution
-0.5 p.p.
162 97
2013 2014
Net Income
-40.1%
9,930 9,826
Dec-13 Dec-14
Total Loan Portfolio'
-1.0%
8,383 8,500
Dec-13 Dec-14
Total Funding
+1.4%
2014 Financial Highlights
1 Includes Stand by LCs, Bank Guarantees, Credit Securities to be Received and Securities (bonds, CRIs, eurobonds and fund shares)
R$ million
The main performance indicators were within expectations in the period...
1,272 1,256
Dec-13 Dec-14
Shareholders' Equity
-1.3%
13.0%
7.6%
2013 2014
ROAE
-5.4 p.p.

5/19Investor Relations | 4Q14 |
2.8 3.0
2.8
Dec-12 Dec-13 Dec-14
39% 38% 40%
61% 62% 60%
Dec-12 Dec-13 Dec-14
1 Product More than 1 product
Corporate Credit62.9%
FICC27.9%
Pine Investimentos
5.5%
Treasury3.7%
2013
Corporate Credit74.4%
FICC19.4%
Pine Investimentos
3.3%
Treasury2.9%
2014
Product and Revenue Diversification... with contributions from all business lines.
Clients with more than one product Penetration Ratio – Clients with more than one product
Revenue Mix
6/19Investor Relations | 4Q14 |
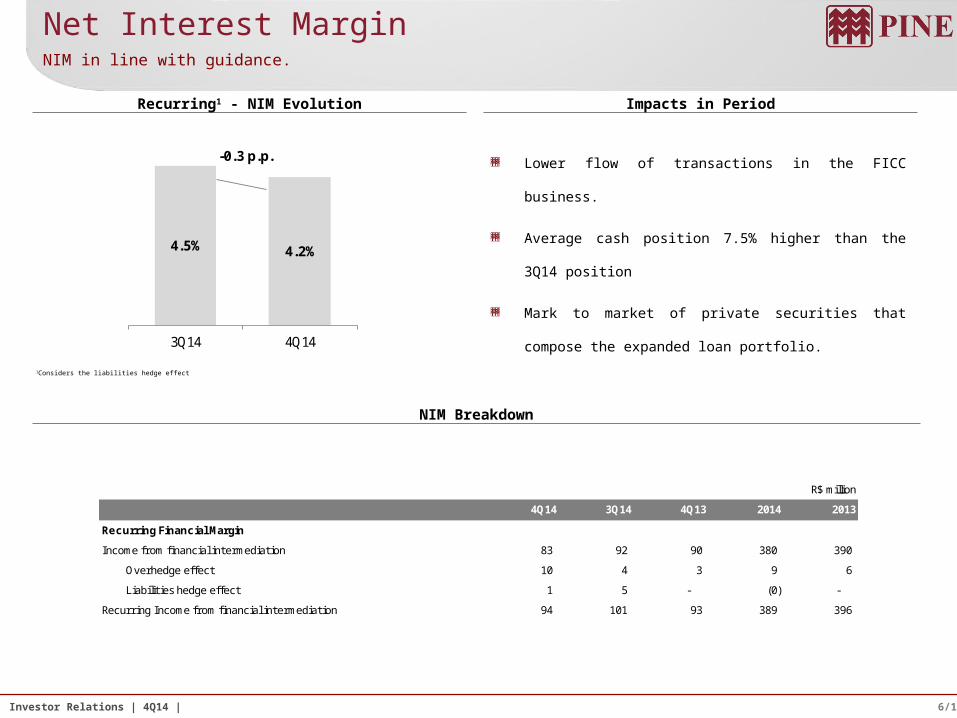
4.5% 4.2%
3Q14 4Q14
-0.3 p.p.
Net Interest Margin
Recurring1 - NIM Evolution Impacts in Period
NIM Breakdown
NIM in line with guidance.
1Considers the liabilities hedge effect
Lower flow of transactions in the FICC business.
Average cash position 7.5% higher than the 3Q14
position
Mark to market of private securities that compose the
expanded loan portfolio.
R$ million
4Q14 3Q14 4Q13 2014 2013
Recurring Financial Margin
Income from financial intermediation 83 92 90 380 390
Overhedge effect 10 4 3 9 6
Liabilities hedge effect 1 5 - (0) -
Recurring Income from financial intermediation 94 101 93 389 396
7/19Investor Relations | 4Q14 |
R$ million
4Q14 3Q14 4Q13 2014 2013
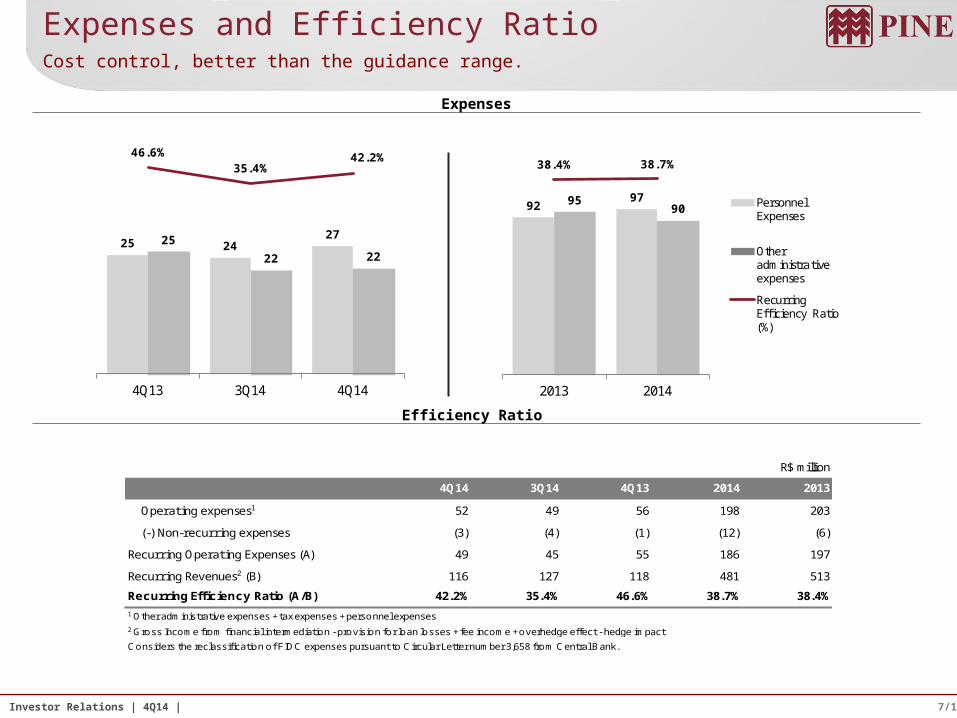
Operating expenses1 52 49 56 198 203
(-) Non-recurring expenses (3) (4) (1) (12) (6)
Recurring Operating Expenses (A) 49 45 55 186 197
Recurring Revenues2 (B) 116 127 118 481 513
Recurring Efficiency Ratio (A/B) 42.2% 35.4% 46.6% 38.7% 38.4%
1 Other administrative expenses + tax expenses + personnel expenses2 Gross Income from financial intermediation - provision for loan losses + fee income + overhedge effect - hedge impact
Considers the reclassification of FIDC expenses pursuant to Circular Letter number 3,658 from Central Bank.
Expenses and Efficiency Ratio
Expenses
Efficiency Ratio
Cost control, better than the guidance range.
25 242725
22 22
46.6%35.4%
42.2%
- 1 0 0 . 0 %
- 8 0 . 0 %
- 6 0 . 0 %
- 4 0 . 0 %
- 2 0 . 0 %
0 . 0 %
2 0 . 0 %
4 0 . 0 %
6 0 . 0 %
0
5
1 0
1 5
2 0
2 5
3 0
3 5
4 0
4 5
5 0
4Q13 3Q14 4Q14
929795
90
38.4% 38.7%
- 1 0 0 . 0 %
- 8 0 . 0 %
- 6 0 . 0 %
- 4 0 . 0 %
- 2 0 . 0 %
0 . 0 %
2 0 . 0 %
4 0 . 0 %
6 0 . 0 %
0
2 0
4 0
6 0
8 0
1 0 0
1 2 0
1 4 0
2013 2014
Personnel Expenses
Other administrative expenses
Recurring Efficiency Ratio (%)

8/19Investor Relations | 4Q14 |
4,200 4,236 4,284 4,509 5,050 5,092 4,904 4,731 4,730
853 826 844 990
1,068 1,103 1,071 1,248 1,302
2,114 2,501
2,807
3,073
2,909 2,905 2,941 2,896 2,969 781
842
1,059
965
903 989 1,116 924 826
Dec-12 Mar-13 Jun-13 Sept-13 Dec-13 Mar-14 Jun-14 Sept-14 Dec-14
Trade finance: 8.4%
Bank Guarantees: 30.2%
BNDES Onlending: 13.3%
Working Capital: 48.1%
7,9488,405
8,994
9,5379,930
10,090 10,0329,800 9,826
-1.0%
+0.3%
1 Includes Stand by LC2 Includes debentures, CRIs, Hedge Fund Shares, Eurobonds, Credit Portfolio acquired from financial institutions with recourse and Individuals
R$ million
Loan PortfolioThe portfolio ended the period at R$9.8 billion...
9/19Investor Relations | 4Q14 |
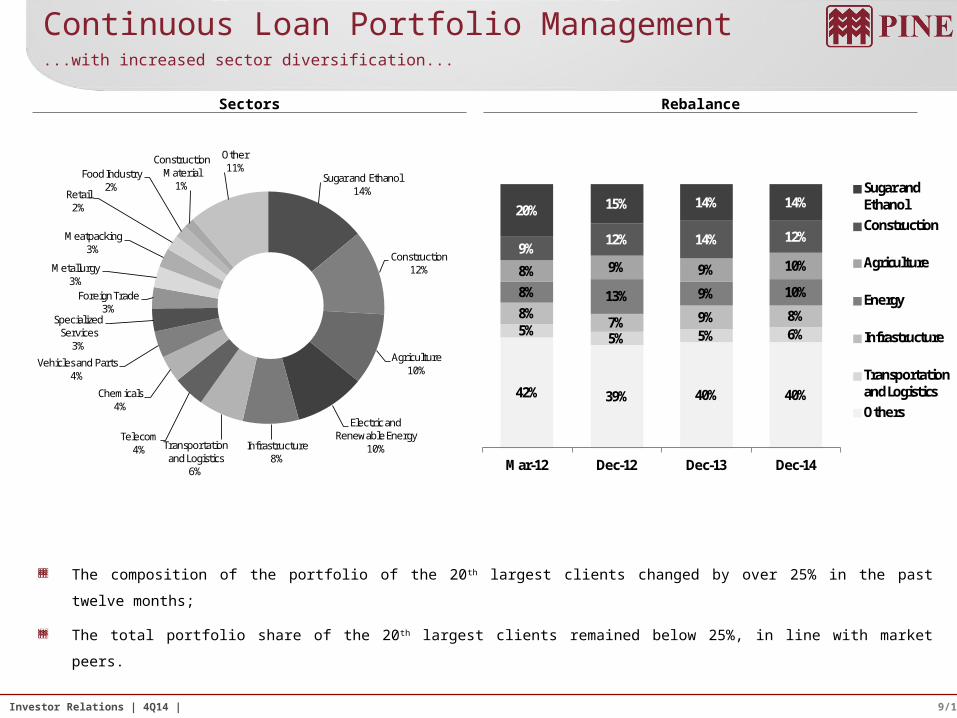
40%40%39%42%
6%5%5%5%8%9%7%
8%10%9%13%8%
10%9%9%8%
12%14%12%9%
14%14%15%20%
Dec-14Dec-13Dec-12Mar-12
Sugar and EthanolConstruction
Agriculture
Energy
Infrastructure
Transportation and LogisticsOthers
Sugar and Ethanol14%
Construction12%
Agriculture10%
Electric and Renewable Energy
10%Infrastructure8%
Transportation and Logistics
6%
Telecom4%
Chemicals4%
Vehicles and Parts4%
Specialized Services
3%
Foreign Trade3%
Metallurgy3%
Meatpacking3%
Retail2%
Food Industry2%
Construction Material
1%
Other11%
Dec-14
Continuous Loan Portfolio Management
Sectors Rebalance
...with increased sector diversification...
The composition of the portfolio of the 20th largest clients changed by over 25% in the past twelve months;
The total portfolio share of the 20th largest clients remained below 25%, in line with market peers.

10/19Investor Relations | 4Q14 |
Working Capital60%
Trade Finance
23%
Onlending16%
Guarantees1%
MT47%
SP31%
PR9% BA
5%NE3%
GO2% RS
2%
MG1%
Working Capital45%
Guarantees40%
Onlending12%
Trade Finance
3%
Working Capital79%
Guarantees21%
Residential Lots38%
Residential38%
Warehouse15%
Mall6%
Commercial3%
Main SectorsSugar and Ethanol | Agriculture| Construction
Sugar and Ethanol Agriculture
Construction
Exposure by State Exposure by Product Exposure by State Exposure by Product
Exposure by Segment Exposure by Product
SP77%
MG15%
PR5%
MS3%
GO1%

11/19Investor Relations | 4Q14 |
Working Capital85%
Guarantees11%
BNDES Onlending
4%
Concession33%
Transportation29%
Industrial27%
Oil and Gas7%
Energy4%
Guarantees72%
Working Capital19%
BNDES Onlending
9%
Wind Energy68%Transmitting
11%
Equipment Supplier
8%
Distributors7%
SHPs UHEs3%
UTE2%
Trader1%
Main SectorsEnergy and Infrastructure
Energy Infrastructure
Exposure by Segment Exposure by Segment
Exposure by Product
Exposure by Product

12/19Investor Relations | 4Q14 |
1.2% 1.2% 1.1%
0.7%
0.1%
0.7%
0.3% 0.3%
1.1%
Dec-12 Mar-13 J un-13 Sep-13 Dec-13 Mar-14 J un-14 Sep-14 Dec-14
5.8%
4.2%5.0%
2.9%2.1%
2.9%
0.0%
2.0%
4.0%
6.0%
8.0%
10.0%
12.0%
0.0%1.0%2.0%3.0%4.0%5.0%6.0%7.0%8.0%9.0%
10.0%
Dec-13 Sept-14 Dec-14
D-H Portfolio Coverage of Total Portfolio
AA-A42.7%
B35.2%
C17.1%
D-E2.6%
F-H2.4%
December 30th, 2014
Contracts Overdue: total amount of the contracts overdue for more than 90 days / Loan Portfolio excluding Bank Guarantees and Stand-by Letters of Credit.
1D-H Portfolio: D-H Portfolio / Loan Portfolio Res. 2,6822Covegare of Total Portfolio: Provisions / Loan Portfolio Res. 2,682
Loan Portfolio Quality95% of loan portfolio classified between AA-C ratings.
Loan Portfolio Quality – Res. 2,682
Credit Coverage
Non Performing Loans > 90 days (Total Contract)
Collaterals
Products Pledge42%
Receivables18%
Properties Pledge37%
Investments3%

13/19Investor Relations | 4Q14 |
December 30th, 2014
Scenario on December 30th:
Duration: 154 days
Mark-to-Market: R$221 million
Efficient capital allocation with reference equity required of only R$35 million
Stress Scenario (Dollar: +31% and Commodities Prices: -30%):
Stressed MtM : (R$365 million)
R$ million
FICCProven trackrecord: 2nd in commodity derivatives1.
Client Notional Derivatives by Market
Market Segments
Notional Value and MtM
Portfolio Profile
1Fonte: Reporte Cetip, December 2014
FixedIncome: Fixed, Floating, Inflation, Libor
Currencies: Dollar, Euro, Yen, Pound, Canadian Dollar,Australian Dollar
Commodities: Sugar, Soybean (Grain, Meal and Oil), Corn,Cotton, Metals, Energy
11,148 11,268 14,382 8,376 7,703
327
482
354 288 221
(310)(243)
(532)
(47)
(365)
Dec-13 Mar-14 J un-14 Sept-14 Dec-14
Notional Amount
MtM
Stressed MtM
Commodities15%
Fixed Income8%
Currencies77%

14/19Investor Relations | 4Q14 |
R$ million
Pine Investimentos
Volume of Underwriting Transactions
Selected Transactions
Capital Markets: Structuring and Distribution of
Fixed Income Transactions.
Financial Advisory: Project & Structured Finance,
M&A, and hybrid capital transactions.
Research: Macro, Commodities, and Corporate.
1,040
2,073
1,294
1,973
506
2012 2013 2014Local Market International Market
1,800
1,040
4,046August, 2014
Export Prepayment Finance
Structuring Agent
August, 2014
Long Term Loan
Financial Advisor
US$58,000,000R$25,000,000
R$391,459,000
J uly, 2014
Project Finance
Financial Advisor
R$459,300,000
J une, 2014
M&A
Advisor
R$ 75.000.000
March, 2014
CRI (ICVM 476)
Lead Cordinator
September, 2014
Debentures
R$50,000,000
Lead Coordinator
R$40,000,000
December, 2014
Lead Cordinator
CCB
R$45,200,000
November, 2014
Debentures
Lead Coordinator
December, 2014
BNDES Onlending
R$630,000,000
Coordinator

15/19Investor Relations | 4Q14 |
R$ million
+1.4%
FundingDiversified sources of funding...
58%
50%
42%
44%
41%
39%
41%
35%
48%
Cash over Deposits
-1.6%
2,167 2,087 2,185 1,944 2,175 2,314 2,271 1,905 1,720
1,174 972 1,013
1,048 1,112 1,022
761 731
545
224 225 254 372
475 659 908
920 1,122
121 110 110 93
90 76 80
98 69
30 126 19 20
23 27 41
30 27 903
859 862 1,099 1,141
1,174 1,086 1,292
1,333
277 154 286
649
632 582 594 709
635 624 642
689
762
792 833
508 892 747 409
402 435
437
459 434
427 323
347 152
78 80
69
113 364
346 388
687
173
171 181
429
500
478
473 531 430
808
762 997
973
871
834 1,064
819 839
7,0626,589
7,111
7,8948,383
8,7978,559 8,638 8,500
Dec-12 Mar-13 Jun-13 Sept-13 Dec-13 Mar-14 Jun-14 Sept-14 Dec-14
Trade Finance: 9.9%
Private Placements: 5.1%
Multilateral Lines: 8.1%
International Capital Markets: 4.1%
Financial Letter : 8.8%
Local Capital Markets: 7.5%
Onlending: 15.7%
Demand Deposits: 0.3%
Interbank Time Deposits: 0.8%
High Net Worth Individual Time Deposits: 13.2%
Corporate Time Deposits: 6.4%
Institutional Time Deposits: 20.2%
16/19Investor Relations | 4Q14 |
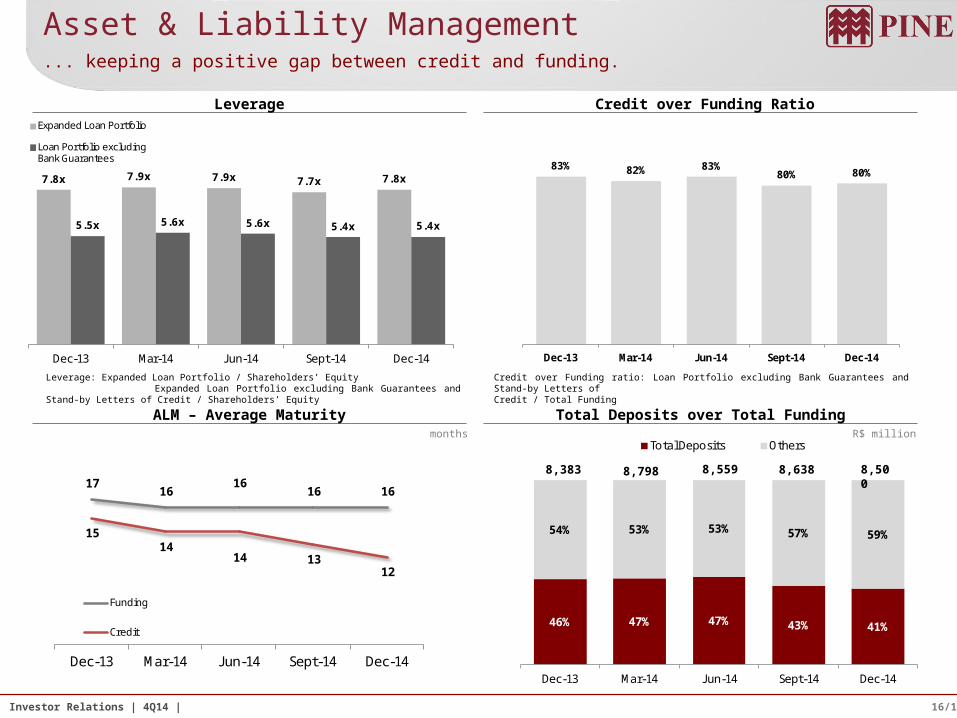
46% 47% 47% 43% 41%
54% 53% 53% 57% 59%
Dec-13 Mar-14 J un-14 Sept-14 Dec-14
Total Deposits Others
83% 82% 83%80% 80%
Dec-13 Mar-14 Jun-14 Sept-14 Dec-14
7.8x 7.9x 7.9x 7.7x 7.8x
5.5x 5.6x 5.6x 5.4x 5.4x
-
1 . 0
2 . 0
3 . 0
4 . 0
5 . 0
6 . 0
7 . 0
8 . 0
9 . 0
1 0 . 0
Dec-13 Mar-14 J un-14 Sept-14 Dec-14
Expanded Loan Portfolio
Loan Portfolio excluding Bank Guarantees
17 16
16 16 16
15 14
14 13 12
Dec-13 Mar-14 J un-14 Sept-14 Dec-14
Funding
Credit
Leverage: Expanded Loan Portfolio / Shareholders’ Equity Expanded Loan Portfolio excluding Bank Guarantees and Stand-by Letters of Credit / Shareholders’ Equity
Credit over Funding ratio: Loan Portfolio excluding Bank Guarantees and Stand-by Letters ofCredit / Total Funding
Asset & Liability Management... keeping a positive gap between credit and funding.
Leverage
ALM – Average Maturity
Credit over Funding Ratio
Total Deposits over Total FundingR$ millionmonths
8,6388,383 8,798 8,559 8,500

17/19Investor Relations | 4Q14 |
R$ Million BIS (%)
Tier I 1,256 12.5%
Tier II 146 1.4%
Total 1,402 13.9%
Capital Adequacy Ratio (BIS), Basel III BIS ratio reached 13.9%.
13.4%15.0% 14.7% 13.7%
12.0% 12.2% 12.2% 12.4% 12.5%
2.8%2.1% 2.3%
2.2%
2.1% 1.5% 1.5% 1.4% 1.4%
16.2%17.1% 17.0%
15.9%
14.1% 13.7% 13.7% 13.8% 13.9%
Dec-12 Mar-13 Jun-13 Sept-13 Dec-13 Mar-14 Jun-14 Sept-14 Dec-14
Tier II Tier I
Minimum Regulatory Capital (11%)
18/19Investor Relations | 4Q14 |
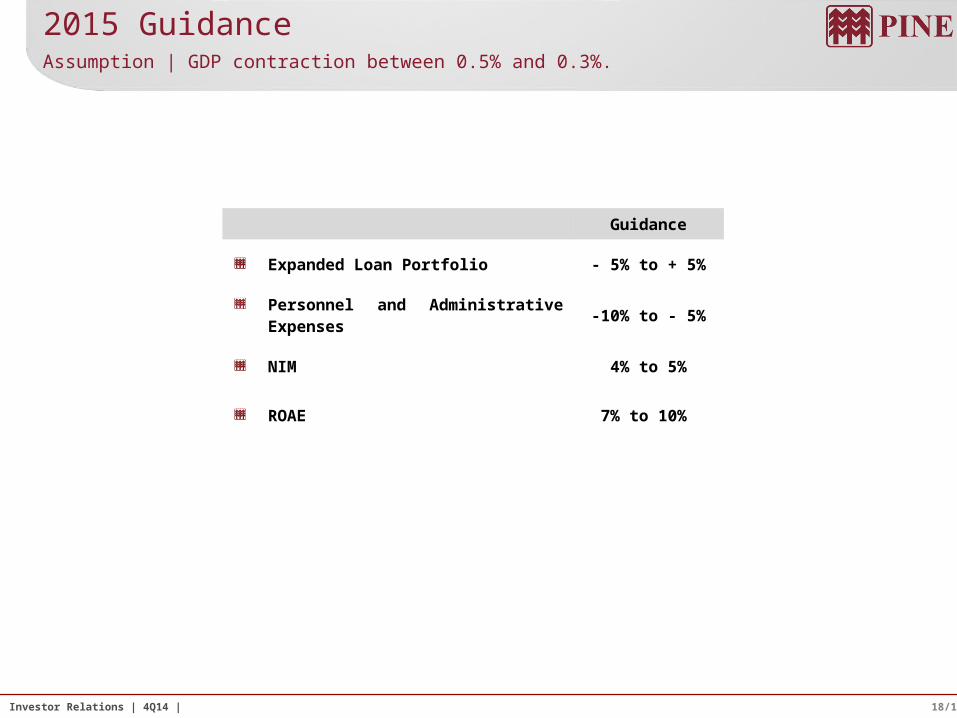
2015 GuidanceAssumption | GDP contraction between 0.5% and 0.3%.
Guidance
Expanded Loan Portfolio - 5% to + 5%
Personnel and Administrative Expenses
-10% to - 5%
NIM 4% to 5%
ROAE 7% to 10%
19/19Investor Relations | 4Q14 |
This report may contain forward-looking statements concerning the business prospects, projections of operating and financial results and growth outlook of PINE. These are merely projections and as such are based solely on management’s expectations regarding the future of the business. These statements depend substantially on market conditions, the performance of the sector and the Brazilian economy (political and economic changes, volatility in interest and exchange rates, technological changes, inflation, financial disintermediation, competitive pressures on products and prices and changes in tax legislation) and therefore are subject to change without prior notice.
Noberto N. Pinheiro Junior
CEO
Norberto Zaiet Junior
CFO/IRO
Raquel VarelaHead of Investor Relations, Marketing & Press
Luiz MaximoInvestor Relations Specialist
Ana LopesInvestor Relations Analyst
Gabriel NettoInvestor Relations Assistent
Phone: (55 11) 3372-5343
www.pine.com/[email protected]
Investor Relations