Cavite Integrated Water Resource Master Plan
157
Cavite Integrated Water Resource Management Master Plan i TABLE OF CONTENTS Page Chapter 1 Introduction ........................................................................................... 1-1 1.1 Review of Cavite‘s previous initiatives towards integration ...................... 1-2 1.2 Cavite Integrated Water Resource Management Plan ............................. 1-3 Chapter 2 Provincial Physical and Socio-Economic Profile ................................ 2-1 2.1 Physical Environment .............................................................................. 2-1 2.1.1 Geographic Setting ...................................................................... 2-1 2.1.2 Physical Features ........................................................................ 2-3 2.1.3 Meteorology ............................................................................... 2-13 2.2 Infrastructure ......................................................................................... 2-16 2.2.1 Transportation............................................................................ 2-16 2.2.2 Communication .......................................................................... 2-16 2.2.3 Water Supply ............................................................................. 2-17 2.2.4 Existing Water Service Providers ............................................... 2-19 2.2.5 Sanitation and Sewerage ........................................................... 2-21 2.2.6 Solid Waste Disposal Systems................................................... 2-23 2.3 Socio-Economic and Demographic Environment ..................................... 2-1 2.3.1 Population, Density and Growth Rate .......................................... 2-1 2.3.2 Urban-Rural Population Structure ................................................ 2-2 2.3.3 Age Structure and Dependency Ratio .......................................... 2-4 2.3.4 Number of Households and Household Size ................................ 2-5 2.3.5 Income Levels and Profile ............................................................ 2-6 2.3.6 Labor Force and Employment Structure ....................................... 2-7 2.3.7 Health Indicators .......................................................................... 2-8 2.3.8 Demographic and Employment Projections.................................. 2-9 2.4 Economic Structure ................................................................................. 2-1 2.4.1 Gross Regional Domestic Product (GRDP) by Industrial Origin: CALABARZON ................................................................. 2-1 2.4.2 Agriculture, Fishery, Poultry and Livestock................................... 2-1 2.4.3 Industry, Commerce and Trade.................................................... 2-5 Chapter 3 Water Demand Assessment ................................................................. 3-1 3.1 Population Projections ............................................................................. 3-1 3.2 Water Demand Projections ...................................................................... 3-2 3.2.1 Domestic (Municipal) Water Demand ........................................... 3-2 3.2.2 Agricultural Water Requirements.................................................. 3-4 3.2.3 Industrial Water Demand............................................................ 3-11 3.2.4 Recreation ................................................................................. 3-13 3.2.5 Power Generation ...................................................................... 3-14 3.2.6 Total Water Demand .................................................................. 3-14 Chapter 4 Water Resources Assessment ............................................................. 4-1 4.1 Surface Water Assessment ..................................................................... 4-1 4.1.1 General ........................................................................................ 4-1 4.1.2 Rainfall ......................................................................................... 4-1 4.1.3 Catchment Area and River System .............................................. 4-3
Transcript of Cavite Integrated Water Resource Master Plan

Cavite Integrated Water Resource Management Master Plan
i
TABLE OF CONTENTS
Page
Chapter 1 Introduction ........................................................................................... 1-1
1.1 Review of Cavite‘s previous initiatives towards integration ...................... 1-2
1.2 Cavite Integrated Water Resource Management Plan ............................. 1-3
Chapter 2 Provincial Physical and Socio-Economic Profile ................................ 2-1
2.1 Physical Environment .............................................................................. 2-1
2.1.1 Geographic Setting ...................................................................... 2-1
2.1.2 Physical Features ........................................................................ 2-3
2.1.3 Meteorology ............................................................................... 2-13
2.2 Infrastructure ......................................................................................... 2-16
2.2.1 Transportation ............................................................................ 2-16
2.2.2 Communication .......................................................................... 2-16
2.2.3 Water Supply ............................................................................. 2-17
2.2.4 Existing Water Service Providers ............................................... 2-19
2.2.5 Sanitation and Sewerage ........................................................... 2-21
2.2.6 Solid Waste Disposal Systems ................................................... 2-23
2.3 Socio-Economic and Demographic Environment ..................................... 2-1
2.3.1 Population, Density and Growth Rate .......................................... 2-1
2.3.2 Urban-Rural Population Structure ................................................ 2-2
2.3.3 Age Structure and Dependency Ratio .......................................... 2-4
2.3.4 Number of Households and Household Size ................................ 2-5
2.3.5 Income Levels and Profile ............................................................ 2-6
2.3.6 Labor Force and Employment Structure ....................................... 2-7
2.3.7 Health Indicators .......................................................................... 2-8
2.3.8 Demographic and Employment Projections.................................. 2-9
2.4 Economic Structure ................................................................................. 2-1
2.4.1 Gross Regional Domestic Product (GRDP) by Industrial
Origin: CALABARZON ................................................................. 2-1
2.4.2 Agriculture, Fishery, Poultry and Livestock................................... 2-1
2.4.3 Industry, Commerce and Trade .................................................... 2-5
Chapter 3 Water Demand Assessment ................................................................. 3-1
3.1 Population Projections ............................................................................. 3-1
3.2 Water Demand Projections ...................................................................... 3-2
3.2.1 Domestic (Municipal) Water Demand ........................................... 3-2
3.2.2 Agricultural Water Requirements .................................................. 3-4
3.2.3 Industrial Water Demand............................................................ 3-11
3.2.4 Recreation ................................................................................. 3-13
3.2.5 Power Generation ...................................................................... 3-14
3.2.6 Total Water Demand .................................................................. 3-14
Chapter 4 Water Resources Assessment ............................................................. 4-1
4.1 Surface Water Assessment ..................................................................... 4-1
4.1.1 General ........................................................................................ 4-1
4.1.2 Rainfall ......................................................................................... 4-1
4.1.3 Catchment Area and River System .............................................. 4-3
Cavite Integrated Water Resource Management Master Plan
ii
4.1.4 Irrigation Systems ........................................................................ 4-5
4.1.5 Stream flow Analysis .................................................................... 4-6
4.1.6 Flow Duration Curve (FDC) .......................................................... 4-9
4.1.7 Lakes ......................................................................................... 4-17
4.1.8 Summary and Conclusions : Surface Water Assessment ........... 4-20
4.2 Groundwater Assessment ..................................................................... 4-20
4.2.1 Groundwater Resources Inventory ............................................. 4-20
4.2.2 Results of Geo-resistivity Survey ............................................... 4-26
4.2.3 Water Balance ........................................................................... 4-29
4.2.4 Aquifer and Characteristics ........................................................ 4-35
4.2.5 Summary of Groundwater Resource Assessment ...................... 4-43
4.2.6 Sewerage, Septage and Water Quality ...................................... 4-44
4.3 General Conclusions ............................................................................. 4-45
Chapter 5 Water Resource Development Framework .......................................... 5-1
5.1 Principles for Integrated Water Resources Development and Management ........................................................................................... 5-1
5.2 The Key Issues ........................................................................................ 5-2
5.3 Meeting the Development Challenges ..................................................... 5-7
5.4 Addressing the Supply-Demand Gap....................................................... 5-8
5.5 Sewerage and Sanitation Development Framework ................................ 5-9
Chapter 6 Legal Framework and Institutional Arrangements .............................. 6-1
6.1 Frameworks and Principles ..................................................................... 6-1
6.2 Key Water-Related Legislation ................................................................ 6-1
6.3 Existing Organizational Structure, Functions and Activities of Key
Agencies ................................................................................................. 6-5
6.4 Authority of the Provincial Government of Cavite to Formulate the
CIWRMMP .............................................................................................. 6-8
6.5 Issues and Challenges ............................................................................ 6-9
6.6 Legal Feasibility of the Proposed Sources of Water for The
Intergrated Water Resource management Plan ..................................... 6-13
6.6.1 Aggregation of Water Rights ...................................................... 6-13
6.7 Recommended Institutional Arrangement .............................................. 6-14
6.7.1 Creation of a Cavite Water Resources Management
Committee (CWRMC) ................................................................ 6-14
6.7.2 Entering into Public-Private Partnerships ................................... 6-16
6.7.3 Legislative Agenda for the Province of Cavite ............................ 6-18
Chapter 7 Policies, Strategies and Programs and Projects ................................. 7-1
7.1 Policies .................................................................................................... 7-1
7.2 Strategies ................................................................................................ 7-1
7.3 Programs and Projects ............................................................................ 7-2

Cavite Integrated Water Resource Management Master Plan
iii
LIST OF TABLES
Table 2.1-1 Temperature and Relative Humidity, Sangley Point and Ambulong
Stations ................................................................................................. 2-14
Table 2.1-2 Average Daily Evaporation Rate, Tagaytay City Station ......................... 2-14
Table 2.1-3 Monthly Normal and Extreme Wind Speed and Direction, Sangley
Point and Ambulong Stations ................................................................ 2-15
Table 2.2-1 Water Supply Service Coverage by City/Municipality .............................. 2-18
Table 2.2-2 Existing Water Rates ............................................................................... 2-20
Table 2.2-3 Estimated Maximum Water Production Capacity Per Water
Agency .................................................................................................. 2-21
Table 2.2-4 Inventory of Sanitation Facilities by City/Municipality .............................. 2-22
Table 2.2-5 Cavite Province Disposal Sites, 2010 ..................................................... 2-24
Table 2.3-1 Cavite: Population and Population Density, by City/Municipality, 2000-2010 ............................................................................................... 2-1
Table 2.3-2 Cavite: Percentage Share of Urban and Rural Population, by
City/Municipality, 2000 & 2010................................................................. 2-3
Table 2.3-3 Cavite: Number of Households and Household Size, by
City/Municipality, 2000 & 2010................................................................. 2-5
Table 2.3-4 Cavite: Labor Force, Employment and Unemployment ............................. 2-8
Table 2.3-5 Vital Health Statistics: 2009 and 2010 ...................................................... 2-8
Table 2.3-6 Ten Leading Causes of Morbidity and Mortality: 2010 .............................. 2-8
Table 2.3-7 Cavite: Labor Force Projections................................................................ 2-9
Table 2.4-1 Gross Regional Domestic Product (GRDP): CALABARZON vs
Philippines ............................................................................................... 2-1
Table 2.4-2 Cavite: Production of Major Agricultural Crops (Metric Tons) ..................... 2-2
Table 2.4-3 Cavite: Area Planted to Crops ................................................................... 2-3
Table 2.4-4 Cavite: Fishery Production (Metric Tons) .................................................. 2-4
Table 2.4-5 Cavite: Livestock and Poultry Population (‗000 Heads) ............................. 2-5
Table 2.4-6 Operating Industrial Estates/Economic Zones in Cavite: 2010 .................. 2-8
Table 3.1-1 Population Projection Summary (in persons) ............................................ 3-1
Table 3.2-1 Unit Water Consumption Standard ........................................................... 3-2
Table 3.2-2 Projected Total Provincial Water Demand (mld) ..................................... 3-14
Table 4.1-1 PAGASA Rainfall Stations ........................................................................ 4-2
Table 4.1-2 Annual Rainfall Statistics .......................................................................... 4-3
Table 4.1-3 Monthly Rainfall Statistics ......................................................................... 4-3
Table 4.1-4 Major River Basins ................................................................................... 4-3
Table 4.1-5 Gauged Rivers in Cavite ........................................................................... 4-5
Table 4.1-6 Monthly Discharge of Ilang-Ilang and Balsahan Rivers, cms .................... 4-8
Table 4.1-7 Flow Duration Categories ......................................................................... 4-9
Table 4.1-8 Monthly Flow Duration of Maragondon River (cms) ................................ 4-10
Table 4.1-9 Daily Flow Duration Curve ...................................................................... 4-10
Table 4.1-10 Flow Duration of Maragondon River ...................................................... 4-11
Table 4.1-11 Monthly Flow Duration of Panaysayan River (cms) ................................ 4-12
Table 4.1-12 Daily Flow Duration Curve ..................................................................... 4-12
Table 4.1-13 Flow Duration of Panaysayan River ....................................................... 4-13
Table 4.1-14 Monthly Streamflow Statistical Analysis of Balsahan (cms) ................... 4-14
Table 4.1-15 Monthly Streamflow Statistical Analysis of Ilang-Ilang Rivers ................ 4-15

Cavite Integrated Water Resource Management Master Plan
iv
Table 4.1-16 Cavite River Survey Stations ................................................................. 4-17
Table 4.1-17 Flow Duration of Maragondon River at Critical Months, cms .................. 4-20
Table 4.2-1 Recharge and Recoverable Groundwater per City/Municipality .............. 4-34
Table 5.2-1 2012 Groundwater Supply-Demand Gap (in MLD) ................................... 5-3
Table 5.2-2 Water Requirements Summary (MLD), 2012-2040 ................................... 5-4
Table 5.2-3 Allocation of Water Rights by Source and Purpose, Cavite, 2011 ............. 5-4
Table 5.2-4 Irrigation Water Rights vs. Estimated Water Requirements ...................... 5-6
Table 6.2-1 Relevant Legal Issuances......................................................................... 6-2
Table 6.3-1 Key Water Supply Sector Agencies: Delineated Roles and
Responsibilities ....................................................................................... 6-7
Table 6.5-1 Allocation of water rights by source and purpose, Cavite, 2011 ................ 6-9
Table 6.5-2 Irrigation Water Rights Granted vs. Estimated Water
Requirements ........................................................................................ 6-13
Table 6.7-1 Levels of Approval of LGU Project .......................................................... 6-17
Table 6.7-2 Relevant Local Offices and Committees for PPP .................................... 6-17

Cavite Integrated Water Resource Management Master Plan
v
LIST OF FIGURES
Figure 2.1-1 CALABARZON (Region IV-A) ................................................................. 2-1
Figure 2.1-2 Cavite Province and its Cities and Municipalities ..................................... 2-2
Figure 2.1-3 Legislative District ................................................................................... 2-2
Figure 2.1-4 Elevation of Cavite Province .................................................................... 2-4
Figure 2.1-5 River Network .......................................................................................... 2-5
Figure 2.1-6 Provincial Land Use ................................................................................ 2-6
Figure 2.1-7 Provincial Soil Types ............................................................................... 2-7
Figure 2.1-8 General Geology ..................................................................................... 2-9
Figure 2.1-9 Active Faults and Trenches ................................................................... 2-11
Figure 2.1-10 West Valley Fault ................................................................................. 2-12
Figure 2.1-11 Climate of the Philippines and Frequency of Typhoons ........................ 2-13
Figure 2.2-1 Level III Water Service Coverage (2009) ............................................... 2-19
Figure 2.2-2 Solid Waste Disposal Map ..................................................................... 2-23
Figure 2.3-1 Cavite: Population by Age Group, 2010 (Percent of Total Population) .............................................................................................. 2-4
Figure 2.3-2 Incidence of Poverty among Families: 2003-2009 (% of Families) ........... 2-6
Figure 2.3-3 Incidence of Poverty among Population: 2003-2009 (% of
Population) .............................................................................................. 2-7
Figure 2.4-1 Agricultural Land Use .............................................................................. 2-4
Figure 2.4-2 Cavite: Number of Industrial Establishments ........................................... 2-6
Figure 2.4-3 Industrial, Commercial and Recreational Facilities .................................. 2-7
Figure 2.4-4 Value of Exports and Imports Generated by Economic Zones in
Cavite: 2002-2010 (US$ Million) .............................................................. 2-9
Figure 2.4-5 Cavite: Number of Registered Business Establishments ......................... 2-9
Figure 2.4-6 Domestic Demand Center ..................................................................... 2-10
Figure 3.2-1 Cavite Projected Domestic Water Demand (2012-2040) ......................... 3-3
Figure 3.2-2 Cavite Total Irrigable Area (2005-2040) ................................................... 3-5
Figure 3.2-3 Total Average Benefitted Service Area (2010-2040) ................................ 3-5
Figure 3.2-4 Total Irrigated Rice Water Demand (2010-2040) ..................................... 3-6
Figure 3.2-5 Total Area Planted to Vegetables (2005-2040) ........................................ 3-6
Figure 3.2-6 Total Vegetables Water Demand (2010-2040) ........................................ 3-7
Figure 3.2-7 Total Area Planted to Cut flowers & Ornamentals (2005-2040) ............... 3-7
Figure 3.2-8 Cut flowers & Ornamentals Water Demand (2010-2040) ......................... 3-8
Figure 3.2-9 Livestock Water Demand (2010-2040) .................................................... 3-8
Figure 3.2-10 Poultry Heads ‗000 Projections (2010-2040) .......................................... 3-9
Figure 3.2-11 Poultry Water Demand (2010-2040) ....................................................... 3-9
Figure 3.2-12 Aquaculture Area (2007-2040) ............................................................. 3-10
Figure 3.2-13 Aquaculture Water Demand (2010-2040) ............................................. 3-10
Figure 3.2-14 Water Demand per City/Municipality (2010-2040) ................................ 3-11
Figure 3.2-15 Phase Development of Industrial Estates/Economic Zones (2010-2040) ........................................................................................... 3-12
Figure 3.2-16 Number of Industrial Establishments Outside IEs/EZs (2005-
2040) ..................................................................................................... 3-12
Figure 3.2-17 Cavite Industrial Water Demand (2010-2040) ....................................... 3-13
Figure 3.2-18 Cavite Recreational Water Demand (2010-2040) ................................. 3-14
Figure 3.2-19 Cavite Water Demand (Year 2012) ...................................................... 3-15

Cavite Integrated Water Resource Management Master Plan
vi
Figure 3.2-20 Cavite Water Demand (Year 2040) ...................................................... 3-15
Figure 3.2-21 Total Cavite Ground Water Demand (2012-2040) ................................ 3-16
Figure 3.2-22 Total Cavite Surface Water Demand (2012-2040) ................................ 3-16
Figure 4.1-1 Mean Annual Rainfall Isohyetal of Cavite ................................................ 4-2
Figure 4.1-2 Major River Basins in Cavite ................................................................... 4-4
Figure 4.1-3 Existing Irrigation Systems ...................................................................... 4-6
Figure 4.1-4 Plot of Minimum, Median and Mean Discharge of Maragondon
River ........................................................................................................ 4-7
Figure 4.1-5 Plot of Minimum, Median and Mean Discharge of Panaysayan
River ........................................................................................................ 4-8
Figure 4.1-6 Flow Duration Curve for Maragondon River........................................... 4-11
Figure 4.1-7 Flow Duration Curve for Panaysayan River ........................................... 4-13
Figure 4.1-8 Flow Duration Curve for BalsahanRiver................................................. 4-14
Figure 4.1-9 Flow Duration Curve for Ilang-Ilang River .............................................. 4-15
Figure 4.1-10 Laguna de Bay ..................................................................................... 4-17
Figure 4.1-11 Taal Lake ............................................................................................. 4-19
Figure 4.2-1 Selected Deepwell Location .................................................................. 4-22
Figure 4.2-2 VES Location ........................................................................................ 4-27
Figure 4.2-3 Electrostratigraphic Section A-A‘ ........................................................... 4-28
Figure 4.2-4 ARMA Model Area................................................................................. 4-30
Figure 4.2-5 Water Balance – Area 1 ........................................................................ 4-31
Figure 4.2-6 Water Balance – Area 2 ........................................................................ 4-32
Figure 4.2-7 Water Balance – Area 3 ........................................................................ 4-33
Figure 4.2-8 Lithologic Section .................................................................................. 4-35
Figure 4.2-9 Groundwater Level - 1980 ..................................................................... 4-37
Figure 4.2-10 Elevation of Groundwater Level before 1990 ....................................... 4-38
Figure 4.2-11 Elevation of Groundwater Level - 2003 ................................................ 4-39
Figure 4.2-12 Groundwater Level Change 1990-2003 ................................................ 4-40
Figure 4.2-13 Specific Capacity .................................................................................. 4-42
Figure 4.2-14 Transmissivity ...................................................................................... 4-43
Figure 5.1-1 Framework for the Cavite Integrated Water Resource
Management System ............................................................................... 5-2
Figure 5.2-1 Allocation of Water Rights by Source and Purpose, Cavite 2011............. 5-5
Figure 5.3-1 Conceptual Overview : Development Strategy and
Implementation Framework ..................................................................... 5-7
Figure 5.4-1 Groundwater Availability, 2012 ................................................................ 5-8
Figure 6.5-1 Allocation of water rights by source and purpose, Cavite 2011 ................ 6-9
Figure 6.5-2 Allocation of water rights by source and purpose, Cavite 2011
(without surface water) .......................................................................... 6-10
Figure 6.5-3 NWRB-granted Groundwater Rights, Cavite, December 2011............... 6-10

Cavite Integrated Water Resource Management Master Plan
vii
ANNEXES
ANNEX I - MAPS AND FIGURES
Annex I-1 Legislative District Map
Annex I-2 Topographic Map
Annex I-3 Road Network Map
Annex I-4 River Network Map
Annex I-5 Elevation Map
Annex I-6 Slope Map
Annex I-7 Spring Location Map
Annex I-8 Land Use Map of Cavite
Annex I-9 Soil Distribution Map
Annex I-10 Geologic Map
Annex I-11 Level III Water Service Coverage Map (as of 2009)
Annex I-12 Water Management Authority Map
Annex I-13 Solid Waste Disposal Site Map
Annex I-14 Domestic Demand Centers
Annex I-15 Agricultural Land Use Map
Annex I-16 Industrial, Commercial & Recreation Land Use Map
Annex I-17 Domestic Water Demand Center Map
Annex I-18 Existing Deepwell Location Map
Annex I-19 Groundwater Level Map - 1980
Annex I-20 Elevation of Groundwater Level Before 1990
Annex I-21 Elevation of Groundwater Level - 2003
Annex I-22 Groundwater Level Change 1990 – 2003
Annex I-23 Specific Capacity Map
Annex I-24 Transmissivity Map
Annex I-25 Groundwater Availability Map, 2012
ANNEX II - DATA AND INFORMATION
Annex II-1 Summary of Existing Level III Water Supply Facilities
Annex II-2 Water Rate Schedule (as of January 2012)
Annex II-3 Historical City/Municipality Population
Annex II-4 City/Municipality Population Projections
Annex II-5 2012 Population and Domestic Water Demand Projections
Annex II-6 2015 Population and Domestic Water Demand Projections
Annex II-7 2020 Population and Domestic Water Demand Projections
Annex II-8 2025 Population and Domestic Water Demand Projections
Annex II-9 2030 Population and Domestic Water Demand Projections
Annex II-10 2035 Population and Domestic Water Demand Projections
Annex II-11 2040 Population and Domestic Water Demand Projections
Annex II-12 Domestic Water Demand Summary, MLD
Annex II-13 Irrigation Data
Annex II-14 Agriculture Water Demand Projections, MLD
Annex II-15 Industrial Water Demand Projections, MLD

Cavite Integrated Water Resource Management Master Plan
viii
Annex II-16 Recreation Water Demand Projections, MLD
Annex II-17 Total Water Demand Projections, MLD
Annex II-18 Surface Water Quality Test Results
Annex II-19 Rainfall and Temperature Data
Annex II-20 Data Summary of Selected Wells
Annex II-21 Summary of Selected Geo-resistivity Data
Annex II-22 Safe Yield of Individual Well
Annex II-23 NWRB Well Records
Annex II-24 LWUA Well Records
Annex II-25 Dasmariñas City Water District‘s Well Records
Annex II-26 SWECO Well Data Summary
Annex II-27 WATCON Geo-resistivity Survey Data

Cavite Integrated Water Resource Management Master Plan
ix
ABBREVIATIONS AND ACRONYMS
ARMA Autoregressive Moving Average
BWSA Barangay Water Supply Association
BOD Biochemical Oxygen Demand
BMS Biodiversity Monitoring System
BOI Board of Investments
BFAR Bureau of Fisheries and Aquatic Resources
BRL Bureau of Research Laboratories
BSWM Bureau of Soils and Water Management
BRS Bureau research and Standards
CALABARZON Cavite, Laguna, Batangas, Rizal and Quezon
C-I Commercial Industrial
CAGR Compound Annual Growth Rate
CARP Comprehensive Agrarian Reform Program
CLUP Comprehensive Land Use Plan
CPLA Cordillera People‘s Liberation Army
m3 cum Cubic meter
cms Cubic meter per second
DAO Department of Administrative Order
DA Department of Agriculture
DOF Department of Finance
DOH Department of Health
DILG Department of Interior and Local Government
DPWH Department of Public Works and Highways
DSWD Department of Social Welfare & Development
DBP Development Bank of the Philippines
E East
EZ Economic Zone
EHS Environmental Health Services
EMB Environmental Management Bureau
EMB-DENR Environmental Management Bureau-Department of
Environment and Natural Resources
EO Executive Order
EVT Extreme Value Type
FMB Forest Management Bureau
GMA General Mariano Alvarez
GIS Geographic Information Systems
GRDP Gross Regional Domestic Product
GR Growth Rate
Ha(s) hectare (s)
IE Industrial Estate
ITCZ International Tropical Convergence Zone

Cavite Integrated Water Resource Management Master Plan
x
JICA Japan International Cooperation Agency
KALAHI-CIDSS Kapit Bisig Laban sa Kahirapan- Comprehensive &
Integrated Delivery of Social Services
LFPR Labor Force on Participation Rate
LLDA Laguna Lake Development Authority
LBP Land Bank of the Philippines
LGUs Local Government Units
LWUA Local Water Utilities Administration
MSL Mean Sea Level
MOA Memorandum of Agreement
mamsl Meter above mean sea level
MSWI Maynilad Water Services, Incorporated
MWSS Metropolitan Waterworks and Sewerage System
MGB Mines and Geosciences Bureau
MNLF Moro National Liberation Front
MPDC/ MPDO Municipal Planning and Development Coordinator/
Municipal Planning and Development Office
NAPC National Anti-Poverty Commission
NEDA National Economic Development Authority
NEA National Electrification Administration
NHRC National Hydraulic Research Center
NIPAS National Integrated Protected Area System
NIA National Irrigation Authority
NPC National Power Corporation
NSCB National Statistical Coordination Board
NSO National Statistics Office
NWIN National Water Information Network
NWRB National Water Resources Board
N North
OCD Office of Civil Defense
OEA Office of Energy Affairs
O&M Operation and Maintenance
% Percentage
PAF Philippine Air Force
PAGASA Philippine Atmospheric Geophysical and
Astronomical Services Administration
PCAFNRRD Philippine Council for Agricultural, Forestry &
Natural Resources Research & Development
PEZA Philippine Economic Zone Authority
PGDB Philippine Ground Water Data Bank
PNSDW Philippine National Standard for Drinking Water
PPA Philippine Ports Authority
PTA Philippine Tourism Authority
POP Population

Cavite Integrated Water Resource Management Master Plan
xi
PD Presidential Decree
PMO Project Management Office
PMO-MFCP Project Management Office-Major Flood Control
Projects
PMO-RWS Project Management Office-Rural Water Supply
PMO-SWIM Project Management Office-Small Water
Impounding Projects
PAWB Protected Area and Wildlife Bureau
PPDO Provincial Planning and Development Office
PPP Public Private Partnership
RPMP Rebolusyong Partido ng Manggagawa Pilipinas
RDC Regional Development Council
RA Republic Act
RPA Revolutionary Proletarian Army
ROW Right of Way
RWSA Rural Water Supply Association
SEP Socio Ecological Profile
SES Socio-Economic Survey
SCS Soil Conservation Services
S South
m2, sum Square meter
TWG Technical Working Group
TOR Terms of Reference
T Time or Period
TDS Total Dissolved Solid
TSS Total Suspended Solids
TMC Trece Martirez City
UNOPS United Nations Office for Project Services
VES Vertical Electrical Sounding
WD Water District
WSP Water Supply Providers
WSS Water Supply Sectors
W West

Cavite Integrated Water Resource Management Master Plan
ES - 1
Executive Summary
CAVITE INTEGRATED WATER RESOURCE MANAGEMENT MASTER PLAN
BACKGROUND
1. The province of Cavite recognizes the need for an updated, integrated, and comprehensive water management plan in view of the rapid growth in population, increased economic activity, decreasing groundwater levels resulting in groundwater mining, salt-water intrusion in coastal areas, pollution in rivers, and competition over water rights. The Cavite Integrated Water Resource Management Master Plan was prepared in response to this need.
2. Cavite‘s Provincial Development and Physical Framework Plan (PDPFP) 2008-2013 identified the annual depletion of ground water and the pollution of major rivers as among the issues concerning water supply sources. The Cavite Integrated Water Resources Management Master Plan aims to update the findings of the past studies of JICA (1995) and SWECO (2004), among other studies, which focused on ground water source development for selected areas in Cavite. The recommendations of the master plan will be mainstreamed into the updated version of the PDPFP.
3. The legislative fiat for the updating activity was issued under Sangguniang Panlalawigan Resolution No. 082-S-2012 which authorizes the Provincial Governor, Hon. Juanito Victor C. Remulla Jr., to formulate an Integrated Water Resource Management Master Plan that envisions the environmentally sustainable utilization of the province‘s water resources to help meet and satisfy the water needs and requirements of the estimated 4.8 million Cavitenos by 2020.
STUDY AREA
4. The study area covers the Province of Cavite, located in Region IV-A or the CALABARZON Region, whose proximity to Metro Manila gives it a significant edge in terms of economic development. With a total land area of 142, 706 hectares, Cavite is composed of four cities and 19 municipalities with a total of 829 barangays distributed into its seven (7) legislative districts.
5. Rivers and streams that originate from upland areas drain into the province. These waterways, with

Cavite Integrated Water Resource Management Master Plan
ES - 2
long and narrow drainage areas, generally flow in northerly and northwesterly directions before emptying into the Manila Bay or the Laguna de Bay. The major river systems include the Maragondon, Labac, Cañas and San Juan River Basins.
OBJECTIVES OF THE PLAN
6. The goal of the Integrated Water Resources Management Master Plan for the
Province of Cavite is to map out a development strategy that will promote the optimal and sustainable development and management of the water resources of one of the fastest growing provinces in the country. The specific objectives of the master plan are as follows:
To determine current and future water supply demand for domestic (residential, commercial, institutional and small industries), irrigation, fisheries, livestock raising, industrial and recreational purposes;
To determine the climatic, hydrologic, and hydro-geologic environments of the study area, particularly, the availability and quantity of surface water and groundwater;
To formulate a comprehensive water resources development and management framework for the optimum utilization of water resources for water supply projects in the study area;
To identify the network of institutional relationships in water resources development and management, particularly in water supply development at the study area which includes national, regional, and local agencies;
To present descriptions of the organizational structure, functions, and activities of the key agencies at water resource level area;
To recommend institutional arrangements for the implementation of potential water supply projects; and
To establish the policies, formulate the corresponding strategies and develop the attendant shopping list of potential programs and projects that shall serve as the development and management blueprint for the province‘s water supply in the short, medium and long term planning horizons.
PRINCIPLES FOR PLAN PREPARATION
7. The preparation of the Cavite Integrated Water Resource Management Master Plan was guided by the following principles as contained in the Philippine Water Supply Sector Roadmap (NEDA 2008):
Water is a human right and the government has an obligation to respect, protect and fulfill the enjoyment of the right to water;
Water is a finite and vulnerable resource, essential to sustain life, development and the environment. It should be managed for the common good;
Access to water should be equitable and sensitive to gender and the disadvantaged;

Cavite Integrated Water Resource Management Master Plan
ES - 3
The governance of water resources should be transparent and socially accountable and its management should be decentralized at the lowest possible level;
Water supply services should be financially sustainable and socially acceptable;
Water supply services should be demand responsive. This includes appropriateness and viability of technology and management options at various levels;
Water supply projects should have capacity development components at all levels inclusive of knowledge management that promotes a learning environment for all stakeholders;
Water supply provision should be a priority component in poverty reduction programs. This means giving priority to public allocation for water supply services;
Sanitation is directly linked to water supply; and
The development of the water supply sector should contribute to the promotion of gender equality.
SUMMARY OF ISSUES AND CHALLENGES
8. An assessment of the present condition pertaining to the water and sanitation situation in the Province of Cavite indicates the following issues and concerns:
The present water supply and distribution systems covering the Province of
Cavite is no longer able to meet the present and future aggregate demand
for water;
Water abstraction in a number of areas in the Province has already reached
critical points causing decreased groundwater levels and resulting in
groundwater mining as well as salt-water intrusion in coastal areas;
To support the short-, medium, and long-term water requirements of the
province, the conjunctive use of surface water and groundwater sources
and/or the importation of water from nearby provinces will be needed;
The planning, development and provision of water supply is de-linked from
that of sanitation facilities, particularly sewerage and septage facilities;
There is lack of any septage collection and treatment system as well as any piped waste water collection and treatment system or a centralized sewerage system. Due to this lack, septic tank effluent is generally allowed to leach into the ground while untreated waste water from households and industrial establishments is returned to the water sources;
There is a mismatch between the granting and utilization of water rights vis-a-vis needs and nature of usage;
Existing institutional and regulatory frameworks both at the national and provincial/local levels appear to be weak and fragmented;
There appears to be a lack of a coherent financing framework that can rationalize financing in the water sector to make the fullest use of limited

Cavite Integrated Water Resource Management Master Plan
ES - 4
public funds and encourage concessional financing, and private sector investments.
POLICIES, STRATEGIES, AND KEY LEGISLATIVE AGENDA
9. The relevant guiding policies, corresponding strategies in support of such policies and the necessary key legislative agenda to address needed institutional reforms as well as the aggregation of water rights and the tapping of Taal Lake and Laguna Bay as potential water sources are as follows:
Policies
Provide the whole population of Cavite Province access to safe and potable water and basic sanitation
Optimize the use of available water through a more rationalized allocation of resources and water rights based on need and usage
Improve health outcomes and effect a sustainable environment through improved sanitation, septage, and sewerage systems provision particularly in highly urbanized and/or densely populated areas
Encourage private sector participation in the financing, implementation and/or operation of water resources development and management projects and other related undertakings of the Cavite Provincial Government
Strategies
Development of new water supply sources based on a viable provincial land use plan, to include as well importation of water from nearby provinces, to meet increasing demand that are sustainable, stable, reasonable and which will provide equitable and affordable water supply for all end users
Enable the participation of concerned service providers in plan development, programming and operations, among others, in order to improve coverage, efficiency and sustainability of related infrastructure
Enactment of legislation/ordinance to introduce financing innovation for the implementation of sewerage and septage system projects, that will link these services to revenue-generating water service provision in order to facilitate investment cost recovery.
Establishment of an effective and clear monitoring system to assess and address the sustainability of developed related infrastructure
Imposition of an environmental user’s fee, particularly on those without water rights, and which shall be based on the cost of replenishment and rehabilitation of the affected water bodies.
Introduction and/or enactment of appropriate legal instrument to address institutional and regulatory issues relating to the integrated management and development of the province’s water resources.
Stimulation of growth in rural areas to curb rural-urban migration that has led to increasing pressures in ecosystems and water bodies as well as unsustainable land use practices in urban areas.

Cavite Integrated Water Resource Management Master Plan
ES - 5
Promotion of environmental education, particularly in water resource management, to enable people to appreciate and understand the complexity of environment and their roles and responsibilities in sustainable water resource management.
Resource regulation shall be strengthened to ensure that surface and ground water supply sources are sustainably developed, managed and utilized.
Key Legislative Agenda
Aggregation of existing water rights through any of the following ways or a combination thereof: (a) negotiation with individual water rights holders for the transfer of water rights, (b) individual revocation for non-use, water wastage or violations against the water code or (c) mass revocation in favor of a project for greater beneficial use
Creation of a Cavite Water Rights Clearing House and Management Committee (CWRMC) to rationalize the use and development of water resources in the province, which functions will include, among others: (1) confirming and examining the compatibility of existing water rights with the CIWRMMP; and (2) ensuring that all water rights heretofore granted shall be in conformity with the CIWRMMP
Designation of a representative body to explore and negotiate for the extraction of water from Taal Lake and Laguna Bay for use as potential surface water source for the province.
PROGRAMS AND PROJECTS
10. To implement the Cavite Integrated Water Resource Management Master Plan, a long-list of time-bound programs and projects has been formulated. Over the short-term period, covering about one to three years, a total budgetary amount of PhP 19.0 Billion is earmarked for immediate implementation. A total budget of PhP 15.5 Billion and PhP 33.7 Billion are earmarked over the medium-term and long-term period.
Program/Project Description Estimated Cost
(P Billion)
Short Term Development Works (1-3 years)
Surface water development Abstraction from river sources and provision of treatment plant and transmission facilities as well as other necessary facilities
5.0
Groundwater Development and Management
Abstraction of water through deep wells and springs and provision of pump stations, pipelines and other support facilities.
6.5
Water distribution system development and expansion
(a) Provision of Level I water supply systems, (b) provision of Level II water supply systems and (iii) provision of Level III water supply systems and expansion of existing area coverage
1.0
Measurement and monitoring of water efficiency
Engineering studies and provision of monitoring equipment
0.003/year

Cavite Integrated Water Resource Management Master Plan
ES - 6
Program/Project Description Estimated Cost
(P Billion)
Reduction of Non-revenue water NRW reduction within WSP service area 0.15/year
Water productivity measurement Financial and Economic studies and provision of monitoring systems and equipment
0.006/year
Water pricing Establishment of water pricing mechanism to be adopted by service providers and consumers
0.007/year
Metering Provision of production meters, supply meters and consumer meters
(Included in system
development costs)
Irrigation scheduling Engineering studies and provision of monitoring equipment
0.006/year
Sewerage and Septage Provision of sewerage and septage collection and treatment facilities
6.0
Medium Term Development Works (3-6 years)
Surface water development and Expansion
Abstraction from river sources and provision of treatment plant and transmission facilities as well as other necessary facilities
7.0
Water distribution system development and expansion
(a) Provision of Level I water supply systems, (b) provision of Level II water supply systems and (iii) provision of Level III water supply systems and expansion of existing area coverage
4.0
Rainwater/storm water harvesting and reuse
Provision of technology and designs for domestic households. Construction of impoundment reservoirs to augment supply
4.0
Measurement and monitoring of water efficiency
Engineering studies and provision of monitoring equipment
0.003/year
Reduction of Non-revenue water NRW reduction within WSP service area 0.15/year
Water productivity measurement Financial and Economic studies and provision of monitoring systems and equipment
0.006/year
Water pricing Establishment of water pricing mechanism to be adopted by service providers and consumers
0.007/year
Irrigation scheduling Engineering studies and provision of monitoring equipment
0.006/year
Long Term Development Works (6-10 years)
Surface water development and expansion
Abstraction from river sources and provision of treatment plant and transmission facilities as well as other necessary facilities
28.0
Managed aquifer storage, recharge areas, water balance
Reforestation. Protection of watershed areas. Declaration of areas as protected areas
1.0
Reduction of water pollution Management solid waste through construction of MRF, and disposal facilities. Continuing education campaign and segregation.
2.0
Water distribution system development
(a) Provision of Level I water supply systems, (b) provision of Level II water supply systems and
2.0

Cavite Integrated Water Resource Management Master Plan
ES - 7
Program/Project Description Estimated Cost
(P Billion)
(iii) provision of Level III water supply systems and expansion of existing area coverage
Measurement and monitoring of water efficiency
Engineering studies and provision of monitoring equipment
0.003/year
Reduction of Non-revenue water NRW reduction within WSP service area 0.15/year
Water productivity measurement Financial and Economic studies and provision of monitoring systems and equipment
0.006/year
Water pricing Establishment of water pricing mechanism to be adopted by service providers and consumers
0.007/year
Irrigation scheduling Engineering studies and provision of monitoring equipment
0.006/year

Cavite Integrated Water Resource Management Master Plan
1-1
CHAPTER 1 INTRODUCTION
Integrated Water Resources Management (IWRM) is a collaborative process which
promotes the coordinated development and management of water, land and related
resources within hydrological boundaries, in order to maximize the resultant economic
and social welfare in an equitable manner without compromising the sustainability of vital
ecosystems.1 IWRM is based on the following principles:2
1. Water is a human right and the government has an obligation to respect, protect
and fulfill the enjoyment of the right to water.
2. Water is a finite and vulnerable resource, essential to sustain life, development
and the environment. It should be managed for the common good.
3. Access to water should be equitable and sensitive to gender and the
disadvantaged.
4. The governance of water resources should be transparent and socially
accountable and its management should be decentralized at the lowest possible
level.
5. Water supply services should be financially sustainable and socially acceptable.
6. Water supply services should be demand responsive. This includes
appropriateness and viability of technology and management options at various
levels.
7. Water supply projects should have capacity development components at all
levels inclusive of knowledge management that promotes a learning environment
for all stakeholders.
8. Water supply provision should be a priority component in poverty reduction
programs. This means giving priority to public allocation for water supply
services.
9. Sanitation is directly linked to water supply.
10. The development of the water supply sector should contribute to the promotion of
gender equality.
The IWRM Plan Framework is a directional plan. It is intended to guide the different
stakeholders involved in water resources management, at different levels, to either
prepare their respective IWRM plans, update/enhance their existing IWRM related plans
or make IWRM an integral part of their development plans/programs. This directional
plan framework also seeks to enable and encourage a wider adoption and localization of
IWRM, across different stakeholders, at different levels. It will guide water-related
government agencies and other stakeholders in ensuring that water and IWRM are
mainstreamed and integrated in their respective plans, programs, and projects. It will
likewise be the take-off in the preparation of regional and local IWRM Operational and
Action Plans.3
1 National Economic Development Authority (NEDA), Philippine Water Supply Sector Roadmap 2
nd edition, 2010
2 Ibid
3 Ibid

Cavite Integrated Water Resource Management Master Plan
1-2
1.1 REVIEW OF CAVITE’S PREVIOUS INITIATIVES TOWARDS INTEGRATION
The province of Cavite recognizes the need for an updated, integrated, and
comprehensive water management plan in view of the rapid growth in population,
increased economic activity, decreasing groundwater levels resulting in
groundwater mining, salt-water intrusion in coastal areas, pollution in rivers, and
competition over water rights. Hence, it encouraged the conduct of studies to
help improve the province‘s water supply system:
In 1989, the Office of the Provincial Planning and Development Coordinator
(OPPDC), with the assistance of Kampsax-Kruger, formulated the Water Supply
Sewerage and Sanitation Development Plan 1990-2000. The plan recommended
increasing the coverage of service areas to 85% by 2000. This could be
achieved by increasing the coverage of Level II and III facilities to 63% and the
installation of hand pumps (Level I) in the barangays. The main supply source for
these facilities was extracted groundwater.
In 1995, the Japan International Cooperation Agency (JICA) conducted the
Cavite Water Supply and Development Study which covered two cities and 15
municipalities under the Local Water Utilities Administration (LWUA). It -
concluded that there was insufficient water source capacity, low pump and motor
efficiency, high unaccounted water usage (49% of total monthly production) and
deficient steel reservoirs and treatment facilities. The study recommended that (i)
domestic consumption should be prioritized in the allocation of ground water
sources, (ii) establishment of a groundwater management committee under the
provincial government; (iii) examination of permissive pumping discharge and;
(iv) re-examination of regional development plans and land use plans.
The study specifically proposed groundwater supply development in the
municipalities of General Mariano Alvarez, Mendez, Naic and Tanza. In the case
of Tagaytay City, with very limited groundwater potential, it was recommended to
increase the pumping rate capacity of Kaybubutong Spring.
In 2004, the Swedish Consultancy Services International (SWECO) and
WATCON, Inc. conducted the study entitled ―Water Resources in Nine Local
Government Units in Cavite Province, Philippines.‖ The study found that
―harnessing surplus of recoverable recharge in Indang, Mendez-Nunez, Silang
and Tagaytay City could prolong water mining until 2030 but will lead to
dewatering of aquifers.‖ It added that ―groundwater withdrawal should be reduced
below recoverable charge on or before 2030, to allow aquifer replenishment.‖ The
study recommended water source development that involved: (i) addition of
production wells distributed among the nine LGUs; (ii) development of 1-2 springs
in Tagaytay City; (iii) suspension of water permits issuance in LGUs where there
is groundwater mining (i.e., Carmona, GMA, General Trias, northern Silang and
Dasmarinas.) and; (iv) initiation of measures to find new water sources by LGUs.
It also recommended institutional arrangements for the redistribution of future
wells to (i) harness surplus recoverable recharge in Amadeo, Indang, Mendez-

Cavite Integrated Water Resource Management Master Plan
1-3
Nunez, Silang and Tagaytay City and (ii) find alternative water sources in
conjunction with ground water sources.
The Sangguniang Panlalawigan (SP) of Cavite passed Resolution No. 082-S-
2012 authorizing the Provincial Governor, Hon. Juanito Victor C. Remulla Jr., to
formulate an Integrated Water Resource Management Plan that envisions the
environmentally sustainable utilization of the province‘s water resources to help
meet and satisfy the water needs and requirements of the province‘s estimated
9M population by 2040.
1.2 CAVITE INTEGRATED WATER RESOURCE MANAGEMENT PLAN
The Cavite Integrated Water Resources Management Plan sets the direction for
the province to meet challenges in the water sector and meet related objectives
in its Provincial Development Plan (PDP). It also aims to ensure adequate long-
term availability and accessibility of potable water and sustainable management
of wastewater. Specifically, it aims to:
1. Assess the situation of the sector and identify issues and challenges;
2. Review previous initiatives towards integration;
3. Articulate a shared vision and formulate goals and objectives;
4. Formulate feasible strategies for achieving declared objectives, indicate
expected outcomes and translate these into program and investment
priorities;
5. Map out program components and sequence of activities in aid to financial
and investment planning;
6. Identify policy areas that need further research and development;
7. Define institutional arrangements between and among national and local
government agencies and units as well as the role of non-state organizations
and institutions; and
8. Define the sector monitoring and evaluation mechanisms.

Cavite Integrated Water Resource Management Master Plan
2-1
CHAPTER 2 PROVINCIAL PHYSICAL AND SOCIO-ECONOMIC PROFILE
2.1 PHYSICAL ENVIRONMENT
2.1.1 Geographic Setting
The Province of Cavite is part of the CALABARZON Region or Region IV-A which
is located in southwestern Luzon (Figure 2.1-1). Also called the Southern
Tagalog Mainland, CALABARZON is the second most densely populated region
after the National Capital Region. It derives its name from its composite five (5)
provinces, namely: CAvite, LAguna, BAtangas, Rizal, and QueZON.
Source: NAMRIA
Figure 2.1-1 CALABARZON (Region IV-A)
Cavite lies at about 30 km south of Manila at the southwest entrance of Manila
Bay and across the Bataan Peninsula. It is bounded on the north by Manila Bay
and Metro Manila, on the south by the Province of Batangas, and on the east by
the province of Laguna. To its west lies the South China Sea (Figure 2.1-2). It is
located within latitudinal coordinates 14o 04' to 14o 35' North, and longitudinal
coordinates 120o 35' to 121o 06' East.
The province is accessible from Metro Manila through several routes that include
the Coastal Road and the newly opened Cavite Expressway, Aguinaldo Highway,
and the South Luzon Expressway. Trece Martires City, the seat of the provincial
government is about 45 km from the City of Manila.
Cavite Integrated Water Resource Management Master Plan
2-2
Source: NAMRIA
Figure 2.1-2 Cavite Province and its Cities and Municipalities
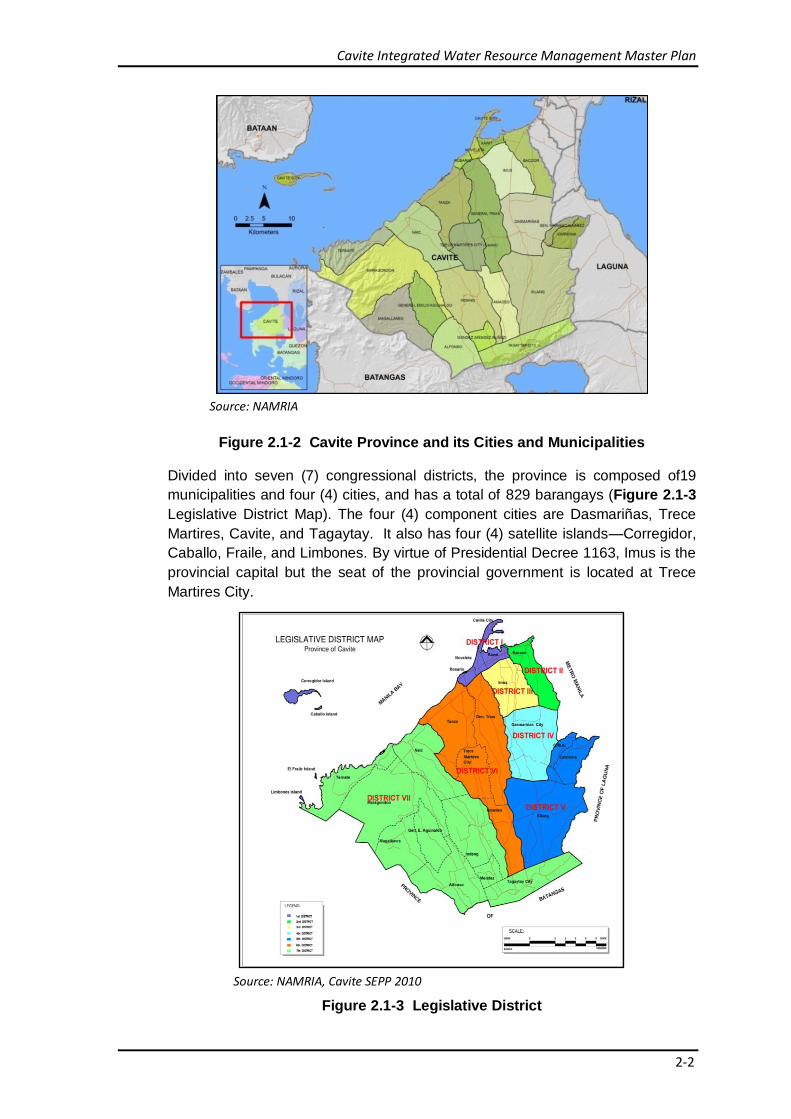
Divided into seven (7) congressional districts, the province is composed of19
municipalities and four (4) cities, and has a total of 829 barangays (Figure 2.1-3
Legislative District Map). The four (4) component cities are Dasmariñas, Trece
Martires, Cavite, and Tagaytay. It also has four (4) satellite islands—Corregidor,
Caballo, Fraile, and Limbones. By virtue of Presidential Decree 1163, Imus is the
provincial capital but the seat of the provincial government is located at Trece
Martires City.
Source: NAMRIA, Cavite SEPP 2010
Figure 2.1-3 Legislative District

Cavite Integrated Water Resource Management Master Plan
2-3
2.1.2 Physical Features
2.1.2.1 Physiography
The province of Cavite has a total land area of 1,427.06 square kilometers
(142,706 hectares), representing 8.72% of the CALABARZON‘s total land area.
The municipalities of Maragondon and Silang have the biggest land areas while
the municipality of Noveleta, has the smallest land area, accounting for only
0.38% of the provincial total.
The land area of the province is classified as follows: 5.9% public forests; 90.07%
alienable and disposable; and 4.02% unclassified forest land. It has four (4)
physiographical areas, namely: the lowest lowland area, the lowland area, the
central hilly area and the upland mountainous area (Figure2.1-4). The
characteristics of these areas are described as follows:
The lowest lowland area or coastal plains have extremely low ground level of
elevation 0m to 2m compared to the high tide level of about elevation 0.8m
from the Mean Sea Level (MSL). Cavite City and the municipalities of Bacoor,
Kawit, Noveleta, and Rosario, the northern part of Carmona, and eastern part
of Ternate are part of this area.
The lowland area consists of the coastal and alluvial plains. These areas
have flat ground of less than 0.5%slope and low ground elevation of elevation
2m to elevation 30m. The alluvial plain can be found in the municipality of
Imus and the southern part of General Trias. These municipalities form the
transition area between the coastal plain and the central hilly area. Some
areas of Bacoor, Kawit, Noveleta, Rosario, Tanza, and Carmona are also part
of the lowland area.
The third topography type is the central hilly area, generally found on the
mountain foot slope. This topography forms the rolling tuffaceous plateau and
includes steep hills, ridges, and elevated inland valley. The plateau is
characterized with ground elevation ranging from 30m to nearly 400m. Its
ground slope ranges from 0.5% to 2%. The cities of Trece Martires and
Dasmariñas and the municipalities of General Emilio Aguinaldo, General
Mariano Alvarez, Indang, Maragondon, Ternate, Silang, and Carmona have
this kind of topography.
The fourth topography type, the upland mountainous area, can be found in
Magallanes, Amadeo, Tagaytay City, Mendez, Alfonso, and the southern part
of Maragondon and Carmona. They are situated at a very high elevation
above 400m with slopes of more than 2%. The Tagaytay ridge has an
average elevation of 610mwith Mount Sungay having the highest elevation in
the province at 716m.
Cavite Integrated Water Resource Management Master Plan
2-4
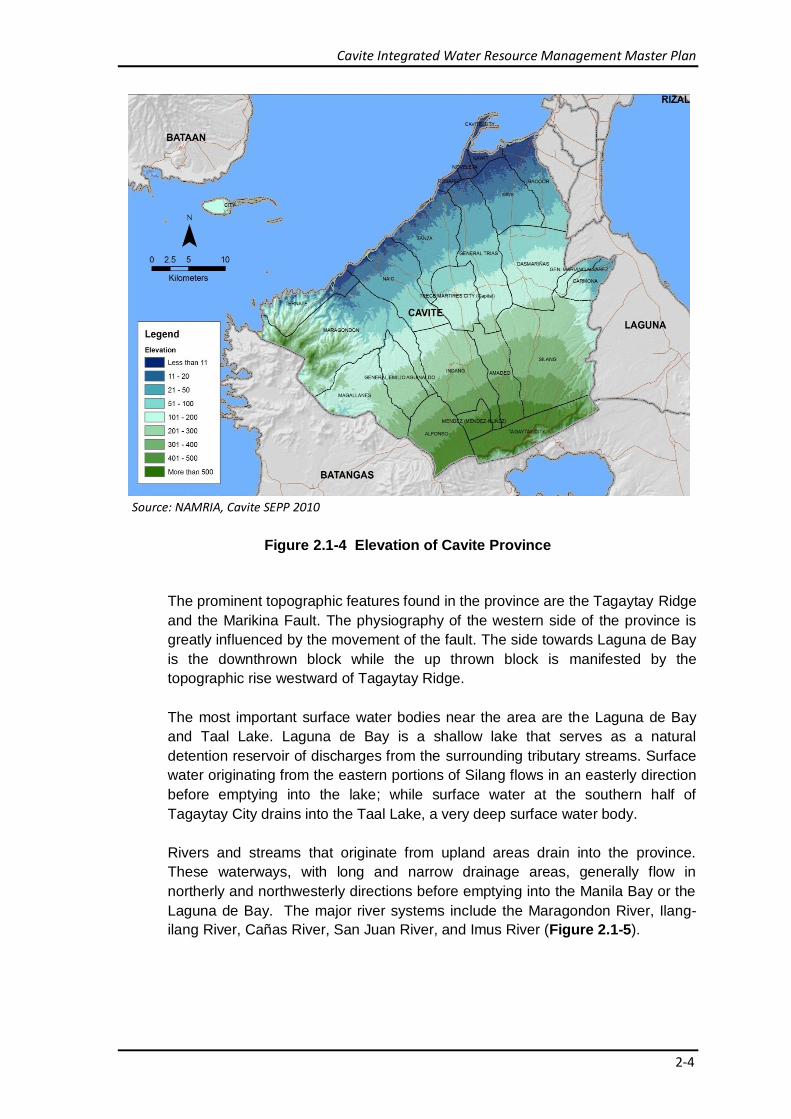
Source: NAMRIA, Cavite SEPP 2010
Figure 2.1-4 Elevation of Cavite Province
The prominent topographic features found in the province are the Tagaytay Ridge
and the Marikina Fault. The physiography of the western side of the province is
greatly influenced by the movement of the fault. The side towards Laguna de Bay
is the downthrown block while the up thrown block is manifested by the
topographic rise westward of Tagaytay Ridge.
The most important surface water bodies near the area are the Laguna de Bay
and Taal Lake. Laguna de Bay is a shallow lake that serves as a natural
detention reservoir of discharges from the surrounding tributary streams. Surface
water originating from the eastern portions of Silang flows in an easterly direction
before emptying into the lake; while surface water at the southern half of
Tagaytay City drains into the Taal Lake, a very deep surface water body.
Rivers and streams that originate from upland areas drain into the province.
These waterways, with long and narrow drainage areas, generally flow in
northerly and northwesterly directions before emptying into the Manila Bay or the
Laguna de Bay. The major river systems include the Maragondon River, Ilang-
ilang River, Cañas River, San Juan River, and Imus River (Figure 2.1-5).

Cavite Integrated Water Resource Management Master Plan
2-5
Source: NAMRIA, Cavite SEPP 2010
Figure 2.1-5 River Network
2.1.2.2 Vegetation and Land Use
The Province of Cavite lies at the western monsoon forest generally
characterized by tropical rainforest. As a result of deforestation and economic
developments, the tropical rainforest has been reduced to less than 10% of the
total land area. The remaining 4000-hectarerainforests in Maragondon and
Ternate were declared as national parks in 1976. Known as Mts. Palay-Palay and
Mataas na Gulod Protected Landscape, they lie on the southwestern border with
Batangas.
Agriculture comprises more than 50% of land use in the province.
Industrialization and urbanization have considerably reduced the cultivated areas.
The low lying flat areas are used as irrigated rice paddies while the central and
upland areas are used for non-irrigated rice lands, orchards, and livestock farms.
The upland areas are known for production of coffee, pineapples, bananas,
vegetables, cut flowers, and other fruit bearing trees. Figure 2.1-6 shows the
land use map of the province.

Cavite Integrated Water Resource Management Master Plan
2-6
Source: Water Resources Assessment and Development Plan for Sustainable Utilization of Water
Resources in Nine (9) LGUs in Cavite Province, SWECO-WATCON, Inc. Sept.2004
Figure 2.1-6 Provincial Land Use
2.1.2.3 Soil
The Province of Cavite is composed of several soil types (Figure 2.1-7). The
lowland area of Cavite is generally composed of Guadalupe clay and clay loam. It
is characterized as coarse and granular when dry, but sticky and plastic when
wet. Its substratum is solid volcanic tuff. Guadalupe clay adobe is abundant in the
southern part of Bacoor and Imus that is bordering Dasmariñas. The soil is hard
and compact and difficult to cultivate which makes it generally unsuitable for
diverse cropping. It is very sticky when wet and granular when dry. Hydrosol and
Obando sand are found along the Bacoor Bay. The shoreline of Rosario, Tanza,
Naic, and Ternate is composed of Guadalupe sand.

Cavite Integrated Water Resource Management Master Plan
2-7
Source: Water Resources Assessment and Development Plan for Sustainable Utilization of Water
Resources in Nine (9) LGUs in Cavite Province, SWECO-WATCON, Inc. Sept.2004
Figure 2.1-7 Provincial Soil Types
The central area principally consists of Magallanes loam with streaks of
Magallanes clay loam of a sandy texture. The eastern side of Cavite consists of
Carmona clay loam with streaks of Carmona clay loam steep phase and
Carmona sandy clay loam. This type of soil is granular with tuffaceaous material
and concretions. It is hard and compact when dry, and sticky and plastic when
wet. Guingua fine sandy loam is found along the lower part of Malabon and Ilang-
ilang River in Noveleta.
The type of soils that dominate the upland areas are Tagaytay loam and
Tagaytay sandy loam with mountain soil undifferentiated. These are found on the
south-eastern side that borders Laguna province. On the southern tip are
Magallanes clay and Mountain soil undifferentiated with an interlacing of

Cavite Integrated Water Resource Management Master Plan
2-8
Magallanes clay loam steep phase. Tagaytay loam contains fine sandy materials.
It is moderately friable, and is easy to work with when moist. In an undisturbed
condition, it bakes and becomes hard when dry. On the other hand, Tagaytay
sandy loam is friable and granular. It has a considerable amount of volcanic sand
and is underlain by adobe clay. Cavite also has the Patungan sand which is
characterized as pale gray to almost white sand with a substratum of marine
conglomerates. It is found in Sta. Mercedes in Maragondon and in some of the
coastlines of Ternate.
2.1.2.4 Geology
General Geologic Features
The Province of Cavite is part of the uplifted Central Luzon mobile block. All of its
exposed rocks were deposited during the Pliocene to Quaternary times. Volcanic
rocks on the flanks of volcanic cones were mapped as Pliocene. These rocks are
unconformably overlain by water-laid and sub-aerial pyroclastic deposits, some of
which are well-bedded. Dips normally conform to the underlying depositional
surface. In general, almost all underlying surfaces are irregular in view of faulting
and the erosion of rock sequences. The rocks vary from well lithified and
massive, to loose and bedded. The general geology of the area is presented in
Figure 2.1-8.
The southern portion of Cavite which includes the elevated portions of Silang,
Tagaytay City, and Alfonso (also known as the Cavite slope) is not part of a
mountainside of a strato-volcano as many believe. It is a structural slope that was
originally formed by the tilting movement of the block with low elevation. The
contour lines around Taal Lake show irregular shapes and do not show
concentric circles like those of a strato-volcano. At the same time, no steep cliffs
can be found on the eastern, western, and southern sides of the lake unlike in the
northern portion where a steep slope of more than 600 meters was developed
into what is now known as the Tagaytay Ridge. In addition, the lower parts of the
geologic units that are present in Tagaytay City that extend down to Silang and
parts of Carmona were deposited in a marine environment as sediments can still
be found in these areas. The amount of displacement is largest at the southern
margin of the tilted block with the southern side of the Tagaytay Ridge developing
into a very steep slope with a large relative height. The eastern margin of the
tilted block coincides with the Marikina Fault which course through the property.
Because of these displacements, deposition patterns of the underlying formations
are very much disturbed and are no longer contiguous. Volcanic activities prior to
the tilting movement happened in the lowlands connecting Balayan Bay with the
Laguna Lake.

Cavite Integrated Water Resource Management Master Plan
2-9
Source: Water Resources Assessment and Development Plan for Sustainable Utilization of
Water Resources in Nine (9) LGUs in Cavite Province, SWECO-WATCON, Inc. Sept.2004
Figure 2.1-8 General Geology
Basement Rocks
The deep-seated formations underlying the study area are considered collectively
as Basement. It is mainly composed of marine sediments such as sandstone,
mudstone, and limestone that are commonly found in Mt. Talipusa in
Maragondon.
Quaternary Guadalupe Formation.
The Quaternary Guadalupe Formation is composed of pyroclastic and
sedimentary units which crop out along the rolling hills west of the Marikina Fault.
The Guadalupe Formation underlies the alluvium in the northern portion of the
entire province. It consists of clastic debris and tuffaceous sedimentary rocks
which are of volcanic origin. The foothills and the portions covered by these
formations are largely composed of fractured tuff. Lithologic descriptions of well
logs drilled in the area are often described as layers of volcanic tuff, volcanic ash,
pumice, and other volcanic derived clastic deposits.
The thickness of the Guadalupe Formation is estimated to range from 1,300 to
2,000 meters. It forms a huge groundwater basin containing several connected

Cavite Integrated Water Resource Management Master Plan
2-10
and inter-related aquifers made up of tuffaceous sandstone and conglomerate.
Groundwater recharge occurs in the western terrace contiguous to Tagaytay City.
In the Cavite Water Supply and Development Study conducted by JICA in 1995,
this formation was locally referred to as the Kaybubutong Formation which is
subdivided as:
a) Upper Kaybubutong member (Kau) - composed of pumice, scoria, and mudflow deposits.
b) Middle Kaybubutong member - made-up of andesitic lava, mudflow, and scoria.
c) Lower member (Kal) - consists of tuffaceous sand, gravel, and silt. The thickness of the Kaybubutong Formation ranges from 100 – 350 meters.
The Kaybubutong Formation is characterized by coarse-grained volcanic fall
deposits in the southern area, while sand, gravel, and silt are found in the
northern area. The reworked pyroclastic deposits and the uncemented
sequences show the most relevant hydrologic properties as water-bearing
deposits. They vary from fine ash deposits to pyroclastic materials consisting of
fine to coarse-grained sand. Randomly, cobbles and boulders may occur. Water
can be exploited from these deposits as evidenced by several productive wells
tapping mostly the lower member. The large pore space in many coarse-grained
rocks provides storage for a big volume of water. The porosity of tuff and
tuffaceous sandstone ranges from less than 5% to a maximum of 30%. Variation
in permeability is controlled chiefly by differences in the grain size of the tuff or
tuffaceous sandstone. Also, reduction in permeability is caused by the closer
packing of grains in the rock and restriction of the pore space by the presence of
cementing materials.
Firmly cemented tuff and tuffaceous sandstone with lower porosities and
permeabilities can also yield water to wells along fractures. The most favorable
areas for the development of groundwater are along fault zones and within
thoroughly jointed zones. Also, better wells are found in broad valleys and on flat
upland areas than on hill crests and valley slopes. The permeability of rocks
generally decreases with depth.
Alluvium (QAL)
The alluvium is distributed in the coastal areas of Manila Bay. It is mainly
composed of soft clay, loose sand, and gravel. The alluvium generally forms a
phreatic aquifer in the coastal areas. The thickness of the alluvium varies as well
as the size of the sediments. Exact determination of the thickness of the alluvium
is hard because of the difficulty in distinguishing it from the underlying pyroclastic
sediments.
Moderate well yields can be obtained from almost all wells drilled in the alluvium,
with much larger yields available where the thickness of the permeable zones is
bigger. Areas that are largely deposited with clay and silt are to be avoided and

Cavite Integrated Water Resource Management Master Plan
2-11
areas near sources of recharge that have greater thickness of saturated sand and
gravel must be located.
2.1.2.5 Seismicity
Based on records of past earthquakes, the area can be affected by the following
geologic structures (Figure 2.1-9):
a) Lubang Fault – This fault is located approximately 100 km SW of the site and is the second closest earthquake generator to the area. Historical records show that this fault is seismically active but is unlikely to generate strong earthquakes due to its high level of seismicity, as indicated by frequent stress releases through small magnitude tremors.
b) Philippine Fault Zone – This is a major fault measuring approximately 1,300 km and is the source of the most destructive tremors, most specifically the ones that produced the July 16, 1990 earthquake. The nearest segment to the project site is located approximately 100 km east and maybe the epicenter of future earthquakes.
c) Manila Trench – This structure is a subduction zone where the China Sea Plate is slipping beneath the Philippine Plate. It is located approximately 200 km west of the project site and is believed to be the origin of tsunamigenic earthquake.
Source : PHILVOCS
Figure 2.1-9 Active Faults and Trenches

Cavite Integrated Water Resource Management Master Plan
2-12
Another possible generator of earthquakes in the province of Cavite is the West
Valley Fault System (also known as the Marikina Fault). It is a north-south
trending active fault in the Metro Manila district (Figure 2.1-10). The Valley Fault
System (VFS) consists of two (2) parallel faults, namely, the West Valley Fault
and the East Valley Fault, which form a pull-apart basin. The Valley Fault System
trends N 20-40° E with near vertical dips. The trace of the West Valley Fault
extends north of Montalban in western Rizal province and passes east of Metro
Manila to the south, possibly as far as Tagaytay Ridge.
Source : PHILVOCS
Figure 2.1-10 West Valley Fault

Cavite Integrated Water Resource Management Master Plan
2-13
2.1.3 Meteorology
2.1.3.1 Climate
The study area is characterized by Type IClimate under the Modified Corona Classification System (Figure 2.1-11). The System is classified into four (4) types
depending on rainfall distribution and pattern described as follows:
a) Type I: Two pronounced seasons. Dry from November to April, and wet during the rest of the year.
b) Type II: No dry season with very pronounced rainfall from November to April and wet during the rest of the year.
c) Type III: Seasons are not very pronounced, relatively dry from November to April and wet during the rest of the year.
d) Type IV: Rainfall is more or less evenly distributed throughout the year
Source: PAGASA
Figure 2.1-11 Climate of the Philippines and Frequency of Typhoons
2.1.3.2 Temperature and Relative Humidity
The temperature and relative humidity of the study area can both be described by
the data obtained from the Sangley Point and Ambulong stations presented in
Table 2.1-1 below.

Cavite Integrated Water Resource Management Master Plan
2-14
Table 2.1-1 Temperature and Relative Humidity, Sangley Point and Ambulong Stations
Parameter Jan Feb Mar Apr May Jun Jul Aug Sep Oct Nov Dec Annual
Temperature, C ° Sangley Point, Cavite
Max 30.0 30.8 32.7 34.4 34.1 32.8 31.7 31.3 31.4 31.4 31.1 30.0 31.8
Min 23.3 23.6 24.6 25.9 26.1 25.8 25.3 25.2 25.2 25.3 25.0 23.9 24.9
Mean 26.6 27.2 28.6 30.1 30.1 29.3 28.5 28.3 28.3 28.4 28.1 27.0 28.4
Rel. Humidity 79 76 74 71 74 78 81 83 82 81 80 79 78
Temperature, C ° Ambulong, Batangas
Max 30.4 31.6 33.2 34.5 33.9 32.5 31.4 31.0 31.4 31.6 31.4 30.2 31.9
Min 22.2 22.1 22.9 23.9 24.6 24.6 24.1 24.3 24.1 23.9 23.6 22.8 23.6
Mean 26.3 26.9 28.1 29.2 29.2 28.6 27.8 27.6 27.8 27.7 27.5 26.5 27.8
Rel. Humidity, % 79 77 74 73 76 80 83 84 84 83 81 80 80
Source: PAGASA
Monthly temperature ranges from a minimum of 22°C to a maximum of 35°C.
Mean monthly temperature varies little around the year, from 26°C to 30°C, with
an annual temperature averaging 28°C. The coldest months are from December
to February, while the hottest months are April and May. Mean. The mean
relative humidity is highest in August and September at 84%.
2.1.3.3 Evaporation
The mean daily evaporation rate for the Province (Table 2.1-2), reckoned from
the Tagaytay City station, averages 3.87 mm/day, with the lowest occurring in
December and the highest occurring in April.
Table 2.1-2 Average Daily Evaporation Rate, Tagaytay City Station
Jan Feb Mar Apr May Jun Jul Aug Sep Oct Nov Dec Annual
Mean 3.7 4.2 4.4 5.5 4.7 3.9 3.5 3.3 3.2 3.4 3.4 3.2 3.9
Stdev 0.7 0.6 1.8 1.0 0.9 0.6 0.4 0.6 0.3 0.4 0.5 0.5 0.4
Median 3.7 4.3 4.8 5.5 4.9 3.8 3.5 3.2 3.2 3.4 3.2 3.1 3.8
Cv 0.18 0.14 0.42 0.18 0.20 0.16 0.11 0.17 0.11 0.13 0.16 0.15 0.10
Source: PAGASA
2.1.3.4 Winds
The prevailing wind direction conforms with the dominant air stream during the
different months. The northerly winds affect the project area from November to
January with an average speed of 2.3 m/s. From May to October, the prevailing
winds are from the southwest with an average speed of 3.0 m/s. Other wind
directions occur less frequently. Each year the Philippines experiences several
typhoons with destructive winds and torrential rains. The monthly normal and
extreme wind speed and direction, taken from the Sangley Point and Ambulong
Stations, are detailed in Table 2.1-3.

Cavite Integrated Water Resource Management Master Plan
2-15
Table 2.1-3 Monthly Normal and Extreme Wind Speed and Direction, Sangley Point and Ambulong Stations
Parameter Jan Feb Mar Apr May Jun Jul Aug Sep Oct Nov Dec Annual
Normal¹ Sangley Point, Cavite
Wind Speed, mps
3.0 3.0 3.0 3.0 3.0 3.0 3.0 3.0 3.0 3.0 3.0 3.0 3.0
Wind Direction
ESE ESE ESE ESE ESE ESE W SW W ESE ESE ESE ESE
Extreme²
Wind Speed, mps
17 15 24 16 27 23 54 30 44 45 49 22 54
Wind Direction
ESE ESE ESE ESE SW NW E W NNW NW NW NNW E
Normal¹ Ambulong, Batangas
Wind Speed, mps
2 2 2 1 1 1 1 2 1 1 2 2 2
Wind Direction
NE NE NE NE NE SW SW SW SW NE NE NE NE
Extreme²
Wind Speed, mps
20.0 24.0 22.0 18.0 41.0 40.0 75.0 40.0 54.0 70.0 45.0 54.0 75.0
Wind Direction
ENE NE ENE SE SW SW W NNE SSW S NE NE W
Source: PAGASA Notes:
1 Period of Record: 1981-2010 2
Period of Record: 1950-2010
2.1.3.5 Tropical Cyclones
The presence of Tropical cyclones is the most influential factor that brings
considerable rainfall to the Philippines. Typhoons usually occur from June to
December with the highest frequencies in July and August. The cyclones
originate from the region of Marianas and Caroline Islands in the Pacific Ocean,
usually between 125°E and 170°E. Their movements follow a westerly or
northwesterly course over the country and deposit substantial amounts of rainfall.
The most frequent disastrous typhoons generally occur during the months of
September through November.
The Philippines is a typhoon-prone area. During the past 53-year period from
1948-2000, a total of 1,038 tropical cyclones crossed the Philippine Area of
Responsibility with Cavite experiencing 2 tropical depressions, 11 tropical storms,
and 11 typhoons. The province ranked as the 40th most visited by this weather
system.
The country experiences an average of 19.6 typhoons a year in its area of
responsibility. The normal high incidence of typhoons brings in heavy rains when
it coincides with the southwest monsoon occurrence from June to September.

Cavite Integrated Water Resource Management Master Plan
2-16
Storm surges accompany tropical depressions and cause extreme flood
occurrences. They devastate many low-lying coastal areas. Studies at selected
stations in the Philippines have shown that 47% of the average yearly rainfall is
due to tropical cyclones, 14% to monsoons, and 39% to other weather
disturbances such as thunderstorms, easterly waves, International Tropical
Convergence Zones (ITCZ), and fronts.
2.2 INFRASTRUCTURE
2.2.1 Transportation
The primary mode of transport in the province of Cavite is via the network of
national, provincial, city/municipal, and barangay roads, totaling about 2,186.46 km
long. National roads link Cavite with its neighboring provinces while provincial
roads form a network among the different municipalities and cities within it.
About18.71%of the total road length are national roads, 16.91% are provincial
roads, 14.9% are city/municipal roads, and the remaining 49.48%are barangay
roads. 87.37% of the city/municipal roads are concrete, while most of the
barangay roads are combinations of concrete and earth.
Cavite has six (6) major entrances and exits, namely : (i) the Aguinaldo Boulevard
(Manila-Cavite Coastal Road), (ii)South Luzon Expressway (SLEX) in Carmona,
the (iii) Aguinaldo Highway (Batangas-Alfonso-Tagaytay Road), (iv) Zapote-Las
Piñas Road, (v) Sta .Rosa-Tagaytay Road, and (vi) Alabang-Molino via Daang Hari
Road.
There are 323 bridges with a total length of 6,319.48 m which connect roads in the
different cities and municipalities of the province. About 200 of these bridges with a
combined length of 5,700m are permanent, while the remaining 36 with a
combined length of about 650m are considered temporary structures.
Major land transport projects in the pipeline which will impact the province are the
Cavite-Laguna National Road Project and Light Rail Transit (LRT)-Line1 South
Extension. The CALA Road Project consists of two (2) components - the 27.2 km.,
6-lane North-South Road from Bacoor, Cavite to Sta. Rosa Laguna and the 24.3
km. East-West Road that extends Daang Hari Road eastward to SLEX and
westward to Tanza, Cavite. The LRT Line 1 South Extension project extends from
Baclaran to Bacoor, Cavite.
2.2.2 Communication
The telephone service providers in the province are the Philippine Long Distance
Telephone Company (PLDT), Digital Telecommunications Philippines,
Inc.(DIGITEL), and Globe Telecommunications. PLDT is the biggest service
provider in terms of landline telephone service with a market share of 44.99%in
2010.

Cavite Integrated Water Resource Management Master Plan
2-17
In terms of other services, Smart Communications has the most number of cell
sites in the province, followed by Globe Telecom, Inc. and the Sun Cellular
Network, which is powered by Digitel Mobile Philippines. The Philippine Telegraph
and Telephone Company (PT & T), Radio Communications of the Philippines, Inc.
(RCPI), LBC Express, Inc., and DHL Forwarder also perform specific
telecommunication and courier services throughout the province. There is a limited
number of local radio stations in Cavite due to its proximity to Metro Manila.
For postal services, the Philippine Postal Corporation has 34 post offices in the
province, as of 2010, that are responsible for posting and delivering both domestic
and international mail.
2.2.3 Water Supply
Generally, the entire province of Cavite has access to clean and safe water
delivered by public and private service agencies (12 Water Districts, 2 LGU-
managed and 4 private suppliers). Private subdivisions and Barangays which are
not covered by those agencies have their own water systems, provided by the
respective homeowners associations and barangay waterworks and sanitation
associations (BWSAs). The province sources its water supply mainly from
groundwater through wells and springs. While springs are commonly used in the
upland and rural areas, all others use deepwells as the traditional water source.
The three levels of service recognized in domestic waterworks (Box 2.1) are found
in the entire province.
Box 2.1 Level of Service in Waterworks
The water supply service coverage per city and municipality based on the 2009
data from the Provincial Health Office is shown in Table 2.2-1. Level I facilities exist
in almost the entire province, except in the municipalities of Carmona, Gen.
Mariano Alvarez and Magallanes. Level II systems can be found in Rosario, Silang,
Based on NEDA Board Resolution No. 5, series of 1998, water service levels are classified
into three (3) types, based on the method by which water is collected by households.
These three levels are :
a) Level I, a point source, consists of a protected well or a developed spring with an outlet, but without a distribution system. It normally serves an average of 15 households within a radius of 250 meters and is found in rural areas due to its affordability and the dispersion of houses. Travel to the source is necessary to collect water.
b) Level II, a communal faucet system or stand post, is generally suited for rural and urban fringe areas where the clustering of houses in sufficient density makes a simple piped system practicable. One (1) faucet usually serves four (4) to six (6) households within a radius of 25 meters. Travel is still necessary to collect water.
c) Level III consists of a source, a reservoir, a piped distribution network, and individual household taps. It is suited for densely populated urban areas where the population can afford individual connections.

Cavite Integrated Water Resource Management Master Plan
2-18
Tagaytay, Alfonso, Gen. Aguinaldo, Indang, Magallanes, and Naic. Level III service
on the other hand is available in all the cities and municipalities except Gen.
Aguinaldo, with service coverage per city/municipality ranging from 12% in Ternate
to 100% in Carmona and Gen. Mariano Alvarez (Figure 2.2-1).
Table 2.2-1 Water Supply Service Coverage by City/Municipality
CITY/ MUNICIPALITY
LEVEL I LEVEL II LEVEL III TOTAL
No. of HH % No. of HH % No. of HH %
District I 12,469 23.73 1,004 1.91 39,065 74.36 52,538
Cavite City 2,694 12.00 19,760 88.00 22,454
Kawit 3,775 31.50 8,210 68.50 11,985
Noveleta 3,019 48.40 3,218 51.60 6,237
Rosario 2,981 25.13 1,004 8.46 7,877 66.41 11,862
District II 31,434 43.40 40,995 56.60 72,429
Bacoor 31,434 43.40 40,995 56.60 72,429
District III 17,968 44.78 22,161 55.22 40,129
Imus 17,968 44.78 22,161 55.22 40,129
District IV 115 0.12 94,130 99.88 94,245
Dasmariñas City 115 0.12 94,130 99.88 94,245
District V 97 0.15 2,631 4.01 62,946 95.85 65,674
Carmona 11,340 100.00 11,340
Gen. M.Alvarez 22,010 100.00 22,010
Silang 97 0.30 2,631 8.14 29,596 91.56 32,324
District VI 13,216 15.98 69,481 84.02 82,697
TreceMartires 226 2.40 9,186 97.60 9,412
Amadeo 6 0.12 5,006 99.88 5,012
Gen. Trias 5,807 14.60 33,969 85.40 39,776
Tanza 7,177 25.19 21,320 74.81 28,497
District VII 10,977 18.42 7,224 12.12 41,397 69.46 59,598
Tagaytay City 297 2.93 716 7.07 9,120 90.00 10,133
Alfonso 121 1.60 45 0.59 7,402 97.81 7,568
Gen. Aguinaldo 20 0.71 2,811 99.29 2,831
Indang 235 2.45 1,424 14.82 7,949 82.73 9,608
Magallanes 1,532 53.42 1,336 46.58 2,868
Maragondon 1,164 22.20 4,080 77.80 5,244
Mendez 180 4.30 4,004 95.70 4,184
Naic 6,109 43.90 696 5.00 7,111 51.10 13,916
Ternate 2,851 87.83 395 12.17 3,246
TOTAL 86,276 18.46 10,859 2.32 370,570 79.30 467,310
Source: Cavite SEPP, 2009

Cavite Integrated Water Resource Management Master Plan
2-19
Source: Cavite SEPP, 2009
Figure 2.2-1 Level III Water Service Coverage (2009)
2.2.4 Existing Water Service Providers
The existing water service providers are the water districts, Local Government
Units (LGU), Maynilad Water Services, Inc. (MWSI), and small water service
providers which sell in bulk or through individual house connections. Water Districts
under the Local Water Utilities Administration (LWUA) supply 3 cities and nine (9)
municipalities, namely:
a) Tagaytay City b) Trece Martires City c) Dasmarinas City d) Amadeo e) Carmona f) Gen. Emilio Aguinaldo g) Gen Mariano Alvarez h) Indang i) Maragondon j) Mendez k) Silang l) Tanza

Cavite Integrated Water Resource Management Master Plan
2-20
Private corporations that operate as water service providers include: (i) General
Trias Water Corporation in Gen. Trias, (ii) Naic Water System Corporation in
Naic, and (iii) Western Cavite Water Supply and Service Corporation in Ternate.
The municipal governments of Alfonso and Magallanes manage their respective
water supply systems. The details of the existing water supply facilities are shown
in Annex II-1.
The existing water rate schedule of each water service provider is shown in Table
2.2-2. For the 12 water districts, the minimum charge (first 10 m3) for residential
connections ranges from P158 in Dasmariñas City to P280.00 in General Mariano
Alvarez. The average minimum monthly charge is P198.29.
Table 2.2-2 Existing Water Rates
(11-20 m3) (21-30 m3) (31-40 m3) (41-50 m3) (Over 50 m3)
District I
Cavite City Maynilad Water Services, Inc. 129.07 15.77 29.97 29.97 39.36 39.36 1/1/2012
Kawit Maynilad Water Services, Inc. 129.07 15.77 29.97 29.97 39.36 39.36 1/1/2012
Noveleta Maynilad Water Services, Inc. 129.07 15.77 29.97 29.97 39.36 39.36 1/1/2012
Rosario Maynilad Water Services, Inc. 129.07 15.77 29.97 29.97 39.36 39.36 1/1/2012
District II
Bacoor Maynilad Water Services, Inc. 129.07 15.77 29.97 29.97 39.36 39.36 1/1/2012
District III
Imus Maynilad Water Services, Inc. 129.07 15.77 29.97 29.97 39.36 39.36 1/1/2012
District IV
Dasmariñas City Dasmariñas Water District 158.00 19.00 22.80 26.80 30.85 30.85 6/23/2011 8/1/2011
District V
Carmona Carmona Water District 238.60 26.20 29.00 32.60 37.00 37.00 3/16/2004 4/1/2006
Gen. M. Alvarez Gen. M. Alvarez Water District 280.00 29.65 32.35 35.70 40.65 40.65 6/23/2011 8/1/2011
Silang Silang Water District 210.85 22.80 25.15 28.10 31.60 31.60 5/19/2009 1/1/2011
District VI
Trece Martires City Trece Martires Water District 170.00 18.25 19.55 20.90 23.50 23.50 7/8/2008 1/1/2010
Amadeo Amadeo Water District 195.00 28.00 30.00 33.00 37.00 37.00 3/15/2005 2/1/2009
Gen. Trias Gen. Trias Water Corporation
Tanza Tanza Water District 180.00 18.30 19.45 20.90 23.25 23.25 2/3/2009 1/1/2011
District VII
Tagaytay City Tagaytay City Water Dsitrict 233.00 25.80 28.55 31.80 35.30 35.30 2/15/2005 1/1/2011
Alfonso Alfonso Waterworks Office(1st 8 m3)
50.00
Gen. Emilio Aguinaldo Gen. E. Aguinaldo Water District 163.00 17.30 19.70 23.45 27.60 27.60 6/4/2003 1/1/2006
Indang Indang Water District 188.00 22.25 24.90 27.25 27.25 27.25 2/23/2010 4/1/2010
Magallanes Magallanes Waterworks Office 70.00
Maragondon Maragondon Water District 168.00 18.00 19.00 21.50 24.00 27.00 7/27/2010 9/1/2010
Mendez Mendez Water District 195.00 21.50 24.00 27.25 30.75 30.75 6/19/2002 2/1/2006
Naic Naic Water Supply Corporation 120.00 13.00 13.00 13.00 13.00 13.00
TernateWestern Cavite Water Supply and
Services Corp.144.00 15.50 17.00 19.00 21.50 24.50
AVERAGE Water Districts only 198.29 22.25 24.54 27.44 30.73 30.98
Provincial 160.81
City/ Municipality
12.00/m3 ( In excess of 8 m3)
Date AppliedDate
Implemented
Commodity ChargesMinimum Charge
(1st 10 m3)Water Utility/Service Provider
Source: LWUA, MWSI, Cavite PPDO
For LGUs and private corporations, the minimum charge ranges from P50.00 in Alfonso to P144.00 in Ternate. MWSI charges P129.07 for the first 10 m3. The aggregate maximum production capacity of the water agencies serving the
province of Cavite corresponding to a total of 293 pumping stations is estimated
at 303,397.34 cu.m./day. Table 2.2-3 provides a breakdown of the estimated
maximum water production capacity per concerned water agency.

Cavite Integrated Water Resource Management Master Plan
2-21
Table 2.2-3 Estimated Maximum Water Production Capacity Per Water Agency
Water Agency Number of Pumping Stations
Maximum Production Capacity (cu.m./day)
1. Alfonso Waterworks Office 3 1,898.00
2. Amadeo Water District 10 3,123.00
3. Carmona Water District 10 14,136.04
4. Dasmariñas Water District 108 144,n123.43
5. Gen. Aguinaldo Water District* 3 2,643.84
6. GMA Water District** 14 10,354.38
7. Indang Water District 10 5,733.53
9. Magallanes Water district NA NA
10. Maragondon Water District 5 5,703.00
11. Maynilad Water Services, Inc. * 17 12,989.00
12. Mendez Water District 7 3,869.00
8. Naic Water Supply Corporation** 4 124.19
13. Silang Water district 60 39,892.30
14. Tagaytay Water District 15 23,022.00
15. Tanza Water District 6 7,779.67
16. Western Cavite Water Supply & services Corporation* 1
13,750.00
17. TMC Water District 20 14,255.96
Total 293 303,397.34
Source: PPDO, Naic Water Supply Corporation; NA – not available
2.2.5 Sanitation and Sewerage
As determined by the 2000 NSO Census Survey, 92.16% of the households in
Cavite have adequate sanitation facilities (Table 2.2-4). However, there is no
existing piped wastewater collection in Cavite, nor are there any treatment
facilities for septage. The 2000 Census data indicate that, for households with
water-sealed toilets, 74.68% discharge their excreta waste into septic tanks,
while 17.48% discharge their waste into vaults or other depositories. Septic tank
effluent is generally allowed to leach into the ground. Some are discharged into
nearby drains, ditches, or watercourses.
There are no public sewerage systems in Cavite. Most households in urban
centers dispose of their wastewater through septic tanks which pass effluents
directly into street canals or adjacent watercourses.
In agricultural areas, water-sealed latrines which discharge their contents into a pit
are widely used. However, many toilets are flushed directly into watercourses, rice
fields, and drains. Ground water pollution becomes a serious issue, particularly in
coastal areas where the ground water table is relatively high.

Cavite Integrated Water Resource Management Master Plan
2-22
Table 2.2-4 Inventory of Sanitation Facilities by City/Municipality
% No. of HH % No. of HH % No. of HH % No. of HH % No. of HH % No. of HH % No. of HH % No. of HH
CITIES
DASMARINAS CITY 77,315 23 63,893 10 6,465 6 3,627 2 1,422 1 899 0.64 412 0.27 174 0.66 423
TRECE MARTIRES CITY 8,761 2 6,146 12 707 18 1,096 4 271 1 66 2.21 136 2.2 135 3.32 204
CAVITE CITY 21,342 5 13,142 17 2,182 15 1,931 7 975 7 907 4.79 629 3.61 474 8.39 1,102
TAGAYTAY CITY 8,590 2 5,907 12 695 10 579 2 141 15 867 3.86 228 0.78 46 2.15 127
MUNICIPALITIES
ALFONSO 8,045 2 5,335 15 814 21 1,125 5 248 6 340 1.12 60 - - 2.31 123
AMADEO 5,470 1 3,544 7 262 36 1,265 3 116 5 169 2.4 85 0.28 10 0.54 19
BACOOR 64,067 15 41,104 17 6,793 18 7,434 10 3,908 4 1,654 1.53 628 3.09 1,270 3.1 1,276
CARMONA 10,430 2 5,580 12 687 52 2,884 9 490 4 217 7.42 414 1.11 62 1.72 96
GEN. E. AGUINALDO 2,765 1 1,686 9 148 35 587 7 116 3 49 4.33 73 1.07 18 5.22 88
GEN. TRIAS 23,299 5 14,364 21 2,975 26 3,671 8 1,126 2 340 0.88 126 0.44 63 4.41 634
IMUS 42,232 10 29,099 7 1,996 25 7,194 9 2,632 1 261 0.32 94 2.78 809 0.51 147
INDANG 10,608 3 7,255 15 1,091 16 1,139 7 530 1 82 1.83 133 - - 5.21 378
KAWIT 13,510 3 9,213 17 1,546 11 1,044 4 386 6 597 2.44 225 4.05 373 1.37 126
MAGALLANES 3,422 1 1,490 21 306 70 1,049 3 52 19 290 6.24 93 0.40 6 9.13 136
MARAGONDON 6,282 1 3,657 15 554 14 527 7 262 5 172 0.79 29 4.32 158 25.24 923
MENDEZ 4,758 1 3,949 13 515 3 109 4 144 1 22 0.25 10 - - 0.23 9
NAIC 15,230 2 6,850 21 1,415 46 3,119 17 1,156 12 823 6.61 453 10.86 744 9.78 670
NOVELETA 6,934 1 3,813 10 395 43 1,622 11 416 3 127 2.05 78 8.71 332 3.96 151
ROSARIO 15,780 2 6,987 23 1,632 30 2,088 31 2,175 15 1,074 2.33 163 14.66 1,024 9.12 637
SILANG 30,847 7 18,512 15 2,783 26 4,836 8 1,406 6 1,063 4.92 911 4.40 814 2.82 522
TANZA 23,059 4 11,517 11 1,313 46 5,296 18 2,048 10 1,166 4.61 531 2.35 271 7.96 917
TERNATE 3,541 0 1,325 36 474 51 682 21 283 31 413 3.62 48 4.45 59 19.4 257
GMA 22,592 6 17,042 18 3,117 7 1,276 3 480 1 233 1.48 252 0.52 89 0.6 103
Total 428,879 65.62% 281,410 9.06% 38,865 12.63% 54,180 4.85% 20,783 2.76% 11,831 1.35% 5,811 1.62% 6,931 2.11% 9,068
Source: National Statistics Office, 2000
None
KIND OF TOILET FACILITY
CITY/MUNICIPALITYTotal
Household
Others
(Pail System, etc.)
Water-sealed,
Sewer/Septic Tank,
used exclusively by
households
Water-sealed,
Sewer/Septic Tank,
shared with other
households
Water-sealed, other
Depository used
exclusively by
households
Water-sealed, other
Depository shared
with other
households
Closed Pit Open Pit

Cavite Integrated Water Resource Management Master Plan
2-23
2.2.6 Solid Waste Disposal Systems
As of 2010, only Dasmariñas City and Tagaytay City have a centralized material
recovery facility (MRF) while only 14 municipalities were able to implement the
MRF system in their respective barangays. Waste that can no longer be recycled,
also known as residual waste, is disposed of in dumpsites or sanitary landfills.
There are five (5) open dumpsites that can be found in Rosario, Gen. M. Alvarez,
Gen. Aguinaldo, Indang, and Maragondon. These are considered unsanitary
because of the presence and accumulation of uncontrolled hazards to health and
sanitation.
On the other hand, controlled dumpsites are those that are monitored by the
municipal government. Even though the area is secured, health hazards through
leachate are still present and remain unaddressed. In 2010, there were10
controlled dumpsites allover Cavite that serve as main disposal sites of residual
waste. The waste disposal sites per city/municipality are tabulated in Table 2.2-5
and correspondingly shown in Figure 2.2-2.
Although it‘s not yet operational, an Environmental Compliance Certificate (ECC)
has already been issued to a Sanitary Landfill with Material Recovery Facility in
Ternate which is expected to accommodate and manage the solid waste produced
by both domestic and industrial sectors of the Province.
Industrial waste is segregated and disposed of through the companies‘ respective
solid and wastewater disposal and treatment facilities. According to the records of
PG-ENRO, there are 17 companies which offer special treatment of hazardous and
infectious waste in Cavite.
Figure 2.2-2 Solid Waste Disposal Map

Cavite Integrated Water Resource Management Master Plan
2-24
Table 2.2-5 Cavite Province Disposal Sites, 2010
Location Area, ha Type Capacity Status
CITIES
DASMARINAS CITY Brgy. Salawag 6.00 Controlled Dumpsite - Operating
TRECE MARTIRES CITY Brgy. De Ocampo 0.50 Open Dumpsite 4.8 tons -
CAVITE CITY San Pedro, Laguna - Open Dumpsite 60 tons Operating
TAGAYTAY CITY San Pedro, Laguna - By Contract / Sanitary Landfil l 41 tons -
MUNICIPALITIES
ALFONSO Brgy. Marahan I 0.40 Controlled Dumpsite 18.88 m3 Operating
AMADEO - Controlled Dumpsite 12.00 m3 Closed
BACOOR San Pedro, Laguna - By Contract / Sanitary Landfil l - -
CARMONA San Pedro, Laguna - By Contract / Sanitary Landfil l 10-15 tons -
GEN. E. AGUINALDO Brgy. Lumipa 1.25 Open Dumpsite - Operating
GEN. TRIAS Brgy. Tapia 1.50 Open Dumpsite 200 m3 Operating
IMUS Brgy. Pasong Buaya 1.37 By Contract / Sanitary Landfil l 150 m3 -
INDANG Brgy. Banaba Lejos 4.70 Controlled Dumpsite 24 m3 Operating
KAWIT 0.01 Open Dumpsite - Operating
MAGALLANES Brgy. Kabulugan, Caluangan, Urdaneta - Open Dumpsite - -
MARAGONDON Brgy. Layong Mabilog 1.60 Controlled Dumpsite 9,000 m3 Operating
MENDEZ Brgy. Asis II (Eco-center) 0.75 Controlled Dumpsite 78 m3 Operating/Under-going Rehabilitation
NAIC Brgy. Sabang 1.30 Controlled Dumpsite 10-12 tons Operating/Under-going Rehabilitation
NOVELETA Poblacion, Noveleta 0.15 Open Dumpsite 2 tons Operating
ROSARIO San Pedro, Laguna - By Contract / Sanitary Landfil l - -
SILANG Brgy. Lalaan I 1.20 Controlled Dumpsite 12-15 tons Operating/Under-going Rehabilitation
TANZA Brgy. Sahud-Ulan 5.00 Open Dumpsite 60 tons Operating
TERNATE Brgy. Sapang II 3.00 Controlled Dumpsite 7.072 m3 Operating/Under-going Rehabilitation
GMA Brgy. Poblacion 5 0.07 Controlled Dumpsite 20-30 tons Operating
Source: Provincial Government Environment and Natural Resources Office
EXISTING DUMPSITECITY / MUNICIPALITY

Cavite Integrated Water Resource Management Master Plan
2-1
2.3 SOCIO-ECONOMIC AND DEMOGRAPHIC ENVIRONMENT 2.3.1 Population, Density and Growth Rate
Cavite‘s population reached 3.09 million in 2010, making it the most populated
province in the country. It experienced an annual growth of 4.12%, dramatically
increasing its population by 49.8% from 2.06 million in 2000. This pace of growth
is more than twice the national average growth rate of 2% per year and is an
indication of a strong migration pattern into the province. The observed in-
migration is brought about by two factors, namely : (i) the presence of affordable
housing in suburban areas that is highly accessible to the central business
districts of Metro Manila; and,2) increased job opportunities due to the growing
presence of industrial estates.
Districts IV, VI and II are the three most populated districts, accounting for 53.8%
of the total provincial population in 2010. Districts VI and II have been growing
very rapidly, at 7.2% and 5.5% respectively, in view of the industrialization
activities prevailing in the area. Table 2.3-1 shows a cross-section of provincial
population, disaggregated growth rates, and population density in 2000 and
2010.
Table 2.3-1 Cavite: Population and Population Density, by City/Municipality, 2000-2010
City/ Municipality Land Area
(ha)
Population (‘000) Population growth
2000-2010 (%p.a.)
Density: 2010
(P/ha) 2000 2010
District I 3,631 267.7 313.2 1.6 86.3
Cavite City 1,183 99.4 101.1 0.18 85.5
Kawit 1,340 62.7 78.2 2.23 58.4
Noveleta 541 32.0 41.7 2.69 77
Rosario 567 73.7 92.2 2.28 162.7
District II 5,240 305.7 520.2 5.5 99.3
Bacoor 5,240 305.7 520.2 5.46 99.3
District III 9,701 195.5 301.6 4.43 31.1
Imus 9.701 195.5 301.6 4.43 31.1
District IV 8,234 379.5 575.8 4.26 69.9
City of Dasmariñas 8,234 379.5 575.8 4.26 69.9
District V 19,671 316.4 427.0 3.0 21.7
Carmona 3,092 47.9 75.0 4.59 24.3
Gen. M. Alvarez 938 112.4 138.5 2.11 147.7
Silang 15,641 156.1 213.5 3.18 13.6
District VI 30,105 285.6 570.1 7.2 18.90
Trece Martires City 3,917 41.6 104.6 9.64 26.7
Amadeo 4,790 25.7 33.5 2.66 7.0
Gen. Trias 11,768 107.7 243.3 8.49 20.7
Tanza 9,630 110.5 188.8 5.50 19.6
District VII 66,124 312.7 382.7 2.00 5.80
Tagaytay City 6,615 45.3 62.0 3.20 9.4

Cavite Integrated Water Resource Management Master Plan
2-2
City/ Municipality Land Area
(ha)
Population (‘000) Population growth
2000-2010 (%p.a.)
Density: 2010
(P/ha) 2000 2010
Alfonso 6,460 39.7 48.6 2.04 7.5
Gen. Aguinaldo 5,103 14.3 17.5 2.03 3.4
Indang 8,920 51.3 62.0 1.92 7.0
Magallanes 7,860 18.1 21.2 1.61 2.7
Maragondon 16,549 31.2 35.3 1.23 2.1
Mendez 1,667 22.9 28.6 2.20 17.1
Naic 8,600 72.7 88.1 1.95 10.2
Ternate 4,350 17.2 19.3 1.17 4.4
Total 142,706 2,063.1 3,090.7 4.12 21.7
Source: National Statistics Office (NSO); Cavite SEPP 2010
The three (3) cities/municipalities that have the fastest growing population are:
Trece Martires City (9.64% p.a.), Gen. Trias (8.49% p.a.), and Tanza (5.5% p.a.),
all of which are in District VI. Dasmariñas has the largest population (575,817),
followed by Bacoor (520,216), Imus (301,624) and lastly, Gen. Trias (243,322).
At 2,166 persons per sq.km, Cavite‘s population density in 2010 is almost 8 times
larger than the national average of 274, indicating the province‘s high level of
urbanization and industrialization. Districts II and I, which include Bacoor, Cavite
City, Kawit, Noveleta, and Rosario, are the most densely populated, with 9,928
people per sq. km. and 8,627 per sq.km, respectively. In terms of
cities/municipalities, Rosario (16,270 per sq.km) and Gen. M. Alvarez (14,770 per
sq.km) have the highest population density, the former being a major industrial
site and the latter a resettlement site for informal settlers from Metro Manila. The
least densely populated areas are in District VII, Magallanes (270 per sq.km) and
Maragondon (213 per sq. km).
2.3.2 Urban-Rural Population Structure
Data for the urban-rural population structure of Cavite come from two (2) sources,
namely: the 2000 Census of Population and Housing of the NSO and the 2010
Cavite Socio-Economic and Physical Profile (Box 2.1)
The adoption of the new definition and the changes in the municipal structure
have resulted in the decrease in projected percentage of the urban population in
Dasmarinas City and seven (7) municipalities in the Province (Table 2.3-2).

Cavite Integrated Water Resource Management Master Plan
2-3
Box 3.1 A New Definition of Urban-Rural-Urban Dichotomy
Box 3.1 A New Definition of Urban-Rural-Urban Dichotomy
It is estimated that 88.3% of the province‘s population were living in urban areas
in 2010, an increase of 1.5% from 86.8% in 2000. As indicated in Table 2.3-2, no
significant changes in the structure of urban-rural population was expected in
2010. The municipalities of Silang, Alfonso, Gen. Aguinaldo, Indang, Magallanes,
Maragondon, and Ternate remain predominantly rural while the rest of the cities
and municipalities are predominantly urban.
Table 2.3-2 Cavite: Percentage Share of Urban and Rural Population, by City/Municipality, 2000 & 2010
City/municipality 2000 2010
Urban Rural Urban Rural
District I 100.0 0.0 100.0 0.0
Cavite City 100.0 0.0 100.0 0.0
Kawit 100.0 0.0 100.0 0.0
Noveleta 100.0 0.0 100.0 0.0
Rosario 100.0 0.0 100.0 0.0
District II 100.0 0.0 100.0 0.0
Bacoor 100.0 0.0 100.0 0.0
District III 100.0 0.0 100.0 0.0
Imus 100.0 0.0 100.0 0.0
District IV 100.0 0.0 95.7 4.3
City of Dasmariñas 100.0 0.0 95.7 4.3
District V 66.8 33.2 66.9 33.1
Carmona 100.0 0.0 100.0 0.0
Gen. M. Alvarez 100.0 0.0 100.0 0.0
Silang 32.7 67.3 33.0 67.0
District VI 95.3 4.7 97.2 2.8
Trece Martires City 100.0 0.0 100.0 0.0
Amadeo 47.9 52.1 45.8 54.2
Delineating urban from rural areas has been approached from different points of view, using
different criteria. In 2000, the National Statistical Office defined “urban” in terms of
population density, physical characteristics, and the presence of commercial, manufacturing,
recreational, or establishments catering to personal services. These criteria formed the basis
of the definition of the urban areas since 1970. .
The more recent definition, prescribed by the National Statistical Coordination Board since
2003 uses population, the number of establishments, and the number of employees in
establishments as main criteria. In the new definition, a barangay has urbanized if :
1) It has a population size of 5,000 or more, or 2) It has at least one establishment with a minimum of 100 employees, or 3) If it has 5 or more establishments with a minimum of 10 employees, and 5 or more Facilities within a two-kilometer radius from the barangay hall.
The adoption of the new definitions and the creation of new barangays partly explain the
distortion in the historical urbanization trends on some local areas.

Cavite Integrated Water Resource Management Master Plan
2-4
City/municipality 2000 2010
Urban Rural Urban Rural
Gen. Trias 100.0 0.0 100.0 0.0
Tanza 100.0 0.0 100.0 0.0
District VII 51.0 49.0 52.9 47.1
Tagaytay City 100.0 0.0 100.0 0.0
Alfonso 19.1 80.9 17.9 82.1
Gen. Aguinaldo 24.1 75.9 21.5 78.5
Indang 38.3 61.7 37.0 63.0
Magallanes 2.1 97.9 1.8 98.2
Maragondon 1.8 98.2 1.9 98.1
Mendez 82.0 18.0 81.8 18.2
Naic 81.7 18.3 82.3 17.7
Ternate 23.0 77.0 22.3 77.7
Total 86.8 13.2 88.3 11.7
Source: 2000 data - National Statistics Office (NSO); Cavite SEPP 2010
2.3.3 Age Structure and Dependency Ratio
Figure 2.3-1 shows Cavite‘s population by age group as of 2010. According to
the Cavite SEPP 2010, 62.2% of the total population is comprised of the working
age group; the rest is comprised of 34.6% children, and 3.2% elderly.
Consequently, the dependency ratio was at 60.8%,with 6 dependents for every
10 persons of economically productive age. This is lower than the national
average of 69%, where there are almost 7 dependents for every 10 persons of
working age. This means that Cavite has a more dynamic population structure,
given its higher percentage of economically active population compared with the
national average.
Source: Cavite Socio-Economic and Physical Profile 2010
Figure 2.3-1 Cavite: Population by Age Group,
2010 (Percent of Total Population)

Cavite Integrated Water Resource Management Master Plan
2-5
2.3.4 Number of Households and Household Size
There were 681,700 households in Cavite in 2010, with an estimated average
household size of 4.54. This reflected an annual increase of 5.9% in households
from 2000-2010, faster than the population growth of 4.12% p.a. in the province
during the same period. This suggests that the average family size has become
smaller (refer to Table 2.3-3).
The largest number of households can be found in Districts VI (130,700), IV
(119,700) and II (119,600). Dasmariñas City (119,700) has the largest number of
households, followed by Bacoor (119,600), Imus (65,400) and Gen. Trias
(56,800).
The two most populous districts, VI and IV, also had small average family sizes,
of 4.4 and 4.8, respectively. The district with the smallest family size was District I
at 4.30. Interestingly, rural areas which had the least number of households had
the largest household size. Specifically, these are the towns of Gen. Aguinaldo,
Ternate, Maragondon, and Magallanes (District VII) which had household sizes
close to 5.0.
Table 2.3-3 Cavite: Number of Households and Household Size, by City/Municipality, 2000 & 2010
City/municipality 2000 2010
No. (‘000) Size No. (‘000) Size
District I 57.6 4.64 72.8 4.30
Cavite City 21.3 4.64 22.7 4.46
Kawit 13.5 4.64 18.3 4.27
Noveleta 6.9 4.61 9.9 4.20
Rosario 15.8 4.64 21.9 4.21
District II 64.0 4.77 119.6 4.35
Bacoor 64.0 4.77 119.6 4.35
District III 42.2 4.62 65.4 4.61
Imus 42.2 4.62 65.4 4.61
District IV 77.3 4.90 119.7 4.81
City of Dasmariñas 77.3 4.90 119.7 4.81
District V 63.8 4.95 91.7 4.57
Carmona 10.4 4.57 18.1 4.14
Gen. M. Alvarez 22.6 4.97 28.7 4.82
Silang 30.8 4.92 44.9 4.76
District VI 60.6 4.71 130.7 4.40
Trece Martires City 8.8 4.75 23.9 4.38
Amadeo 5.5 4.69 7.4 4.52
Gen. Trias 23.3 4.60 56.8 4.28
Tanza 23.0 4.77 42.6 4.43
District VII 63.2 4.95 81.8 4.73

Cavite Integrated Water Resource Management Master Plan
2-6
City/municipality 2000 2010
No. (‘000) Size No. (‘000) Size
Tagaytay City 8.6 4.91 13.5 4.59
Alfonso 8.0 4.92 10.2 4.76
Gen. Aguinaldo 2.8 5.17 3.5 4.99
Indang 10.6 4.82 13.1 4.74
Magallanes 3.4 5.28 4.4 4.77
Maragondon 6.3 5.28 7.4 4.77
Mendez 4.8 4.81 6.3 4.53
Naic 15.2 4.75 19.4 4.53
Ternate 3.5 4.85 4.0 4.88
Total 428.9 4.78 681.7 4.54
Source: 2000 data - National Statistics Office (NSO); 2010 – Estimated
2.3.5 Income Levels and Profile
Despite the fact that some areas in Cavite have been assigned as relocation sites
for Metro Manila‘s informal settlers, the province already has a low and slightly
declining poverty incidence. The poverty incidence among Cavite‘s families
improved slightly from 4.8% in 2003 to 4.5% in 2009. In contrast, the national
average was 4 times higher at 24.4% in 2003 which declined to 20.9% in 2009
(Figure 2.3-2).
Similarly, there is a marked contrast between the local and national incidences. In
Cavite, the incidence of poverty among population dropped from 6.7% in 2003 to
6.4% in 2009 while the national average was at 30.0% in 2003, and 26.5% in
2009 (Figure 2.3-3)
Source: National Statistical Coordination Board
Figure 2.3-2 Incidence of Poverty among Families: 2003-2009
(% of Families)
4.8 4.2 4.5
24.4
21.1 20.9
0
5
10
15
20
25
30
2003 2006 2009
Cavite Philippines

Cavite Integrated Water Resource Management Master Plan
2-7
Source: National Statistical Coordination Board
Figure 2.3-3 Incidence of Poverty among Population: 2003-2009 (% of Population)
The average annual family income in Cavite was P282,606 in 2009. It was much higher than the average of P248,600 for CALABARZON and P206,000 for the entire country. The average family income for Cavite in 2009 represented an average annual growth of 4.10% from P196,401 in 2000.
The annual average family expenditure was P255,018 in Cavite, as compared
toP212,633 for CALABARZON and P176,000 for the entire country. This
represents an average annual growth of 5.29% from the average family
expenditure of P160,334 in 2000.This makes Cavite among the more dynamic
and affluent provinces in the Philippines and suggests the significant presence of
a relatively sophisticated market.
2.3.6 Labor Force and Employment Structure
Employment data prior to 2007 are not comparable to present data due to a
change in the definition of labor force which has resulted in lower unemployment
rate. Hence, the comparison is being made with data from 2008. There are also
no actual employment figures at the provincial level after 2003. However,
previous results indicate that a relatively industrialized area like Cavite has a
higher labor force participation rate and higher unemployment rate as more
people migrate to this area to search for employment and income opportunities.
Based on the above observations, it was estimated that Cavite generated 1.25
million jobs in 2010, 2.4% higher or 29,000 more than in 2008. Consequently, the
unemployment rate declined from 10.1% to 9.7% despite the rise in labor force
participation from 63.1% to 64.4% (Table 2.3-4). This indicates that the province
is increasingly providing jobs to new entrants in the labor force.
6.7 6.2 6.4
30.0
26.4 26.5
0.0
5.0
10.0
15.0
20.0
25.0
30.0
35.0
2003 2006 2009
Cavite Philippines

Cavite Integrated Water Resource Management Master Plan
2-8
Table 2.3-4 Cavite: Labor Force, Employment and Unemployment
2005 2010
Population 15 years old and over (‘000) 2,062.6 2,134.7
Labor Force Participation Rate (%) 63.1 64.4
Labor Force (‘000) 1,301.5 1,374.8
Employed (‘000) 1,211.6 1,241.4
Employment Rate (%) 89.9 90.3
Unemployed (‘000) 131.5 133.4
Unemployment Rate (%) 10.1 9.7
Source: National Statistics Office (NSO); 2005 Cavite Socio-Economic Profile; 2010 data - Estimated
2.3.7 Health Indicators
Based on 2009 and 2010 records, Cavite had lower birth rate (20) and death rate (3.7) than Calabarzon and the entire Philippines. Crude Birth Rate (CBR) for Calabarzon was 23, while its Crude Death Rate (CDR) was 5.6. For the Philippines, CBR was 20; while CDR was 5.1. Cavite‘s infant mortality rate of 5.6 was slightly higher than Calabarzon‘s 5.0.
Table 2.3-5 Vital Health Statistics: 2009 and 2010
Health Indices 2009 2010
Infant mortality rate (IMR) 5.53 5.64
Maternal Mortality Rate (MMR) 41.02 61.29
Crude Death Rate (CDR) 3.59 3.74
Crude Birth Rate (CBR) 21.75 20.16
Source: Cavite Socio-Economic and Physical Profile 2010
Water-borne diseases are among the province‘s leading causes of morbidity.
Gastroenteritis and colitis has a morbidity rate of 197 per 100,000 population.
This is, however, lower than the nationwide morbidity rate for the same disease
at about 500 per 100,000 population. Water-related causes are not among the
leading causes of death in Cavite.
Table 2.3-6 Ten Leading Causes of Morbidity and Mortality: 2010
Morbidity Mortality
Disease No.
(‘000) Rate per 100,000
Causes No.
(‘000) Rate per 100,000
1. Hypertension 124.1 3,766 1. Pneumonia 0.751 23
2. Acute upper respiratory infection
71.8 2,180 2. Acute myocardial infarction
0.746 23
3. UTI 11.0 333 3. Malignant neoplasm
0.584 18
4. Influenza 6.5 198 4. Hypertensive heart disease
0.515 16
5. Gastroenteritis & colitis
6.5 197 5. Heart disease, organic
0.455 14

Cavite Integrated Water Resource Management Master Plan
2-9
Morbidity Mortality
Disease No.
(‘000) Rate per 100,000
Causes No.
(‘000) Rate per 100,000
6. Other respiratory disorders
5.6 169 6. Cardiovascular disease
0.407 12
7. Multiple open wounds
5.5 166 7. Acute renal failure 0.371 11
8. Acute nasopharyngitis
4.2 126 8. Respiratory tuberculosis
0.330 10
9. Bronchitis 3.9 118 9. Diabetes melitus 0.329 10
10. Disorder of the skin 3.6 110 10. Atherosclerotic heart disease
0.283 9
Source: Cavite Socio-Economic and Physical Profile 2010
2.3.8 Demographic and Employment Projections
The economically active population (15 years old and above) in Cavite is
expected to rise from 2.09 million in 2010 to 4.33 million in 2040. This represents
an increase in share to total population from 65.3% in 2010 to 80.5% in 2040.
Assuming a constant 64% Labor Force Participation Rate (LFPR)—nearly the
average LFPR for Cavite during the past 5 years—the size of the labor force is
projected to go up from 1.35 million to 2.77 million (Table 2.3-7).
On the other hand, employment growth projections were developed by taking
CALABARZON‘s GRDP and labor force growth into consideration. The projected
GRDP growth in CALABARZON is 3 - 4% annually. As the unemployment rate
drops below 10%, GRDP growth will be faster than labor force growth beyond
2020 due to increases in productivity and the slowdown in population growth.
Given this trend, employment is projected to rise from 1.24 million (90.3% of labor
force) in 2010 to 4.64 million (91.7% of labor force) in 2040. This also suggests a
decline in the unemployment rate from 9.7% in 2010 to 8.3% by 2040.
Table 2.3-7 Cavite: Labor Force Projections
2015 2020 2025 2030 2035 2040
Population 15 y.o. & over (‘000) 2,804.2 3,547.9 4,391.3 5,306.4 6,272.2 7,254.2
Labor force participation rate (%) 64.0 64.0 64.0 64.0 64.0 64.0
Labor force (‘000) 1,794.7 2,270.3 2,810.4 3,396.1 4,014.2 4,642.7
Employed (‘000) 1,617.2 2,063.9 2,559.8 3,114.3 3,681.0 4,257.3
Employment rate (%) 90.1 90.9 91.1 91.7 91.7 91.7
Unemployment rate (%) 9.9 9.1 8.9 8.3 8.3 8.3

Cavite Integrated Water Resource Management Master Plan
2-1
2.4 ECONOMIC STRUCTURE
2.4.1 Gross Regional Domestic Product (GRDP) by Industrial Origin:
CALABARZON
Gross regional domestic product (GRDP) measures the overall level of output or
economic activity in a particular region in a given period of time. Based on
historical record, it appears that the entire country has grown almost twice
faster(at 4.3%) than CALABARZON (2.4%)from 2006 to 2009. The growth of
CALABARZON‘s industrial sector remained almost constant over the 2005-2009
period (Table 2.4-1).
The region‘s performance, however, may not necessarily have been dragged
down by Cavite, but more likely by the less industrialized provinces in the region.
As will be shown in subsequent sections of the study, Cavite‘s industrial sector
remained dynamic from 2005 to 2009. It should also be noted that the province
could have a higher share of the industrial sector in its economy than the 38.3%
average for the entire CALABARZON due to the presence of numerous industrial
parks and estates in the area. Cavite is only 2nd to Laguna in terms of the
provinces with the most number of industrial estates in the country.
Table 2.4-1 Gross Regional Domestic Product (GRDP): CALABARZON vs Philippines
Area
2005 2009 % Ave.
Annual
GR
in Billion
Pesos @
1985 prices
% share to
GRDP
in Billion
Pesos @
1985 prices
% share to
GRDP
CALABARZON (Region IV-A)
GRDP 150.6 100.0 165.6 100.0 2.4
Agriculture, fishery &
forestry 28.3 18.2 31.1 18.8 2.4
Industry 62.9 40.9 63.4 38.3 0.2
Services 59.4 40.9 71.0 42.9 4.6
PHILIPPINES
GDP 1,211.4 100.0 1,432.1 100.0 4.3
Agriculture, fishery &
forestry 230.8 19.1 259.4 18.1 3.0
Industry 396.9 32.8 460.2 32.1 3.8
Services 583.6 48.2 712.5 49.8 5.1
Source: National Statistical Coordination Board (NSCB)
2.4.2 Agriculture, Fishery, Poultry and Livestock
Except for rice and corn, Cavite generally cultivates high value commercial crops,
such as fruits, sugarcane, vegetables, and cut flowers. The production of
traditional cash crops, slipped during the past five years, although vegetables and

Cavite Integrated Water Resource Management Master Plan
2-2
other crops managed to hold up. Other crops include papaya, dragon fruit,
muskmelon, and watermelon. There has also been a noticeable shift towards
sugarcane cultivation, perhaps due in part to increased demand for bio-ethanol
as a result of the implementation of the Bio-Fuels Act. Overall, agricultural crop
production is estimated to have posted a growth rate that is only slightly below
the CALABARZON average agricultural growth of 2.4% in 2005-2010 (Table 2.4-
2).
Table 2.4-2 Cavite: Production of Major Agricultural Crops (Metric Tons)
Major crops 2005 2010 % Ave. annual GR
Rice 59,008 63,584 1.5
Corn 8,458 4,244 -12.9
Root crops 11,460 11,204 -0.5
Pineapple 35,026 30,047 -3.0
Mango 22,674 17,951 -4.6
Coffee 9,108 8,318 -1.8
Banana 22,496 21,320 -1.1
Other fruit trees 23,138 18,204 -4.7
Sugarcane 26,895 83,070 25.3
Vegetables 18,484 23,182 4.6
Other crops 4,417 5,522 4.6
Cupflower (in dozens) 121,163 134,357 2.1
Source: Cavite Socio-Economic and Physical Profile (Cavite SEPP 2010)
Amid the slow growth in agricultural crop production, Cavite recorded an
increase in the land area devoted to agricultural crops. Based on records from
the Cavite Provincial Agriculturist office, the percentage of land area planted to
crops rose significantly to 36.3% in 2010 from 25.5% in 2005 (Table 2.4-3 and
Figure 2.4-1). Almost all districts showed increases in the size of area planted.
The most noticeable, however, was in the relatively rural District VII where the
share jumped to 43.9% from 26%. This trend indicates a shift in cultivation to
more land-intensive crops (e.g. sugarcane) that presumably have higher returns.

Cavite Integrated Water Resource Management Master Plan
2-3
Table 2.4-3 Cavite: Area Planted to Crops
City/Municipality
2005 2010
Hectares % of total land
area Hectares
% of total
land area
District I 147 6.0 323 13.2
Cavite City - - - -
Kawit 120 9.0 260 19.4
Noveleta 25 4.6 52 9.6
Rosario 2 0.3 11 1.9
District II 438 8.4 260 5.0
Bacoor 438 8.4 260 5.0
District III 1,953 29.1 2,090 31.2
Imus 1,953 29.1 2,090 31.2
District IV 1,574 19.1 2,410 29.3
City of Dasmariñas 1,574 19.1 2,410 29.3
District V 4,919 25.0 6,089 31.1
Carmona 492 15.9 424 13.7
Gen. M. Alvarez 253 27.0 72 7.7
Silang 4,174 26.7 5,592 35.7
District VI 10,100 33.5 11,601 38.5
Trece Martires City 274 7.0 627 15.9
Amadeo 4,516 94.3 4,785 99.9
Gen. Trias 3,501 29.7 3,676 31.2
Tanza 1,809 18.8 2,513 26.1
District VII 17,213 26.0 29,060 43.9
Tagaytay City 1,123 17.0 1,080 16.3
Alfonso 3,315 51.3 4,323 66.9
Gen. Aguinaldo 1,394 27.3 3,963 77.7
Indang 2,298 25.8 5,191 58.2
Magallanes 1,588 20.2 5,821 74.1
Maragondon 2,732 16.5 3,649 22.0
Mendez 899 53.9 1,148 68.9
Naic 3,305 38.4 3,279 38.1
Ternate 559 12.8 606 13.9
Total 36,346 25.5 51,833 36.3
Source: Cavite Socio-Economic and Physical Profile (Cavite SEPP 2010)

Cavite Integrated Water Resource Management Master Plan
2-4
Figure 2.4-1 Agricultural Land Use
Offsetting the generally slow growth in agricultural crop production, Cavite‘s
fishery sub-sector did well, led by aquaculture which had a compound annual
growth rate (CAGR) of 24.3% in 2005-2010 (Table 2.4-4). Aquaculture‘s
remarkable performance can be credited to significant strides in oyster and
mussel culture. Municipal fishing production had a 7.7% CAGR while commercial
fishing had a 3.8% CAGR.
Table 2.4-4 Cavite: Fishery Production (Metric Tons)
Type of fishing 2005 2010 % CAGR Major producing areas in 2010
(% of total production)
Commercial fishing 5,072 6,126 3.8 Rosario (36%), Tanza (29%), Ternate (29%)
Municipal fishing 5,699 8,249 7.7 Rosario (25%), Tanza (24%), Bacoor (13%), Naic (12%)
Aquaculture 5,233 12,546 24.3 Kawit (59%), Bacoor (36%), Noveleta (2%); mostly oyster, mussel, milkfish and tilapia
Source: Cavite Socio-Economic and Physical Profile (Cavite SEPP 2010)
Cavite‘s livestock industry showed modest growth during the 5-year period,
although the swine/hog population actually declined. In contrast, poultry posted
creditable performance, with the chicken population rising by 38.7% yearly to

Cavite Integrated Water Resource Management Master Plan
2-5
reach almost 10 million heads in 2010 from just about 2 million in 2005. Other
poultry, consisting mostly of geese and quail, increased by 21.1% p.a. (Table
2.4-5)
Table 2.4-5 Cavite: Livestock and Poultry Population (‘000 Heads)
Livestock/
poultry
2005 2010 % CAGR
(Total) Backyard Commercial Total Backyard Commercial Total
Livestock
Cattle 19.5 2.3 21.8 21.4 2.5 23.9 1.9
Swine/Hog 74.9 644.9 719.8 56.3 586.7 643.0 -2.2
Goat 11.3 2.1 13.4 14.0 3.7 17.7 5.7
Carabao 3.3 - 3.3 3.3 0.2 3.5 1.2
Others 2.6 0.2 2.8 2.8 0.4 3.2 2.7
Poultry
Chicken 137.7 1,770.5 1,908.0 150.3 9,653.5 9,803.8 38.7
Duck 17.0 9.8 26.8 22.6 8.8 31.4 3.2
Others 22.4 25.3 47.7 4.7 119.8 124.4 21.1
Source: Cavite Socio-Economic and Physical Profile (Cavite SEPP 2010)
Significant increase in area planted to crops is not anticipated over the medium-
term as urbanization and industrialization take precedence over agricultural
development. The modest increase in agricultural crop production will essentially
come from productivity improvement and shift to higher value crops. Cultivation of
crops, however, is not a source of demand for the water supply project as it is
more dependent on irrigation and other water sources, hence even competing
with the project for water source. Poultry and livestock have stronger growth
potential due to increase in large scale operations which feed into agro-
processing, and which is a major source of demand for the water supply project.
Overall, the agricultural sector will remain to a major user of the water resources
of the province, but its growth in demand will be modest at 3-4% per annum,
slower than the demand of households, industrial establishments and tourism-
related establishments.
2.4.3 Industry, Commerce and Trade
Cavite experienced an average annual 2.4% increase in registered industrial
establishments, from 668 in 2002 to 806 in 2010 (Figure 2.4-2). These
establishments were categorized into the following: electronic, electrical and
telecommunication parts and equipment (17.4%); services (15.5%); fabricated
metal products, machinery and equipment (13.5%); chemicals, rubber and plastic
products (12%); textile, wearing apparel and leather industries (9.7%); non-
metallic mineral products (5.6%); basic metal products (5.1%); and agri-business,
livestock and poultry (5%).

Cavite Integrated Water Resource Management Master Plan
2-6
Roughly one-fourth (26.3%) of the investors in the industrial establishments were
Filipinos. The other top nationalities of investors were the Japanese (18.2%) and
Koreans (13.8%)
Source: Cavite Socio-Economic and Physical Profile (Cavite SEPP 2010)
Figure 2.4-2 Cavite: Number of Industrial Establishments
As of 2010, there were 28 operating industrial estates (IE‘s) and economic zones
(EZ‘s) with a combined land area of almost 1,500 hectares in Cavite (Table 2.4-
6). In addition, there were seven (7) proclaimed IE‘s/EZ‘s and 16 IE‘s/EZ‘s that
were in progress. The 28 operating IE‘s and EZ‘s had 629 industrial
establishments, or 78% of the industrial establishments for the entire province.
Based on 2010 data, most of the industrial establishments are found inside
industrial estates (90% of total establishments), with only 10% operating outside
the estates.
Most of the industrial zones are concentrated on the middle eastern part of the
province, especially in Gen. Trias, Silang and Carmona. A significant number of
industrial estates also operate in the northern part, specifically in Imus and Tanza
(Figure 2.4-3). In terms of number of establishments (i.e., locators in industrial
zones/estates), it is still the central area that prevails, particularly Carmona (204
establishments), Dasmarinas (118), Gen. Trias (50) and Trece Martires (36).
In addition to the operating industrial estates/economic zones, there are at least
16 more IE‘s/ecozones that are under development. Most of these are still found
in the same locations as existing IE‘s/ecozones: District I or the northern part
(Rosario, 2 with a total area of 128 hectares; Cavite City, 2 with total of 190
hectares; Kawit, 1 with 93 hectares); and in the central area (Dasmarinas, 1 with
86 has; Silay, 2 with a total of 245 has; Trece Martires, 2 with total of 140 has;
and Gen. Trias, 4 with total of slightly over 300 has). There are also 7 newly
proclaimed industrial estates, and they are all in the same location as those
under development. In short, the areas of industrialization over the medium-term,
i.e., the next 3-5 years, are still the same areas that are already industrialized.
668
718 731
751 760
773
805 798 806
600
650
700
750
800
850
2002 2003 2004 2005 2006 2007 2008 2009 2010

Cavite Integrated Water Resource Management Master Plan
2-7
Figure 2.4-3 Industrial, Commercial and Recreational Facilities
The trend in industrialization will have implications on water demand from
industrial establishments based on two factors: location of industries and type of
industries. The on-going development of new industrial estates/ economic zones
suggest that the increases in water demand for industrial usage will still mostly
come from the northern (District I) and central/middle (Districts IV, V and VI)
areas.
Not all industries, however, are water-intensive, which are the ones that could
create a surge in demand rather than just natural growth in demand due to the
growth in industry. The water intensive industries would be food and beverages
(4% of establishments in 2010), agri-business (5%), and, to some extent,
electronics (17%, mostly for washing/cleaning) and chemicals (12%, for
compounding and other chemical processes). When added up, the water
intensive industries account for about 38% of the total industrial establishments.
Except for very few industrial estates under development which specified
preferred industries (electronics, etc. in Silang and one estate in Gen. Trias), it is
difficult at this point to identify the specific type of industries that will increasingly
locate in Cavite.
Nonetheless, reasonably rapid industrialization will be sustained in the province
over the medium-term, so water supply will have to support this industrial growth.
In this case, the industrial demand for water will grow by at least the same pace
as the industrial sector growth. The Calabarzon Regional Development Plan
2011-2016 targets a growth of 5-8% p.a. in terms of gross regional product.
Based on historical record, actual growth performance is just about half of target.

Cavite Integrated Water Resource Management Master Plan
2-8
Hence, the likely GRDP increase is about 3-4% p.a. Further, industry growth is
roughly 1%-point faster than GRDP growth in Calabarzon. It is also assumed that
Cavite‘s industrial sector will grow faster than the industrial growth target for the
entire region as, similar to Laguna, it has the more dynamic industrial sector. This
means about 5-6% per annum increase in Cavite‘s industry, which is also
assumed to be the growth in industrial demand for water.
Table 2.4-6 Operating Industrial Estates/Economic Zones in Cavite: 2010
Name of Ecozone/ Industrial estate
Location Land area
(ha.) No. of Operating Establishments
Cavite Economic Zone Rosario 278.5 261
Cavite Economic Zone II Rosario 53.7
SM City Bacoor – Teletech Bacoor 8.8 4
Anabu Hills Industrial Estate Imus 10.8 4
EMI Special Economic Zone Imus 12.2 1
Imus Informal Industrial Estate Imus 200.0 8
Dasmariñas Technopark Dasmariñas City 38.0 11
First Cavite Industrial Estate Dasmariñas City 154.5 86
First Cityland Heavy Industrial Center Dasmariñas City 32.1 1
Granville Industrial Complex Carmona 7.0 13
Golden Mile Business Park Carmona 45.1 35
Mountainview Industrial Complex I Carmona 24.0 29
Mountainview Industrial Complex II Carmona 22.3 9
Southcoast Industrial Estate Carmona 13.4 19
Welbourne Industrial Estate Carmona 12.0 16
Cavite-Carmona Industrial Estate People’s Technology Complex
Carmona 100.0 46
GMA-NHA Industrial Estate Gen. Mariano Alvarez 10.0 3
Cavite Light Industrial Park Silang 37.4 15
Daiichi Industrial Park Silang 55.0 7
Greenway Business Park Silang 10.5 6
Maguyam Industrial Estate Silang 16.4 8
Meridian Industrial Park Silang 39.4 4
Gateway Business Park Gen. Trias 180.0 19
Golden Gate Business Park Gen. Trias 81.7 NA
Manggahan Industrial Estate Gen. Trias 10.2 4
New Cavite Industrial City Gen. Trias 52.0 18
Lu Chu Industrial Estate Tanza 8.8 2
TOTAL 1,497.5 629
Source: Cavite Socio-Economic and Physical Profile (Cavite SEPP 2010)
Cavite generated exports worth US$7.3 billion in 2010, an increase from US$4.1
billion in 2002, although below the peak of US$11.7 billion in 2007 (Figure 2.4-
4).The Cavite economic zones accounted for 18% of the countrywide PEZA
ecozone exports in 2010.The Cavite ecozones also required US$6.7 billion worth
of imports in 2010, double their demand of US$3.1 billion in 2002. In short,
exports exceeded imports, so the province consistently enjoyed trade surpluses.

Cavite Integrated Water Resource Management Master Plan
2-9
2002 2003 2004 2005 2006 2007 2008 2009 2010
Imports 3,133 4,299 3,941 2,349 8,589 8,589 8,891 5,297 6,726
Exports 4,107 5,187 8,078 9,254 10,213 11,720 11,245 6,453 7,312
0
2,000
4,000
6,000
8,000
10,000
12,000
14,000
Imports Exports
Source: Cavite Socio-Economic and Physical Profile (Cavite SEPP 2010)
Figure 2.4-4 Value of Exports and Imports Generated by Economic Zones in
Cavite: 2002-2010 (US$ Million)
Overall, Cavite registered 13,459 business establishments in 2010, including the
806 industrial establishments. Of these, 2,812 (20.9%) are found in Dasmariñas
City; 2,261 (16.8%) in Bacoor; 2,180 (16.2%) in District IV, mostly in Gen. Trias
(824, 6.1%) and Trece Martires City (700, 5.2%); and 1,829 (13.6%) in District V
(Silang: 1,034, 7.7%). Completing the figures is District VII with 1,010 (7.5%)
(Figure 2.4-5).
Source: Cavite Socio-Economic and Physical Profile (Cavite SEPP 2010)
Figure 2.4-5 Cavite: Number of Registered Business Establishments
District I 1,457 (11%)
District II 2,261 (17%)
District III, 1,910 (14%)
District IV 2,812 (21%)
District V, 1,829 (14%)
District VI 2,180 (16%)
District VII 1,010 (7%)

Cavite Integrated Water Resource Management Master Plan
2-10
Most of the non-industrial establishments in the province are commercial
establishments, mainly tourism-related. This can be considered water-intensive,
being mostly hotels, resorts, restaurants, wellness and recreational centers like
golf clubs (the other major non-industrial establishments would be retail stores).
That is why these establishments are predominantly found in Tagaytay City, a
well-known tourism area; and, the middle part especially Dasmarinas and Gen,
Trias, and Bacoor in the north, towns with large population (Figure 2.4-6).
Services have actually grown even faster than industry in Calabarzon, and the
rapid growth trend is expected to continue as the province continues to urbanize.
Water demand growth in commercial and tourism establishments is therefore
expected to average 6-7% p.a., nearly the same pace of growth as the service
sector over the medium-term.
Figure 2.4-6 Domestic Demand Center

Cavite Integrated Water Resource Management Master Plan
3-1
CHAPTER 3 WATER DEMAND ASSESSMENT
3.1 POPULATION PROJECTIONS
Disaggregated population forecasts for the period 2012-2040 is the main
determinant of water requirement in the study area. The provincial and
city/municipal population forecasts for the period consider the past population
trends, present population density, general topography, each city‘s or
municipality‘s potential for growth, and existing and proposed land use plans. The
National Statistic‘s Office‘s (NSO) 2000census-based Regional and Provincial
Population Projections for years 2000-2040 were used as the basis in developing
the provincial population projections. For the cities and municipalities, the
population forecasts were based on the projected ratio of the city and municipal
population to the provincial population.
Based on the Cohort-Component Method, the NSO projection is a composite of
three demographic factors, namely: (i) fertility, (ii) mortality, and (iii) migration.
Adjustments had to be made on the NSO provincial population projections, as the
comparison between the actual 2010 census count with the 2000 NSO census-
based medium projections for 2010, show a significant variance of more than
2.0%.
The population of Cavite province is projected to increase from 3.1 million in 2010
to 9.0 million by 2040. This is due to the continuous influx of migrants from
different parts of Metro Manila, as well as from other provinces. This is brought
about by economic opportunities from the presence of industrial estates,
availability of affordable housing, and improved connectivity with Metro Manila.
The details of the historical and projected population of the province,
disaggregated into its component cities and municipalities are shown in Annex II-
3 and Annex II-4, respectively.
Table 3.1-1 Population Projection Summary (in persons)
Year 2012 2015 2020 2025 2030 2035 2040
Cavite Province
3,406,037 3,909,526 4,820,324 5,822156 6,877,928 7,955,369 9,015,368
District I 329,830 354,733 395,785 436,989 476,431 513,209 546,331
District II 580,991 678,400 854,845 1,047,494 1,247,588 1,447,241 1,637,818
District III 329,611 372,498 444,242 514,503 578,071 631,182 670,846
District IV 630,447 715,571 862,870 1,015,214 1,164,211 1,303,477 1,426,936
District V 459,278 509,078 594,594 683,684 772,566 858,748 939,477
District VI 664,398 823,290 1,135,685 1,512,454 1,947,933 2,433,496 2,953,932
District VII 411,483 455,956 532,302 611,818 691,129 768,016 840,029

Cavite Integrated Water Resource Management Master Plan
3-2
3.2 WATER DEMAND PROJECTIONS
3.2.1 Domestic (Municipal) Water Demand
The future domestic water demand was calculated based on projected unit water
consumptions of different consumer categories and the population to be served.
Other factors that were considered are the following: (i) economic potential of the
city/municipality; (ii) the present water rates; and (iii) the planned housing
projects, commercial and industrial establishments in the area based on the 2010
Socio-Economic and Physical Profile of the Province and the Comprehensive
Land Use Plans (CLUP) of each city and municipality.
In general, the total domestic water demand is equal to the sum of the residential,
commercial, institutional/government and small industries‘ demand, and non-
revenue water (NRW). The NRW is defined as the difference between water
being produced and water being billed. Unbilled connections, leakage, wastage,
and other unbilled uses constitute the NRW.
Table 3.2-1 Unit Water Consumption Standard
Category LWUA 1/ ADB 2/ WSP-NWRB 3/
Residential (lpcd)
Level I
Level II 25 - 55 30 - 40 60
Level III 90 - 280 90 -150 100 -120 (Provincial cities)
160-180 (Highly-urbanized)
Commercial (m3/conn.) 1.0 - 2.0 0.90 -1.50
Institutional (m3/conn.) 3.2 – 7.54.50 2.0 – 5.0
Source: 1/ Water Supply Feasibility Studies Methodology Manual, Local Water Utilities Administration
(LWUA) Dec. 1979 2/ Design Guidelines for LWUA-ADB Small Towns Water Supply Sector Project, Asian
Development Bank (ADB), 2002 3/ Planning and Design Considerations for Small Water Utilities, Water & Sanitation Program
(WSP) – National Water Resources Board (NWRB) Orientation and Training Workshop Handout, 2011
For this study, the following unit consumption rates, depending on the
development level of each city and municipality, were adopted:
Residential (liters/day/capita)
Level I - 30 lpcd
Level II - 60 lpcd
Level III - 90 to 145 lpcd
Commercial/industrial (m3/day/conn.) - 0.90 to 1.50
Institutional (m3/day/conn.) - 2.0 to 5.0
Small industrial establishments (m3/day/conn.) - 1,2 to 5.3 (based on actual
consumption records)

Cavite Integrated Water Resource Management Master Plan
3-3
The domestic water demand forecasts were based on the urban and rural
populations projected to be served by Levels I, II, and III water supply systems
and an equivalent (domestic, commercial, institutional, and small industries) per
capita or connection consumption. The service levels were extracted from the
Cavite Socio-Economic and Ecological Profile of 2009 and validated with the
recent data gathered from the water service providers. In projecting the changes
in the service levels for years 2012 to 2040, the following were considered:
(i)existing urban-rural structure, (ii)income class per city/municipality, the current
urbanization trend, (iii)the massive ongoing improvement and expansion
programs of MWSI in its service areas (covering Cavite City and the
municipalities of Kawit, Noveleta, Rosario, Bacoor and Imus), and (iv) the
ongoing expansion programs of the Water Districts and private corporations. The
Level I service coverage is forecasted to decrease from 18.46% in 2009 to 14.0%
in 2012, and less than 1% by the year 2040 while the Level II service coverage is
projected to increase from 2.32% in 2009 to 4.4% in 2040. Likewise, Level III
coverage is forecasted to increase from 79.22% in 2009 to 95.45% in 2040.
The unit consumption for the various categories was forecasted to increase
slightly each year to reflect economic growth within the city/municipality, as
derived from forecasted rates of growth across the various sectors within the
province (NSO, 2011). An annual rate increase ranging from 0.5% to 1.0%,
consistent with LWUA methodology, was adopted.
The projected domestic/municipal water demand per city/municipality for the
years 2012 to 2040 at 5-year intervals are tabulated in Annex II-5 to Annex II-11,
and summarized in Annex II-12. The estimated current domestic water demand
of 525 MLD is estimated to be about 1,549 MLD by 2040 as shown in Figure 3.2-
1.
Figure 3.2-1 Cavite Projected Domestic Water Demand (2012-2040)
0
200
400
600
800
1,000
1,200
1,400
1,600
1,800
2,000
2012 2015 2020 2025 2030 2035 2040
Tota
l Do
mes
tic
Wat
er
Dem
and
, MLD

Cavite Integrated Water Resource Management Master Plan
3-4
3.2.2 Agricultural Water Requirements
The current developments and trends such as land conversion, rapid
urbanization and industrialization have greatly affected agriculture in the province,
as reflected in Annex II-13A. In 1989, the total area allocated to agriculture was
106,080.40 hectares or about 74% of the province‗s total land area. In 2005, the
agricultural area was reduced to 70,378.90 hectares, a significant 33.7%
reduction. In 2007, it was again reduced slightly at 69,681.67 hectares but it
slightly rose to 71,474.91 hectares in 2010. In forecasting the agricultural area
allocation from year 2010 to 2040, the Draft 2012-2017 Provincial Development
and Physical Framework Plan (PDPF) was taken into consideration. The Draft
PDPF considered maintaining the agricultural land at 71,474.91 hectares, or
50.09% of the total land area of the province.
Agriculture is not limited to planted crops. Agricultural areas in Cavite are utilized
in many forms: aquaculture, livestock and poultry production, and allied
agricultural industries (feed mill production, breeding farms, demonstration farms,
etc.) As for crop production, it is one of the major components of agricultural
activities in Cavite. In 2010, 79.68% of the total agricultural areas are devoted to
crop production. Still, there were a total of seven (7) city/municipalities (Trece
Martires City and Municipalities of Amadeo, Gen. Emilio Aguinaldo, Imus,
Magallanes, Tanza and Ternate) that have areas actually planted with crops that
are larger than their declared total agricultural lands as shown in Annex II-13B.
This can be attributed to some residential, commercial and industrial lands that
are currently utilized for agricultural use.
Rice is the most planted crop in the province. In 2005, some 12,818.38 hectares,
distributed in one (city) and 11 municipalities, were planted with rice. This
dropped by 4.7% in 2007, but then increased by 9.4% and 5.5% in 2009 and
2010, respectively. In 2010, 15,347.46 hectares of irrigated land (Annex II-13C),
were cultivated -composed of Cavite Friar Lands Irrigation System (59%),
Communal Irrigation Systems (3%), and private systems (38%).
Considering that urbanization and industrialization are forecasted to take
precedence over agricultural development, the irrigable areas of those
cities/municipalities (7 towns) having larger areas actually planted with crops over
their declared agricultural lands, are assumed to decrease slightly by 0.5% to
1.0% per year for years 2012 to 2040. For the other 5 municipalities, however,
the existing irrigable areas are being maintained. Overall, the total irrigable area
is estimated to decrease by about 0.40% annually or about 12% in the year 2040
as shown in Annex II-14A and Figure 3.2-2.

Cavite Integrated Water Resource Management Master Plan
3-5
Source: NIA-Naic Office, Cavite PDPFP 2008-2013, Cavite SEPP 2005, 2009 & 2010
Figure 3.2-2 Cavite Total Irrigable Area (2005-2040)
The actual percentage of benefitted service area per cropping season, based on
data gathered from NIA-Naic Office for years 2008 to 2011, showed that
benefitted area ranged from 65% to 68% in the wet season crop and 30% to 48%
in the dry season crop. For years 2012 to 2040, an average benefitted service
area of 60% is assumed all throughout. The projected benefitted service area in
hectares are shown in Annex II-14A and Figure 3.2-3.
Figure 3.2-3 Total Average Benefitted Service Area (2010-2040)
The water requirement for rice production was estimated based on the projected
irrigable areas and the average benefitted service area per cropping season. An
agricultural water duty of 1.24 lps/ha for palay, which is being adopted by NIA-
Naic Office, was used in the projections. The projected irrigated water
requirement is tabulated in Annex II-14A and shown graphically in Figure 3.2-4.
This is forecasted to decrease slightly from 934.76 MLD in 2010 to 825.41 MLD
in 2040 or by about 12% in 30 years.
7,000
7,250
7,500
7,750
8,000
8,250
8,500
8,750
9,000
2010 2012 2015 2020 2025 2030 2035 2040
Ave
rage
Ben
efit
ted
Ser
vice
A
rea,
Ha
11,000
11,500
12,000
12,500
13,000
13,500
14,000
14,500
15,000
2005 2007 2009 2010 2012 2015 2020 2025 2030 2035 2040
Tota
l irr
igab
le A
rea,
Ha
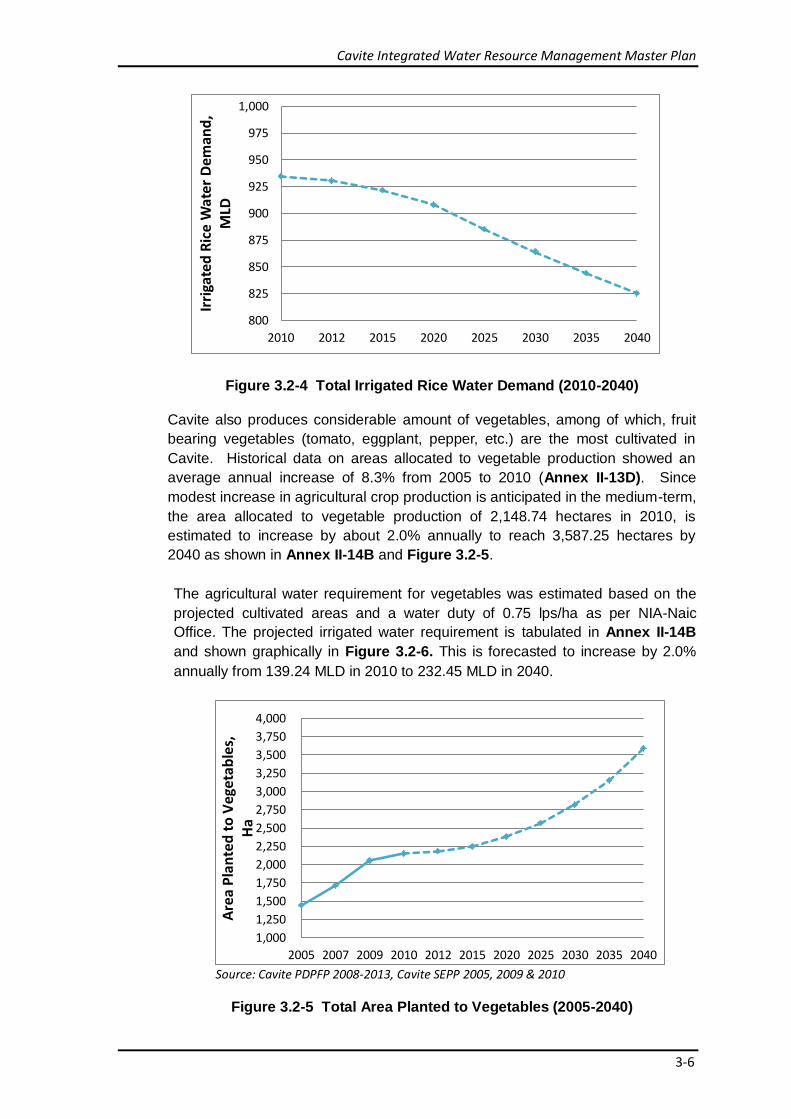
Cavite Integrated Water Resource Management Master Plan
3-6
Figure 3.2-4 Total Irrigated Rice Water Demand (2010-2040)
Cavite also produces considerable amount of vegetables, among of which, fruit
bearing vegetables (tomato, eggplant, pepper, etc.) are the most cultivated in
Cavite. Historical data on areas allocated to vegetable production showed an
average annual increase of 8.3% from 2005 to 2010 (Annex II-13D). Since
modest increase in agricultural crop production is anticipated in the medium-term,
the area allocated to vegetable production of 2,148.74 hectares in 2010, is
estimated to increase by about 2.0% annually to reach 3,587.25 hectares by
2040 as shown in Annex II-14B and Figure 3.2-5.
The agricultural water requirement for vegetables was estimated based on the
projected cultivated areas and a water duty of 0.75 lps/ha as per NIA-Naic
Office. The projected irrigated water requirement is tabulated in Annex II-14B
and shown graphically in Figure 3.2-6. This is forecasted to increase by 2.0%
annually from 139.24 MLD in 2010 to 232.45 MLD in 2040.
Source: Cavite PDPFP 2008-2013, Cavite SEPP 2005, 2009 & 2010
Figure 3.2-5 Total Area Planted to Vegetables (2005-2040)
800
825
850
875
900
925
950
975
1,000
2010 2012 2015 2020 2025 2030 2035 2040
Irri
gate
d R
ice
Wat
er D
eman
d,
MLD
1,000
1,250
1,500
1,750
2,000
2,250
2,500
2,750
3,000
3,250
3,500
3,750
4,000
2005 2007 2009 2010 2012 2015 2020 2025 2030 2035 2040
Are
a P
lan
ted
to
Veg
etab
les,
H
a

Cavite Integrated Water Resource Management Master Plan
3-7
Figure 3.2-6 Total Vegetables Water Demand (2010-2040)
Due to favorable weather condition, cut flower production is currently gaining
prominence in Cavite. There is a boom of flower farms and gardens and these
gardens are producing diverse varieties of ornamental plants. Historical data on
the area cultivated with these crops showed an erratic trend from 2005 to 2010
(Annex II-13D). The cultivated area increased annually by 43% in 2005 to 2007,
dropped to 6.8% in 2007 to 2009, then increased again by 21.6% in 2009 to
2010. The boom of flower farms and gardens is foreseen to continue in the future
with the 27.50 hectares planted in 2010 estimated to increase by about 1.6%
annually to reach 44.45 hectares by 2040 (Annex II-14C and Figure 3.2-7).
Source: Source: Cavite PDPFP 2008-2013, Cavite SEPP 2005, 2009 & 2010
Figure 3.2-7 Total Area Planted to Cut flowers & Ornamentals (2005-2040)
The water requirement for cut flowers and ornamental plants production was
estimated based on the projected cultivated areas and a water duty of 0.75 lps/ha
100
125
150
175
200
225
250
275
300
2010 2012 2015 2020 2025 2030 2035 2040
Veg
etab
les
Wat
er D
eman
d, M
LD
0
5
10
15
20
25
30
35
40
45
50
2005 2007 2009 2010 2012 2015 2020 2025 2030 2035 2040
Are
a P
lan
ted
to
Cu
tflo
wer
s &
O
rnam
enta
ls ,
Ha

Cavite Integrated Water Resource Management Master Plan
3-8
as per NIA-Naic Office. This is forecasted to increase from 1.78 MLD in 2010 to
2.88 MLD in 2040 as shown in Annex II-14C and Figure 3.2-8.
Figure 3.2-8 Cut flowers & Ornamentals Water Demand (2010-2040)
Commercial/semi-commercial livestock and poultry farms also exist in Cavite. Livestock being raised include cattle, goat and swine/hogs. Data on livestock production showed an average annual 2.7% decline in the number of swine/hog heads from 2005 to 2010 (Annex II-13E). However, anticipating a medium growth of the livestock sector in the medium-term, the livestock production is forecasted to increase by about 1.0% annually. The number of heads is estimated to increase from 593,475 in 2010 to 833,391 by 2040 (Annex II-14D and Figure 3.2-9).
The livestock water requirement was estimated based on the projected number
of heads and an average consumption of 25 liters/head/day, as per data
gathered from the Office of the Provincial Agriculturist. The projected livestock
water demand (Annex II-14D and Figure 3.2-9) is forecasted to increase by
about 1.0% annually from 14.84 MLD in 2010 to 20.83 MLD in 2040.
Source: Cavite PDPFP 2008-2013, Cavite SEPP 2009 & 2010
Figure 3.2-9 Livestock Water Demand (2010-2040)
1.00
1.50
2.00
2.50
3.00
3.50
4.00
2010 2012 2015 2020 2025 2030 2035 2040
Cu
tflo
wer
s &
Orn
am
enta
ls
Wat
er D
eman
d, M
LD
12.0
13.0
14.0
15.0
16.0
17.0
18.0
19.0
20.0
21.0
22.0
23.0
24.0
2010 2012 2015 2020 2025 2030 2035 2040
Live
sto
ck W
ater
Dem
and
, MLD

Cavite Integrated Water Resource Management Master Plan
3-9
Poultry populations in commercial farms include breeder, layer, contract broiler
and ducks. Historical data on poultry production showed an average annual
increase of 40% in the chicken and duck population from 2005 to 2010 (Annex II-
13E). However, a decreasing trend has been noted: 234% increase in 2005 to
2007, 45% in 2007 to 2009, and only 9.1% in 2009 to 2010. A total of 12
municipalities involved in the sector even posted negative growth from 2009 to
2010. For these reasons, the poultry production is forecasted to increase only by
about 1.0% annually for years 2012 to 2040. The number of heads is estimated to
increase from 9.78 million in 2010 to 12.90 million by 2040, as shown in Annex
II-14E and Figure 3.2-10.
Source: Cavite PDPFP 2008-2013, Cavite SEPP 2005, 2009 & 2010
Figure 3.2-10 Poultry Heads ‘000 Projections (2010-2040)
The poultry water requirement was estimated based on the projected number of
heads and an average consumption of 0.40 liter/head/day, as per data gathered
from the Office of the Provincial Agriculturist. Similar to livestock, poultry is
forecasted to increase by about 1.0% annually, from 3.91 MLD in 2010 to 5.16
MLD in 2040 (Annex II-14E and Figure 3.2-11).
Figure 3.2-11 Poultry Water Demand (2010-2040)
0
2,000
4,000
6,000
8,000
10,000
12,000
14,000
2005 2007 2009 2010 2012 2015 2020 2025 2030 2035 2040
Po
ult
ry H
ead
s '0
00
2.0
2.5
3.0
3.5
4.0
4.5
5.0
5.5
6.0
2010 2012 2015 2020 2025 2030 2035 2040
Po
ult
ry W
ater
Dem
and
, MLD

Cavite Integrated Water Resource Management Master Plan
3-10
Freshwater aquaculture or inland fishery is currently being engaged by some five
(5) municipalities in Cavite with about 25.19 hectares in 2010 utilized for
freshwater culture of bangus, sugpo and tilapia. The area for aquaculture from
2007 to 2010, showed an increasing trend with an average annual increase of
13% (Annex II-13E). However, taken into account its competing uses with rice
production and the already limited surface water sources in Cavite, the current
area allocated to freshwater aquaculture is estimated to increase only by about
1% percent annually, from 25.19 hectares in 2010 to 32.16 hectares by the year
2040, as shown in Annex II-14F and Figure 3.2-12.
Source: Cavite PDPFP 2008-2013, Cavite SEPP2009 & 2010
Figure 3.2-12 Aquaculture Area (2007-2040)
The aquaculture water requirement was estimated based on the projected
cultivated area and the estimated make-up water for the aquaculture ponds,
based on an average evaporation loss of 6mm. This is forecasted to increase
from 1.51 MLD in 2010 to 1.93 MLD in 2040 (Annex II-14F and Figure 3.2-13).
Figure 3.2-13 Aquaculture Water Demand (2010-2040)
10121416182022242628303234
2007 2009 2010 2012 2015 2020 2025 2030 2035 2040
Aq
uac
ult
ure
Are
a, H
a
1.00
1.10
1.20
1.30
1.40
1.50
1.60
1.70
1.80
1.90
2.00
2010 2012 2015 2020 2025 2030 2035 2040
Aq
uac
ult
ure
Wat
er D
eman
d, M
LD

Cavite Integrated Water Resource Management Master Plan
3-11
The projected agricultural water demand per city/municipality for years 2012 to
2040 at 5-year interval are tabulated in Annex II-14 and shown graphically in
Figure 3.2-14. The total agricultural water demand is estimated to slightly
decrease from 1,094 MLD in 2012 to 1,089 MLD in 2040.
Figure 3.2-14 Water Demand per City/Municipality (2010-2040)
3.2.3 Industrial Water Demand
Cavite has established a total of 51 economic zones/industrial estates, of which,
28 are operating, seven (7) are proclaimed, and 16 are still in the process of
development.
The phase of development within the Industrial Estates/Economic Zones were
assumed as follows: Operating Industrial Estates/Economic Zones are
assumed to be 75% occupied in 2010 and will be fully utilized by 2020;
Development in progress Industrial Estates/Economic Zones are assumed to
be 50% occupied in 2010 and to be 100% occupied by 2030;
Proclaimed Industrial Estates/Economic Zones are assumed to be 25%
occupied in 2010 and fully occupied by 2040;
Hence, the total area utilization was estimated to be 1,812.69 hectares and
estimated to increase to 3,078.04 hectares by the year 2040, a 170% increase of
the industrial area as shown in Annex II-15A and Figure 3.2-15.
0255075
100125150175200225250
Cav
ite
Cit
y
Kaw
it
No
vele
ta
Ro
sari
o
Bac
oo
r
Imu
s
Das
mar
iñas
Cit
y
Car
mo
na
Gen
. Mar
ian
o A
lvar
ez
Sila
ng
Trec
e M
arti
res
Cit
y
Am
adeo
Gen
. Tri
as
Tan
za
Taga
ytay
Cit
y
Alf
on
so
Gen
. Em
ilio
Agu
inal
do
Ind
ang
Mag
alla
nes
Mar
ago
ndo
n
Men
dez
Nai
c
Tern
ate
Agr
icu
ltu
ral W
ate
r D
em
and
, MLD
2010 2012 2015 2020 2025 2030 2035 2040

Cavite Integrated Water Resource Management Master Plan
3-12
Figure 3.2-15 Phase Development of Industrial Estates/Economic Zones (2010-2040)
As of 2010, there were153 industries located outside the Industrial
Estates/Economic Zones. This is projected to increase by 5.0% annually, to reach
661 by the year 2040, considering that rapid industrialization is assumed to be
sustained in the province over the medium term as shown in Annex II-15B and
Figure 3.2-16.
Source: Cavite SEPP 2005, 2009 & 2010
Figure 3.2-16 Number of Industrial Establishments Outside IEs/EZs (2005-2040)
1,000
1,500
2,000
2,500
3,000
3,500
2010 2012 2015 2020 2025 2030 2035 2040
Hec
tare
s o
f In
du
stri
al E
stat
es/
Eco
no
mic
Zo
nes
100
120
140
160
180
200
220
240
260
280
300
2005 2009 2010 2012 2015 2020 2025 2030 2035 2040
No
. of
Ind
ust
rial
Est
ablis
hm
ents
Ou
tsid
e
In
du
stri
al E
stat
es/
Eco
no
mic
Zo
ne
s

Cavite Integrated Water Resource Management Master Plan
3-13
The total industrial water demand was estimated based on the assumed phase of
development within the IEs/EZs, increase in the number of industrial
establishments outside the IEs/EZs, and assuming a unit consumption of 60
cum/day/ha and 25 cum/day/connection. The projected industrial demand is
forecasted to increase annually by 1.8%, from 112 MLD in 2010 to 192 MLD by
2040. The industrial demand projections are tabulated in Annex II-15 and shown
graphically in Figure 3.2-17.
Figure 3.2-17 Cavite Industrial Water Demand (2010-2040)
3.2.4 Recreation
At present, Cavite has a total of 8 internationally-known, operational golf courses. Other recreation facilities include zoos, theme farms, and leisure parks and farms. The existing and future water demand for golf courses and other recreation facilities was estimated based on total land area and water duty/requirement of 0.20 lps/ha, based on the NWRB policy on the use of water for the maintenance of turf grasses in golf courses. The recreational water demand is forecasted to increase by about 1.0% annually, from 12.02 MLD in 2010 to be 15.17% MLD by the year 2040. The projected total recreational water demand is tabulated in Annex II-16 and shown graphically in Figure 3.2-18:
100
110
120
130
140
150
160
170
180
190
200
2010 2012 2015 2020 2025 2030 2035 2040
Tota
l In
du
stri
al W
ater
Dem
and
, M
LD

Cavite Integrated Water Resource Management Master Plan
3-14
Figure 3.2-18 Cavite Recreational Water Demand (2010-2040)
3.2.5 Power Generation
There are no reported existing hydropower plants in the study area. The electric
power of the entire province is being supplied by the National Power Corporation
(NPC) through the Manila Electric Company (MERALCO). The current
energization rate is at 100%.
3.2.6 Total Water Demand
The total water demands by category per city/municipality for years 2012 through
2040 at 5-year interval are shown in Annex II-17 and are summarized in Table
3.2-2. The estimated 2012 total water demand of 1,753 MLD is forecasted to
increase by 1.6% average annually, to reach 2,845 MLD by the year 2040.
Table 3.2-2 Projected Total Provincial Water Demand (mld)
Year 2012 2015 2020 2025 2030 2035 2040
Domestic Water Demand 525 538 669 838 1,063 1,297 1,549
Agricultural Demand 1,094 1,090 1,087 1,077 1,074 1,077 1,089
Industrial Water Demand 122 136 160 172 184 188 192
Recreational Water Demand 12.02 12.45 13.03 13.46 13.90 14.47 15.17
Water Demand 1,753 1,777 1,929 2,100 2,335 2,576 2,845
The percentage share of the different category of users in 2012 will have
significantly changed in the year 2040, shown in Figure 3.2-19 and Figure 3.2-
20. The agriculture demand will reduce from its 62% share in 2012 to 38% in
10.0
10.5
11.0
11.5
12.0
12.5
13.0
13.5
14.0
14.5
15.0
15.5
16.0
2012 2015 2020 2025 2030 2035 2040
Tota
l Re
crea
tio
nal
Wat
er
De
man
d, M
LD

Cavite Integrated Water Resource Management Master Plan
3-15
2040. Land is a limited resource- with the built up areas forecasted to increase
further due to increase in population and industrial establishments, agriculture will
decline in land area and water demand allocation. On the other hand, the
domestic demand will dramatically increase from only 30% share in 2012 to 54%
in 2040. For industrial and recreation uses, these will experience a slight increase
but allocation will remain at the same levels at 7% and 1%, respectively.
Figure 3.2-19 Cavite Water Demand (Year 2012)
Figure 3.2-20 Cavite Water Demand (Year 2040)
The present demand for ground water, catering to domestic, agriculture
(vegetables, cut flowers and ornamentals, livestock, and poultry production),
industrial, and recreational use is estimated at 821 MLD, about 47% of the total
54%
7%
1%
38%
2040 Cavite Water Demand
Domestic Industrial Recreation Agriculture

Cavite Integrated Water Resource Management Master Plan
3-16
Cavite water demand. This is forecasted to increase by an average of 3.0%
annually, to reach 2,018 MLD by the year 2040 as shown in Figure 3.2-21. By
2040, these various water uses supplied by groundwater sources, will represent
about 71% of the total water demand.
Figure 3.2-21 Total Cavite Ground Water Demand (2012-2040)
The surface water demand consists mainly of demand for irrigated rice
production and aquaculture, currently estimated at 932 MLD and representing
about 53% of the present total Cavite water demand. The demand for surface
water is forecasted to decrease by an average of 0.40% annually and estimated
to reach 827 MLD by the year 2040 (Figure 3.2-22), representing about 29% of
the total Cavite water demand in 2040.
Figure 3.2-22 Total Cavite Surface Water Demand (2012-2040)
600
700
800
900
1,000
1,100
1,200
1,300
1,400
1,500
1,600
1,700
1,800
1,900
2,000
2,100
2012 2015 2020 2025 2030 2035 2040
Tota
l Gro
un
d W
ater
Dem
and
, MLD
0
200
400
600
800
1,000
2012 2015 2020 2025 2030 2035 2040
Tota
l Su
rfac
e W
ater
Dem
and
, MLD

Cavite Integrated Water Resource Management Master Plan
4-1
CHAPTER 4 WATER RESOURCES ASSESSMENT
4.1 SURFACE WATER ASSESSMENT 4.1.1 General
The main factors determining river flow, the amount of water passing any given
location along the river at any time, are:
Amount of any rainfall within this area reaching the river
Size of area drained by the river, known as it‘s watershed or catchment, and
its topography
Removal or addition of water and any control of the rate of flow
Nature of the soil, any under soil layers, and solid rock beneath
Surface water supplies are generally of two (2) types: a) on-stream storage,
which is controlled using a dam structure and is necessary for streams that
exhibit significant flow variability, and b) run-of-the river supply source which
supplies directly from the unregulated stream. In view of the potentially significant
environmental implications, this study pertains to the latter type.
Streamflow can vary considerably from the long-term average value, with the
variation being largest for short-time intervals but still has significant variation
even over longer time scales. The ability of a water source to supply a certain
level of water demand thus depends not only on the long-term mean flow, but
also on the degree of seasonal and inter-annual streamflow variability. The
seasonal variation of demand is a key determinant of supply reliability because
peaks in demand may occur when the natural availability of supply is smallest.
The ability to supply water reliably to the service area depends primarily on the
availability of the water at its source, normally measured in terms of ―Yield‖. Yield
is the amount of water that can be supplied from the river during a specified
interval of time.
4.1.2 Rainfall
Rainfall is one of the primary drivers of the hydrological cycle, with its volume
and intensity directly affecting the volume of water available within a catchment.
Rainfall within a catchment generally varies spatially with topography. Observed
rainfall is representative only of rainfall falling over a limited area in the vicinity of
the gauge. For this study, mean annual rainfall values (Table 4.1-1) are derived
from four (4) PAGASA rainfall stations located in the province of Cavite and
two(2) stations located in the province of Batangas.

Cavite Integrated Water Resource Management Master Plan
4-2
Table 4.1-1 PAGASA Rainfall Stations
Rainfall Station North
Latitude East
Longitude Mean Annual Value (mm)
Data
Amadeo 14° 08’ 120° 57’ 3,414.4 1985-2003
Bacoor 14° 27’ 120° 56’ 1,744.7 1975-2006
Sangley 14° 30’ 120° 55’ 2,041.0 1974-2010
Tagaytay 14° 07’ 120° 58’ 2,115.2 1996-2010
Ambulong 14° 05’ 121° 03’ 1,782.6 1951-2010
Nasugbu 14°05’ 120° 38’ 2,053.2 1972-2010
Source: PAGASA
Isohyetal maps (Figure 4.1-1), showing lines of equal rainfall depth (isohyets),
are produced by PAGASA using the synthesized rainfall values. PAGASA
claimed that the recorded data for Amadeo station are dubious and therefore
were not included in the calculation of the annual mean rainfall isohyetal map of
the province.
Source: PAGASA
Figure 4.1-1 Mean Annual Rainfall Isohyetal of Cavite
Annual Rainfall
The average annual rainfall in the province of Cavite is heavily influenced by
monsoon and terrain. Rainfall distribution is uneven by time and space. Mean
annual rainfall in the province varies from a low of 1744.7 mm to a high of 3931.1
mm. The minimum annual rainfall is measured in Bacoor while higher annual
rainfall is generally recorded in Amadeo. The annual rainfall statistics are given
as follows;

Cavite Integrated Water Resource Management Master Plan
4-3
Table 4.1-2 Annual Rainfall Statistics
Station Max Min Mean Median Std. Dev. Cv
Sangley Point 3115.8 1008.8 2041.0 2027.9 464.3 0.23
Tagaytay 2859.7 1713.0 2115.2 2066.7 355.2 0.17
Amadeo 6731.4 1668.6 3931.1 3883.0 1587.0 0.40
Bacoor 2622.9 700.3 1744.7 1738.6 406.7 0.23
Source: PAGASA
Monthly Rainfall
The conditions at the project area are reflected in the rainfall data at the four (4)
stations in the province. The maximum rainfall usually occurs during the months
of July and August. The rainy season lasts from May to October, with aggregate
rainfall in this season representing 78-90% of the total annual rainfall. The dry
season lasts from November to April, with aggregate rainfall in this season
covering 10-22% of the whole year‘s rainfall. March is the driest month while July
or August is the wettest month.
Table 4.1-3 Monthly Rainfall Statistics
Station Jan Feb Mar Apr May Jun Jul Aug Sep Oct Nov Dec Annual Record
Sangley Point
18.8 9.8 9.6 18.8 141.1 251.8 397.8 455.9 326.9 211.0 112.6 57.7 2041.0 1974-2010
Tagaytay 39.3 38.7 32.9 51.3 193.5 233.2 381.5 279.9 337.0 204.7 161.9 141.7 2115.2 1996-2010
Amadeo 106.6 58.5 40.6 63.3 338.9 457.5 775.9 710.2 393.7 465.4 257.2 198.6 3931.1 1985-2003
Bacoor 10.5 8.4 7.0 11.2 126.0 227.1 354.0 410.3 266.9 182.9 99.8 43.7 1744.7 1975-2006
Source: PAGASA
4.1.3 Catchment Area and River System
The major river basins in Cavite (Table 4.1-4) originate in the southern
mountainous part of the province and flows northerly, traversing the various
municipalities and emptying into Manila Bay. The size of the watershed or
catchment basin is the most important parameter affecting the determination of
the total runoff.
Table 4.1-4 Major River Basins
River Basin Drainage Area (sq.km)
Maragondon 359.4
Labac 94.5
Cañas 113.1
San Juan 180.9
Imus 123.2
Source: Cavite SEPP 2010; NAMRIA

Cavite Integrated Water Resource Management Master Plan
4-4
Figure 4.1-2 shows the location and catchment areas of the major basins in the province.
Source: Water Resources Assessment and Development Plan for Sustainable Utilization of Water Resources in Nine (9) LGUs in Cavite Province, SWECO-WATCON, Inc. Sept.2004
Figure 4.1-2 Major River Basins in Cavite
By definition, a watershed is the land area that contributes surface water runoff to
a common point. It is separated from adjacent watersheds by a land ridge or
divide and can vary in size, from a few hectares to thousands of square
kilometers. A larger watershed can contain many smaller sub-watersheds which
are defined in the same manner as a watershed. On a larger scale, a basin is
defined as a collection of watersheds that feed into a common main tributary or
large body of water.
The drainage areas or the points of interest in the study were determined from
the 1:50,000 topographic maps of the National Mapping and Resource
Information Authority (NAMRIA) of the Department of Environment and Natural
Resources (DENR). The locations of the gauging stations were identified in the
1:50,000 scale topographic map and delineated for confirmatory purposes. The
delineated watershed, reckoned at the site of interest, and the estimated size of
the catchment area is shown in Table 4.1-5.
Labac San Juan
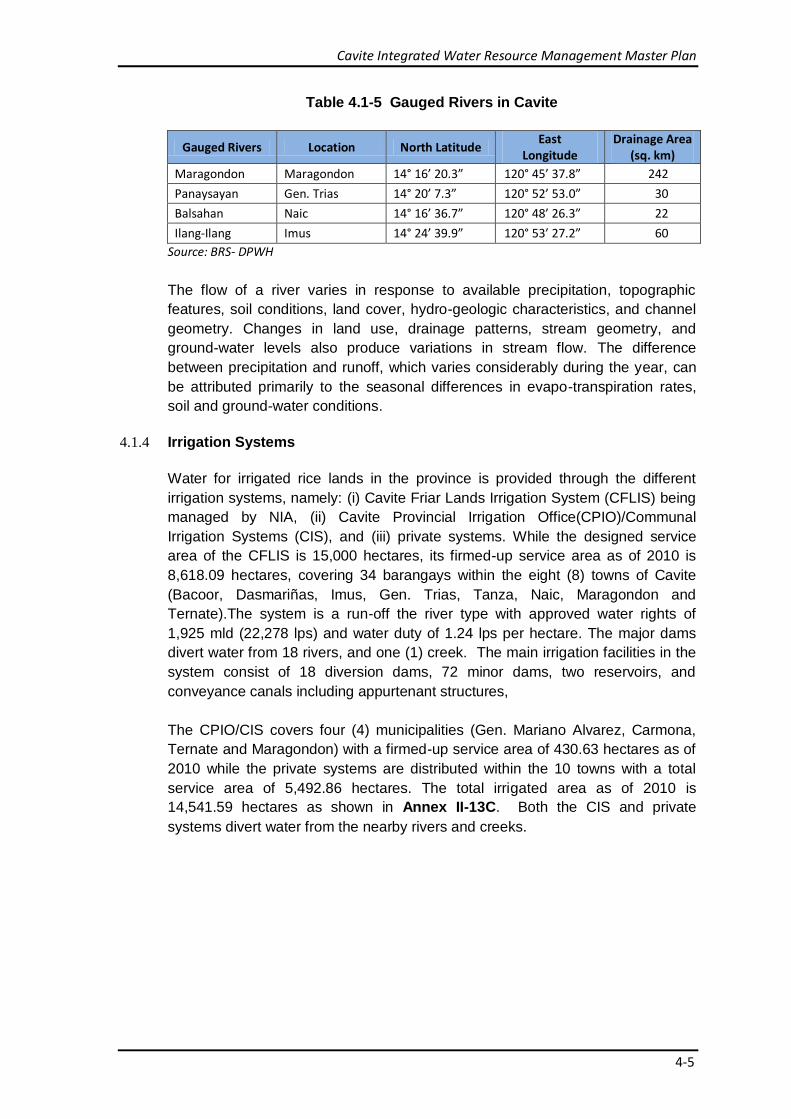
Cavite Integrated Water Resource Management Master Plan
4-5
Table 4.1-5 Gauged Rivers in Cavite
Gauged Rivers Location North Latitude East
Longitude Drainage Area
(sq. km)
Maragondon Maragondon 14° 16’ 20.3” 120° 45’ 37.8” 242
Panaysayan Gen. Trias 14° 20’ 7.3” 120° 52’ 53.0” 30
Balsahan Naic 14° 16’ 36.7” 120° 48’ 26.3” 22
Ilang-Ilang Imus 14° 24’ 39.9” 120° 53’ 27.2” 60
Source: BRS- DPWH
The flow of a river varies in response to available precipitation, topographic
features, soil conditions, land cover, hydro-geologic characteristics, and channel
geometry. Changes in land use, drainage patterns, stream geometry, and
ground-water levels also produce variations in stream flow. The difference
between precipitation and runoff, which varies considerably during the year, can
be attributed primarily to the seasonal differences in evapo-transpiration rates,
soil and ground-water conditions.
4.1.4 Irrigation Systems
Water for irrigated rice lands in the province is provided through the different
irrigation systems, namely: (i) Cavite Friar Lands Irrigation System (CFLIS) being
managed by NIA, (ii) Cavite Provincial Irrigation Office(CPIO)/Communal
Irrigation Systems (CIS), and (iii) private systems. While the designed service
area of the CFLIS is 15,000 hectares, its firmed-up service area as of 2010 is
8,618.09 hectares, covering 34 barangays within the eight (8) towns of Cavite
(Bacoor, Dasmariñas, Imus, Gen. Trias, Tanza, Naic, Maragondon and
Ternate).The system is a run-off the river type with approved water rights of
1,925 mld (22,278 lps) and water duty of 1.24 lps per hectare. The major dams
divert water from 18 rivers, and one (1) creek. The main irrigation facilities in the
system consist of 18 diversion dams, 72 minor dams, two reservoirs, and
conveyance canals including appurtenant structures,
The CPIO/CIS covers four (4) municipalities (Gen. Mariano Alvarez, Carmona,
Ternate and Maragondon) with a firmed-up service area of 430.63 hectares as of
2010 while the private systems are distributed within the 10 towns with a total
service area of 5,492.86 hectares. The total irrigated area as of 2010 is
14,541.59 hectares as shown in Annex II-13C. Both the CIS and private
systems divert water from the nearby rivers and creeks.

Cavite Integrated Water Resource Management Master Plan
4-6
Figure 4.1-3 Existing Irrigation Systems
4.1.5 Stream flow Analysis
Maragondon River
Based on available 23-year daily streamflow data (1983-2005) of Maragondon
River in Brgy. Bucal, Maragondon from the Bureau of Research and Standards of
DPWH, the daily discharge of Maragondon River is analyzed. The mean
discharge values are expectedly high during the southwest monsoon season
(May-October) and less during the northeast monsoon season (November-April).
The daily maximum for the recorded flows varies from a high of 34,266.24 MLD
(396.60 cms) during the month of September to a low of 240.192 MLD (2.78 cms)
during the month of April. The minimum flow varies from 13.824 MLD (0.16 cms)
in September to 56.16 MLD (0.65 cms) in December (Figure 4.1-4). It was also
noted that the mean of the daily flow varies from 94.176 MLD (1.09 cms) during
the dry season to 1,900.80 MLD (22.00 cms) during the rainy season. The
coefficient of variability ranges from a minimum of 0.41 to a high of 4.07,
indicating a high variability of flow.

Cavite Integrated Water Resource Management Master Plan
4-7
Figure 4.1-4 Plot of Minimum, Median and Mean Discharge of Maragondon River
The mean daily discharge of Maragondon River decreases gradually from
December to April. This closely follows the monthly rainfall pattern in Tagaytay
and Amadeo. It was noticed that the flows in late May are comparatively higher
than those in April. This may be mainly due to pre-monsoon showers. However,
in some years when the pre-monsoon showers are not received in sufficient
quantity, the later weeks of May are also affected by low flows. The monthly high
flows begin to peak in August and gradually decrease in the succeeding months.
Panaysayan River
Available daily streamflow data (1983-2004) for Panaysayan River from the
Bureau of Research and Standards of DPWH were analyzed. The river is gauged
at Brgy. Palubluban in the municipality of Gen. Trias. Mean discharge values are
expectedly high during the southwest monsoon season (May-October) and low
during the northeast monsoon season (November-April).
The maximum daily flows from record varies from a high of 11371.104
MLD(131.61 cms) during the month of July to a low of 100.224 MLD (1.16 cms)
from January to April. The minimum flow varies from 1.728 MLD (0.02 cms) in
March to 7.776 MLD (0.09 cms) from August to September (Figure 4.1-5).It was
also noted that the mean of the daily flow varies from 19.008 MLD (0.22 cms)
during the dry season to 178.848 MLD (2.07 cms) during the rainy season. The
coefficient of variability ranges from a minimum of 0.78 to a high of 4.88,
indicating a high variability of flow.
0.00
5.00
10.00
15.00
20.00
25.00
Jan Feb Mar Apr May Jun Jul Aug Sep Oct Nov Dec
Dis
char
ge, c
ms
Month
Minimum
Mean
Median

Cavite Integrated Water Resource Management Master Plan
4-8
0.00
0.50
1.00
1.50
2.00
2.50
Jan Feb Mar Apr May Jun Jul Aug Sep Oct Nov Dec
Dis
ch
arg
e, cm
s
Month
Min, cms
Mean, cms
Median, cms
Figure 4.1-5 Plot of Minimum, Median and Mean Discharge of Panaysayan River
The mean daily discharge of Panaysayan River decreases gradually from
December to April. The monthly high flows begin to peak in August and gradually
decrease in succeeding months. The exception is October, when the flows spike
before tapering in December.
Ilang-Ilang and Balsahan Rivers
Monthly discharge records were the only available data for the Ilang-Ilang and
Balsahan Rivers, covering the early 50‘s until the 70‘s. Source information on
daily flows were no longer available. The statistical information provided for both
gauged rivers are summarized in Table 4.1-6.
Table 4.1-6 Monthly Discharge of Ilang-Ilang and Balsahan Rivers, cms
Parameter Jan Feb Mar Apr May Jun Jul Aug Sept Oct Nov Dec
Balsahan River
Mean 0.52 0.35 0.33 0.30 0.96 2.37 3.64 3.57 4.01 2.14 1.67 0.84
Std. Dev 0.66 0.48 0.53 0.57 1.25 2.25 4.43 3.06 3.45 2.60 3.30 1.27
Correl 0.82 0.95 0.98 0.61 0.27 0.51 0.36 0.37 0.12 0.58 0.45 0.53
Skew 1.69 2.00 2.19 2.77 1.25 1.32 2.13 1.24 0.62 1.64 3.32 1.87
Cv 1.28 1.39 1.58 1.89 1.31 0.95 1.22 0.86 0.86 1.21 1.98 1.52
Minimum 0.07 0.06 0.02 0.00 0.02 0.08 0.21 0.27 0.19 0.04 0.06 0.04
Maximum 2.38 1.62 1.92 2.3 3.57 8.74 17.89 11.43 11.26 9.32 14.79 4.27
Ilang-Ilang River
Mean 0.12 0.08 0.06 0.05 0.53 0.86 1.74 3.54 4.38 1.68 2.27 0.88
Std. Dev 0.11 0.06 0.05 0.04 2.07 2.08 4.20 4.90 7.46 2.76 4.73 1.87

Cavite Integrated Water Resource Management Master Plan
4-9
Parameter Jan Feb Mar Apr May Jun Jul Aug Sept Oct Nov Dec
Correl 0.73 0.93 0.81 -0.16 0.15 0.92 -0.03 0.81 0.01 -0.11 0.71 -0.03
Skew 1.93 1.30 1.14 1.12 4.76 3.98 3.53 2.10 1.96 2.15 2.81 3.10
Cv 0.88 0.75 0.84 0.80 3.93 2.41 2.42 1.39 1.70 1.65 2.08 2.12
Minimum 0.01 0.01 0.01 0.01 0.01 0.01 0.04 0.12 0.14 0.16 0.02 0.01
Maximum 0.5 0.26 0.2 0.16 10.46 9.8 19.04 18.71 26.21 11.59 20.52 7.99
Source: BRS-DPWH
4.1.6 Flow Duration Curve (FDC)
General
For a realistic estimation of the yield of a river, long-term monitoring is required.
The firm yield of a river is defined as the flow discharge which can be expected to
be exceeded most of the time at a certain point along a river. For example, the
minimum flow discharge value can describe a firm yield since this discharge can
be expected to be exceeded (100%) at any day and all year round. The most
informative way of showing this is to derive a flow duration curve for the river. A
flow duration curve is a simple graphical depiction of a range of flow rates
expected and the chance that these values can be equalled or exceeded as a
percentage of the period (or probability)of record at a GAUGING station.
Typically, minimum (or low) flows are exceeded most of the time, while maximum
(or high) flows are exceeded very infrequently.
The flow duration curve can be used to set categories of flow and used as a
general indicator of hydrologic conditions. The various categories and their
corresponding flow intervals drawn from an FDC are summarized in Table 4.1-7.
Table 4.1-7 Flow Duration Categories
Category Prob. of Exceedance, %
High Flows 0-10
Wet Conditions 10-40
Mid-range flows 40-60
Dry Conditions 60-90
Low Flows 90-100
In defining design flows, the sustenance of natural ecological activities in the
stream as well as the riparian flow requirement based on NWRB guidelines,
which is set equal to 10% of the flow at 80% of the time the flow is equaled or
exceeded, should be considered.
Maragondon River
The daily streamflow record at Maragondon River varies significantly over the
year. Flow duration analysis on a monthly basis was conducted on the daily

Cavite Integrated Water Resource Management Master Plan
4-10
historical data and the results are shown in Table 4.1-8. The daily discharge
values are generally higher during the rainy season (May-October).
Table 4.1-8 Monthly Flow Duration of Maragondon River (cms)
Probability of Exceedance
Jan Feb Mar Apr May Jun Jul Aug Sept Oct Nov Dec
99 0.53 0.48 0.47 0.50 0.59 0.65 0.74 1.19 1.13 1.27 1.13 0.68
95 0.59 0.50 0.49 0.59 0.62 0.74 0.86 1.35 1.44 1.78 1.24 0.68
90 0.62 0.59 0.58 0.65 0.74 0.86 1.08 1.86 2.55 2.12 1.52 0.80
80 0.86 0.83 0.71 0.74 0.77 1.08 1.52 2.78 3.35 2.55 1.78 1.35
50 1.69 1.24 1.02 0.91 1.13 1.95 4.08 5.34 0.06 4.51 2.78 2.12
For Maragondon River, about ninety five percent (95 %) of the time, one may
expect flow rates to range from 0.49 cums to1.78 cums. A firm yield on a monthly
basis can be set at the lowest value of this range 0.49 cums (dry season, March).
A ninety nine percent (99%) exceedence for Maragondon River would set a firm
yield at about 0.47 cums (dry season, March).
When all daily flows are included in a curve and regardless of the time sequence
of the year, a flow duration analysis for Maragondon River yields the results in
Table 4.1-9.
Table 4.1-9 Daily Flow Duration Curve
Prob. of Exceedance
Maragondon River, cms
All Data Dry
Season Wet
Season
99 0.49 0.48 0.62
95 0.65 0.59 0.77
90 0.77 0.68 0.97
85 0.91 0.77 1.13
80 1.02 0.86 1.30
75 1.13 0.91 1.52
70 1.24 1.02 1.95
65 1.44 1.13 2.20
60 1.61 1.24 2.55
55 1.78 1.30 3.01
50 2.03 1.44 3.35
45 2.32 1.61 3.93
40 2.55 1.69 4.37
35 3.01 1.86 4.98
30 3.35 2.03 5.88
25 4.08 2.20 6.82
20 4.80 2.55 8.54
15 6.42 2.89 12.09
10 9.50 3.35 21.25
The graph of the flow duration for Maragondon Rive is shown in Figures 4.1-6.

Cavite Integrated Water Resource Management Master Plan
4-11
Figure 4.1-6 Flow Duration Curve for Maragondon River
Considering sustenance of natural ecological activities in the stream as well as
the riparian flow requirement based on NWRB guidelines which is set equal to
10% of the flow at 80% of the time the flow is equaled or exceeded, the derived
flow duration values for Maragondon River is shown in Table 4.1-10.
Table 4.1-10 Flow Duration of Maragondon River (net of riparian flow requirements)
% of time equaled or exceeded
Maragondon River (cms)
Maragondon River (MLD)
99 0.388 33.523
95 0.548 47.347
90 0.668 57.715
85 0.808 69.811
80 0.918 79.315
50 1.928 166.579
Panaysayan River
Using daily stream flow record, a flow duration analysis on a monthly basis was
conducted on the daily historical data of Panaysayan River and the results are
shown in Table 4.1-11. For Panaysayan River, in about ninety five percent (95
%) of the time, one may expect flows to range from 0.06 cums to
0.19cumsacross the months. A firm yield on a monthly basis can be set at 0.06
cms. A ninety nine percent (99%) exceedence for Panaysayan River would set
the firm yield at about 0.03 cums (observed in May).
0.10
1.00
10.00
100.00
1000.00
0 20 40 60 80 100
Dis
ch
arg
e,
cm
s
Probability of Exceedance, %
All days
Dry Season
Wet Season

Cavite Integrated Water Resource Management Master Plan
4-12
Table 4.1-11 Monthly Flow Duration of Panaysayan River (cms)
Probability of Exceedance
Jan Feb Mar Apr May Jun Jul Aug Sept Oct Nov Dec
99 0.09 0.06 0.05 0.06 0.03 0.04 0.07 0.10 0.11 0.09 0.09 0.03
95 0.10 0.08 0.06 0.07 0.07 0.08 0.11 0.16 0.19 0.14 0.12 0.11
90 0.10 0.09 0.08 0.08 0.08 0.10 0.16 0.23 0.23 0.19 0.15 0.13
80 0.13 0.11 0.10 0.10 0.10 0.16 0.21 0.37 0.31 0.25 0.21 0.15
50 0.21 0.17 0.17 0.17 0.25 0.35 0.55 0.62 0.48 0.39 0.35 0.25
A flow duration analysis of all data for Panaysayan River wasconducted and the
resulting values are summarized in Table 4.1-12.
Table 4.1-12 Daily Flow Duration Curve
Prob. of Exceedance
Panaysayan River, cms
All Data Dry
Season Wet
Season
99 0.05 0.05 0.06
95 0.08 0.08 0.09
90 0.10 0.10 0.14
85 0.13 0.11 0.17
80 0.15 0.13 0.21
75 0.16 0.14 0.25
70 0.19 0.15 0.29
65 0.21 0.16 0.33
60 0.23 0.17 0.35
55 0.27 0.20 0.37
50 0.29 0.21 0.41
45 0.33 0.23 0.48
40 0.37 0.25 0.55
35 0.41 0.29 0.62
30 0.48 0.31 0.69
25 0.59 0.34 0.76
20 0.69 0.39 1.04
15 0.91 0.45 1.32
10 1.16 0.69 2.63
The graphs of the flow duration for Panaysayan River is shown in Figures 4.1-7.
The chart is organized to show values for the dry and wet season, and when all
flows are considered.

Cavite Integrated Water Resource Management Master Plan
4-13
Figure 4.1-7 Flow Duration Curve for Panaysayan River
Considering the requirement based on NWRB guidelines, the derived flow
duration values are as shown in Table 4.1-13.
Table 4.1-13 Flow Duration of Panaysayan River (net of riparian flow requirements)
% of time equaled or exceeded
Panaysayan River (cms)
Panaysayan River (MLD)
99 0.035 3.024
95 0.065 5.616
90 0.085 7.344
85 0.115 9.936
80 0.135 11.664
50 0.275 23.760
Balsahan River
Using monthly gauged stream flow data available for Balsahan River, a statistical
analysis was conducted and the results are summarized in Table 4.1-14.
0.01
0.10
1.00
10.00
100.00
1000.00
0 20 40 60 80 100
Dis
char
ge, c
ms
Probability of Exceedance, %
All days
Dry Season
Wet Season

Cavite Integrated Water Resource Management Master Plan
4-14
Table 4.1-14 Monthly Streamflow Statistical Analysis of Balsahan (cms)
Jan Feb Mar Apr May Jun Jul Aug Sept Oct Nov Dec
Balsahan River
Mean 0.518 0.345 0.333 0.301 0.956 2.370 3.644 3.575 4.007 2.144 1.655 0.836
Std. Dev. 0.663 0.479 0.527 0.570 1.254 2.255 4.430 3.064 3.448 2.603 3.303 1.270
Correl 0.815 0.948 0.980 0.606 0.274 0.505 0.360 0.374 0.117 0.578 0.447 0.533
Skew 1.693 2.005 2.190 2.766 1.250 1.321 2.131 1.241 0.624 1.640 3.323 1.874
Cv 1.281 1.389 1.583 1.894 1.312 0.951 1.216 0.857 0.861 1.214 1.984 1.518
Minimum 0.070 0.060 0.020 0.000 0.020 0.080 0.210 0.270 0.190 0.040 0.060 0.040
Maximum 2.380 1.620 1.920 2.300 3.570 8.740 17.890 11.430 11.260 9.320 14.790 4.270
Source: BRS-DPWH
The statistical parameters of the generated streamflow sequences were
compared with those of historical data. The resulting flow duration values are
shown in Figure 4.1-8.
Figure 4.1-8 Flow Duration Curve for BalsahanRiver
Ilang-ilang River
Using monthly gauged stream flow data available for Ilang-ilang River, similar
statistical analysis was conducted and the results are summarized in Table 4.1-
15.
0.001
0.010
0.100
1.000
10.000
0 10 20 30 40 50 60 70 80 90 100
Dis
ch
arg
e,
cm
s
Probability of Exceedance, %
All Data
Dry Season
Wet Season

Cavite Integrated Water Resource Management Master Plan
4-15
Table 4.1-15 Monthly Streamflow Statistical Analysis of Ilang-Ilang Rivers
Jan Feb Mar Apr May Jun Jul Aug Sept Oct Nov Dec
Mean 0.122 0.076 0.062 0.052 0.528 0.863 1.737 3.537 4.385 1.676 2.269 0.880
Std. Dev. 0.107 0.058 0.052 0.041 2.074 2.079 4.195 4.901 7.459 2.761 4.729 1.866
Correl 0.726 0.928 0.805 -0.160 0.147 0.923 -0.028 0.806 0.006 -0.106 0.710 -0.035
Skew 1.931 1.296 1.140 1.117 4.759 3.980 3.533 2.104 1.959 2.151 2.811 3.103
Cv 0.875 0.754 0.841 0.798 3.925 2.409 2.415 1.386 1.701 1.648 2.084 2.122
Minimum 0.010 0.010 0.010 0.010 0.010 0.010 0.040 0.120 0.140 0.160 0.020 0.010
Maximum 0.500 0.260 0.200 0.160 10.460 9.800 19.040 18.710 26.210 11.590 20.520 7.990
Source: BRS-DPWH
The resulting flow duration values for Ilang-ilang River are charted in Figure 4.1-
9.
Figure 4.1-9 Flow Duration Curve for Ilang-Ilang River
Minor Rivers in Cavite
Transposition method is a common practice in hydrology for estimating river
discharge of the un-gauged river. This is resorted to if the observation period is
short, as spot data can only provide insights on flow pattern prevailing at the time
of observation. The transposition of design discharges from one basin to another
basin with similar hydrologic characteristics is accomplished by relating the
design discharge with the direct ratio of the respective drainage areas. This
synthetic method was used in areas of Canas, Labas and San Juan where flow
gauging stations are unavailable.
0.001
0.010
0.100
1.000
10.000
0 10 20 30 40 50 60 70 80 90 100
Dis
ch
arg
e,
cm
s
Prob. of Exceedance, %
All Data
Dry Season
Wet Season
Cavite Integrated Water Resource Management Master Plan
4-16
Aside from the four (4) rivers identified as possible surface water sources, other
rivers were also observed in the study. The following are the observations made
during the survey of six (6) minor rivers in the Province of Cavite.
1) LULUNGISAN RIVER
Lulungisan River, a tributary of Maragondon River, originates from Brgy.
Kayquit III, Indang, approximately 1.5km from the town proper. The river is
surrounded by vegetation and rock formation. Access is difficult due to steep
slopes on both sides. According to local residents, the depth of the water
usually ranges from 0.5m to1.0m. No active signs of freshwater life were
observed during the site visit. The water looked clear and was flowing quite
fast.
2) LUMIPA RIVER
Lumipa River, also a tributary of Maragondon River, originates in Brgy.
Tabora of Gen. Emilio Aguinaldo, Cavite. The river is surrounded by
vegetation and rock formation. Slope is not that steep on both sides and
some locals have settled along the banks of the river.
According to residents in the area, the depth of the river varies from 1.0m to
1.5m or deeper. No active signs of freshwater life were observed during the
site visit. The water looked clear and was quite fast-flowing.
3) HALANG RIVER
Halang river, a tributary of Panaysayan River originates from the highlands of
Tagaytay and passes through the boundary of Silang and Amadeo.
The river is surrounded by vegetation and can be easily accessed through a
constructed pathway. Information from locals indicates that the water is
usually about 0.5m deep. No active signs of freshwater life were evident
during the time of the survey. Locals use the water for washing their clothes
and garbage was observed flowing over the river. Water was a bit turbid and
flowed moderately fast.
4) HABULING RIVER
Habuling River is also a tributary of Maragondon River.It originates
approximately 2km northwest of Indang town proper. The river is surrounded
by vegetation and access is difficult due to steep slopes. The water is
relatively clear despite the presence of garbage. River flow is slow and depth
was about 0.5m at the time of the survey.
5) CAISOBO RIVER
Caisobo River originates approximately 4km southeast of Naic and is a
tributary of Balsahan River.The river is surrounded by vegetation. Water is
turbid and flows very slowly and at times almost stagnant. According to
residents, the river never dries up during summer and the water depth was
less than 0.5m at the time of the survey. Presence of garbage on the river
was observed.

Cavite Integrated Water Resource Management Master Plan
4-17
6) MAGAY RIVER
Magay River is a tributary of Maragondon River and originates at gen. Emilio
Aguinaldo. It is located approximately 4km southeast of Maragondon, Cavite.
The river is surrounded by vegetation and water is a bit turbid and fast
flowing. According to residents, the river never runs dry during summer and
its depth varies from 0.5m to 1.5m or deeper. No active signs of freshwater
life were observed during the site visit.
Table 4.1-16 shows the estimated cumulative discharges of the surveyed river basins in the province.
Table 4.1-16 Cavite River Survey Stations
RIVER BASIN DRAINAGE
AREA, km²
DISCHARGE (95% PROBABILITY OF EXCEEDENCE)
DRY WET
lps MLD lps MLD
Maragondon 242.0 590.0 51.0 779.7 67.4
Labac 22.0 40.0 3.5 98.0 8.5
Cañas 30.0 80.0 6.9 90.0 40.0
San Juan 60.0 10.0 0.9 30.0 2.6
Source: Cavite Water Supply and Development Study, JICA, 1995
4.1.7 Lakes
Two (2) huge bodies of water which are potential sources of surface water supply
for the province of Cavite are Laguna de Bay and Taal Lake. These sources are
situated east and southeast of the province of Cavite.
4.1.7.1 Laguna de Bay
Laguna de Bay is a trilobate lake with
three (3) corporate bays: The West Bay,
Central Bay, and East Bay that converge
towards the South carving out what
resembles a large bird or dinosaur. The
West and Central Bays are separated by
Talim Island, the largest and most
populated of the nine islands within the
lake. It is bordered by the ruggedly high
Sierra Madre mountain ranges on the
Northeastern portion, the high Caliraya
volcanic plateau in the East and the
chains of mountains of Laguna and
Batangas province to the South and
Southeast, which includes Mt. Banahaw
and Mt. Makiling. Source: NAMRIA
Figure 4.1-10 Laguna de Bay

Cavite Integrated Water Resource Management Master Plan
4-18
Laguna de Bay is the second largest body of freshwater in Southeast Asia. It has
a surface area of approximately 90,000 hectares, an average depth of 2.8m, a
total volume of 3.2 billion cubic meters measured at elevation 11.50 meters
above the Laguna de Bay datum set at 10.0 meters below the Mean Lower Low
Water (MLLW) and a shoreline of 220 kms. There are 21 tributaries that drain into
the lake; 35% of freshwater that drains comes from Pagsanjan River while 15%
comes from the Sta. Cruz River. The only outlet of the lake is the Napindan
Channel which at its confluence with the Marikina River forms the Pasig River.
This river meanders along 24-km long course westward through a major part of
Metropolitan Manila, before finally discharging into Manila Bay.
Laguna de Bay Region boundaries include six (6) provinces, 60 municipalities of
which 28 towns are lakeshore and 32 non-lakeshore towns. The lake is the single
most important resource of the Region. At present it is a source of industrial
cooling water, irrigation water, and hydroelectric power; a transport route for oil
products and the lakeshore dwellers; a source of snails for duck feed; a venue for
recreation and most notably a source of fish supply. Also, the lake serves as a
huge sink for waste coming from domestic sources (household and service
sectors); non-point sources (surface run-off from urban areas, crop lands and
forest lands); industries, livestock and poultry production, fishery activities and
Pasig River and Manggahan Floodway inflow. The latter is most alarming since
its pollution and sediment load will jeopardize the existing and potential uses of
the water body.
The hydrology of the lake has a natural stage regime which in the dry season
results in a minimum lake elevation of about 10.5 m controlled by mean level in
Manila Bay. At the end of the dry season, the lake level may drop below the level
of high tide in Manila Bay, resulting in the intrusion of seawater up the Pasig river.
With this diurnal reversal, the highly polluted waters of the Pasig river system are
carried into the lake. The tidal influx is also the primary cause of elevated salinity
in the lake during this part of the year (Francisco, 1985).
During the wet season, precipitation results in an annual mean high water
elevation of 12.5m and a peak elevation which may reach as high as 14.6m for a
100 year recurrence interval. During extremely wet years, widespread flood
damage occurs along the lakeshores because the land is relatively flat for several
kilometers inland in most areas. Also during this period, the Marikina river floods
the Pasig river and overflows into the Laguna de Bay via the Napindan Channel
because the Marikina river can generate flood flows of about 200 cms to 4000
cms, and because the Pasig river bank full channel capacity varies from as little
as 50 cms to only about 750 cms.

Cavite Integrated Water Resource Management Master Plan
4-19
Source: NAMRIA
Figure 4.1-11 Taal Lake
4.1.7.2 Taal Lake
Taal Lake is a freshwater lake located in
the province of Batangas and right at the
border of Cavite Province. Lake Taal lies
less than 18 km southwest of Laguna de
Bay and around 9 km northeast of
Balayan Bay off the coast of Batangas.
The fresh water lake is located within a
complex volcanic caldera, one of the
great volcano-tectonic depressions of
the world. Its altitude is only 2.5m and its
surface measures 234.2 sq.km. It is the
deepest lake in the Philippines with a
depth of 172m.About 37 tributaries drain
into the lake and its only outlet is Pansipit
River which leaves the lake in its southwest corner and travels about 10 km and
drains into Balayan Bay. Taal Lake is the third largest lake in the Philippines after
Laguna de Bay and Lake Lanao.
There is a small volcanic island in the middle of the lake which has been the site
of almost all the historic volcanic activity and responsible for the lake's sulfuric
content. The Taal Volcano itself has a lake of its own inside its crater called
"Crater Lake". Taal Lake is situated in a highly populated and rapidly growing
agricultural and industrial region. A high ridge, part of the crater wall, rises to
640m above sea level to the northwest of the lake, upon which is located the
chief town in the catchment area, Tagaytay City. To the south and east, the land
is more gently sloping.
The catchment area is largely deforested and given over to agriculture. Coconut
cultivation is important, with additional crops such as coffee, cocoa and cassava
grown underneath the coconut trees. Other areas are dominated by grassland
and there is some livestock raising.
The physical dimensions of the lake are given as follows;
Surface Area 234.2 km²
Surface Elevation 5.0 m
Maximum depth 172 m
Mean depth 100 m
Water Level Fluctuation 2.0 m
Length of Shoreline 82.5 km
Catchment Area 380 km²

Cavite Integrated Water Resource Management Master Plan
4-20
4.1.8 Summary and Conclusions : Surface Water Assessment
River Flow
Flow duration curves for the gauged and selected ungauged rivers in Cavite were
analysed. A comparison of the flow duration values across the selected rivers,
considering riparian flow requirement based on NWRB guidelines, shows that
Maragondon has the highest significant sustainable flow. Based on available flow
data, the flows in Maragondon River during the critical months at selected
dependability levels are as follows:
Table 4.1-17 Flow Duration of Maragondon River at Critical Months, cms
Probability of Exceedance, %
Jan Feb Mar Apr May
99 0.53 0.48 0.47 0.50 0.59
95 0.59 0.50 0.49 0.59 0.62
90 0.62 0.59 0.58 0.65 0.74
80 0.86 0.83 0.71 0.74 0.77
50 1.69 1.24 1.02 0.91 1.13
From the estimated flow duration curve, Maragondon River has the best potential
as possible source of water supply in the province. Besides having a much
greater drainage area as compared to others, its source in the headwaters of
Magallanes and partly from Alfonso are generally forested and uninhabited.
Water Quality
In terms of quality, Maragondon River recieves contaminant effluents from large
tracts of agricultural production areas. It suffers from quality issues characterized
by its exceeding the limits for : (i) BOD5 and Total suspended solids (132-153.5
mg/l); (ii) allowable Total Coliform; and (iii) Fecal coliform, Phosphate, Dieldrin,
Heptachlor and Toxaphene.
While Maragondon River, has the largest sustainable yield, using it as a main
souce of water supply will present some challenges in terms of water treatment.
4.2 GROUNDWATER ASSESSMENT
4.2.1 Groundwater Resources Inventory
Groundwater assessment was informed by : (i)well inventory covering information
on well depth, elevation, diameter of casings and screens, test pumping, and
water quality test results; (ii)geologic maps that give information on the geologic
units present in the province; (iii)driller‘s logs from existing wells containing useful
information on well depth, yield, and water quality; and (iv) previous studies for
municipal, barangays, residential subdivision, industrial and commercial water
supply development projects.

Cavite Integrated Water Resource Management Master Plan
4-21
The above documents served as sources of background information on
hydrogeological conditions and the assessment of groundwater potential. Aside
from these documents, raw data from well drilling contractors, private well
owners, as well as from the Philippine Groundwater Data Bank (PGDB) of the
Local Water Utilities Administration (LWUA) and the National Water Information
Network (NWIN) of the National Water Resources Board (NWRB) were collected.
Well Inventory
Records of wells were obtained from the LWUA Groundwater Data Bank,
National Water Resources Board, WATCON, Inc., local water districts, and well
drilling contractors. Available information on well owner, location, depth, casing
diameter, capacity, strata logs, test pumping results, and water quality are
presented in the Annexes to the Report.
Collected data from the NWRB that include records of 308 wells are presented in
Annex II-23. Well information includes location, depth, diameter of casings and
screens, and static and pumping water levels. Also obtained from the NWRB are
recent water quality test results of 308 wells and water level measurements of
155 wells.
A summary of well data collected from the LWUA Groundwater Data Bank is
presented in Annex II-24. There are 1,174 records of wells in the province.
However, except for the location of the well, most of the records, particularly
those on strata logs, test pumping results, and water quality test results, are
incomplete.
The Dasmariñas Water District operates and maintains the most number of wells
with complete records. As of August 2009, the water district has 100 operational
wells. Production from these wells ranges from 0.356 – 3.040 MLD (4.12 – 35.18
lps) for a total production of about 77.343 MLD.A summary of information
obtained from the Water Safety Plan of the Dasmariñas Water District is
presented in Annex II-25.
Data obtained from the SWECO4 report shows that a total of 642 wells were
inventoried during the study. Most of the wells were constructed by the then
Bureau of Public Works. These wells were test pumped with very low discharge
because the wells were commonly provided with very small casings as they were
intended for Level I barangay water supply sources only. Annex II-26 shows the
well data summary from the SWECO report.
The data provided by WATCON, Inc5. includes geo-resistivity survey results in 84
sites, distributed all over the province. The surveys were made for local water
4Water Resources Assessment and Development Plan for Sustainable Utilization of Water Resources in Nine (9) Local Government Units in Cavite Province, Philippines. SWECO International/WATCON, Inc. – United Nations Office for Project Services (UNOPS), 2004. 5Groundwater Resources Investigation and Geo-resistivity Survey for Various Projects. WATCON, Inc. 1991 – 2011

Cavite Integrated Water Resource Management Master Plan
4-22
districts and residential and industrial developments to determine the presence,
thickness and depth of potential aquifer layer/s. Also included in the reports are
information on 465 wells, mostly gathered from well drilling contractors. No geo-
resistivity surveys were carried out in the Municipalities of Maragondon, Mendez,
Noveleta and Rosario. A summary of the data is presented in Annex II-27.
Available information shows that the Municipality of Maragondon has the least
number of information, which is limited to four(4) wells with only one (1) well
having lithologic logs and test pumping records. The Municipality of Dasmariñas
on the other hand, has the most number of well records. It must be mentioned
however that except for the records obtained from well drilling contractors, the
records are usually not complete for most of the wells particularly those on test
pumping and water quality test results.
Annex II-20 presents information on selected wells distributed within the
province. The selection of these wells was primarily based on the completeness
of records that can be used in the preparation of various thematic maps to
include specific capacity and transmissivity maps, and lithologic cross sections.
Test pumping records served as basis for the evaluation and assessment of
available groundwater in each of the municipalities and cities. Also, the selected
wells are representative of wells drilled at the coastal, flood plain, hilly and
elevated areas of the province. Figure 4.2-1 shows the location of these wells.
Figure 4.2-1 Selected Deepwell Location

Cavite Integrated Water Resource Management Master Plan
4-23
The results of well inventory reflected the trend of urban and industrial
developments, which began as early as the 1970‘s. The main centers of
groundwater pumping at present are Dasmariñas City, Trece Martires, Gen.
Trias, Bacoor, Carmona, Imus, Tanza, and Silang. These areas have the biggest
number of groundwater permits granted as of December 2011. Records from the
NWRB show that there were no groundwater permits granted in the Municipality
of Gen. Emilio Aguinaldo and the Municipality of Indang. Level III water supply
systems in these towns rely on spring sources.
Spring Inventory
There are numerous springs and seepages in the province, most of which are
very low yielding. The bigger yielding springs are being utilized by the various
water districts and barangay waterworks systems as water supply sources. Some
of the productive springs are described as follows:
Amadeo Springs
Banga Spring Located at elevation 372 masml at the boundary of Minantok Kanluran and Minantok Silangan. This spring is provided with a spring box and is being utilized by Barangay MinantokSilangan residents as domestic water supply source.
Banio Spring Located in Barangay Minantok Silangan at elevation 370 mamsl at a ravine close to the Halang River. This spring is provided with a spring box and is being utilized by Barangay Banaybanay residents as a Level III water supply source.
Balite 1 and 2
Springs
These springs, also called Halang Falls, are located in Barangay Halang at elevations 278 and 300 mamsl, respectively. Discharge of Balite Spring measured in December 2003 was 0.527 MLD (6.1 lps) while discharge of Balite 2 Spring measured in May 1994 was 3.672 MLD (42.5 lps).
Bukal Spring Located in Barangay Halang at elevation 329 mamsl. This spring is provided with a spring box and is being utilized by Barangay Halang residents as a Level III water supply source.
Indang Springs
Ikloy Spring Located in Barangay Kayquit 2 at elevation 279 mamsl. It is the main water supply source of the Indang Water District. The spring discharge measured in 1994 was 18.058 MLD (209 lps) during the wet season and 15.638 MLD (181 lps) during the dry season.
Ulo Spring Located in Barangay Alulod at elevation 261 mamsl. With discharge of about 0.605 MLD (7 lps), this spring is being utilized by the Barangay Alulod Water Supply System.
Siloy Spring Located in Barangay Carasuchi in Indang at elevation 410 mamsl. The discharge measured in 1994 was 5.918 MLD (68.5 lps) during the wet season and 3.344 MLD (38.7 lps) during the dry season. This spring is being utilized as a Level III water supply source.
Saluysoy Spring Located in Barangay GuyamMalaki at the boundary with Alfonso. In December 2003, the spring discharge was measured at about 0.864 MLD (10 lps). It is being used as a barangay Level III water supply system.
Makabag Spring Llocated in Lumampong Balagbagat elevation 310 mamsl. In December 2003, the spring discharge was measured at about 1.037 MLD (12 lps). It is being used as a barangay Level III water supply system.
Bulbok Spring Located in Barangay Lumampong Balagbag at elevation 310 mamsl. In

Cavite Integrated Water Resource Management Master Plan
4-24
December 2003, the spring discharge was measured at about 1.037 MLD (12 lps). It is being used as a barangay Level III water supply system source.
Sibol Spring Located in Barangay Pulo at elevation 318 mamsl. It is provided with a spring box and is being utilized as a Level III water supply source by the barangay residents.
Madilim Spring Located at Villa Verde Resort in Barangay Pulo at elevation 315 mamsl. It is provided with a spring box and is being utilized as a Level III water supply source by Barangay Tambo Malaki and Barangay Tambo Ilaya residents. Discharge measured during the wet season in 1994 was 3.871 MLD (44.8 lps) and 0.259 MLD (3.0 lps) during the dry season of the same year.
Makawayan
Spring
Located in Barangay Tambo Kulit at elevation 318 mamsl. It is provided with a spring box and is being utilized as a Level III water supply source by Barangay Tambo Kulit residents.
Ipie 1 and Ipie 2
Springs
Located in Barangay Kayquit 2 in a ravine approximately 50 meters apart. Ipie 1 Spring is provided with a spring box and is being utilized by Barangay Banaba Cerca residents. Ipie 1 Spring flow was measured in 1994 at 6.048 MLD (70 lps) and 5.011 MLD (58 lps) during the wet and dry seasons, respectively.
Makanda Spring Located in Barangay Kaytapos at elevation 285 mamsl. It is provided with a spring box and is being utilized as a Level III water supply source by Barangays Agus-os, Bancod and CalumpangCerca residents.
Niyog Spring Located at a ravine in Barangay Buna Cerca at elevation 313 mamsl. It is provided with a spring box and is being utilized as a Level III water supply source by Barangay Buna Cerca residents.
Mendez-Nunez Spring
Ulo Spring This spring is located at elevation 446 mamsl in Barangay Punongyan 2. This spring is provided with a spring box and it used to be the water supply source of the Mendez Water District. It was abandoned by the water district due tohigh cost of pumping to its service areas. Flow measured in December 2003 was 0.349 MLD (4.5 lps).
Silang
Lucsuhin Spring Located in Barangay Lucsuhin at elevation 329 masml. This spring is provided with a spring box and is being utilized by the Silang Water District as a water supply source. This spring has varying flows of 1.037 MLD – 1.728 MLD (12 – 20 lps).
Batas Spring Located in Barangay Batas at elevation 268 mamsl. This spring is provided with a spring box and is being utilized by the Silang Water District as a water supply source.
Cabangaan
Spring
Located in Barangay Cabangaan in a ravine close to a river. It is provided with a spring box and serves as a Level III water supply source of Barangay Cabangaan residents. Overflow measured in November 2003 was 0.173 MLD (2 lps).
Tagaytay City
Kaybubutong
Spring
Located in Barangay Sambong at elevation 395 mamsl, on the western side of the Tagaytay Ridge. It is the main water supply source of the Tagaytay City Water District. In 1994, discharge during the wet season was measured at 15.293 MLD (177 lps) while discharge of 14.550 MLD (168.4 lps) was measured during the dry season. Discharge of 11.232 MLD (130 lps) was measured in June 2004.
MatangTubig
Spring
Located in Sitio Matang Tubig in Barangay San Francisco at elevation 395 mamsl. It is one of the oldest sources of the Tagaytay City Water District. Spring discharge measured during the wet season in 1994 was 2.272 MLD (26.3 lps) and 0.705 MLD (8.16 lps) during the dry season of the same year.

Cavite Integrated Water Resource Management Master Plan
4-25
Pulong Usiw
Spring
Located in Iruhin Central at elevation 545 mamsl. This spring is provided with a spring box and is being utilized by the Tagaytay City Water District as a water supply source. Spring flow measured in 1994 was 0.014 MLD (0.16 lps).
Kaybubutong
Spring 2
Located in Barangay Sambong at elevation 410 mamsl about 400 meters east of Kaybubutong Spring. The Tagaytay City Water District has plans to utilize this spring as an additional water supply source.
Trece Martires
Agtas Spring Located in Barangay Cabuco near the boundary with Barangay Aguado at elevation 95 mamsl. Discharge measured in November 2003 was about 0.864 MLD (10 lps). It is being utilized as a Level I water supply source for Barangay Aguado residents.
Water Quality
Recent water quality test results were obtained from the NWRB records covering
13 municipalities and two (2) cities of the province while WATCON, Inc.‘s records
from year 1991 to year 2011 covered 12 municipalities and two (2) cities.
The analysis of the physical properties such as color, turbidity, and odor generally
indicated no impurities that would be offensive to taste and smell were present in
most of the water samples from the whole province. High turbidity and color from
the samples collected in Gen. Aguinaldo, Dasmariñas, Gen. Mariano Alvarez,
Alfonso and Silang could be attributed to well design and construction, failure to
include screens or place well intakes opposite clayey and silty layers, incomplete
well development, and surface contaminants entering the granular space
between the casing and the borehole.
PARAMETER DETAILS
pH Value The pH value, which is the expression for the concentration of hydrogen ion ranged from 6.1 – 8.5. The pH value of 7 indicates neutral water while a pH value less than 7 indicates acidic water. Groundwater with very low pH value reacts to iron, and concrete and thereby causes corrosion problems. The PNSDW’s permissible limit for pH is 6.5 – 8.5, which is based on aesthetic consideration only.
Total Dissolved Solids (TDS)
TDS varied from 26 – 3,296 mg/l. It represents the amount of elements in the water, which is mainly salt. TDS in groundwater originate from natural sources, sewage, urban runoff, and industrial wastewater. High values of 580 – 3,296 mg/l were obtained in Cavite City and Noveleta, which are located near the coastline. The PNSDW’s permissible limit is 500 mg/l.
Chloride Chloride varied from 1.48 – 1,204.00 mg/l. Again, high concentrations of chloride of 383 – 1,204 mg/l could be observed in Cavite City. Chloride in groundwater originates from natural source, sewage, industrial effluents, urban runoff, and seawater intrusion. The PNSDW’s permissible limit is 250 mg/l.
Sodium Sodium from the NWRB’s records varied from 1.96 – 216.35 mg/l. It is usually associated with chloride and it has the same source as chloride. High sodium content was observed from one (1) sample in Noveleta. The PNSDW’s permissible limit is 200 mg/l.
Hardness Hardness varied from 15 – 594 mg/l. Hardness is due to the presence of naturally- occurring divalent cations, such as calcium, magnesium, and strontium

Cavite Integrated Water Resource Management Master Plan
4-26
PARAMETER DETAILS
resulting from the contact of acidic groundwater with limestone and dolomite. Again, a high hardness is observed in areas near the coastline, particularly in Cavite City. The PNSDW’s permissible limit is 300 mg/l as CaCO3. Hardness beyond the permissible limit maybe acceptable in certain areas.
Calcium Calcium varied from 5 – 174 mg/l. Hardness is due to the presence of naturally occurring divalent cations, such as calcium, magnesium and strontium resulting from contact of acidic groundwater with limestone and dolomite. Again high hardness was observed in areas near the coastline. The PNSDW’s permissible limit is 300 mg/l as CaCO3.Hardness beyond the permissible limit may also be acceptable in certain areas.
Iron Iron varied from 0.05 – 9.02 mg/l. It is found in natural freshwater and may be present in drinking water as a result of the use of iron coagulants or the corrosion of steel and cast iron pipes during distribution. High concentration of iron will color laundry and give an ink-like taste. The PNSDW’s permissible limit is 1.0 mg/l.
Magnesium Magnesium varied from 1 – 50 mg/l. It is naturally-occurring but usually in very small concentrations. High manganese content will yield a blackish color upon oxidation or contact with air.
Manganese Manganese varied from 0.05 – 0.61 mg/l. It is naturally-occurring but usually in very small concentrations. High manganese content will give blackish color upon oxidation or contact with air.
Nitrate Nitrate varied from 0.05 – 0.15 mg/l. The nitrate concentration in groundwater can reach high levels as a result of leaching or run-off from agricultural land or contamination from human or animal wastes. The PNSDW’s permissible limit is 50 mg/l.
Flouride Flouride varied from 0.04 – 0.67 mg/l. The PNSDW’s permissible limit is 1.0 mg/l.
Aluminum Aluminum varied from 0.004 – 0.157 mg/l. The PNSDW’s permissible limit is 0.2 mg/l. Aluminum sulfate is used in water treatment as a coagulant.
Lead Lead varied from 0.006 – 0.01 mg/l. The PNSDW’s permissible limit is 0.01 mg/l. Lead may be present in water primarily from plumbing systems containing lead pipes, solder fittings. It is rarely present in water supply as a result of dissolution from natural sources.
Chromium Chromium from a water sample collected in Carmona was 0.001 mg/l. The PNSDW’s permissible limit is 0.05 mg/l. It is widely distributed in the earth’s crust and commonly occurs in wastewater in certain industries as chromium plating.
Due to relative uniformity of the hydro-geologic environment and similar
residency time of groundwater in the same pyroclastic rocks, the quality of
groundwater in the province is almost the same except from those wells drilled
near the coastline. Higher TDS, magnesium, chloride, hardness in Cavite City
could be attributed to saline water intrusion. Decline of piezometric water level
below mean sea level due to pumping in this area resulted to inland movement of
seawater.
4.2.2 Results of Geo-resistivity Survey
A geo-resistivity survey is a non-intrusive method of groundwater resources
investigation which is based on measuring the electrical resistance properties of
underground rocks layers. The presence of water and the amount of dissolved

Cavite Integrated Water Resource Management Master Plan
4-27
solids are the principal controls on the flow of electric current. The resistivity
decreases as porosity, hydraulic conductivity, water content, and water salinity
increase. Lesser resistance indicates the rocks‘ lower ability to transport water
and less chances of finding productive aquifer. Electrical resistivity values of 30 -
200 ohm-meter are normally associated with increasing ability of underground
layers to transmit water. The points with these values are normally selected as
sites for drilling of wells.
From the geo-resistivity surveys carried out in 84 sites in the province, a total of
15 Vertical Electrical Sounding (VES) points were selected to be able to
represent the electrostratigraphic sections near the coastline, at the low lying
areas, the central hilly areas, and the elevated areas of the province. Annex II-
21 presents the summary of the geo-resistivity data while Figure 4.2-2 shows the
location of the selected VES stations. Medium to high resistivity values indicate
predominance of coarse-grained materials, while very low resistivity values
indicate presence of very fine-grained materials, which are considered as very
poor aquifer owing to their very low permeability. This also refers to formations
saturated with brackish to saline water.
Figure 4.2-2 VES Location
Electrostratigraphic Section A – A’, which represents the coastal areas, shows
the potential aquifer layer located at 80 – 100 meters below mean sea level with
a thickness of about 100 meters (Figure 4.2-3). The potential aquifer section
consists of intercalation of tuff, tuffaceous sandstone, clay, and silt. A very low

Cavite Integrated Water Resource Management Master Plan
4-28
resistivity value of 0.8 ohm-meter determined at the Fort San Felipe in Cavite City
indicates formations saturated with saline water.
Figure 4.2-3 Electrostratigraphic Section A-A’
Electrostratigraphic Section B – B’, which represents the low lying areas of the
province, shows the potential aquifer layer located near the surface down to
about 100 meters below mean sea level. Resistivity values of 22.7 – 24.0 ohm-
meter correspond to intercalation and/or mixture of sand, gravel, clay, silt, and
tuffaceous sandstone with predominance of fine-grained materials. This is the
section being tapped into by the productive wells in Naic, Tanza, and Bacoor.
Electrostratigraphic Section C – C’ represents the central and hilly areas of the
province and shows better potential in terms of resistivity values. The blue color,
that shows resistivity values of 78.0 – 100 ohm-meter, corresponds to tuff and
tuffaceous sandstone intercalated with lenses or thin layers of clay/shale. This is
the section being tapped into by the productive wells in Indang, Silang, and
Carmona.
Electrostratigraphic Section D – D’ represents the upland areas of the province
and shows medium to high resistivity values. These correspond to tuff and
tuffaceous sandstone intercalated with lenses or thin layers of clay/shale. These
sections are the aquifer layers being tapped by the productive wells in Alfonso
and Tagaytay City. Lower well yields in these areas are not due to geologic
composition but due to other hydrogeologic consideration, depth of burial,
available recharge, etc.

Cavite Integrated Water Resource Management Master Plan
4-29
It must be mentioned however that the interpretation of the geo-resistivity survey
results must be correlated with the geology of the area and with the lithologic and
test pumping results of existing wells. For instance, geo-resistivity survey results
in Tagaytay City and in Imus cannot be compared. The aquifer layers in Tagaytay
are located at greater depths due to its higher elevation and it is more compacted
due to its deeper burial. A geo-resistivity survey needs to be done particularly in
areas where available data is limited.
4.2.3 Water Balance
Meteoric or atmospheric water in the form of rainfall represents by far the
greatest source for replenishing surface and subsurface waters. It is therefore
important to assess monthly, yearly, and long term rainfall variations; the total
rainfall available; as well as its dependency on the geographic and topographic
features of the catchment areas. Almost all groundwater, including surface and
meteoric water are considered as part of the hydrologic cycle. Hence, rainfall
data are important input for evaluating groundwater recharge and recoverable
groundwater. Evaporation and transpiration represent the loss of water in the
catchment area.
The water balance components: evaporation, effective rainfall, runoff, and
recharge to the groundwater system were computed using the ARMA Hydrologic
Model. The average monthly rainfall records obtained from the Philippine
Athmospheric, Geophysical and Astronomical Administration‘s (PAGASA)
stations in Ambulong, Nasugbu, Amadeo, Sangley, Bacoor were used. Records
from the Tagaytay station were not utilized due to its shorter period of monitoring
and records were believed to be less reliable.
Under natural conditions, groundwater reservoirs in Cavite are recharged
perennially by precipitation on the outcrop covering the whole province from
Tagaytay City to the south to Cavite City to the north. Local recharge may also
occur as seepages from streams and rivers during periods of high flows but this
is a minor contributory factor as it is groundwater that provides stream flows most
of the time.
ARMA Model
The ARMA model was developed to provide values of monthly runoff and
groundwater recharge from which the groundwater resources potential of a given
area can be evaluated.
Monthly rainfall and temperature of the model area were calculated by
transporting the average rainfall of the Nasugbu, Ambulong, Amadeo, and
Sangley Stations. These measuring stations are located in the same climatic
zone. Annex II-19 presents the rainfall and temperature from the different
climatological stations.

Cavite Integrated Water Resource Management Master Plan
4-30
Because of the differences in topographic characteristics of the Province of
Cavite, the province was divided in three (3) sub-areas. Figure 4.2-4 shows the
sub-division of the three (3) model areas.
Figure 4.2-4 ARMA Model Area
In determining the effective rainfall and runoff components, the runoff coefficient
was assumed according to vegetative cover, type of soils, slope, and land use.
Slope, land use, geology, and soil maps presented in Figure 2.1-6 – 2.1-8 in
Chapter 2 were used for the determination of the runoff coefficients. The runoff
coefficients varied according to the type of vegetative cover, type of soil, and
slope.
Effective Rainfall, Direct Runoff and Groundwater Recharge
Figures 4.2-5 – 4.2-7 present the water balance components in Areas 1 – 3. Also
presented in the figures are the tables on mean annual rainfall, mean areal
temperature, evapotranspiration, effective rainfall, direct runoff, recharge to the
groundwater system, and generated discharge.
As shown in Figure 4.2-5, which covers Area 1, the effective annual rainfall of
1,280 mm is about 48% of the annual rainfall; while direct runoff of 1,176 mmis
44% of the annual rainfall. The negative effective rainfall values of -33 mm to -
113 mm from December to April indicate soil moisture deficit during these months
which needs to be satisfied before direct runoff and recharge can take place.
However, considering that there are still irrigated farmlands, water imported from
surface water sources will reduce soil moisture deficit and promote recharge
provided that the piezometric level of the water table aquifer is not close to the
ground surface.
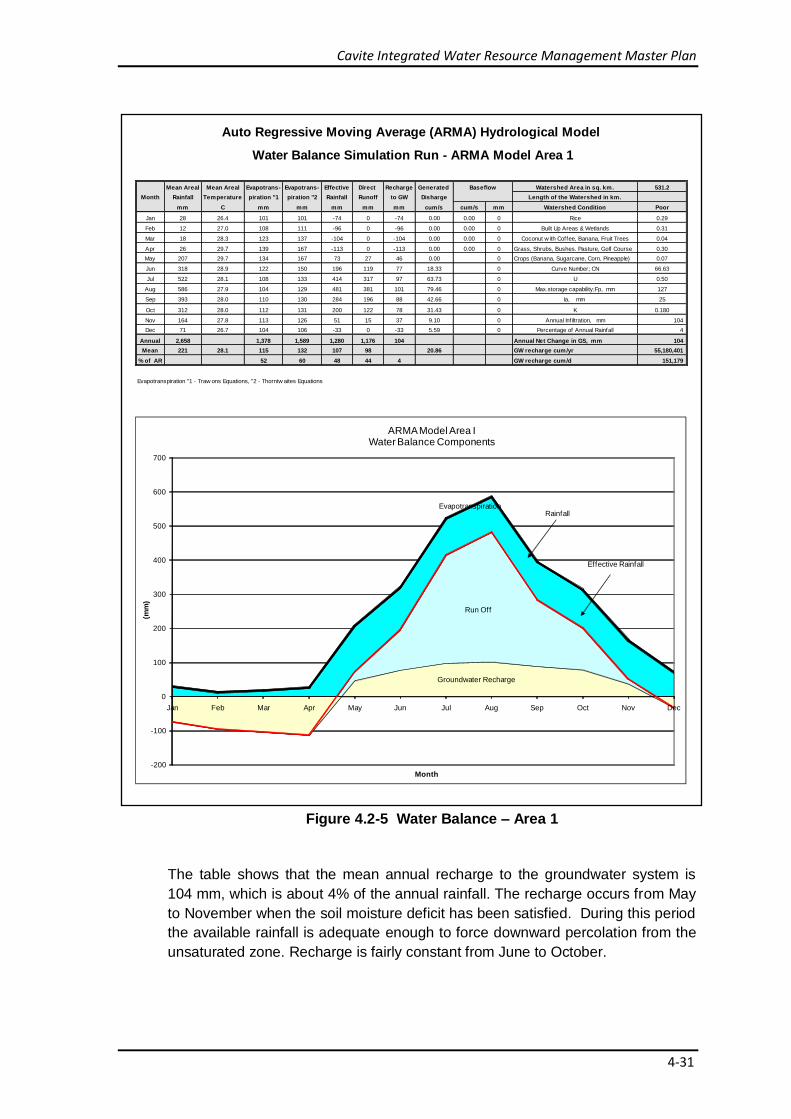
Cavite Integrated Water Resource Management Master Plan
4-31
Figure 4.2-5 Water Balance – Area 1
The table shows that the mean annual recharge to the groundwater system is
104 mm, which is about 4% of the annual rainfall. The recharge occurs from May
to November when the soil moisture deficit has been satisfied. During this period
the available rainfall is adequate enough to force downward percolation from the
unsaturated zone. Recharge is fairly constant from June to October.
Input Values
Mean Areal Mean Areal Evapotrans- Evapotrans- Effective Direct Recharge Generated Baseflow Watershed Area in sq. km. 531.2
Month Rainfall Temperature piration "1 piration "2 Rainfall Runoff to GW Disharge Length of the Watershed in km.
mm C mm mm mm mm mm cum/s cum/s mm Watershed Condition Poor
Jan 28 26.4 101 101 -74 0 -74 0.00 0.00 0 Rice 0.29
Feb 12 27.0 108 111 -96 0 -96 0.00 0.00 0 Built Up Areas & Wetlands 0.31
Mar 18 28.3 123 137 -104 0 -104 0.00 0.00 0 Coconut w ith Coffee, Banana, Fruit Trees 0.04
Apr 26 29.7 139 167 -113 0 -113 0.00 0.00 0 Grass, Shrubs, Bushes. Pasture, Golf Course 0.30
May 207 29.7 134 167 73 27 46 0.00 0 Crops (Banana, Sugarcane, Corn, Pineapple) 0.07
Jun 318 28.9 122 150 196 119 77 18.33 0 Curve Number; CN 66.63
Jul 522 28.1 108 133 414 317 97 63.73 0 U 0.50
Aug 586 27.9 104 129 481 381 101 79.46 0 Max.storage capability;Fp, mm 127 Watershed Condition
Sep 393 28.0 110 130 284 196 88 42.66 0 Ia, mm 25 Poor
Oct 312 28.0 112 131 200 122 78 31.43 0 K 0.180
Nov 164 27.8 113 126 51 15 37 9.10 0 Annual Infiltration, mm 104
Dec 71 26.7 104 106 -33 0 -33 5.59 0 Percentage of Annual Rainfall 4
Annual 2,658 1,378 1,589 1,280 1,176 104 Annual Net Change in GS, mm 104
Mean 221 28.1 115 132 107 98 20.86 GW recharge cum/yr 55,180,401
% of AR 52 60 48 44 4 GW recharge cum/d 151,179
Evapotranspiration "1 - Traw ons Equations, "2 - Thorntw aites Equations
Auto Regressive Moving Average (ARMA) Hydrological Model
Water Balance Simulation Run - ARMA Model Area 1
-200
-100
0
100
200
300
400
500
600
700
Jan Feb Mar Apr May Jun Jul Aug Sep Oct Nov Dec
(mm
)
Month
ARMA Model Area IWater Balance Components
Groundwater Recharge
Run Off
RainfallEvapotranspiration
Effective Rainfall
Figure 6.9 Water Balance - Area 1

Cavite Integrated Water Resource Management Master Plan
4-32
As presented in Figure 4.2-6 the effective annual rainfall in Area 2 of about 2,086
mm is 61% of the annual rainfall; while direct runoff of 1,870 mm is 55% of the
annual rainfall. The negative effective rainfall of – 15 mm to – 104 mm from
December to April is to be satisfied before direct runoff and recharge could take
place. Located at the central portion of the province and at higher elevation, Area
2 has no irrigated farmlands. Vegetative cover consists of fruit bearing trees and
the piezometric level in this area is deeper when compared to Area1.
Figure 4.2-6 Water Balance – Area 2
Input Values
Mean Areal Mean Areal Evapotrans- Evapotrans- Effective Direct Recharge Generated Baseflow Watershed Area in sq. km. 412.9
Month Rainfall Temperature piration "1 piration "2 Rainfall Runoff to GW Disharge Length of the Watershed in km.
mm C mm mm mm mm mm cum/s cum/s mm Watershed Condition Fair
Jan 43 25.6 98 91 -55 0 -55 0.00 0.00 0 Rice 0.03
Feb 16 26.2 106 100 -89 0 -89 0.00 0.00 0 Built Up Areas 0.22
Mar 27 27.4 121 121 -95 0 -95 0.00 0.00 0 Coconut w ith Coffee, Banana, Fruit Trees 0.47
Apr 35 28.7 139 145 -104 0 -104 0.00 0.00 0 Grass, Shrubs, Bushes. Pasture, Golf Course 0.13
May 272 28.7 132 145 140 77 64 6.53 0 Crops (Banana, Sugarcane, Corn, Pineapple) 0.15
Jun 411 28.0 119 132 293 209 83 29.73 0 Curve Number; CN 68.56
Jul 666 27.2 102 117 564 467 97 74.13 0 U 0.46
Aug 743 27.0 98 114 644 546 99 88.35 0 Max.storage capability;Fp, mm 116 Watershed Condition
Sep 484 27.1 106 116 378 289 89 48.25 0 Ia, mm 23 Fair
Oct 418 27.1 108 116 310 226 85 41.18 0 K 0.180
Nov 224 26.9 109 112 114 57 58 14.18 0 Annual Infiltration, mm 215
Dec 85 25.8 100 95 -15 0 -15 5.35 0 Percentage of Annual Rainfall 6
Annual 3,424 1,339 1,403 2,085 1,870 215 Annual Net Change in GS, mm 215
Mean 285 27.2 112 117 174 156 25.64 GW recharge cum/yr 88,601,478
% of AR 39 41 61 55 6 GW recharge cum/d 242,744
Evapotranspiration "1 - Traw ons Equations, "2 - Thorntw aites Equations
Auto Regressive Moving Average (ARMA) Hydrological Model
Water Balance Simulation Run - ARMA Model Area 2
-200
-100
0
100
200
300
400
500
600
700
800
Jan Feb Mar Apr May Jun Jul Aug Sep Oct Nov Dec
(mm
)
Month
ARMA Model Area 2Water Balance Components
Groundwater Recharge
Run Off
RainfallEvapotranspiration
Effective
Figure 6.10 Water Balance - Area 2

Cavite Integrated Water Resource Management Master Plan
4-33
Water balance components for Area 3 are shown in Figure 4.2-7. The effective
annual rainfall of 2,480 mm is 69% of the annual rainfall; while direct runoff
of2,025 mm is 56% of the annual rainfall. Negative effective rainfall of – 14 mm to
– 87 mm from December to April corresponds to the soil moisture deficit during
these months. The mean annual recharge to the groundwater system is 455 mm
which is 13% of the annual rainfall. Recharge occurs from May to November
when the soil moisture deficit has been satisfied. During this period the available
rainfall is adequate enough to force downward percolation from the unsaturated
zone.
Figure 4.2-7 Water Balance – Area 3
Input Values
Mean Areal Mean Areal Evapotrans- Evapotrans- Effective Direct Recharge Generated Baseflow Watershed Area in sq. km. 240.4
Month Rainfall Temperature piration "1 piration "2 Rainfall Runoff to GW Disharge Length of the Watershed in km.
mm C mm mm mm mm mm cum/s cum/s mm Watershed Condition Poor
Jan 66 24.1 80 78 -14 0 -14 0.30 0.30 3 Rice 0.29
Feb 14 24.7 88 85 -75 0 -75 0.03 0.03 0 Built Up Areas & Wetlands 0.18
Mar 32 25.9 103 100 -71 0 -71 0.00 0.00 0 Coconut w ith Coffee, Banana, Fruit Trees 0.46
Apr 30 27.0 117 115 -87 0 -87 0.00 0.00 0 Grass, Shrubs, Bushes. Pasture, Golf Course 0.02
May 300 27.0 110 115 189 104 85 7.47 0 Crops (Banana, Sugarcane, Corn, Pineapple) 0.04
Jun 444 26.4 99 107 345 237 107 21.06 0 Curve Number; CN 62.00
Jul 696 25.6 84 96 612 488 124 46.76 0 U 0.61
Aug 792 25.4 80 94 713 585 128 56.80 0 Max.storage capability;Fp, mm 156 Watershed Condition
Sep 451 25.6 89 96 361 252 109 26.28 0 Ia, mm 31 Poor
Oct 479 25.5 88 95 391 280 111 30.59 0 K 0.180
Nov 247 25.3 90 92 157 79 78 11.79 0 Annual Infiltration, mm 455
Dec 42 24.3 83 80 -41 0 -41 4.50 0 Percentage of Annual Rainfall 13
Annual 3,593 1,112 1,154 2,480 2,025 455 Annual Net Change in GS, mm 455
Mean 299 25.6 93 96 207 169 17.13 GW recharge cum/yr 109,413,478
% of AR 31 32 69 56 13 GW recharge cum/d 299,763
Evapotranspiration "1 - Traw ons Equations, "2 - Thorntw aites Equations
Auto Regressive Moving Average (ARMA) Hydrological Model
Water Balance Simulation Run - ARMA Model Area 3
-200
-100
0
100
200
300
400
500
600
700
800
Jan Feb Mar Apr May Jun Jul Aug Sep Oct Nov Dec
(mm
)
Month
ARMA Model Area 3Water Balance Components
Groundwater Recharge
Run Off
RainfallEvapotranspiration
Effective

Cavite Integrated Water Resource Management Master Plan
4-34
Groundwater Resource Potential
Based on the water balance analysis, the total groundwater replenishment for the
whole Province of Cavite is estimated at 298.48 million cum per year or an
average of 817.755 MLD. The total recoverable groundwater is 208.94 million
cum per year or 572.429 MLD. Table 4.2-1 presents the recharge and
recoverable groundwater for each of the towns and cities in the province.
Table 4.2-1 Recharge and Recoverable Groundwater per City/Municipality
City/ Municipality Model Area Area
sq. km Recharge
MLD Recharge
lps Recoverable
MLD Recoverable
lps
Alfonso 3 64.6 81.060 938 56.742 657
Amadeo 2,3 47.9 44.094 510 30.866 357
Bacoor 1 25.0 7.329 85 5.130 59
Carmona 1,2 40.2 17.677 205 12.374 143
Cavite City 1 11.8 3.459 40 2.421 28
Dasmariñas 1,2 90.1 39.619 459 27.734 321
Gen. Emilio Aguinaldo 2 51.1 29.960 347 20.972 243
Gen.Mariano Alvarez 1,2 11.4 5.013 58 3.509 41
Gen. Trias 1,2 87.0 38.256 443 26.779 310
Imus 1 89.0 26.090 302 18.263 211
Indang 2,3 81.8 75.301 872 52.711 610
Kawit 1 13.4 3.928 45 2.750 32
Magallanes 2 78.6 46.083 533 32.258 373
Maragondon 1,2 139.8 61.474 712 43.032 498
Mendez 3 16.7 20.955 243 14.669 170
Naic 1,2 78.6 34.562 400 24.194 280
Noveleta 1 5.6 1.642 19 1.149 13
Rosario 1 3.6 1.055 12 0.739 9
Silang 2,3 141.7 130.442 1,510 91.309 1,057
Tagaytay City 3 74.0 92.855 1,075 64.998 752
Tanza 1 72.4 21.224 246 14.857 172
Ternate 1 43.5 12.752 148 8.926 103
TreceMartires City 2 39.1 22.924 265 16.047 186
Total 1,306.9 817.755 9,465 572.429 6,625
Source: Water Resources Assessment and Development Plan in Nine (9) LGUs in Cavite Province, SWECO-WATCON. 2004
Rainwater that infiltrates into the ground is discharged by drainage into the
various river systems, by pumping wells and by groundwater flow through the
water table and artesian aquifers into the Manila Bay or the Laguna de Bay.
The recoverable groundwater depends on the hydraulic properties of the aquifer
and the available drawdown in a given location. The wells have to be distributed
in such a way that minimal well to well interferences drawdown is developed and
yet be able to capture the greatest amount of recharge without running out of
available drawdown or causing unacceptable water quality. The present
distribution of wells in the province is causing over withdrawal in some
municipalities while at the same time groundwater is lost through unutilized flows
in some of the towns where groundwater withdrawal through wells is minimal.

Cavite Integrated Water Resource Management Master Plan
4-35
4.2.4 Aquifer and Characteristics
Composition and Extent
The geological map of Cavite as supplemented by the stratigraphic logs of
existing wells in the province provided a picture of the composition and extent of
the potential aquifer layers. However, the construction of accurate aquifer
geometry could not be made because of the generalized description of drill
cuttings and the differences in the description made by different drillers.
From the logs of the inventoried wells, 13 wells with strata logs were selected for
the presentation of the lithologic sections near the coastline, at the low lying
areas, the central hilly areas, and the elevated areas of the province. Figure 4.2-
8 shows the location of the selected wells, for which lithologic sectional analysis
were made.
In terms of groundwater availability, the blue color that represents permeable
sand and gravel has the highest potential for groundwater abstraction followed by
the green color that represents permeable tuffaceous sandstone and tuff. The red
color represents a semi-permeable mixture of sand, gravel, clay, and silt or very
fine-grained tuffaceous sandstone while the orange color represents
impermeable clay, silt, and shale.
Figure 4.2-8 Lithologic Section
Cavite Integrated Water Resource Management Master Plan
4-36
Lithologic Cross Section A – A’ represents wells drilled in the coastal areas,
showing intercalation of permeable and permeable sediments. The permeable
sections are generally located at shallow depths.
Lithologic Cross Section B – B’ represents wells drilled in the low lying areas
farther from the coastline, and shows intercalation of permeable and
impermeable materials with predominance of coarse-grained sediments.
Lithologic Cross Section C - C’ represents wells drilled in the hilly central area
of the province and shows intercalation of permeable and impermeable materials
with predominance of coarse-grained sediments.
Lithologic Cross Section D - D’ represents wells drilled in the upland area of
the province, shows intercalation of permeable and impermeable materials with
predominance of fine-grained materials at Well No. 83 in Barangay Guinhawa,
Tagatay City. Groundwater availability in the upland areas is not solely
dependent on the geologic composition of the underlying formations but on other
hydrogeologic considerations as well.
It is clear that no single extensive aquifer exists in the province. The aquifer
system consists of numerous aquifers, which, taken as a whole, function as one.
It is composed of interconnected aquifers intercalated with lenses or thin layers of
impermeable to semi-permeable materials.
The description of the penetrated strata indicates that the aquifers consist mainly
of tuff and tuffaceous sandstone, while the confining layers consist of clay and
clayey tuff. It should be mentioned that the depth of burial affects the permeability
of geological units and consequently aquifer. Permeability of the aquifer
decreases gradually with increasing depth of burial. Higher permeability at the
upper portion of the aquifer is due to a lesser degree of consolidation and
compaction and also being near the surface, a higher degree of weathering.
Water Level Conditions and Movement of Groundwater
Studies on water level conditions and groundwater movement made by the
National Water Resources Council and the NHRC in the early 1980‘s showed the
static water level and the general flow pattern of groundwater movement. Figure
4.2-9 shows flat to steep gradient reflecting the general topography of the area.
Water gradient at higher elevations, particularly in Tagaytay City was steeper and
it became flatter towards the lower reach near Manila Bay.

Cavite Integrated Water Resource Management Master Plan
4-37
Figure 4.2-9 Groundwater Level - 1980
A more detailed water level contours and groundwater flow direction was
prepared in 2004 by the SWECO International and WATCON, Inc. for the Water
Resources Assessment and Development Plan for Sustainable Utilization of
Water Resources in nine (9) Local Government Units in Cavite Province,
Philippines with the assistance of the United Nations Office for Project Services.
Figure 4.2-10 shows the contours of elevation of groundwater level and direction
of groundwater flow before 1990, prior to the start of intensive groundwater
withdrawals in some parts of the province. The direction of groundwater flow was
towards the northwest to Manila Bay and towards the northeast towards the
Laguna de Bay.

Cavite Integrated Water Resource Management Master Plan
4-38
Figure 4.2-10 Elevation of Groundwater Level before 1990
Figure 4.2-11 shows the contours of groundwater level elevation in 2003. It
shows that in Silang, Trece Martires, General Trias, General Mariano Alvarez,
and Carmona, groundwater contours were converging toward numerous centers
of withdrawals where water districts and residential and industrial developments
are located. In the northern part of General Trias, contours of elevation of
groundwater level were already at sea level. A further increase in groundwater
withdrawal in this area could cause a reversal of the hydraulic gradient from the
sea and consequently bring about saline water intrusion or the upconing of the
underlying saltwater edge into wells which are further inland.

Cavite Integrated Water Resource Management Master Plan
4-39
Figure 4.2-11 Elevation of Groundwater Level - 2003
Figure 4.2-12 shows the change in water level between 1990 and 2003. In areas
of intensive withdrawal in Silang and General Trias, groundwater levels have
been lowered by as much as 25 meters, and in General Mariano Alvarez and
Carmona by more than 25 meters. In Dasmariñas, the water level has been
lowered by 25 – 50 meters. The average decline of water level in the areas of
intensive withdrawal was about 15 meters over the 13 years period, which was
more than 1 meter per year.

Cavite Integrated Water Resource Management Master Plan
4-40
Figure 4.2-12 Groundwater Level Change 1990-2003
Records of recently drilled wells show static water levels of 63.10 m bgl (121.05
m amsl) in Dasmariñas, 64.00 - 101.95 mbgl (164.01 – 236.00 m amsl) in Silang,
43.65 m bgl (146.35 m amsl) in Magallanes, 19.8 m bgl (75.2 m amsl) in Trece
Martires, 16.2 m bgl (9.8 m amsl) in Carmona, and 6.10m bgl (1.9 m asml) in
Imus.
In Barangay Javalera in the Municipality of Gen. Trias, groundwater withdrawal
made for the industrial estate in the area resulted in the decline of static water
level from 7.1 mbgl in 1990 to 25.5 mbgl in 2000 for a total decline of 18.4 meters
during the 10-year period. Records of the Tagaytay City Water District wells on
the other hand show more or less the same water level in some of the wells,
while other wells showed minimal decline of water levels.
The decline of static water level in the centers of big groundwater withdrawal was
due to groundwater mining from wells distributed in small area, which caused
acceleration in decline rate, as more of the saturated was dewatered. It is
expected that the recharge within the well capture zone or within the wellfield will
increase due to the available storage in the upper portion of the aquifer, which
could accommodate additional runoff. Consequently, it can be expected that
river base flow will decrease on the account of increase groundwater withdrawal.
Near the coast, particularly Cavite City, all deepwells have been abandoned due
to the decline of water level below mean sea level that resulted to saline water
invasion. Overdevelopment of groundwater resources through wells in areas near

Cavite Integrated Water Resource Management Master Plan
4-41
the coastline will ultimately result to inland movement of seawater once the cone
of depression created by pumping reaches the sea.
Aquifer Hydraulic Properties
The worth of an aquifer as water supply source depends on two inherent
characteristics; its ability to store and transmit water. The principal method of
analysis of groundwater hydraulics is through the test pumping of the well to
stress the aquifer with the flow rates and water levels measured during the test.
These measurements are then used in an appropriate well flow equation to
calculate the hydraulic characteristics of the aquifer.
There are two types of aquifer tests, which are commonly performed on newly
constructed wells: the step-drawdown test and the constant discharge test. In the
step-drawdown test, the well is pumped with varying discharge rates for relatively
short periods, whereas in a constant discharge test, the well is pumped
continuously for a significant length of time with one discharge rate. Data from
both tests are analyzed to determine hydraulic characteristics of the aquifer and
efficiency of the well, which are then used to determine sustainable well yield.
Test pumping results also serve as baseline data for future evaluation of well
performance.
Aquifer Loss and Well Loss
From the well data summary in Annex II-20, there are 19 wells out of 84 wells
with step-drawdown test records. There are 11 wells with an aquifer loss
coefficient of less than 300 sec/m2while there are five (5) with an aquifer loss
coefficient of more than 1,000 sec/m2.To illustrate the significance of the aquifer
loss coefficient,withdrawal of 0.864 MLD (10 lps) will create 3.0 meters drawdown
due to formation loss for a well with aquifer loss coefficient of 300 m/s2 and 10
meters drawdown due to aquifer loss for a well with aquifer loss coefficient of
1,000 m/s2.
Aquifer loss coefficient of less 100 m/s2 was determined from a well in Silang
drilled near the Marikina Fault while intermediate values of 200 – 400 s/m2were
determined from wells drilled in Imus, Bacoor, and Kawit and more than 1,000
s/m2 in some areas in Silang, Dasmarinas, Tagaytay City, and Magallanes.
Aquifer Yield
As also presented in Annex II-20, all the wells have specific capacity values
while only 80 wells with transmissivity values. Transmissivity is the rate at which
water flows through a vertical strip of the aquifer 1 meter wide and extending
through the full saturated thickness, under a hydraulic gradient of 1.The specific
capacity of a well is its yield per unit of drawdown usually expressed as liters per
second per meter of drawdown.

Cavite Integrated Water Resource Management Master Plan
4-42
The specific capacity values which ranged from 0.35 – 3.60 lps per meter of
drawdown indicate wells with poor to high yielding properties. Figure 4.2-13
shows the distribution pattern based on the test pumping records collected during
this study. High specific capacity values of more than 3 lps per meter of
drawdown were observed in some parts of Trece Martires, Naic, Gen. Trias,
Carmona, and Silang, while low specific capacity values of less than 1 lps per
meter of drawdown were observed in Alfonso, Amadeo, Tagaytay City,
Magallanes, Ternate, and parts of Silang.
The high specific capacity of wells in Silang could be attributed to its location,
being within the Marikina Fault, and in areas where thick layers of coarse-grained
pyroclastic rocks are present.
Figure 4.2-13 Specific Capacity
From the same Annex II-20, the transmissivity of selected wells ranged from
0.18 – 7.06x10⁻³ m2/s, which indicates aquifer with very poor to very good yielding
properties. Again, very high transmissivity values of more than 5 x10⁻³ m2/s could
be observed among wells drilled within the Marikina Fault. Wells drilled at the
higher elevations showed transmissivity of less than 1.0 x 10⁻³ m2/s, which
indicate aquifer with very low yielding properties.
There is no information on the storage properties of the aquifers from any of the
previously conducted test pumping. Storage coefficient of water table could be
assumed to range from 0.001 to 0.0001 and less than 0.0001 for artesian
aquifers.

Cavite Integrated Water Resource Management Master Plan
4-43
Figure 4.2-14 Transmissivity
Yield of Individual Wells
The total drawdown in a pumping wells were calculated from the following:
Jacob‘s formula (BQ + CQ2) for the first 60 minutes of pumping; the effect of long
term pumping without recharge; interference‘s from other pumping wells; and
correction for the decrease of saturated thickness of aquifer and decline of water
level due to seasonal effect.
Annex II-22 presents the sustainable yields of 16 selected wells all over the
province. The estimated sustainable yield of individual well was based on
allowable drawdown and well designs and not based on recoverable discharge in
a given area. As shown in the table, wells in Bacoor, Imus, Trece Martires, and
Indang have the biggest sustainable yield of more than 2.592 MLD (30 lps) while
wells in Noveleta and Gen. Mariano Alvarez have the lowest sustainable yields of
less than 0.432 MLD (5 lps).
4.2.5 Summary of Groundwater Resource Assessment
On Groundwater Availability
With an average recoverable recharge of 572.429 MLD and a projected water
demand of 1,756 MLD by 2040 (excluding agriculture demand) it is clear that
groundwater resources through wells are not capable of supporting the long-term
water requirements of the province.

Cavite Integrated Water Resource Management Master Plan
4-44
At present, water demands in the Municipalities of Bacoor, Cavite City, Carmona,
Dasmariñas City, General Trias, General Mariano Alvarez, Silang, Imus, Kawit,
Noveleta, Rosario, and Tanza have exceeded their recoverable discharges.
Large-scale groundwater mining has to be resorted to unless other water supply
sources can be developed and tapped at the soonest possible time.
It is only in Tagaytay City and the Municipalities of Amadeo, Gen. Emilio
Aguinaldo, Indang, Naic, Alfonso, Ternate, Mendez, Magallanes, and
Maragondon where recoverable groundwater recharge is higher than the
municipal/city water demands. As part of mitigating measure, surplus
groundwater from the Municipalities of Amadeo, Gen. Emilio Aguinaldo, Indang,
Naic, Alfonso, Ternate, Mendez, Magallanes, and Maragondon can be harnessed
to support portions or a part of the deficit in the nearby towns.
Development of groundwater resources through wells is not recommended in
Tagaytay City. Also, elevated areas of the Municipalities of Ternate and
Maragondon are not being considered as potential well sites due to poor aquifer
potential in these areas. The coastal areas of the Municipalities of Naic and
Ternate are also to be avoided due to possible saline water intrusion.
Water Resources Conjunctive Use
To support the long-term water requirements of the province, the conjunctive use
of surface water and groundwater sources, or the importation of water from
nearby provinces becomes imperative. Because groundwater resources have
become fully appropriated in some municipalities, whatever water is available
must be used. The conjunctive use of both surface water and groundwater will
require a detailed knowledge of the hydrogeology of the basin, records of
pumping and recharge rates, and updates on groundwater levels and quality.
This will involve coordinated and planned operation of both surface water and
groundwater resources to meet water requirements in a manner whereby water is
conserved. The basic difference between the usual surface water development,
with its associated groundwater development and conjunctive use, is that the
separate yields of the former can be replaced by the larger and more economic
joint yields of the latter. During periods of above normal precipitation, surface
water is utilized to the maximum extent possible. During the dry periods, limited
surface water is supplemented by pumping groundwater.
4.2.6 Sewerage, Septage and Water Quality
Both water quantity and quality become dominant issues with the growth in
population and economic activities and the corresponding increasing demand for
water as a consequence of the same. In the case of the Province of Cavite, this
becomes more pronounced given the lack of any septage collection and treatment
system, as well as the absence of any piped waste water collection and treatment
system or a centralized sewerage system.

Cavite Integrated Water Resource Management Master Plan
4-45
Due to the lack of the necessary sewerage and septage systems, septic tank
effluent is generally allowed to leach into the ground while untreated waste water
from households and industrial establishments is returned to the water sources. In
some cases, septic tank effluents are discharged into nearby drains, ditches, or
watercourses, which cause particular problems especially in coastal areas where
the ground water table is relatively high.
4.3 GENERAL CONCLUSIONS
The analysis made in the foregoing points to the following salient findings:
With an average recoverable recharge of about 572 MLD and a projected water demand of 1,756 MLD by 2040 (excluding agriculture demand), groundwater resources will not be adequate to meet the long-term water requirements of the province. Groundwater mining, which could adversely affect the environment and which already appears to be occurring in some cities/municipalities, may be bound to increase if no alternative sources of water are developed.
It is only in Tagaytay City and the Municipalities of Amadeo, Gen. Emilio Aguinaldo, Indang, Naic, Alfonso, Ternate, Mendez, Magallanes, and Maragondon that recoverable groundwater recharge is higher than the municipal/city water demands.
Use of groundwater resources through additional wells is not recommended in Tagaytay City. The same is true with the elevated parts of the Municipalities of Ternate and Maragondon due to the poor aquifer potential in these areas, as well as the coastal areas of the Municipalities of Naic and Ternate where there is potential for saline water intrusion.
To support the medium to long-term water requirements of the province, the conjunctive use of surface water and groundwater sources becomes necessary.
In the absence of a system-wide wastewater treatment and collection system, immediate interventions to address the dire environmental effects of this deficiency is imperative.

Cavite Integrated Water Resource Management Master Plan
5-1
CHAPTER 5 WATER RESOURCE DEVELOPMENT FRAMEWORK
5.1 PRINCIPLES FOR INTEGRATED WATER RESOURCES DEVELOPMENT AND MANAGEMENT
Water is a valuable and limited natural resource and its development should be
governed by principles that will benefit all the stakeholders. The Cavite integrated
water resources development and management framework aims to harness the
potential of provincial water resources in an economically sustainable manner to
spur inclusive development of all stakeholders. The framework is anchored on five
(5) pillars, namely:
Water Resource Use Optimization by advocating rational use and
combatting unproductive losses implemented under a viable water governance system
Balanced Development of all types of available water, performed within
hydrographic boundaries in accordance with basin morphology and considering the unique climatic conditions
Private-Public Partnership not only in governance, but also in funding, maintenance, planning and development.
Strengthened Governance Institutions and Linkages, based on legal
mandates
Transparency and Accountability through open exchange of vital information
Water resources development shall be governed by balancing the development
and management of both surface and underground water resources. In view of
conflicting uses and demands, the concerned institutions need to coordinate with
all stakeholders to rationalize the use and allocation of this scarce resource
based on current laws and regulations.
Given the existing institutional and legislative frameworks currently in place,
implementing an Integrated Water Resource Management System (IWRMS) in
the province of Cavite is likely to require significant reforms in all aspects of
project development. A clear provincial water policy which imbeds the principles
of sustainable management of water resources in the governance framework
needs to be put in place to enable a more effective mobilization of resources to
spur development in the right direction.
The implementation of new infrastructure projects on water resource
development has to take into account environmental and social impacts and the
basic requirement to be financially and economically viable to achieve long-term
sustainability.

Cavite Integrated Water Resource Management Master Plan
5-2
The framework for implementing the IWRMS is conceptually summarized in
Figure 5.1-1.
Figure 5.1-1 Framework for the Cavite Integrated Water Resource Management System
To implement IWRMS, the Provincial Government of Cavite has to put in place
the required institutional arrangements and legal frameworks needed to:
Enable the Provincial Government to coordinate the management of water resources, in conjunction with concerned institutions based on legal mandates;
Mobilize a consortium of stakeholders involved in project development and decision making;
Clarify the entitlement and responsibilities of users and water providers;
Formalize a more rational allocation of water;
Provide legal status for water management institutions at sub-national levels; and
Imbed the principles of sustainability in the use of water resource.
5.2 THE KEY ISSUES
On the basis of the sector scanning and assessment detailed in the preceding
chapters, a number of key issues begin to surface. In summary, these are:
Institutional and Legal Framework
Policies and Strategies
Infrastructure Development
Management Systems
Water Resources
Water Supply
Wastewater and Environmental Control
AgricultureHydropower
and Other Uses
INTEGRATED WATER RESOURCE MANAGEMENT SYSTEM

Cavite Integrated Water Resource Management Master Plan
5-3
Widening Demand vs Supply Gap
The present water supply and distribution systems covering the Province of
Cavite is no longer able to meet the present and future aggregate demand for
water. Groundwater abstraction in a number of areas in the Province has already
reached critical points causing decreased groundwater levels and resulting in
groundwater mining and salt-water intrusion in coastal areas (Table 5.2-1).
Table 5.2-1 2012 Groundwater Supply-Demand Gap (in MLD)
CITY/ MUNICIPALITY
Recoverable Ground Water
Domestic Demand
Industrial Demand
Recreation Demand
Agriculture Demand
Total Groundwater Withdrawal
Surplus (Deficit)
District I
Cavite City 2.42 23.16 6.27 - 0.01 29.43 (27.01)
Kawit 2.75 16.93 1.66 0.21 0.69 19.49 (16.74)
Noveleta 1.15 8.09 0.05 - 0.74 8.88 (7.74)
Rosario 0.74 19.28 20.16 - 0.76 40.20 (39.46)
District II
Bacoor 5.13 98.52 0.42 - 2.58 101.53 (96.40)
District III
Imus 18.26 59.85 10.86 - 7.95 78.66 (60.40)
District IV
Dasmariñas 27.73 95.19 14.22 1.61 15.45 126.47 (98.74)
District V
Carmona 12.37 10.53 12.39 3.21 1.74 27.87 (15.50)
Gen.Mariano Alvarez
3.51 22.01 0.48 - 0.72 23.21 (19.70)
Silang 91.31 35.52 15.95 0.90 25.59 77.96 13.35
District VI
Trece Martires 16.05 16.91 7.00 1.78 12.06 37.74 (21.70)
Amadeo 30.87 4.63 - - 2.39 7.02 23.85
Gen. Trias 26.78 40.04 27.80 1.75 14.57 84.16 (57.39)
Tanza 14.86 22.01 2.57 - 17.92 42.50 (27.64)
District VII
Tagaytay City 65.00 13.72 0.08 1.39 4.09 19.29 45.71
Alfonso 56.74 6.57 0.16 0.54 26.25 33.51 23.23
Gen. E. Aguinaldo 20.97 2.20 - - 6.08 8.28 12.69
Indang 52.71 8.53 0.10 - 4.18 12.82 39.89
Magallanes 32.26 2.16 0.81 - 9.42 12.39 19.87
Maragondon 43.03 4.39 - - 2.59 6.98 36.05
Mendez 14.67 4.34 - 0.06 2.75 7.15 7.52
Naic 24.19 8.93 0.99 - 3.20 13.13 11.07
Ternate 8.93 1.04 - 0.58 0.77 2.39 6.54
TOTAL 572.43 524.57 121.98 12.02 162.50 821.06 (248.63)

Cavite Integrated Water Resource Management Master Plan
5-4
Infrastructure Backlog
With an estimated 572 MLD of available groundwater to supply domestic
demand, the current supply is not enough to cater to the future requirement for
potable water (Table 5.2-2)
Table 5.2-2 Water Requirements Summary (MLD), 2012-2040
Category 2012 2015 2020 2025 2030 2035 2040
Domestic 525 538 669 838 1,063 1,297 1,549
Industrial 122 136 160 172 184 188 192
Recreation 12 12.5 13 13.5 14 14.5 15.2
Agriculture 1,094 1,090 1,087 1,077 1,074 1,077 1,089
TOTAL 1,753 1,777 1,929 2,100 2,335 2,576 2,845
Moreover, the planning, development and provision of water supply is de-linked
from that of sanitation facilities, particularly sewerage and septage facilities. As a
consequence, there is a lack of septage collection and treatment system, as well
as any piped waste water collection and treatment system or a centralized
sewerage system. Due to this lack, septic tank effluent is generally allowed to
leach into the ground while untreated waste water from households and industrial
establishments is returned to the water sources.
Irrational Allocation of Water Resources
There is a mismatch between the granting and utilization of water rights vis-a-vis
needs and nature of usage. As of December 2011, the NWRB has granted water
rights to 32,759.17 entities in the province for domestic/municipal, industrial/
commercial, irrigation, recreational and other purposes.
Table 5.2-3 Allocation of Water Rights by Source and Purpose, Cavite, 2011
Source
Liters per second
Domestic/
Municipal
Commercial/
Industrial Recreation Irrigation Livestock Others Total
Spring 200.05 0.20 8.25 208.50
Surface 28,345.26 28,345.26
Deepwell 3,022.32 818.67 192.52 113.02 29.03 29.85 4,205.41
Total 3,222.37 818.87 200.77 28,458.28 29.03 29.85 32,759.17
Source: NWRB

Cavite Integrated Water Resource Management Master Plan
5-5
Source: NWRB
Figure 5.2-1 Allocation of Water Rights by Source and Purpose, Cavite 2011
Surface water is used solely for irrigation while water from springs is
predominantly used for domestic/municipal purposes. Groundwater from deep
wells has the widest variety of usage ranging from domestic to industrial and
irrigation.
With the changing land use in Cavite from agricultural to industrial, there is a
possibility that some water rights are no longer used for the very purpose they
were granted. For instance, in view of the decreasing size of irrigable land areas,
water rights that have been allocated for agriculture remain largely unutilized or
underutilized. In the same breath, parties without water rights resort to illegal and
extra-legal means to supply their demand, leading to an unfavourable situation
wherein water resources are unmonitored and become unaccounted for. This
situation is best illustrated in Table 5.2-4 Irrigation Water Rights Granted vs.
Estimated Water Requirements. It is worthy to note that the original service area
of the CFLIS of 15,000 hectares has been reduced to 8,618.09 hectares
(57.4%)in 2010 due to land conversion, but the original water right allocation of
22,278lps was not adjusted. Moreover, the total irrigated areas developed by the
private systems, as of 2010, totaled 5,493 hectares. But the total water rights
granted is only 581 lps, just enough to serve about 468 hectares. It shows that
roughly 70% of the private systems‘ irrigated areas do not have actual water right
allocation.
-
5,000.00
10,000.00
15,000.00
20,000.00
25,000.00
30,000.00
Domesti
c/ M
unicipal
Comm
ercia
l/ Ind
ustria
l
Recre
ation
Irrig
ation
Livest
ock
Others
Spring
Surface
Deep well

Cavite Integrated Water Resource Management Master Plan
5-6
Table 5.2-4 Irrigation Water Rights vs. Estimated Water Requirements
Hectares
Allocated
Water
Rights @
1.5 lps/ha
Firmed Up
Service Area
(Hectares)
Water Rights
Granted, lps
Estimated
Water
Requirements
(lps) @ 1.5
lps/ha
Estimated
Water
Requirements
(lps) @ 1.24
lps/ha
Remarks
National Irrigation
System 15,000 22,278 8,618.09 22,278.00 12,927 10,686
9,351 11,592 With
excess
Communal
Irrigation Systems 430.63 526.73 646 534
(119) (7) Deficit
Private Systems 5,492.86 580.90 8,239 6,811
(7,658) (6,230) No water
rights
Total 14,541.57 23,385.63 21,812 18,032
1,573 5,354 Total
excess Source: NIA - Naic, Cavite SEPP 2010
Weak Institutional Linkage and Coordination
Existing institutional and regulatory frameworks both at the national and
provincial/local levels appear to be weak and fragmented. To address the issue
of fragmentation and weak regulatory framework at the national level, two bills
have been proposed seeking to initiate a reform in the water sector and
restructuring its management and development. These are :
Senate Bill 2641, “Water Regulatory Act of 2011,” which rationalizes the economic regulation of water utilities through the creation of a Water Regulatory Commission, an independent, quasi-judicial body that has the responsibility and power to create policies for water supply, sewerage, and septic management; issue licenses; set, review, and approve rates; review and suspend contracts; and ensure that the welfare of consumers is prioritized; and
Senate Bill 2997, “Water Sector Reform Act (WSRA) of 2011” aims to institute reforms in the water industry by adopting the Integrated Water Resources Management Approach of the Global Water Partnership (GWP). The bill also opens up the industry to private investment by allowing participation in Public-Private Partnerships (PPPs) of water and sanitation services.
Funding Shortfall
There appears to be a lack of a coherent financing framework that can rationalize
financing in the water sector to make the fullest use of limited public funds and
encourage concessional financing and private sector investments. The Local
Government Code of 1991 has given more powers to the LGUs and allocated
about 20% of national revenues for block grants or transfers. Internal revenue
allotments, however, have proven to be insufficient to cover all development
requirements of most LGUs. As a consequence, LGU‘s participation in the
provision of water supply infrastructure has not expanded much. The province of
Cavite is poised to implement a private-public partnership approach after crafting
a Provincial PPP Code.

Cavite Integrated Water Resource Management Master Plan
5-7
5.3 MEETING THE DEVELOPMENT CHALLENGES
To address the foregoing issues, there is a need to improve the business
environment and institute reforms in the management system. This calls for an
integrated approach which underpins the implementation of the Cavite Integrated
Water Resources Management Master Plan. CIWRMMP is focused on the
achievement of results in the targeted issues - widening demand-supply gap,
infrastructure backlog, irrational allocation of water resources, weak institutional
linkages and coordination, and funding shortfall.
Figure 5.3-1 provides a conceptual overview of the development strategy and
implementation framework for the CIWRMMP. It consists of provincial level
support, comprising of specific tasks to be performed along with activities
undertaken simultaneously by private sector development partners. The
Development Strategy is divided into three (3) formative phases, each one
consisting of specific targeted outputs, leading to the achievement of
sustainability.
Figure 5.3-1 Conceptual Overview : Development Strategy and Implementation Framework
Province of Cavite
Private Sector Development
Partner
Phase 1 Diagnostic
Stage
Phase 2 Development
Stage
Phase 3 Sustainability
Stage
• Assessment of Allocated Water Rights
• Review of Organizations and Mandates
• Mainstream CIWRMMP• Formulate Relevant
Legal Issuances and Implementing Guidelines
• Systems Design• Risk Evaluation and
Concession Agreement• Fund Syndication
• Organization of Cavite Integrated Water Management Board
• Application for Water Permit
• Concessions/Joint Venture Undertaking
• Assistance to ROW Acquisition
• Organization of Consortium Partners
• Implementation of Short-term/urgent water supply projects
• Capacity-building for Water Resource Management Organization
• Facility Management and Maintenance
• Implementation of Long-term water supply projects
• Standardization of Processes and Documentation
• Planning for Future Activities
• Planning for Future Activities
• Monitoring and Evaluation
• Continuous Improvement of Governance Processes
Development Strategy

Cavite Integrated Water Resource Management Master Plan
5-8
5.4 ADDRESSING THE SUPPLY-DEMAND GAP
Figure 5.4-1 presents a map indicating areas with available water and areas which
will have difficulty of accessing water within its boundaries in the future.
The groundwater sources in the province consist of springs and wells which have
great potential to augment the existing supply for the increasing demand in the
province. There are many springs in the province, most of which, however, have
already been tapped and being utilized to supply domestic demand and recreation
and agricultural demand. The inventory of existing wells and their potential to
augment the supply to meet the future demand is discussed in detail in the chapter
on ground water assessment. Additional deep wells may still be drilled within the
specific area.
Figure 5.4-1 Groundwater Availability, 2012
Surface water resources in the province consist mostly of rivers, creeks and
rivulets that abound in many parts of the province. There are no major lakes in the
province. The major rivers that have potential to supply the demand are
Maragondon River, Panaysayan River, Balsahan River and Ilang-ilang River.
These rivers and some tributaries may also be tapped as possible source of supply
for the province.

Cavite Integrated Water Resource Management Master Plan
5-9
5.5 SEWERAGE AND SANITATION DEVELOPMENT FRAMEWORK
As earlier established, there is a lack of necessary sewerage and septage systems in the Province of Cavite. Due to this lack, septic tank effluent is generally allowed to leach into the ground while untreated waste water from households and industrial establishments is returned to the water sources. It is also noted in some cases that septic tank effluents are discharged into nearby drains, ditches, or watercourses, which cause particular problems especially in coastal areas where the ground water table is relatively high Given the present situation, the Provincial Government‘s primary objective for this sector is to improve Cavite‘s sanitation and sewerage. As stated in the Water Supply, Sewerage and Sanitation Master Plan, this involves the expansion of the coverage of sanitation and sewerage services and their institutionalization. The selection and allocation of new projects for sanitation will be based on the following criteria: ―(i) Community commitment; (ii) Inadequacy of existing water supply and sanitation; (iii) Prevalence of water-related diseases; (iv) Community development level and potential; (v) Capital cost per capita; and (vi) Proportion of households served by flush toilets, water sealed latrines or sanitary latrines deemed suitable by local health authorities.” For sewerage projects, the criteria are: “(i) Presence of existing sewerage system; (ii) Existence of economically and efficiently operated and maintained water supply system; (iii) Population density; and (iv) Community commitment.” Cavite‘s Water Supply, Sewerage and Sanitation Master Plan is in keeping with Republic Act No. 9275 or the Philippine Clean Water Act of 2004, which mandates the DPWH, LGUs, and other concerned agencies to prepare a national sewerage and septage management program which also covers domestic sewage collection, treatment, and disposal. The program includes the identification of priority LGUs for sewerage, septage, and combined sewerage-septage projects; as well as the allotment of funds for the construction and rehabilitation of facilities. Other environmental laws that govern sewerage and sanitation are the following:
the Sanitation Code of the Philippines (1975); Presidential Decree No. 984 –
Pollution Control Law (1976); DAO No. 34 – Revised Water Usage and
Classification Criteria (1990); DAO no. 35 – Revised Effluent Regulations (1990);
and Republic Act No. 4850 – The Creation of the Laguna Lake Development
Authority.

Cavite Integrated Water Resource Management Master Plan
6-1
CHAPTER 6 LEGAL FRAMEWORK AND INSTITUTIONAL ARRANGEMENTS
6.1 FRAMEWORKS AND PRINCIPLES
The objective of the Cavite Integrated Water Resource Management Master Plan
(CIWRMMP) is guided by the Philippine Integrated Water Resource Management
(IWRMP) Framework6 which enables the integration of the water supply sector to
the overall social and economic agenda of the Province of Cavite. In order to
decentralize water governance, management by the Local Government Units
(LGUs) will be promoted, as mandated in Republic Act No. 7160 or the Local
Government Code of 1991 (LGC). The CIWRMMP also aims to support the
Province of Cavite‘s vision of having sustainable water resources and responsive
services for present and future needs; and to map out a development strategy
that will promote the optimal and sustainable development and management of
the water resources of one of the fastest growing provinces in the country.
Around 112 billion cubic meters, roughly 70% of the country‘s total water
resources is either wasted or lost each year. Water is lost from leaking pipes and
illegal connections. In addition, rainwater just flows back into the sea instead of
being preserved for irrigation, industrial purposes, or domestic use due to lack
water catchments and other appropriate infrastructure. 7
In the province of Cavite, there is an impending deficit in water supply of 4,745
lps by year 2040 in view of the increasing demand of households, industrial
establishments, institutions, recreation facilities and agricultural production,
among others. The previous chapters discussed measures to address this
problem by tapping surface and ground water sources and storing rainwater in
reservoirs during monsoon season. However most of the rights to these water
sources have already been allocated to several entities for various purposes.
The core of the problem was the disjointed water policy.8 Around 16 major
agencies and 5,000 water service providers have some hand over the country's
water resources.9 This Integrated Water Resources Management (IWRM) plan
will hopefully help manage the water sector efficiently and effectively.10
6.2 KEY WATER-RELATED LEGISLATION11
The relevant legislations pertaining to the development of the Water Resources sector in
Cavite, including their status of implementation, are summarized in Table 6.2-1.
6 Integrated Water Management Plan Http://Www.Wepa-Db.Net/Pdf/0710philippines/4_NWRB.Pdf (Last
Accessed 06 September 2012) 7 Press Release, April 9, 2012, Http://Www.Senate.Gov.Ph/Press_Release/2012/0409_Angara1.Asp
8 Press Release, April 9, 2012, Http://Www.Senate.Gov.Ph/Press_Release/2012/0409_Angara1.Asp
9Press Release No. 3, May 3, 2012, Http://Www.Senate.Gov.Ph/Press_Release/2012/0503_Angara1.Asp
10 Press Release, April 9, 2012, Http://Www.Senate.Gov.Ph/Press_Release/2012/0409_Angara1.Asp
11 Senate Policy Brief Published August 2011 Turning The Tide: Improving Water Resource Management In
The Philippines,Http://Www.Senate.Gov.Ph/Publications/PB%202011-08%20-%20Turning%20the%20Tide.Pdf (Last Accessed 06 September 2012)

Cavite Integrated Water Resource Management Master Plan
6-2
Table 6.2-1 Relevant Legal Issuances
STATUTE PURPOSE/MANDATE STATUS OF IMPLEMENTATION
Commonwealth Act No. 383, Anti-
Dumping Law (1938)
Prohibits dumping of refuse, waste matter or other
substances into rivers
Not fully enforced
Republic Act No. 4850, Laguna Lake Development
Authority (LLDA) Act (1966), as amended by
Presidential
Decree No. 813 (1975)
Regulates and controls the pollution of the Laguna de
Bay Region, including sewage works and industrial
waste disposal systems
Strictly enforcing except as to domestic wastewater
Republic Act No. 6234, Metropolitan Waterworks and
Sewerage System (MWSS) Act (1971)
Constructs, operates and maintains water systems,
sewerage and sanitation facilities in the Metro Manila
area
Limited sewerage and sanitation service coverage
Presidential Decree No. 198,
Provincial Water Utilities Act (1973)
Authorizes the creation of water districts to operate
and administer water supply and wastewater disposal
systems in the provincial areas
Operation and management of wastewater disposal
system not implemented
Presidential Decree No. 281, Pasig River Development
Council Act (1973)
Regulates and controls the pollution of the Pasig River Not fully enforced
Presidential Decree No. 600, Marine Pollution Decree
(1974), as amended by Presidential Decree No. 979
(1976)
Regulates and controls the pollution of Seas Coverage is not efficiently monitored due to limited
resources
Presidential Decree No. 705, Revised Forestry Code
(1975)
Provides criteria, guidelines and methods for the
proper and accurate classification and survey of all
lands of the public domain
Not fully enforced
Presidential Decree No. 856,
Sanitation Code (1975)
Requires cities and municipalities to provide an
adequate and efficient system for sewage collection,
transport and disposal in their areas of jurisdiction
Not enforced and monitored, e.g.,
connection to sewer system by houses in areas where
sewerage system is available
Presidential Decree No. 984, National Pollution
Control Decree (1976)
Provides guidelines for the control of water pollution
from industrial sources and sets penalties for
violations; requires all polluters to secure permits
Not strictly enforced; compliance on the provision of
sanitation and
sewerage are not met

Cavite Integrated Water Resource Management Master Plan
6-3
STATUTE PURPOSE/MANDATE STATUS OF IMPLEMENTATION
Presidential Decree No. 1067, Water Code (1976) Consolidates legislation relating to ownership,
development, exploitation
and conservation of water resources
Not fully enforced
Presidential Decree No. 1096, National Building Code
(1977)
Requires connection of new buildings to a water‐borne
sewerage system
Wastewater or sewage disposal are not fully enforced
Presidential Decree No. 1151, Environmental Policy
Decree (1977)
Recognizes the right of the people to a healthy
environment
Not strictly enforced especially on sanitation and
sewerage provisions
Presidential Decree No. 152, Environment Code
(1977)
Provides guidelines to protect and improve the quality
of water resources and defines responsibilities for
surveillance and mitigation of pollution incidents
Only enforced on big polluters (i.e., industries)
Presidential Decree No. 586,
Environmental Impact Statement System Decree
(1978)
Mandates the conduct of environmental impact
assessment studies for all investments undertaken by
the government and private sector
Project review is not strict on
sanitation and sewerage provisions
Republic Act No. 6716, Rainwater Harvesting Act
(1989)
Mandates the construction of water wells and
rainwater collectors in all barangays
Not enforced and monitored
Republic Act No. 7160, Local Government Code (1991) Devolves enforcement of laws on sanitation to local
government units (LGUs) and the provision of basic
services such as water supply, sanitation and flood
control
Not strictly enforced due to budgetary constraints and
low priority for sanitation and sewerage projects
Republic Act No. 7586, National Integrated Protected
Areas System
Act (1992)
Calls for the protection of outstanding, remarkable
areas and biologically important public lands,
bio‐geographic zones, and related ecosystems
Not strictly enforced due to budgetary constraints and
lack of manpower
Republic Act No. 8041, National Water Crisis Act
(1995)
Provides urgent and effective measures to address the
nationwide water crisis relating to issues on water
supply, distribution, finance, privatization of state‐run
water facilities, the protection and conservation of
watersheds and the waste and pilferage of water,
including the serious matter of graft and corruption in
all the water agencies
Was implemented during that period and resulted in
the reorganization of the MWSS and LWUA

Cavite Integrated Water Resource Management Master Plan
6-4
STATUTE PURPOSE/MANDATE STATUS OF IMPLEMENTATION
Republic Act No. 8371, Indigenous Peoples Rights Act
(1997)
Protects the rights of indigenous peoples to own and
participate in the planning for and management of
natural resources found within their ancestral domain
Not strictly enforced due to budgetary constraints and
lack of manpower
Republic Act No. 9003, Ecological Solid Waste
Management Act (2000)
Provides the legal framework for a national program
that will manage the control, transfer, transport,
processing and disposal of solid waste in the country
Not strictly enforced
Republic Act No. 9147, Wildlife Resources
Conservation and
Protection Act (2001)
Mandates to conserve and protect wildlife species and
their habitats in order to promote ecological balance
and enhance biological biodiversity
Not fully enforced due to budgetary constraints and
lack of manpower
Republic Act No. 9275, Clean Water Act (2004) Provides for a comprehensive and integrated strategy
to prevent and minimize water pollution from land-
based sources
Not strictly enforced; compliance with the provision of
sanitation and sewerage facilities have not been met
Republic Act No. 9729, Climate Change Act (2009) Institutionalizes the government’s climate change
response mechanisms and harmonizes existing policies
and programs
Not yet fully carried out and
implemented due to budgetary
constraints

Cavite Integrated Water Resource Management Master Plan
6-5
6.3 EXISTING ORGANIZATIONAL STRUCTURE, FUNCTIONS AND ACTIVITIES OF KEY AGENCIES
The water supply sector consists of several agencies with different regulatory
practices. The absence of a single lead agency to coordinate development in the
water sector is one of the major hurdles to the efficient implementation of
strategic water infrastructure. There are at least 30 agencies involved in the water
sector, with specific but often overlapping or conflicting mandates for water
supply, irrigation, flood management, pollution control, watershed management,
financing, policy formulation and coordination, among others. This situation
presents difficulties for effective coordination and implementation of projects and
programs to sustainably meet water use and management. (e.g., in meeting the
needs of competing users of water; linking water service provision with basic
sanitation services; and ensuring effective and efficient flood risk reduction and
management).12
The National Economic and Development Authority (NEDA), formulates policies
concerning the water and sanitation sector in its Philippine Development Plan
(PDP)13. The PDP recognizes and underscores the necessity of adopting and
institutionalizing the IWRM approach as the preferred strategy for water
resources management. Particularly, there is focus on the Bulk Water Supply
System.14 The Strategic Plan and Framework to address the issue on the equity
and access to water are as follows:
1. Practice Integrated Water Resources Management (IWRM) in the sector; 2. Rationalize financing in the water sector to fulfill Millenium Development
Goal (MDG) commitments; 3. Work towards a lead agency for the water sector; and 4. Develop capacities of NGAs, LGUs, and water-service providers (WSPs)
for the sustainable management of infrastructure and better service provision.15
In January 2006, a National IWRM Plan Framework was created to provide a
clear roadmap and a collaborative platform for all stakeholders and water-related
agencies to effectively work together to achieve water for all in a sustainable,
equitable and ecologically balanced manner. In compliance, the province of
Cavite developed its CIWRMMP to serve as roadmap in the development of
water resources in the province and basis for regulating initiatives of all
stakeholders involved.
The National Water Resources Board (NWRB)16 as the national regulating and
12
Page 134, Chapter 5 (Accelerating Infrastructure Development), Philippine Development Plan 2011-2016, Http://Www.Neda.Gov.Ph/PDP/2011-2016/Default.Asp (Last Accessed 06 September 2012) 13
Philippine Development Plan 2011-2016, Http://Www.Neda.Gov.Ph/PDP/2011-2016/Default.Asp (Last Accessed 06 September 2012) 14
Cf. Footnote 3, Page 123, Chapter 5 (Accelerating Infrastructure Development), Philippine Development Plan 2011-2016, Http://Www.Neda.Gov.Ph/PDP/2011-2016/CHAPTER%205.Pdf (Last Accessed 06 September 2012) 15
Ibid 16
Cf. PD 424 Created The National Water Resource Council (1974); PD 1206 Assigned The Resources Board Residual Functions Of The Board Of Waterworks And The Defunct Public Service Commission To

Cavite Integrated Water Resource Management Master Plan
6-6
coordinating agency on water resources management and development, is
mandated to implement the Water Code of the Philippines that consolidates the
laws governing the ownership, appropriation, utilization, exploitation,
development, conservation, and protection of water resources. The NWRB
regulates and supervises water utilities outside the jurisdiction of Local Water
Utilities Administration (LWUA), MWSS-RO, SBMA-RO. In 2002, the approval of
tariffs for water districts was transferred to the NWRB from the LWUA, but due to
NWRB‘s limited personnel, LWUA continues to review and approve water
adjustments of water districts where it has financial exposure.
It should be noted that the NWRB has started to devolve and share it functions
with the LGUs,17 a few examples are:
1. Bohol Integrated Water Resources Management Board, chaired by the Governor. Some functions include:
providing LGUs measures to be adopted to safeguard, conserve and protect the environment
acceptance of application and payment of Water Permit Application (WPA), investigation and monitoring of compliance
2. Negros Island IWRM Council chaired by the Committee on Environment of the Sangguniang Panlalawigan. Some of the functions include:
policy-making
development of strategy
formulation of IWRM plan
monitoring of water resources such as flows, water quality, etc.
acceptance of water permit applications
While NWRB has the legal mandate for water governance, its existing structure
and budget limit the exercise of its functions. To address the existing leadership
gaps, the mandate of the Subcommittee on Water Resources (SCWR), initially
created under the Committee on Infrastructure (INFRACOM) to ensure the
implementation of the Philippine Water Supply Sector Roadmap, was expanded
to become the key policy coordination body for the water sector. Despite this, the
sector remains weak in terms of regulation and allocation of water resources.18
The Local Waterworks and Utilities Administration (LWUA)19is a government-
owned and controlled corporation (GOCC) with a specialized lending function
mandated by law to promote and oversee the development of water supply
systems in provincial cities and municipalities outside of Metropolitan Manila. The
law that created LWUA in the national level also provided for the establishment of
NWRB; EO 124-A, S. Of 1987 Converted NWRC To NWRB (1987); Transferred BRS To DPWH; EO 123 S. Of 2002, Reconstituted The NWRB, Transferring NWRB To DENR And Transferring Regulatory Functions Of LWUA To NWRB (2002) 17
Abano, Susan, NWRB, Devolving Functions And Sharing Power With Lgus, Managing Water Resources For Sustainability And Equity, March 11, 2009, Http://Wwf.Org.Ph/Wwf3/Downloads/Publications/Abano.Devolvingfunctionsandsharingpower.Pdf 18
Page 134, Chapter 5 (Accelerating Infrastructure Development), Philippine Development Plan 2011-2016, Http://Www.Neda.Gov.Ph/PDP/2011-2016/Default.Asp (Last Accessed 06 September 2012) 19
LWUA Was Created Through Presidential Decree No. 198, Also Known As ―The Provincial Water Utilities Act Of 1973,‖ Which Was Signed Into Law On May 25, 1973.

Cavite Integrated Water Resource Management Master Plan
6-7
Water Districts in provincial cities and municipalities. In 1987, LWUA‘s mission
and area of responsibility was expanded to include provision of Level II service
(communal faucet system) through the Rural Waterworks and Sanitation
Associations (RWSAs) in areas where Level III systems (individual household
connection) were not feasible.20In 2002, the approval of tariffs for water districts
was transferred to the NWRB from the LWUA, but due to NWRB‘s limited
personnel requirements, LWUA continues to review and approve water
adjustments of water districts where it has financial exposure.
As stated, other than LWUA and the NWRB, who are at the forefront of water
resource development, there are 30 other government agencies directly and
indirectly involved in the water resource sector. Table 6.3-1 summarizes the
functions and responsibilities of these key government agencies in the water
sector.
Local Government Units (LGUs) also play a critical role in the management of
water resources in their respective areas of jurisdiction. Since LGUs are on the
frontline in the provision of services each local government should be able to
develop its own local plans, strategies and corresponding budget allotments,
consistent with national policies and targets, including those identified in the
Philippine Development Plan.
The table below summarizes the functions and responsibilities of these key
government agencies.
Table 6.3-1 Key Water Supply Sector Agencies: Delineated Roles and
Responsibilities
Agency Roles and Responsibility
LGUs Planning and implementation of water supply and sanitation programs
Preparation of water and sanitation master plans
Monitoring of local water and sanitation coverage and the update of the sector profile
Provision of support to water supply providers (WSPs) such as the RWSAs, BWSAs, and cooperatives, including funding from IRA
Based on the Local Government Code, the upholding of multiple mandates in the sector such as resource regulation, water supply provision, and economic regulation of their utilities.
LWUA Capacity building support to WSPs
Provision of technical advisory services and financial assistance to water districts
Provision of technical and institutional support to LGUs and WSPs Setting design standards for water suppliers operated by water districts and other WSPs
DILG Capacity building support to LGUs
Provision of capacity building training to LGUs
20
Http://Www.Lwua.Gov.Ph/About_Lwua_10/What_Is_Lwua.Htm

Cavite Integrated Water Resource Management Master Plan
6-8
Agency Roles and Responsibility
Coordination of LGU master plan preparation
Provision of information to LGUs on available sector programs and financing
NWRB Regulation of WSPs including some (consenting) LGU-managed water utilities
Regulation of tariff
Regulation of coverage and service
Management of WSS sector database including WSP performance data
NEDA Coordination of the preparation of the national development plan and investment programs
Formulation of sector policies and strategies
Supervision of the implementation of policies, programs and projects
DPWH Provision of technical support to LGUs upon request including the implementation of Level I and Level II projects
DOF/GFIs Financial support for the water supply sector
(DOF) Supervision of the performance of GFIs like DBP, LBP and LWUA
(GFIs - DBP, LBP and LWUA) Provision of funding for the water supply sector
NAPC-WASCO Coordination of the P3W water supply projects for 432 municipalities outside of the Metro where people’s access to water supply is below 50 percent. There are 210 communities within Metro Manila and 201 municipalities in conflict zones covered by peace agreements with the RPMP/RPA/ABB (in 2000), CPLA (in 1986) and MNLF (in 1996).
DENR Based on E.O 192 (1987), the promulgation of (1) rules and regulations for the control of water, air and land pollution and (2) ambient and effluent standards for water and air quality
MWSS The overseeing of all private water utilities that are in charge of the water supply and sewerage services in Metro Manila
Fulfillment of role as the economic regulatory agency in the national capital region
6.4 AUTHORITY OF THE PROVINCIAL GOVERNMENT OF CAVITE TO FORMULATE THE CIWRMMP
The Local Government Code of 1991 (RA 7160) mandates provinces to provide
basic services and facilities such as ―inter-municipal waterworks, drainage and
sewerage, flood control, and irrigation systems; reclamation projects and similar
facilities.‖21 Hence, the province of Cavite has passed the following resolutions to
govern the development of bulk water supply in its jurisdiction:
Resolution No. 081-S-2012, authorized the Provincial Governor of Cavite to
acquire water rights for the volume of water in all rivers and tributaries within its
jurisdiction, and
Resolution No. 082-S-2012, which authorized the Provincial Governor to
formulate the Cavite Integrated Water Resource Master Plan to coordinate the
development and management of water, land and related resources, in order to
21
Section 17 (B) (3) (Vii)

Cavite Integrated Water Resource Management Master Plan
6-9
maximize the resultant economic and social welfare in an equitable manner
without compromising the sustainability of vital ecosystem.
Resolution No. 045-S-2012 which approved Provincial Ordinance No. 002-S-
2012, adopting and pursuing a Public-Private Partnership (PPP) approach in
water system development.
6.5 ISSUES AND CHALLENGES
The sector‘s weak ability to respond to the water needs of the population and
problems related to sanitation, sewerage and wastewater management is due to
a fragmented institutional environment, weak regulatory framework, inadequate
support for service providers and utilities and weak access to financing and
investments.
The biggest concern that besets the provincial government is the unavailability of
water sources to tap for reservoirs since most water rights have been allocated
for various purposes. As of December 2011, the NWRB has granted water rights
to 32,759.17 entities in the province for domestic/municipal, industrial/
commercial, irrigation, recreational and other purposes (Table 6.5-1, Figures
6.5-1 & 6.5-2).
Table 6.5-1 Allocation of water rights by source and purpose, Cavite, 2011
Source
Liters per second
Domestic/
Municipal
Commercial/
Industrial Recreation Irrigation Livestock Others Total
Spring 200.05 0.20 8.25 208.50
Surface 28,345.26 28,345.26
Deepwell 3,022.32 818.67 192.52 113.02 29.03 29.85 4,205.41
Total 3,222.37 818.87 200.77 28,458.28 29.03 29.85 32,759.17
Source: NWRB
Source: NWRB
Figure 6.5-1 Allocation of water rights by source and purpose, Cavite 2011
-
5,000.00
10,000.00
15,000.00
20,000.00
25,000.00
30,000.00
Domesti
c/ M
unicipal
Comm
ercia
l/ Ind
ustria
l
Recre
ation
Irrig
ation
Livest
ock
Others
Spring
Surface
Deep well

Cavite Integrated Water Resource Management Master Plan
6-10
Source: NWRB
Figure 6.5-2 Allocation of water rights by source and purpose,
Cavite 2011 (without surface water)
Surface water is used solely for irrigation while water from springs is
predominantly used for domestic/municipal purposes. Groundwater from deep
wells has the widest variety of usage ranging from domestic to industrial and
irrigation (Figure 6.5-3).
Source: NWRB
Figure 6.5-3 NWRB-granted Groundwater Rights, Cavite, December 2011
-
500.00
1,000.00
1,500.00
2,000.00
2,500.00
3,000.00
3,500.00
Domestic/ Municipal
Commercial/ Industria
l
Recreation
Irrigation
LivestockOthers
Spring
Deep well
NWR B -g ranted Ground Water R ig hts , C avite, D ec 2011
C ommerc ia l,
54.29, 1%
Industria l,
835.28, 20%
Domestic /
Munic ipa l
Dema nd,
2959.03, 71%
L ivestoc k,
26.91, 1%R ec rea tion,
192.52, 5%
Irrig a tion,
118.29, 3%

Cavite Integrated Water Resource Management Master Plan
6-11
With the changing land use in Cavite from agricultural to industrial, there is a
possibility that some water rights are no longer used for the very purpose they
were granted. The question then is whether unused water rights can be revoked
and put to better use.
Article 29 of the Water Code stipulates that water permits may be revoked after
due notice and hearing on grounds of: (i) non-use; (ii) gross violation of the
conditions imposed in the permit; (iii) unauthorized sale of water; (iv) willful failure
or refusal to comply with rules and regulations or any lawful order; (v) pollution;
(vi) public nuisance; or (vii) acts detrimental to public health and safety; (viii)
when the appropriator is found to be disqualified under the law to exploit and
develop natural resources of the Philippines; (ix) when, in the case of irrigation,
the land is converted to non-agricultural purposes; and (x) other similar grounds.
Allocation of water rights, especially for domestic use, is imperative in light of the
threat of unregulated and increased well-drilling of groundwater resources. There
is a need to diversify water distribution systems and sourcing, and reduce
inefficiencies in distribution and consumption.22
Other issues are as follows:
1. Institutional Fragmentation: Planning is uncoordinated and there is a lack of monitoring due to the absence of a national government department responsible for translating government policies, strategies and goals into a comprehensive water supply program. There is not enough change in government agencies programs to specifically develop capabilities of the LGUs to perform devolved functions (e.g. establishing and operating water utilities, financing capital and O&M cost, tariff setting and regulations). Further, existing Water and Sanitation (WATSAN) masterplan is either outdated, or worse, nonexistent. Finally, there is a lack of reliable data or absence of systematic and regular monitoring activities (in all levels) and little coordination in planning for both urban and rural areas per municipality.
2. Inadequate Support to Rural Water Supplies: Support in terms of technical design criteria, project financing, management, operation and maintenance. The LGU Planning Unit as a whole provides planning for both the urban and rural areas, unless a private corporation is involved. Lack of comprehensive programs to guide the development of rural water supply is due to limited capacity and mandate (e.g. LWUA, DILG-WSSPMO) to provide support services to Water Sanitation Programs.
3. Low Tariff and Cost-Recovery Level: Water utilities are not able to sustain operation and expand coverage. Water tariff structures and setting methodologies differ across individual service providers. Implemented tariffs are not enough for the majority of the WSPs to recover recurrent cost and accumulated sufficient reserves to fund new capital development. The lack of detailed guidelines, guidance and assistance in tariff setting and problems
22
United Nations Economic And Social Commission For Asia And The Pacific, Pro-Poor Water And Wastewater Management In Small Towns, Integrated Water Management In Baguio City, Philippines

Cavite Integrated Water Resource Management Master Plan
6-12
with collection efficiency as well as political will to set and implement appropriate tariff levels.
4. Weak and Fragmented Regulatory Framework: Lack of transparency regarding performance and benchmarking information for individual providers make it difficult to hold service providers accountable for service improvement as well as effective implementation of regulation. There is a need to make water service providers accountable to consumers with expanded access, efficient use of revenues and improved service quality.
5. Low Performance of Water Utilities: Water service providers do not perform satisfactorily. Slow service expansion and low coverage, high Non-Revenue Water (NRW) levels, and requirements for subsidies by the majority of service providers. Both RWSAs and BWSAs and cooperatives suffer from lack of technical and managerial capacity, unable to retain skilled staff and absorb the technical assistance given. Moreover, even utilities of LGUs lack technical, financial and management capabilities, and autonomy with regard to political interference in management decisions.
6. Investment and Financing: Low public and private sector investment in the water supply sector, which resulted into, limited access to financing for service expansion of small utilities.
7. Lack of WSS Sector Information: There is a need to continuously update the existing provincial water supply and sanitation master plan. This is to ensure continuous updating of the existing information base and to make sure that there is sufficient reliable data and systematic and regular monitoring sector activities in the municipalities by the Local Government Units.
8. Improper and Inadequate Utilization of Water Rights : In line with the need to continuously keep abreast of developments in the sector, there is a need to bring the allocation of water rights up to date with current realities. For instance, in view of the decreasing size of irrigable land areas, water rights that have been allocated for agriculture remain largely unutilized or underutilized. In the same breath, parties without water rights resort to illegal and extralegal means to supply their demand, leading to an unfavourable situation wherein water resources are unmonitored and become unaccounted for. This situation is best illustrated in Table 6.5-2 - Irrigation Water Rights Granted vs. Estimated Water Requirements. It is worthy of note that the original service area of the Cavite Friar Land Irrigation System (CFLIS) of 15,000 hectares has been reduced to 8,618.09 hectares (57.4%) in 2010 due to land conversion, but the original water right allocation of 22,278 lps was not adjusted. Moreover, the total irrigated areas developed by the private systems, as of 2010, totaled 5,493 hectares. However, the total water rights granted is only 581 lps, only enough to serve about 468 hectares. It shows that roughly 70% of the private systems irrigated area do not have actual water right allocation.

Cavite Integrated Water Resource Management Master Plan
6-13
Table 6.5-2 Irrigation Water Rights Granted vs. Estimated Water Requirements Province of Cavite
Hectares
Allocated
Water
Rights @
1.5 lps/ha
Firmed Up
Service Area
(Hectares)
Water Rights
Granted, lps
Estimated
Water
Requirements
(lps) @ 1.5
lps/ha
Estimated
Water
Requirements
(lps) @ 1.24
lps/ha
Remarks
National Irrigation
System 15,000 22,278 8,618.09 22,278.00 12,927 10,686
9,351 11,592 With
excess
Communal
Irrigation Systems 430.63 526.73 646 534
(119) (7) Deficit
Private Systems 5,492.86 580.90 8,239 6,811
(7,658) (6,230) No water
rights
Total 14,541.57 23,385.63 21,812 18,032
1,573 5,354 Total
excess Source: NIA - Naic, Cavite SEPP 2010
About 734 MLD of surface water can be generated from excess of NIA and illegal
water rights used by the private sector.
The province of Cavite also acknowledged the highly sectoral orientation in its
institutional response to water governance. Inter-agency collaboration is limited
by the agencies‘ mandates (e.g., water quality testing, technical assistance in
water infrastructure development, etc.). There is no single agency that
coordinates local water policy-making, planning and actions. However, with the
creation of the Cavite Integrated Water Management Plan, management of water
resources and services would hopefully improve.
6.6 LEGAL FEASIBILITY OF THE PROPOSED SOURCES OF WATER FOR THE INTERGRATED WATER RESOURCE MANAGEMENT PLAN
6.6.1 Aggregation of Water Rights
There is a disconnection between water rights applied for and granted within the
Province of Cavite with actual demand. This is mainly to the lack of an integrated
water management plan to guide the coordination of the water resource
allocation.
The Water Code provides several ways to do this by application for water rights,23
individual revocation, (mass application for terminated water rights)24, mass
revocation/modification for a project of greater beneficial use,25 transfer of
rights26.
23
Articles 2 and 7 of the Water Code 24
Articles 20 and 89 of the Water Code 25
Article 89 of the Water Code 26
Article 19 of the Water Code

Cavite Integrated Water Resource Management Master Plan
6-14
6.7 RECOMMENDED INSTITUTIONAL ARRANGEMENT
The provincial government has since then taken some steps to address the
issues on regulation and financing of water utilities. The Cavite Integrated Water
Resource Management Master Plan emphasizes the urgency of taking on the
following challenges:
1. Improving the institutional environment through strengthening of economic
and resource regulation, integrated sector planning and strengthening of the
institutional support systems of sector agencies;
2. Developing the capacity of sector agencies through a national agency
program shift towards support for LGUs and WSPs, sustaining capacity
development programs and appropriate technologies;
3. Building alliances among development champions in the executive and
legislative branches of government, public and private sector institutions and
between agencies and civil society organizations; and
4. There may also be a need for the government of the Province of Cavite to
enter into a Memorandum of Understanding with the NWRB, so that certain
regulatory and monitoring functions can be devolved to the Provincial
Government, similar to the Bohol Integrated Water Management Board.
6.7.1 Creation of a Cavite Water Resources Management Committee (CWRMC)27
Similar to the issues at the national level, the uncontrolled use of groundwater is
partly due to the absence of an integrated local water regulatory framework.
There is no agency or office that gathers, synthesizes and analyzes data on
water extraction in relation to issuance of permits for well drilling and water
sourcing.28A local mechanism to share responsibilities with NWRB is needed.
The NWRB, with its current constraints in terms of financial and human
resources, recognized the need to collaborate and partner with different agencies
in order to effectively manage the water resources of the country.
Under Article 80 of the Water Code of the Philippines, the Board may deputize
any official or agency of the government to perform any of its specific functions or
activities. Since NWRB does not have regional offices, deputized agencies were
created through a Memorandum of Understanding between NWRB and agencies
such as NIA, DPWH, NPC and WDs to perform some of its functions. The
NWRB has implemented LGU deputation in Bohol to strengthen its presence in
27
Abano, Susan, NWRB, Devolving Functions And Sharing Power With Lgus, Managing Water Resources For Sustainability And Equity, March 11, 2009, http://wwf.org.ph/wwf3/downloads/publications/abano.devolvingfunctionsandsharingpower.pdf 28
United Nations Economic And Social Commission For Asia And The Pacific, Pro-Poor Water And Wastewater Management In Small Towns, Integrated Water Management In Baguio City

Cavite Integrated Water Resource Management Master Plan
6-15
the area. A similar model may be followed by the Province of Cavite while
retaining the ultimate regulatory functions with the NWRB.
The CWRMC will be a permanent inter-agency committee which shall ensure that
the CIWRMP of the Province of Cavite will be implemented properly, with specific
focus on ensuring the rational allocation of water rights based on the CIWRMP.
The main function of the CWRMC is to clear all water rights applications within
the Province of Cavite for compliance and consistency with the CIWRMP. The
Clearance from the WRCH shall be a prerequisite before the NWRB gives due
course to an application for water rights within the Province of Cavite and
subsequently approve the application if meritorious.
The Clearance from the CWRMC will be indispensable in the water rights
application process, without which the NWRB will not grant rights. However,
clearance from the CWRMC will not be definitive and the NWRB may deny water
rights applications already cleared by the WRCMC, if it finds convincing proof of
the absolute lack of merit of the application.
In addition, the CWRMC shall monitor continued compliance of water rights
holders with the CIWRMP, and shall initiate actions for the nullification of non-
compliant parties before the NWRB. Deputized agents have the following
responsibilities:29
1. Accept, process, investigate and submit reports to the NWRB for its proper
action with recommendations on water permit application;
2. Investigate and submit reports to the NWRB for its proper action with
recommendations on water use controversies referred by NWRB within the
respective territorial jurisdiction;
3. Conduct continuing inventory of different users of water and other water
resources development activities in their respective jurisdiction in
conformance with the provisions of the Water Code and submit its findings to
the to the NWRB for its proper action;
4. Conduct monitoring of well drilling activities in respective jurisdictional area
and submit reports to the NWRB for its proper action;
5. Monitor and validate compliance by water permittees with the conditions
imposed in the water permits and submit reports to the NWRB for its proper
action;
6. Notify NWRB of violations by water appropriators and illegal drilling activities
for the issuance of Notice of Violation (NOV) and Cease and Desist Orders
(CDOs);
29
Abano, Susan, NWRB, Devolving Functions And Sharing Power With Lgus, Managing Water Resources For Sustainability And Equity, March 11, 2009, http://wwf.org.ph/wwf3/downloads/publications/abano.devolvingfunctionsandsharingpower.pdf

Cavite Integrated Water Resource Management Master Plan
6-16
7. Conduct water resources assessment and other related studies with the
assistance of NWRB;
8. Undertake information, education and communication campaigns to key
stakeholders regarding the Water Code of the Philippines and its
Implementing Rules and Regulations;
A Memorandum of Agreement (MOA) should be entered into between the
Province of Cavite and the NWRB for the establishment of the WRCMC and to
set forth its powers and functions in relation to the NWRB. The MOA will be in
accordance with the devolution of functions of the NWRB pursuant to Section 17
of the Local Government Code.
The CWRMC will better serve the purposes of the Province of Cavite since it
wishes to enter into a Joint Venture ("JV") Agreement with a private entity for
purposes of the Bulk Water Supply Project. The conflict of interest on the part of
the province that may arise from controlling both the regulatory and operational
body will be avoided.
6.7.2 Entering into Public-Private Partnerships
Nonetheless, implementation of the Cavite Integrated Water Management Plan must be done with the private sector which can provide financial resources, technology, technical expertise and operating competence. The PPP model also mitigates the fiscal and resource limitations of the Province, thus allowing the allocation of LGU resources for other priority needs.30
Further, the PPP model provides flexibility in management of LGU assets, market-based charges for greater service sustainability, professionalization of personnel and organizational structures, profit motivation impetus to ensure efficiency and effectiveness in service delivery, and protection of projects from possible adverse political interferences in service delivery.31
According to the PPP Code of the Province of Cavite, there are 16 PPP
Modalities available to it:
1. Build-and-Transfer (BT); 2. Build-Lease-and-Transfer (BLT); 3. Build-Operate-and-Transfer (BOT); 4. Build-Own-and-Operate (BOO); 5. Build-Transfer-and-Operate (BTO); 6. Contract-Add-and-Operate (CAO); 7. Develop-Operate-and-Transfer (DOT); 8. Rehabilitate-Operate-and-Transfer (ROT); 9. Rehabilitate-Own-and-Operate (ROO); 10. Concession Arrangement; 11. Joint Venture (JV); 12. Lease or Affermage; 13. Management Contract;
30
Page 16, Volume 1 of the PPP Manual for LGUs 31
ibid.

Cavite Integrated Water Resource Management Master Plan
6-17
14. Service Contract; 15. Divestment or Disposition; and 16. Corporatization.
While these options are available to the Province of Cavite, there are certain
approval requirements which must be taken into consideration (Table 6.7-1).
Table 6.7-1 Levels of Approval of LGU Project
Levels Description
President
• All Build-Operate-Own projects and other schemes not defined in Section 2 of RA 7718, subject to the recommendation of the NEDA Board’s Investment Coordination Committee
Investment Coordination Committee (ICC)
• Local projects costing above Php200 million
• All unsolicited proposals under the BOT Law regardless of project cost
Regional Development Council (RDC)
• Local projects costing above Php50 million up to PhP200 million
City Development Council (CDC)
• Local projects costing up to Php50 million
Provincial Development Council (PDC)
• Local projects costing above Php20 million up to Php50 million
Municipal Development Council (MDC)
• Local projects costing up to Php20 million
Source: Section 2.7 of the RA 7718
Further, the relevant local office and committees for PPP are:
Table 6.7-2 Relevant Local Offices and Committees for PPP32
LGU Office/Committee
Lead Officer Responsibilities
Office of the Local Chief Executive
Governor or Mayor
Oversee the preparation of the local development plans, prioritization of projects, including those for PPP implementation; and shepherding the process of project development to approval, procurement, implementation and monitoring and evaluation.
Provincial, City and Municipal Planning and Development Office
Planning and Development Coordinator
Formulate integrated economic, social, physical and other development plans and policies for consideration of the LDC;
Provincial, City and Municipal Engineering Office
Engineer Initiate, review and recommend changes in policies and objectives, plans and programs, techniques, procedures and practices in
32
Page 11, Volume 1 of the PPP Manual for LGUs

Cavite Integrated Water Resource Management Master Plan
6-18
LGU Office/Committee
Lead Officer Responsibilities
infrastructure development and public works of the local government unit concerned
Provide engineering services to the local government unit concerned, including investigation and survey, engineering designs, feasibility studies and project management
Provincial, City and Municipal Local Economic and Investment Promotion Office
Local Economic and Investment Promotion Officer (LEIPO)
Prepare, coordinate and execute local economic and investment promotion policies, projects and activities at the provincial, city and municipal
levelHead the PPP Sub-Committee as per DILG MC No. 2010-113.
Provincial, City and Municipal PPP Sub- Committee
Local Economic and Investment Promotion Officer
Assist in the formulation of action plans and strategies related to the implementation of PPP
programs and projectsThe PPP Sub-Committee is headed by the LEIPO in Provinces and Cities. In Municipalities, however, the Local Chief Executive designates a staff under the Office of the Mayor to head the Sub-Committee
Provincial, City and Municipal Pre-qualification, Bids and Awards Committee
The Chairperson should be at least a third ranking regular official of the LGU
Responsible for all aspects of the pre-bidding and bidding process of solicited proposals and comparative bidding process of unsolicited proposals
Provincial, City and Municipal Development Council
Planning and Development Coordinator
Appraise and prioritize socioeconomic
development programs and projectsCoordinate, monitor, and evaluate the implementation of development programs and projects
Endorse to the Sanggunian a PPP project that has passed the review and appraisal process
Provincial, City and Municipal Sanggunian
SanggunianConvenor Issue a resolution approving PPP projects and contracts
6.7.3 Legislative Agenda for the Province of Cavite
The Province of Cavite may enact Resolutions for the following purposes in order to implement the CIWRMMP:
Selective Revocation of Existing Water Permits
The selective revocation of existing water permits, which are held by several water supply operators, is necessary for the integration of water resources under the CIWRMMP. At its core, the revocation of these water permits is analogous to a right-of-way taking, which may be done through any of the following ways or a combination of: negotiation with individual water rights holders for the transfer of water rights, individual revocation or a mass revocation in favor of a project for greater beneficial use.

Cavite Integrated Water Resource Management Master Plan
6-19
Revocation of water permits may be achieved either by: (a) individually revoking water permits of each water supply operators; or (b) mass revocation of water permits pursuant to the Water Code (PD 1067).
The individual revocation of permits may be ordered by the NWRB, after notice and hearing, upon the grounds enumerated in the Water Code or its IRR such as non-use, water wastage or violations against the code.
In the case of mass on the other hand, NWRB may terminate the water permits in favor of the Province of Cavite on the ground that it shall, under the CIWRMMP, undertake a project for greater beneficial use or for multi-purpose development. The Resolution shall, in this case, provide for just compensation of the holder which shall suffer the revocation. The compensation may be front-loaded by the PPP partner and later deducted from the revenue stream of the Province.
Either modes of revocation will entail risks. In the case of individual revocation, the process will involve a lengthier procedure since after each individual revocation, the Province of Cavite, and/or the PPP partner will still have to apply for the water permits. It shall be considered a new application, with the usual requirements and procedures. On the other hand, while mass revocation may be ordered summarily, considering the number of parties involved, it may become a complicated process with several parties opposing the initiative. Ensuring that only those water rights that are partially utilized will be terminated, where practicable, may soften the opposition to the mass revocation procedure. Further it must also be ensured that qualified revocation of irrigation water rights permits, to the extent that these are unutilized, are given special attention considering the strong community opposition this may entail. Note further that mass revocation is in the nature of an eminent domain taking which entails compensation. Hence, there must be a clear benchmarking of the value of an unutilized water rights permit. Partnering with Existing Water Rights Holders/Transfer of Water Rights
The Province of Cavite, instead of seeking the revocation of said water rights, may also opt to directly negotiate the transfer of the water rights, as well as the operation and management of the water supply system, from existing holders/water districts. The transfers shall be in consideration for an allocation in the revenue share of the province. Authority to Negotiate/ Enter into Memoranda of Agreement
In order to facilitate transactions necessary for the integration of water resources under the CIWRMMP, it would be beneficial to designate an authorized representative, particularly the Governor of the Province of Cavite, to negotiate with private entities for the following purpose: (1) negotiation with water districts for the terms of the transfer of their existing water rights; (2) establishing a PPP Sub-Committee in the Local Development Council to assist in the development of strategies and plans for PPP;33 (3) negotiation with private entities for the
33
DILG MC No. 2011-16, in particular, recognizes the need to facilitate the ―localization of the mandated
powers and functions of the PPP Center‖ and, thus, enjoins all Local Chief Executives to establish a PPP
Sub-Committee in the Local Development Council that would, among others, ―assist the Local Development

Cavite Integrated Water Resource Management Master Plan
6-20
possibility of entering into a PPP to implement the CIWRMMP and integrate the water resources of the Province of Cavite; (4) Authority to enter into Memoranda of Agreement with various government agencies to establish the CWRMC; (5) authority to represent the Province in its negotiation with the NWRB to allow the mass revocation of unutilized water rights and transfer these to the Province of Cavite; and (6) negotiation and execution of all other transactions pursuant to, and in furtherance of, the CIWRMMP.
Establishment of a Water Rights Clearing House and Management
Committee
In order to effectively implement the CIWRMMP, the Province of Cavite may
establish a Water Resource Management Committee (CWRMC), for the purpose
of rationalizing the use and development of water resources in the province. The
functions of the WRCH will include, among others: (1) confirming and examining
the compatibility of existing water rights with the CIWRMMP; and (2) ensuring
that all water rights heretofore granted shall be in conformity with the CIWRMMP.
As discussed above, Memoranda of Understanding must be entered into by the
Province of Cavite to establish this permanent inter-agency committee.
Review of State of Groundwater Extraction
As part of the review and monitoring function of the CWRMC, the state of
groundwater supply-demand situation in the entire province should be reviewed
and the declaration of identified municipalities as ―critical areas‖ should be
undertaken to mitigate the adverse effect of over-extraction.
Council (LDC) in the formulation of action plans and strategies related to the implementation of PPP
programs and projects.‖ (page 9, Volume 1 PPP Manual for LGUs)

Cavite Integrated Water Resource Management Master Plan
7-1
CHAPTER 7 POLICIES, STRATEGIES AND PROGRAMS AND PROJECTS
7.1 POLICIES
The Provincial Government of Cavite shall be guided by the following policies for
the integrated development and management of its water resources:
Provide the whole population of Cavite Province access to safe and potable
water and basic sanitation
Optimize the use of available water through a more rationalized allocation of
resources and water rights based on need and usage
Improve health outcomes and effect a sustainable environment through
improved sanitation, septage, and sewerage systems provision particularly in
highly urbanized and/or densely populated areas
Encourage private sector participation in the financing, implementation and/or
operation of water resources development and management projects and other
related undertakings of the Cavite Provincial Government
7.2 STRATEGIES
To achieve the policies defined and established above, the following strategies shall be carried out:
Development of new water supply sources based on a viable provincial land
use plan, to include as well importation of water from nearby provinces, to
meet increasing demand that are sustainable, stable, reasonable and which will
provide equitable and affordable water supply for all end users
Enable the participation of concerned service providers in plan development, programming and operations, among others, in order to improve coverage, efficiency and sustainability of related infrastructure
Enactment of legislation/ordinance to introduce financing innovation for the implementation of sewerage and septage system projects, that will link these services to revenue-generating water service provision in order to facilitate investment cost recovery.
Establishment of an effective and clear monitoring system to assess and address the sustainability of developed related infrastructure
Imposition of an environmental user‘s fee, particularly on those without water rights, and which shall be based on the cost of replenishment and rehabilitation of the affected water bodies.
Introduction and/or enactment of appropriate legal instrument to address institutional and regulatory issues relating to the integrated management and development of the province‘s water resources.

Cavite Integrated Water Resource Management Master Plan
7-2
Stimulation of growth in rural areas to curb rural-urban migration that has led to increasing pressures in ecosystems and water bodies as well as unsustainable land use practices in urban areas.
Promotion of environmental education, particularly in water resource management, to enable people to appreciate and understand the complexity of environment and their roles and responsibilities in sustainable water resource management.
Resource regulation shall be strengthened to ensure that surface and ground water supply sources are sustainably developed, managed and utilized.
7.3 PROGRAMS AND PROJECTS
In support of the established policies and strategies of the Cavite Provincial
Government for an integrated management and development of the province‘s
water resources, the following programs and projects are envisioned to be
implemented within the short, medium and long term development horizons:
Program/Project Description Estimated Cost
(P Billion)
Short Term Development Works (1-3 years)
Surface water development Abstraction from river sources and provision of treatment plant and transmission facilities as well as other necessary facilities
5.0
Groundwater Development and Management
Abstraction of water through deep wells and springs and provision of pump stations, pipelines and other support facilities.
6.5
Water distribution system development and expansion
(a) Provision of Level I water supply systems, (b) provision of Level II water supply systems and (iii) provision of Level III water supply systems and expansion of existing area coverage
1.0
Measurement and monitoring of water efficiency
Engineering studies and provision of monitoring equipment
0.003/year
Reduction of Non-revenue water NRW reduction within WSP service area 0.15/year
Water productivity measurement Financial and Economic studies and provision of monitoring systems and equipment
0.006/year
Water pricing Establishment of water pricing mechanism to be adopted by service providers and consumers
0.007/year
Metering Provision of production meters, supply meters and consumer meters
(Included in system
development costs)
Irrigation scheduling Engineering studies and provision of monitoring equipment
0.006/year
Sewerage and Septage
Provision of sewerage and septage collection and treatment facilities
6.0

Cavite Integrated Water Resource Management Master Plan
7-3
Program/Project Description Estimated Cost
(P Billion)
Medium Term Development Works (3-6 years)
Surface water development and Expansion
Abstraction from river sources and provision of treatment plant and transmission facilities as well as other necessary facilities
7.0
Water distribution system development and expansion
(a) Provision of Level I water supply systems, (b) provision of Level II water supply systems and (iii) provision of Level III water supply systems and expansion of existing area coverage
4.0
Rainwater/storm water harvesting and reuse
Provision of technology and designs for domestic households. Construction of impoundment reservoirs to augment supply
4.0
Measurement and monitoring of water efficiency
Engineering studies and provision of monitoring equipment
0.003/year
Reduction of Non-revenue water NRW reduction within WSP service area 0.15/year
Water productivity measurement Financial and Economic studies and provision of monitoring systems and equipment
0.006/year
Water pricing Establishment of water pricing mechanism to be adopted by service providers and consumers
0.007/year
Irrigation scheduling Engineering studies and provision of monitoring equipment
0.006/year
Long Term Development Works (6-10 years)
Surface water development and expansion
Abstraction from river sources and provision of treatment plant and transmission facilities as well as other necessary facilities
28.0
Managed aquifer storage, recharge areas, water balance
Reforestation. Protection of watershed areas. Declaration of areas as protected areas
1.0
Reduction of water pollution Management solid waste through construction of MRF, and disposal facilities. Continuing education campaign and segregation.
2.0
Water distribution system development
(a) Provision of Level I water supply systems, (b) provision of Level II water supply systems and (iii) provision of Level III water supply systems and expansion of existing area coverage
2.0
Measurement and monitoring of water efficiency
Engineering studies and provision of monitoring equipment
0.003/year
Reduction of Non-revenue water NRW reduction within WSP service area 0.15/year
Water productivity measurement Financial and Economic studies and provision of monitoring systems and equipment
0.006/year
Water pricing Establishment of water pricing mechanism to be adopted by service providers and consumers
0.007/year
Irrigation scheduling Engineering studies and provision of monitoring equipment
0.006/year