Catastrophic Health Expenditure in Vietnam - DiVA...
133
Umeå University Medical Dissertations New Series No: 1673 ISBN: 978-91-7601-129-4 ISSN: 0346-6612 Catastrophic Health Expenditure in Vietnam Studies of Problems and Solutions Curt Löfgren Department of Public Health and Clinical Medicine Epidemiology and Global Health Umeå University Umeå 2014
Transcript of Catastrophic Health Expenditure in Vietnam - DiVA...
Umeå University Medical Dissertations New Series No: 1673 ISBN: 978-91-7601-129-4 ISSN: 0346-6612
Catastrophic Health Expenditure in Vietnam Studies of Problems and Solutions
Curt Löfgren
Department of Public Health and Clinical Medicine Epidemiology and Global Health Umeå University Umeå 2014
Responsible publisher under Swedish law: The Dean of the Medical Faculty This work is protected by the Swedish Copyright Legislation (Act 1960:729) New Series No: 1673 ISBN: 978-91-7601-129-4 ISSN: 0346-6612 Photo on the cover page: Cẩm Tú Nguyễn Elektronic version available at http://umu.diva-portal.org/ Printed by: Print & Media, Umeå University Umeå, Sweden 2014


Table of Contents Table of Contents i Abstract iii Original Papers v List of tables and figures vi List of abbreviations viii Introduction 1 Background 3
Fairness in health financing – – one of the three key objectives for health systems 3 Catastrophic health expenditure and impoverishment 5 Health financing in Vietnam 9
From reunification to Doi Moi 9 Doi Moi and the economic development following the reforms 10 Doi Moi and the health sector 13 Health insurance 18
Objectives 23 Specific objectives 23
Materials and methods 25 Data Sources 25 Catastrophic health expenditure and impoverishment 26 Doing estimations of catastrophic health spending in cross-sectional and longitudinal studies (Paper I) 29 Studying catastrophic health spending in a vulnerable group – – the elderly (Paper II) 31 Studying if a health insurance reform improves the situation for those insured (Paper III) 34 Studying how people value health insurance (Paper IV) 36 Ethical approval 39
Results 41 Comparing catastrophic health expenditure estimated from three different data sets (Paper I) 42 Catastrophic health expenditure and impoverishment for the elderly (Paper II) 44 The effects of a health insurance reform for the poor (Paper III) 50 The value of health insurance (Paper IV) 54
Discussion 57 Methodological considerations 57
Household total expenditure as a basis for estimating catastrophic spending 57 Estimating catastrophic health spending – a limited view. 58 Statistical methods 59
i
Studying willingness to pay 60 The Bavi district versus the nation as a whole 61
Main findings 63 Are the estimates of catastrophic spending overestimated? 64 Using studies of catastrophic health spending to identify vulnerable groups 66 Studying the effects of health insurance on health spending and utilization 68 How could health insurance work better? 70
Concluding remarks 73 Epilogue 75 Acknowledgements 77 References 83 Annexes 93
Annex 1. The FilaBavi questionnaire 93 Annex 2. FilaBavi yearlong study (2001/2002) questionnaire 109 Annex 3. The questionnaire for the willingness to pay study 117 Annex 4. The VHLSS questionnaire 120
ii
Abstract
Background: In Vietnam, problems of high out-of-pocket payments for health, leading to catastrophic health expenditure and resulting impoverishment for vulnerable groups, has been at focus in the past decades. Since the beginning of the 1990’s, the Vietnamese government has launched a series of social health insurance reforms to increase prepayment in the health sector and thereby better protect the population from the financial consequences of health problems.
Objective: The objective of this thesis is to contribute to the discussion in Vietnam on how large the problems of catastrophic health expenditure are in the population as a whole and in a special subgroup; the elderly households, and to assess important aspects on health insurance as a means to reduce the problems.
Methods: Catastrophic health expenditure has been estimated, using an established and common method, from two different data sources; the Epidemiological Field Laboratory for Health Systems Research (FilaBavi) in the Bavi district, and Vietnam Household Living Standards Survey (VHLSS) 2010. Results from two cross-sectional analyses and a panel study have been compared, to gain information on whether the estimates of catastrophic health spending may be overestimated when using cross-sectional data. Then, the size of the problem for one group, the elderly households; hypothesized to be particularly vulnerable in this context, has been estimated. The question of to what extent a health insurance reform; the Health Care Funds for the Poor (HCFP), has offered protection for the insured against health spending is being assessed in another study over the period 2001 – 2007, using propensity score matching. The value that households attach to health insurance has also been explored through a willingness to pay (WTP) study.
Results: Comparing results from two cross-sectional studies with a panel study over a full year in which the respondents were interviewed once every month, the estimates of catastrophic spending vary largely. The monthly estimates in the panels study are half as large as the cross-sectional estimates; the latter also having a recall period of one month. Among the elderly households, catastrophic health spending and impoverishment are found to be problems three times as large as for the whole population. However, household health care expenditure as a percentage of total household expenditure was affected by the HCFP, and significantly reduced for the insured. In the study of household WTP for health insurance, it was
iii
found that households attach a low value to this insurance form; WTP being only half of household health expenditure.
Conclusions: Cross-sectional studies of catastrophic spending with a monthly recall period are likely to be affected by recall bias leading to overestimations through respondents including expenditure in the period preceding the recall period. However, such problems should not deter researchers form studying this phenomenon. If using the same method, estimates of catastrophic spending and impoverishment can be compared between different groups – as for the elderly households – and over time; e.g. studying the protective capacity of health insurance. It should be used more, not less. The VHLSS rounds offer the Vietnamese a possibility to regularly study this. The HCFP were found to be partly protective but important problems remain to be solved, e.g. the fact that people are reluctant to use their health insurance because of e.g. quality problems and possible discrimination of the insured. The findings of a low WTP for health insurance may be another reflection of this.
Keywords: Catastrophic health expenditure, impoverishment, elderly, health insurance, Vietnam
iv
Original Papers
This thesis is based on the following papers, referred to as Papers I-IV
I. Nguyen Thi Bich Thuan, Curt Lofgren, Nguyen Thi Kim Chuc, and Lars Lindholm. Are the Estimates of Catastrophic Health Expenditure Among a Rural Population too High? A Comparison of Studies in Vietnam. The Open Public Health Journal.2008; 1:25-31.
II. Curt Lofgren, Hoang Van Minh, Nguyen Xuan Thanh, Anna-Karin Hurtiga, Lars Lindholm, and Klas-Göran Sahlén. Catastrophic Health Expenditure and Impoverishment among the Elderly Households in Vietnam. (Manuscript.)
III. Nguyen Xuan Thanh, Curt Löfgren, Ho Dang Phuc, Nguyen Thi Kim Chuc, Lars Lindholm. An assessment of the implementation of the Health Care Funds for the Poor policy in rural Vietnam. Health Policy. 2010; 98:58–64.
IV. Curt Lofgren, Nguyen X Thanh, Nguyen TK Chuc, Anders Emmelin, and Lars Lindholm. People's willingness to pay for health insurance in rural Vietnam. Cost Effectiveness and Resource Allocation. 2008;6:16.
The original papers are reproduced in this thesis with permissions from the publishers.
v
List of tables and figures
Table 1. Private and out-of-pocket health expenditure 2012 in different groups of countries according to national income per capita .......................................................................................... 6
Table 2. Annual GDP growth rate in Vietnam 1976 – 2013 ........................ 11 Table 3. The poverty rate in Vietnam 1984 – 2012 .....................................12 Table 4. The percentage of outpatient visits and inpatient
admissions to different health facilities 1993 – 2012 .................... 15 Table 5. Health expenditure data for Vietnam and middle income
countries ......................................................................................... 16 Table 6. Overview of the compulsory health insurance programmes ....... 18 Table 7. Health insurance coverage 1993 – 2012 ...................................... 19 Table 8. Size of groups enrolled in health insurance .................................. 19 Table 9. Health insurance coverage rate for different groups, 2011 .......... 20 Table 10. Overview of objectives, research questions, and data
sources ............................................................................................ 24 Table 11. The share of food from own production as a percentage of
total food consumption .................................................................. 30 Table 12. Explanatory variables in the binary logistic regressions ............. 32 Table 13. Households (hh) distributed over household total
expenditure quintiles ..................................................................... 45 Table 14. The percentage of household (hh) members that have
health insurance (HI) in elderly households ................................ 45 Table 15. Measures of private health expenditure load on households
(hh) .................................................................................................. 45 Table 16. Logistic regression of catastrophic health care spending
(models A and B), and impoverishment (models C and D) ......... 47 Table 17. The distribution of households being impoverished over
household expenditure quintiles ................................................... 49 Table 18. Household health care expenditure as % of total household
expenditure in the treated and control groups before matching .......................................................................................... 51
Table 19. Impact of the Health Care Funds for the Poor on the change of HCE/HTEXP between the different years, expressed in percentage points (pp) .............................................. 51
vi
Table 20. Household health care utilization in the treated and control groups before matching ................................................................. 52
Table 21. Impact of the Health Care Funds for the Poor on the change in health care utilization between the different years ................................................................................................ 53
Table 22. Household WTP for the two forms of health insurance, Vietnamese dong per month.......................................................... 55
Table 23 Average household health care expenditure in the Bavi district, July 2001 to June 2002, Vietnamese dong ..................... 55
Table 24. Average household willingness to pay for health insurance, and average household health care expenditure, Vietnamese dong ............................................................................. 71
Figure 1. Conceptual framework of financial effects of diseases/injuries on households in low and middle income countries ........................................................................................... 7
Figure 2. The scenario presented to respondents in the WTP study .......... 38 Figure 3. Estimates of catastrophic health expenditure from three
different datasets ............................................................................ 43 Figure 4. Odds ratios for impoverishment for households above the
poverty line ..................................................................................... 49 Figure 5. The estimated percentages of households experiencing
catastrophic health spending in three different studies .............. 64
vii
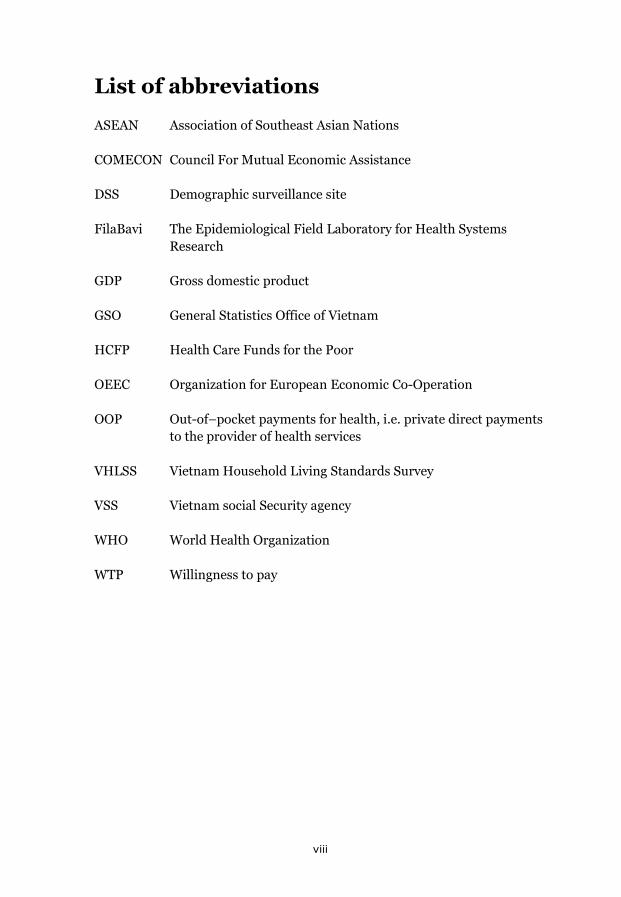
List of abbreviations
ASEAN Association of Southeast Asian Nations
COMECON Council For Mutual Economic Assistance
DSS Demographic surveillance site
FilaBavi The Epidemiological Field Laboratory for Health Systems Research
GDP Gross domestic product
GSO General Statistics Office of Vietnam
HCFP Health Care Funds for the Poor
OEEC Organization for European Economic Co-Operation
OOP Out-of–pocket payments for health, i.e. private direct payments to the provider of health services
VHLSS Vietnam Household Living Standards Survey
VSS Vietnam social Security agency
WHO World Health Organization
WTP Willingness to pay
viii
Introduction
The effects of the health financing system in Vietnam on the financial situation of households are the focus in this thesis. The transition, starting in the middle of the 1980’s, from a centrally planned economy to a socialist-oriented market economy, withdrew much of the collective funding to health care leading the system to predominantly rely on user fees and large private out-of-pocket payments. In the decade following the start of these economic reforms, so called household catastrophic health expenditure was estimated to be considerably higher in Vietnam than in other low- and middle income countries. Since the 1990’s the Vietnamese government has launched a series of health insurance reforms to increase prepayment and through that mitigate the problems of direct private payments when utilizing health care.
This thesis aims to contribute to the discussion about how large the problems of catastrophic health spending are in Vietnam and to assess important aspects of health insurance as means to reduce the problems. The size of catastrophic spending has been studied for a rural population and for a national sample where the situation for one particular group – the elderly – is focused on. One remedy, health insurance, has been studied in two ways. The effects of an implemented reform have been assessed and people’s valuation of health insurance alternatives has been estimated.
These studies are presented below. First, there is a background on how resource generation for health may create financial problems for households and measures used to study these problems. A background on health financing in Vietnam is also given. Then the objectives of the thesis are stated followed by a presentation of the methods used and the findings made. Finally, there is a discussion about the interpretation, relevance and limitations of methods and findings.
1

2
Background
Fairness in health financing – one of the three key objec-tives for health systems
The primary objective for a health system is of course to protect and improve the health of the population through preventive and curative actions. However, when the World Health Organization (WHO) in the World Health Report 2000 focused on the performance of health systems, two additional key, or final, objectives were specified: responsiveness and fair financing (World Health Organization [WHO], 2000). These three objectives in the report were considered to be the final goals of health systems in contrast to other – instrumental – goals that one strives to meet because they in their turn lead to one or several of the final goals.
Responsiveness is not about the health outcome but concerns how people are met or treated in health care (in other senses than the medical treatment). It includes the degree of respect for persons (dignity, confidentiality, and autonomy) and the degree of client orientation (e.g. prompt attention and adequate amenities). If the responsiveness is high in a health system – people are treated well – this may have health effects in comparison to a system with lower responsiveness. In this way, responsiveness would be an instrumental goal. But even without health effects, or more than the health effects, people have the right to be well treated in any social system, which constitutes the base for including responsiveness as a final goal. This may be particularly important for a health system that differs from other social systems in the sense that “ … illness itself, and medical care as well, can threaten people’s dignity and their ability to control what happens to them more than most other events to which they are exposed. Among other things, responsiveness means reducing the damage to one’s dignity and autonomy, and the fear and shame that sickness often brings with it” (WHO, 2000, p. 23).
The degree of fairness in health financing certainly has “instrumental” effects. To the extent that people less well-off cannot access health care because it is too expensive, this will be detrimental to the health of the population. But just as for responsiveness, over and above the health effects, fairness in financing is something that people have the right to expect from all social systems. Again, this may be particularly important for a health system. For those with no protection against the very large financial losses
3
that ill-health may cause, compared to the financial effects of most other events in life, a disease or an injury may be a catastrophe.
Health and responsiveness may be studied from both the perspective of effectiveness and the perspective of equity; how much health in total and which overall degree of responsiveness is being attained with the resources allocated to health care? What is the distribution of health in a population and what is the difference in responsiveness given to different social groups? For the final objective of fair financing, there is only one perspective; equity. However, for health financing there are also other instrumental objectives, such as creating financial incentives that promote an efficient use of health care resources.
In principle, a health system can be financed in two main ways; through prepayment via taxes and/or social or private health insurance or through out of pocket payments (OOP), i.e. direct private payments to providers of health services. A financing system that relies on prepayment has the potential for protection of the poor. Payments can be made proportional or even progressive in relation to income. An OOP system is regressive; the poor will likely pay proportionally more for the same services. There is broad consensus on the need for countries that today rely heavily on OOP payments to increase prepayment coverage of the population. As stated by Margaret Cahn, the director-general of WHO: “ … direct payments, including user fees, … [is] by far the greatest obstacle to progress. Abundant evidence shows that raising funds through required prepayment is the most efficient and equitable base for increasing population coverage” (WHO, 2010, p vi).
4
Catastrophic health expenditure and impoverishment
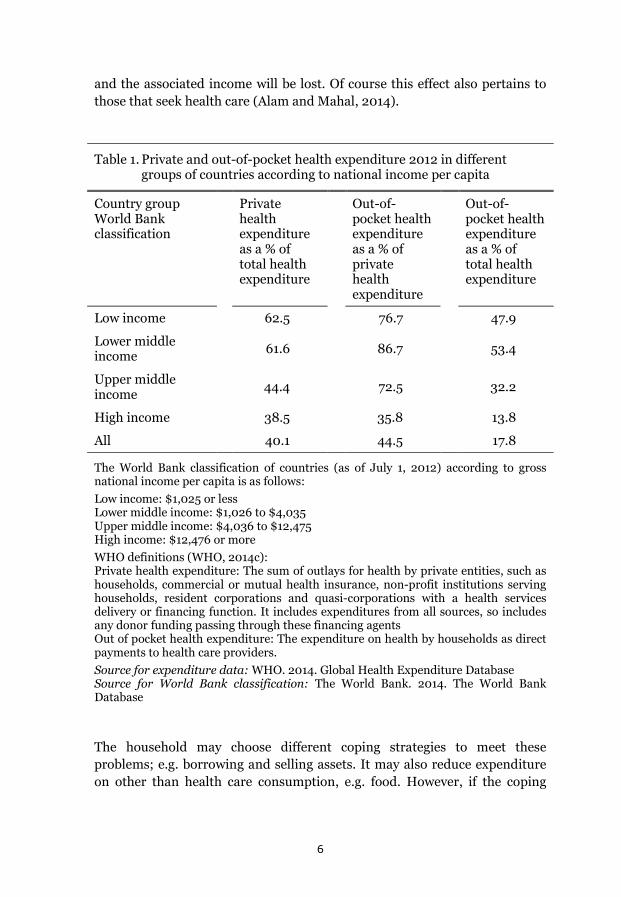
Large OOP payments for health care is a problem because people struck by disease or injury may risk a financial catastrophe or even impoverishment (Wagstaff, 2009). In a study of 185 countries Xu et al. (2010) finds that countries where the OOP expenditure on health is more than 20% of total health expenditure this may be an important problem. This applies to many low and middle income countries. In Table 1 the average private health expenditure and OOP payments for health in different country income groups are presented. The private health expenditure includes all payments from private entities including not only payments from households but also e.g. from private health insurance corporations and non-government organizations (a closer definition given in the footnote of the table).
In low- and middle income countries health care is, in this sense, privately financed; private health expenditure dominate. The problem here is that for these countries such a large part of this private expenditure on average is out of pocket; 70% – 90%. This means that for low income and lower middle income countries around half of total health expenditure on average is out of pocket.
The variation around the mean is large and for some countries OOP payments dominate heavily. In the World Health Report 2000 the following estimates, given as examples here, were reported: Nigeria 72%, Sierra Leone 90%, Cambodia 91%, and Vietnam 80% (WHO, 2000). Since then considerable work has been done in many countries to bring down the OOP payments. For Cambodia and Vietnam they are now (2012) down to 62% and 49% respectively of total health expenditure (WHO, 2014).
However, with the large OOP payments for health in low and middle income countries found also today there is a risk that this expenditure may be catastrophic and even lead to poverty. In figure 1 there is an illustration of this complex problem. One or several members of a household have a disease or injury. If they decide to seek health care, they will likely face having to pay substantial sums OOP. If these sums are above a certain threshold in relation to e.g. income or capacity to pay, the expenditure is considered catastrophic. The household members may alternatively decide not to seek health care. Health facilities may be non-accessible because the associated OOP payments are deemed too high. Then the household members pay another price – a possible deterioration of health compared to if health care had been accessed. But also in this second alternative there is a potential financial loss. If the health problems are severe enough labor days
5
and the associated income will be lost. Of course this effect also pertains to those that seek health care (Alam and Mahal, 2014).
Table 1. Private and out-of-pocket health expenditure 2012 in different groups of countries according to national income per capita
Country group World Bank classification
Private health expenditure as a % of total health expenditure
Out-of-pocket health expenditure as a % of private health expenditure
Out-of-pocket health expenditure as a % of total health expenditure
Low income 62.5 76.7 47.9
Lower middle income
61.6 86.7 53.4
Upper middle income
44.4 72.5 32.2
High income 38.5 35.8 13.8
All 40.1 44.5 17.8
The World Bank classification of countries (as of July 1, 2012) according to gross national income per capita is as follows: Low income: $1,025 or less Lower middle income: $1,026 to $4,035 Upper middle income: $4,036 to $12,475 High income: $12,476 or more WHO definitions (WHO, 2014c): Private health expenditure: The sum of outlays for health by private entities, such as households, commercial or mutual health insurance, non-profit institutions serving households, resident corporations and quasi-corporations with a health services delivery or financing function. It includes expenditures from all sources, so includes any donor funding passing through these financing agents Out of pocket health expenditure: The expenditure on health by households as direct payments to health care providers. Source for expenditure data: WHO. 2014. Global Health Expenditure Database Source for World Bank classification: The World Bank. 2014. The World Bank Database
The household may choose different coping strategies to meet these problems; e.g. borrowing and selling assets. It may also reduce expenditure on other than health care consumption, e.g. food. However, if the coping
6
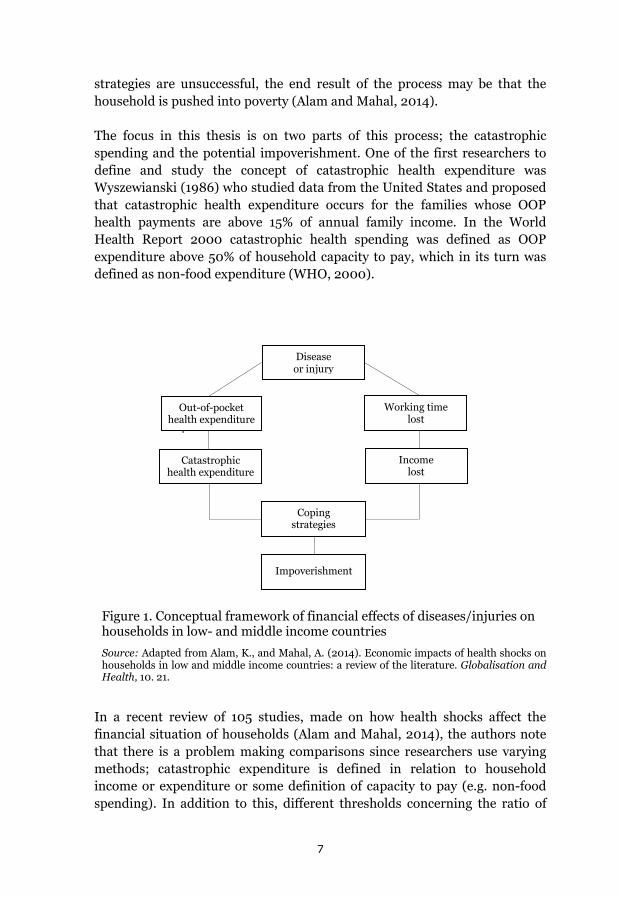
strategies are unsuccessful, the end result of the process may be that the household is pushed into poverty (Alam and Mahal, 2014).
The focus in this thesis is on two parts of this process; the catastrophic spending and the potential impoverishment. One of the first researchers to define and study the concept of catastrophic health expenditure was Wyszewianski (1986) who studied data from the United States and proposed that catastrophic health expenditure occurs for the families whose OOP health payments are above 15% of annual family income. In the World Health Report 2000 catastrophic health spending was defined as OOP expenditure above 50% of household capacity to pay, which in its turn was defined as non-food expenditure (WHO, 2000).
Figure 1. Conceptual framework of financial effects of diseases/injuries on households in low- and middle income countries
Source: Adapted from Alam, K., and Mahal, A. (2014). Economic impacts of health shocks on households in low and middle income countries: a review of the literature. Globalisation and Health, 10. 21.
In a recent review of 105 studies, made on how health shocks affect the financial situation of households (Alam and Mahal, 2014), the authors note that there is a problem making comparisons since researchers use varying methods; catastrophic expenditure is defined in relation to household income or expenditure or some definition of capacity to pay (e.g. non-food spending). In addition to this, different thresholds concerning the ratio of
Öä’öä’äöhealth
expenditure
Out-of-pocket health expenditure
Catastrophic health expenditure
Working time lost
Income lost
Coping strategies
Impoverishment
Disease or injury
7
health spending to the chosen denominator are used, e.g. 5% – 20% of income or up to 50% of capacity to pay (Xu, 2007). The method used in this thesis is motived, and described in detail, in the methods section below.
Whether a household is impoverished as a result of catastrophic health spending is usually determined by studying if a household, when OOP health expenditure is deducted from income, falls below some poverty line (Wagstaff, 2009). It may be an international poverty line or, as in this thesis, a national poverty line. The way this is constructed is also described in the methods section below.
8
Health financing in Vietnam
From reunification to Doi Moi
To give a background on the health financing situation in Vietnam it is necessary to – briefly – describe the economic development of the country over the second half of the last century to the present. The economic progress is remarkable. Stricken by long wars in the 1940’s, 50’s, 60’s and 70’s; Vietnam in 1984 was the second poorest country in the world (Gottret and Schieber, 2006). In 2013 Vietnam had risen to number 169 among 221 countries ranked according to GDP per capita (World Bank Database, 2014c). This progress led to the World Bank reclassifying Vietnam from a low income country to a lower middle income country in 2009 (Glennie, 2011).
In the 1940’s and 50’s Vietnamese nationalist forces fought against the forces of first the Japanese, then the French. The latter were defeated in 1954 and in a following Geneva conference that year, Vietnam was divided into two countries; North and South Vietnam. A war between the two was to evolve and would last until 1975. In the following year the country was unified under the rule of the Communist party. This means that for some thirty years the country was at war, and this took a heavy toll on resources and greatly hindered development (Britannica Online Encyclopedia, 2014).
Starting in 1975–76 after reunification, the government launched reforms to make ground for a planned economy in the whole country. It expropriated the private sector which, among other things, meant a collectivization of the agricultural sector (Priwitzer, 2012). This put a large strain on the resources in the north as the reforms aimed at rebuilding the south according to more collectivistic principles (Lieberman and Wagstaff, 2009).
The economic problems grew large. The country ran a big trade deficit and was struck by high inflation. In addition to this, it had border conflicts with China and invaded Cambodia in 1979 for a conflict that would last until 1991 when a peace treaty was signed. The war resulted in China, the biggest donor to Vietnam at the time, halting all its aid. In 1978 Vietnam joined the Council for Mutual Economic Assistance (COMECON), which was the reply from the Soviet Union bloc to the founding of the Organization for European Economic Co-Operation (OEEC). This, in turn, led to Western donors starting an economic embargo against Vietnam. The economic annual growth rate was on average a meager 0.2% in 1976-80. It did pick up in the following five year period to 5.4%. However, this was growth from a very low level (Priwitzer, 2012). The government financed budget deficits through
9
printing money. In 1988, the annual inflation rate was up to 374%. The large majority of the population was poor. In 1984 an estimated 75% were poor, i.e. they did not have enough resources to acquire basic food and non-food necessities. Hunger was a widespread problem. The country’s production of rice fell short of feeding the population (Glewwe, 2004).
The government’s response to the crisis was first to introduce market mechanisms in a smaller scale. In the end of the 1970’s the so called household contracting system was launched. It legalized local markets and gave the farmers the possibility to grow 5% of the land they were cultivating and to sell the products privately on markets. This was the beginning of a reform process that 1986 would result in a very important set of reforms – Doi Moi.
Doi Moi and the economic development following the reforms
Doi is Vietnamese for “change” and moi means “new”. In general the expression is translated into “renovation” (Tsuboi, 2007). This label stands for the set of reforms that the Vietnamese government initiated in 1986. Most of the reforms came into practice in the end of the 1980’s and beginning of the 1990’s. The intent of the reforms was to steer Vietnam into a transition from a centrally planned economy to a socialist-oriented market economy (Priwitzer, 2012).
Among the more important reform steps were the deregulation of the agricultural sector, the privatization of industry and selling of state owned enterprises, reductions in government spending, and the liberalization of international trade. The social sector, including the health sector, also underwent drastic changes (Glewee, 2004). The reforms of the health sector, and the effects of these reforms, are described in a following section below.
Agricultural production was done in collectivized agricultural cooperatives prior to reform. Now cooperatives were decollectivized. The land was divided up among the farmers of the former cooperatives who could lease the land assigned to them. Price controls were lifted and farmers now could sell their products on private markets. Private business was legalized, also for foreigners who could own up to 100% of an enterprise. The number of state owned enterprises was reduced by 50%. Government spending was also reduced in an effort to bring down the inflation. International trade was liberalized. The state monopoly on foreign trade was abolished and most import quotas and export restrictions were lifted (Glewee, 2004).
10
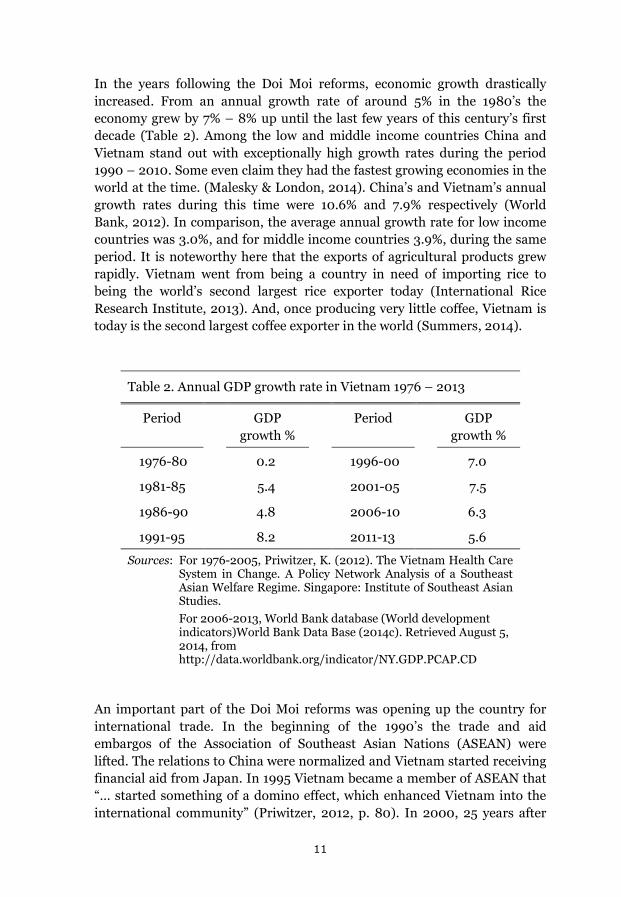
In the years following the Doi Moi reforms, economic growth drastically increased. From an annual growth rate of around 5% in the 1980’s the economy grew by 7% – 8% up until the last few years of this century’s first decade (Table 2). Among the low and middle income countries China and Vietnam stand out with exceptionally high growth rates during the period 1990 – 2010. Some even claim they had the fastest growing economies in the world at the time. (Malesky & London, 2014). China’s and Vietnam’s annual growth rates during this time were 10.6% and 7.9% respectively (World Bank, 2012). In comparison, the average annual growth rate for low income countries was 3.0%, and for middle income countries 3.9%, during the same period. It is noteworthy here that the exports of agricultural products grew rapidly. Vietnam went from being a country in need of importing rice to being the world’s second largest rice exporter today (International Rice Research Institute, 2013). And, once producing very little coffee, Vietnam is today is the second largest coffee exporter in the world (Summers, 2014).
Table 2. Annual GDP growth rate in Vietnam 1976 – 2013
Period GDP growth %
Period GDP growth %
1976-80 0.2 1996-00 7.0
1981-85 5.4 2001-05 7.5
1986-90 4.8 2006-10 6.3
1991-95 8.2 2011-13 5.6
Sources: For 1976-2005, Priwitzer, K. (2012). The Vietnam Health Care System in Change. A Policy Network Analysis of a Southeast Asian Welfare Regime. Singapore: Institute of Southeast Asian Studies.
For 2006-2013, World Bank database (World development indicators)World Bank Data Base (2014c). Retrieved August 5, 2014, from http://data.worldbank.org/indicator/NY.GDP.PCAP.CD
An important part of the Doi Moi reforms was opening up the country for international trade. In the beginning of the 1990’s the trade and aid embargos of the Association of Southeast Asian Nations (ASEAN) were lifted. The relations to China were normalized and Vietnam started receiving financial aid from Japan. In 1995 Vietnam became a member of ASEAN that “… started something of a domino effect, which enhanced Vietnam into the international community” (Priwitzer, 2012, p. 80). In 2000, 25 years after
11
the end of the American war (the Vietnamese label on what in the West is called the Vietnam war), a bilateral trade agreement with the US was signed. In 2006, Vietnam became a member of the World Trade Organization.
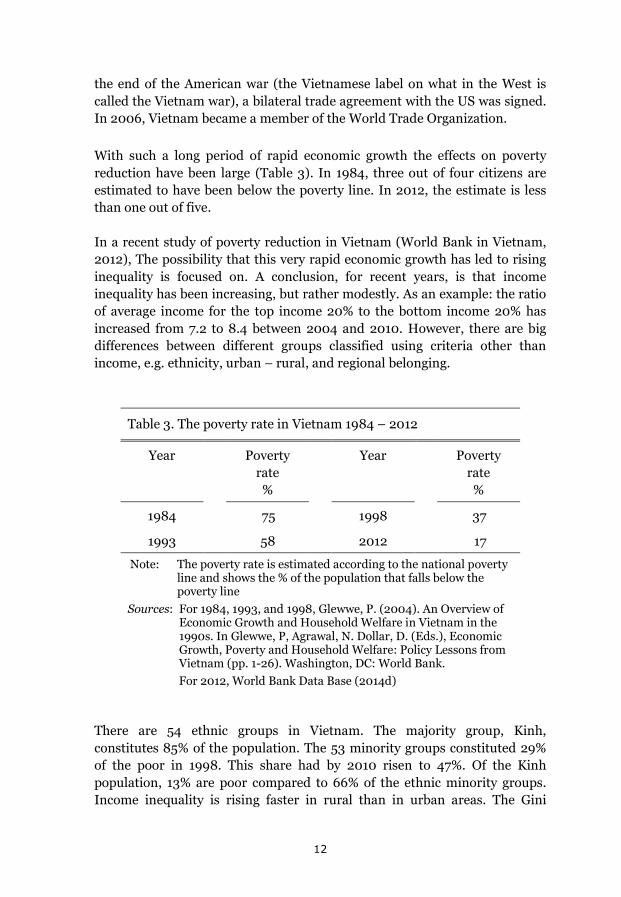
With such a long period of rapid economic growth the effects on poverty reduction have been large (Table 3). In 1984, three out of four citizens are estimated to have been below the poverty line. In 2012, the estimate is less than one out of five.
In a recent study of poverty reduction in Vietnam (World Bank in Vietnam, 2012), The possibility that this very rapid economic growth has led to rising inequality is focused on. A conclusion, for recent years, is that income inequality has been increasing, but rather modestly. As an example: the ratio of average income for the top income 20% to the bottom income 20% has increased from 7.2 to 8.4 between 2004 and 2010. However, there are big differences between different groups classified using criteria other than income, e.g. ethnicity, urban – rural, and regional belonging.
Table 3. The poverty rate in Vietnam 1984 – 2012
Year Poverty rate %
Year Poverty rate %
1984 75 1998 37
1993 58 2012 17
Note: The poverty rate is estimated according to the national poverty line and shows the % of the population that falls below the poverty line
Sources: For 1984, 1993, and 1998, Glewwe, P. (2004). An Overview of Economic Growth and Household Welfare in Vietnam in the 1990s. In Glewwe, P, Agrawal, N. Dollar, D. (Eds.), Economic Growth, Poverty and Household Welfare: Policy Lessons from Vietnam (pp. 1-26). Washington, DC: World Bank.
For 2012, World Bank Data Base (2014d)
There are 54 ethnic groups in Vietnam. The majority group, Kinh, constitutes 85% of the population. The 53 minority groups constituted 29% of the poor in 1998. This share had by 2010 risen to 47%. Of the Kinh population, 13% are poor compared to 66% of the ethnic minority groups. Income inequality is rising faster in rural than in urban areas. The Gini
12
coefficient, measuring income inequality, in rural areas has risen from 0.37 to o.41 between 2004 and 2010. In urban areas it has been stable around 0.38 during the same period (World Bank in Hanoi, 2012). The poverty rate in rural areas is several times higher than in urban areas. In 2006, the poverty rate for the Northern Mountains and Central Highlands was around 30% while it was around 10% in the Red River Delta and the Mekong River Delta (Overseas Development Institute, 2011).
Two other striking features of Vietnam, which are of direct relevance for this thesis, is the aging of the population and the urbanization process. The elderly accounted for 10% of the population in 2009. This share is projected to grow to 29% in 2050 making the Vietnamese population one of the oldest in ASEAN (Ministry of Health, 2013). The urban population is rapidly growing. In 2010 it constituted 33% of the population, a share expected to grow into 45% in 2020. It is the young people that move. In today’s migration from countryside to cities over 80% of those who move are between 18 and 34 years old. Many who migrate are women, in one study found to be 40% of migrants reflecting a development called feminization of migration (Duong and Liem, 2011).
Doi Moi and the health sector
In North Vietnam, starting in the 1950’s and being expanded in the 1960’s, the government established a network of primary health care facilities in the communes that largely increased peoples access to health care (World Bank, 1992). The funding was local and health care was delivered free of charge (Priwitzer, 2012). In South Vietnam at that time, primary health care was much less developed; characterized by World Bank researchers as a “poor network” (World Bank, 1992) and by Priwitzer (2012) as “abysmal”. For the whole health care system in South Vietnam there were, in 1965, only 800 physicians available for a population of 15 million. In addition to this, war casualties strained the resources and half of the population was resettled as refugees (Priwitzer, 2012).
After reunification of the country (that formally took place in 1976) the government wanted to extend the system of health services in the north also to the south part of the country. (World Bank, 1992) This was an enormous undertaking that took a heavy toll on health care resources. At the same time, international aid was withdrawn, trade embargos against Vietnam were put in place, the economic growth was slow and the inflation high (see page 9) (Priwitzer, 2012). The health staffing problem worsened. Private practice was now not allowed. A large number of the doctors and other skilled health workers in the south, previously working in private practice,
13
left the country in 1975. The strain on resources started a process that in the 1980’s led to a deterioration of the health system (Lieberman and Wagstaff, 2009).
In this way, the economic problems that led to the Doi Moi reforms also included grave problems in the health sector. Also, Doi Moi reforms in themselves created problems for the health sector. The de-collectivization of the agricultural communes removed an important financing source for health care (Priwitzer, 2012). Therefore, it was important that Doi Moi also included reforms of the health system.
The content of the health reforms, decided on in 1989, were:
From having had a basic health care free of charge, user fees were now introduced as a means to acquire new resources for health care.
Private practice was legalized. Prior to 1989 private practice in health care was forbidden. Now a new law opened up both for publicly employed health staff to open private practice after office hours, and for full-time private practice.
The sales of drugs and medicines were also legalized. Pharmaceutical companies and pharmacies could now sell drugs both to individuals and to health facilities.
The pharmaceutical industry was liberalized. From having been state controlled concerning e.g. production levels and price setting, the industry now could make its own decisions about inputs, wages, production levels, and pricing (World Bank, 1992).
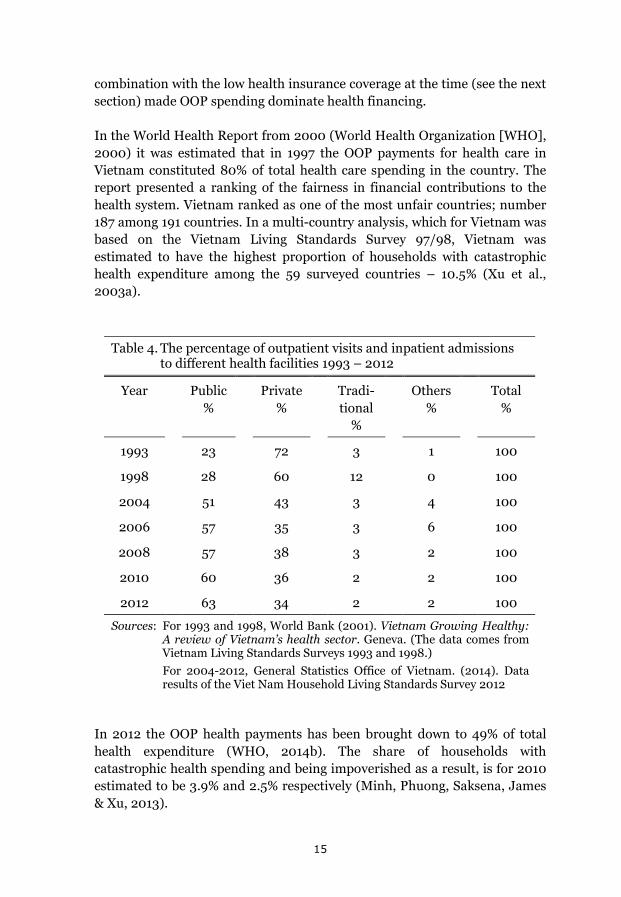
One effect of the reforms was a considerable privatization of health care (Table 4). In the 1990’s private health facilities dominated the market for outpatient visits. This share has steadily decreased since then. For inpatient admissions the share for private facilities was 0% in the 1990’s even though there were a few private hospitals in Vietnam at that time (World Bank, 2011). Today (2012) the share of inpatient admissions to private facilities is 5% (General Statistics Office of Vietnam, 2014a).
A consequence of the Doi Moi reforms, central to the scope of this thesis, is the fast growth of OOP health payments that followed the reforms in the 1980’s and 1990’s. In 1993 OOP spending made up 71% of total health expenditure (Liebermann and Wagstaff, 2009). The reliance on user fees in
14
combination with the low health insurance coverage at the time (see the next section) made OOP spending dominate health financing.
In the World Health Report from 2000 (World Health Organization [WHO], 2000) it was estimated that in 1997 the OOP payments for health care in Vietnam constituted 80% of total health care spending in the country. The report presented a ranking of the fairness in financial contributions to the health system. Vietnam ranked as one of the most unfair countries; number 187 among 191 countries. In a multi-country analysis, which for Vietnam was based on the Vietnam Living Standards Survey 97/98, Vietnam was estimated to have the highest proportion of households with catastrophic health expenditure among the 59 surveyed countries – 10.5% (Xu et al., 2003a).
Table 4. The percentage of outpatient visits and inpatient admissions
to different health facilities 1993 – 2012
Year Public %
Private %
Tradi-tional
%
Others %
Total %
1993 23 72 3 1 100
1998 28 60 12 0 100
2004 51 43 3 4 100
2006 57 35 3 6 100
2008 57 38 3 2 100
2010 60 36 2 2 100
2012 63 34 2 2 100
Sources: For 1993 and 1998, World Bank (2001). Vietnam Growing Healthy: A review of Vietnam’s health sector. Geneva. (The data comes from Vietnam Living Standards Surveys 1993 and 1998.)
For 2004-2012, General Statistics Office of Vietnam. (2014). Data results of the Viet Nam Household Living Standards Survey 2012
In 2012 the OOP health payments has been brought down to 49% of total health expenditure (WHO, 2014b). The share of households with catastrophic health spending and being impoverished as a result, is for 2010 estimated to be 3.9% and 2.5% respectively (Minh, Phuong, Saksena, James & Xu, 2013).
15
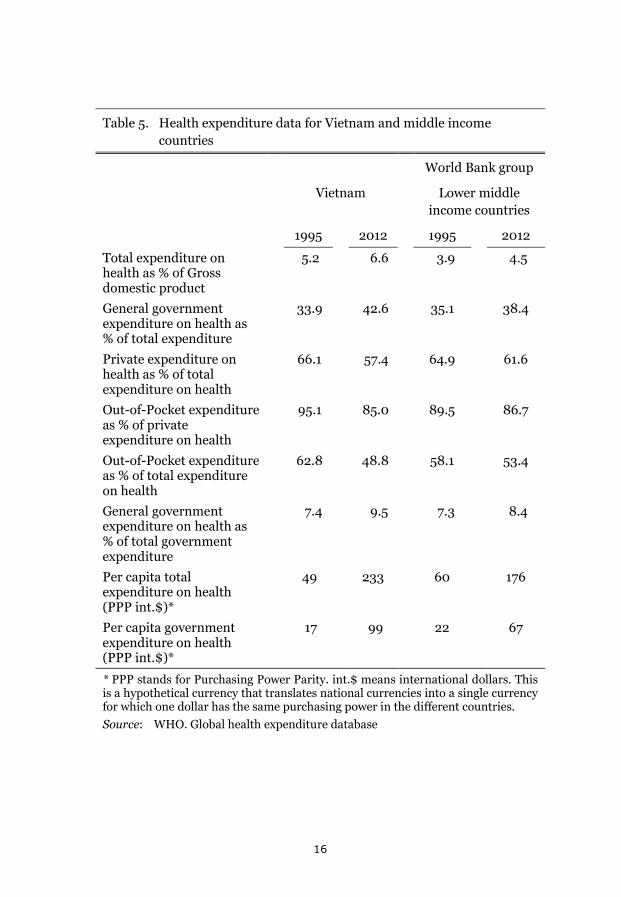
Table 5. Health expenditure data for Vietnam and middle income countries
World Bank group
Vietnam Lower middle income countries
1995 2012 1995 2012
Total expenditure on health as % of Gross domestic product
5.2 6.6 3.9 4.5
General government expenditure on health as % of total expenditure
33.9 42.6 35.1 38.4
Private expenditure on health as % of total expenditure on health
66.1 57.4 64.9 61.6
Out-of-Pocket expenditure as % of private expenditure on health
95.1 85.0 89.5 86.7
Out-of-Pocket expenditure as % of total expenditure on health
62.8 48.8 58.1 53.4
General government expenditure on health as % of total government expenditure
7.4 9.5 7.3 8.4
Per capita total expenditure on health (PPP int.$)*
49 233 60 176
Per capita government expenditure on health (PPP int.$)*
17 99 22 67
* PPP stands for Purchasing Power Parity. int.$ means international dollars. This is a hypothetical currency that translates national currencies into a single currency for which one dollar has the same purchasing power in the different countries. Source: WHO. Global health expenditure database
16
To summarize, during the past fifteen years there has been a considerable reduction in OOP payments for health and catastrophic health spending. During this period, health insurance coverage has been largely expanded, which will be described in the next section.
The development from the middle of the 1990’s is summarized in Table 5. For Vietnam total health expenditure and government health expenditure has markedly increased. OOP health expenditure has on the other hand been reduced from 63% to 49% of total health expenditure. In comparison with the averages for lower middle income countries, the World Bank country income group that Vietnam now belongs to, the progress in Vietnam is visible. The per capita total health expenditure, and the per capita government health expenditure, was in 1995 lower in Vietnam than the average of lower middle income countries. In 2012 the corresponding per capita measures are considerably higher in Vietnam compared to the Word Bank country income group average. The OOP health expenditure as a percentage of total health expenditure was higher in Vietnam in 1995 but is in 2012 lower than the average for lower middle income countries.
17
Health insurance
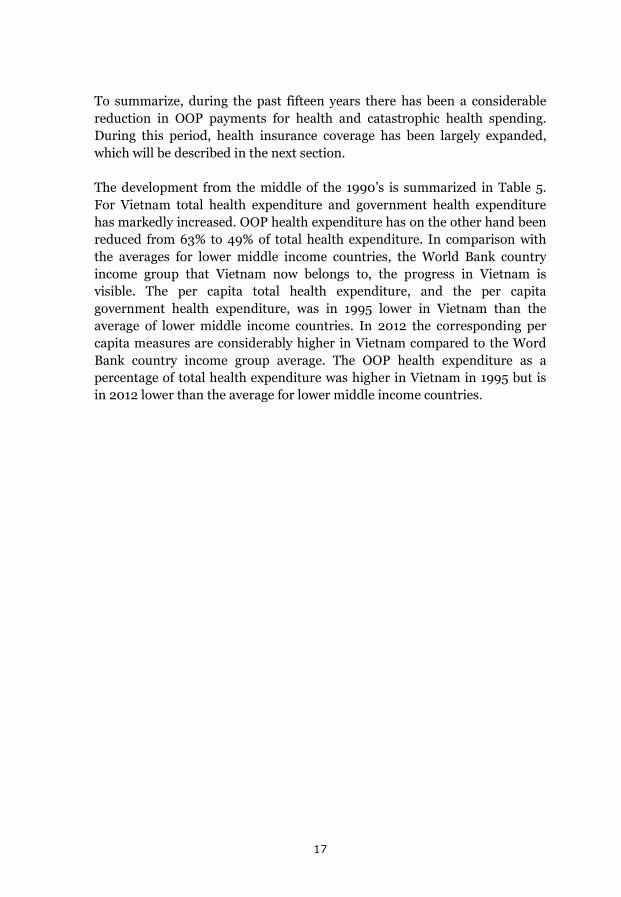
The Doi Moi reforms resulted in increasing OOP payments for health. Because of this, the Vietnamese government, starting in the late 1980’s, has implemented a number of reforms aiming at new ways of health financing building on prepayment rather than OOP payments. The policy choice in this reform process has been to primarily finance health care through social health insurance (Somanathan, Tandon, Dao, Hurt and Fuenzalida-Puelma, 2014).
Table 6. Overview of the compulsory health insurance programmes
Year Target Groups 1992 Civil servants, employees in enterprises with a staff of more than
ten, pensioners, recipients of social aid, and staff of international organizations in Vietnam
1998 Members of Congress and People’s Councils, pre-school teachers, meritorious people, dependents of military officers and soldiers, and foreign students in Vietnam
2002 The poor (people belonging to households below the national poverty line) were included through the establishment of the Health Care Funds for the Poor. These also included support for ethnic minorities in mountainous areas.
2005 Employees at non-state owned enterprises having less than ten workers, cooperatives, and veterans
2009 Children under 6 years of age, near poor and elderly people 2010 Students and pupils 2012 Farmers and workers in the sectors of agriculture, forestry,
fishery and production of salt Sources: Ekman, B., Liem, N. T., Duc, H. A., & Axelson, H. (2008). Health insurance
reform in Vietnam: a review of recent developments and future challenges. Health Policy and Planning, 23, 252–263.
Ha, D. A. (2011). Social health insurance as a means to achieving universal coverage and more equitable health outcomes. Sub-report of Viet Nam. Hanoi: unicef.
Ministry of Health. (2013). Joint Annual Health Review 2013. Towards Universal Coverage. Hanoi
Somanathan, A., Dao, H. L., & Tien, T. V. (2013). Integrating the Poor into Universal Health Coverage in Vietnam. Washington, World Bank.
Somanathan, A., Tandon, A., Dao, H. L, Hurt, K. L., & Fuenzalida-Puelma, H. L. (2014). Moving toward Universal Coverage of Social Health Insurance in Vietnam. Assessment and Options. Washington: The World Bank.
18
Between 1989 and 1992 the Vietnamese government piloted a project of noncommercial voluntary health insurance (Do, Oh and Lee, 2014). Following that the Vietnamese have developed both a compulsory and a voluntary health insurance system (for those not covered in the compulsory schemes). Some milestones in the development are described in Table 6.
Table 7. Health
insurance coverage 1993 – 2012
Table 8. Size of groups enrolled in health insurance
Year Coverage rate %
Groups Proportion of all insured
%
1993 5.4 Employees 15.9
1998 13.1 Children under age 6 14.4
2003 20.7 Poor, ethnic minorities 24.6
2008 47.1 Near poor 2.1
2012 66.8 Students, pupils 19.6
Sources: For 1993 – 2008, Ha, D. A. (2011). Social health insurance as a means to achieving universal coverage and more equitable health outcomes. Sub-report of Viet Nam. Hanoi: unicef For 2012, Ministry of Health. (2013). Joint Annual Health Review 2013. Towards Universal Coverage. Hanoi
Other compulsory 14.4
Voluntary 9.0
Total 100.0
Source: Ministry of Health. (2013). Joint Annual Health Review 2013. Towards Universal Coverage. Hanoi
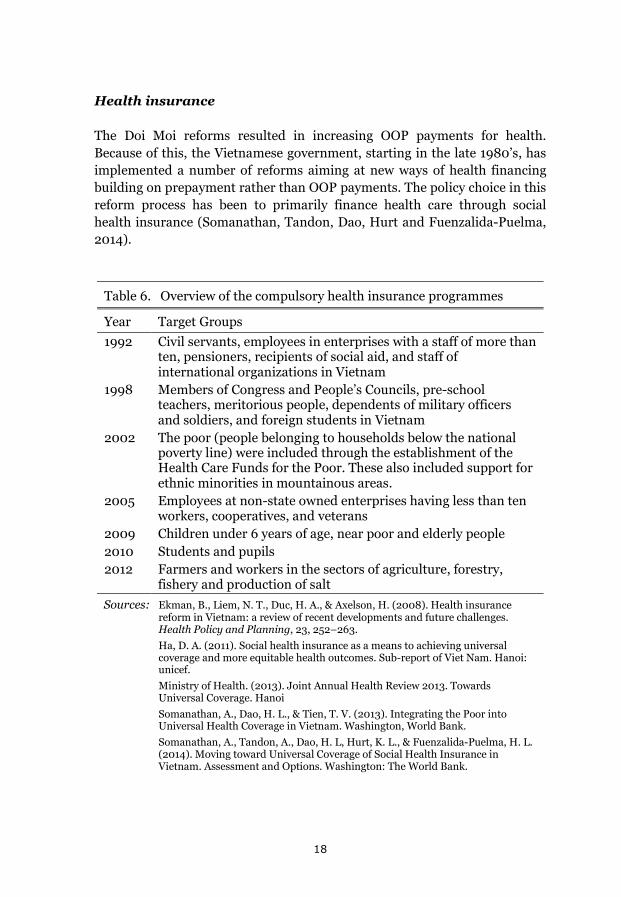
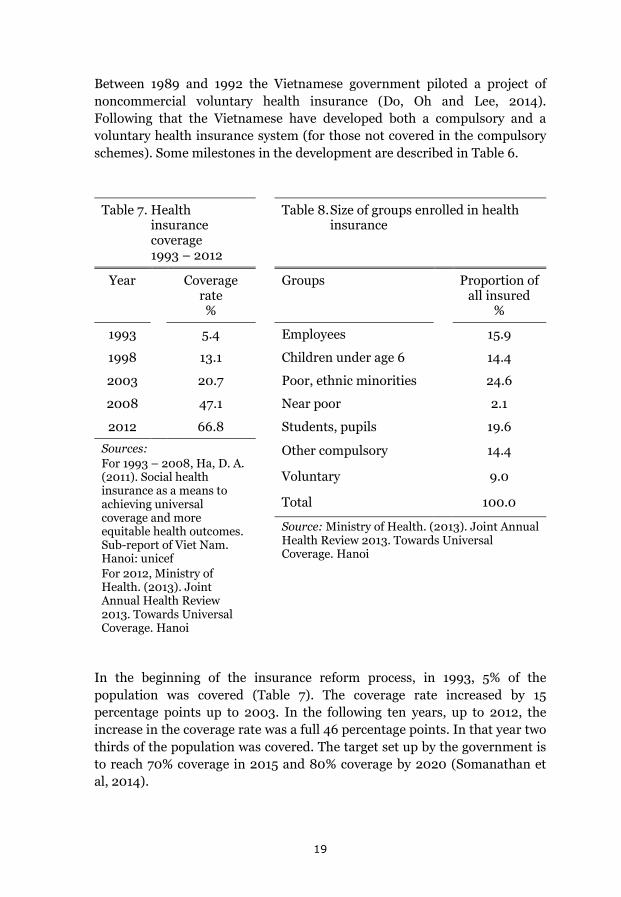
In the beginning of the insurance reform process, in 1993, 5% of the population was covered (Table 7). The coverage rate increased by 15 percentage points up to 2003. In the following ten years, up to 2012, the increase in the coverage rate was a full 46 percentage points. In that year two thirds of the population was covered. The target set up by the government is to reach 70% coverage in 2015 and 80% coverage by 2020 (Somanathan et al, 2014).
19
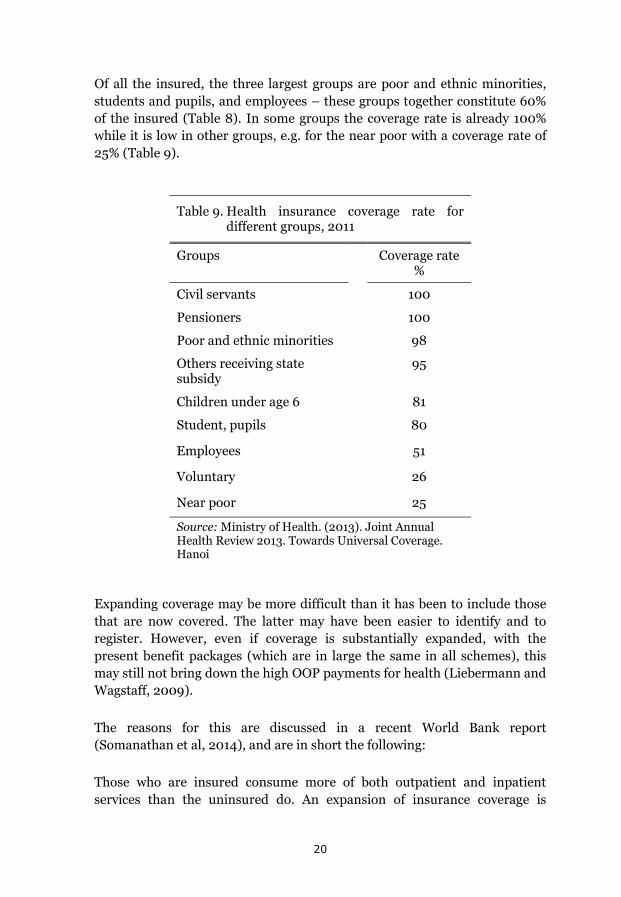
Of all the insured, the three largest groups are poor and ethnic minorities, students and pupils, and employees – these groups together constitute 60% of the insured (Table 8). In some groups the coverage rate is already 100% while it is low in other groups, e.g. for the near poor with a coverage rate of 25% (Table 9).
Table 9. Health insurance coverage rate for different groups, 2011
Groups Coverage rate %
Civil servants 100
Pensioners 100
Poor and ethnic minorities 98
Others receiving state subsidy
95
Children under age 6 81
Student, pupils 80
Employees 51
Voluntary 26
Near poor 25
Source: Ministry of Health. (2013). Joint Annual Health Review 2013. Towards Universal Coverage. Hanoi
Expanding coverage may be more difficult than it has been to include those that are now covered. The latter may have been easier to identify and to register. However, even if coverage is substantially expanded, with the present benefit packages (which are in large the same in all schemes), this may still not bring down the high OOP payments for health (Liebermann and Wagstaff, 2009).
The reasons for this are discussed in a recent World Bank report (Somanathan et al, 2014), and are in short the following:
Those who are insured consume more of both outpatient and inpatient services than the uninsured do. An expansion of insurance coverage is
20
therefore likely to increase health care utilization. The insurance schemes, however, do not cover the full costs of medical treatments. The copayment rates vary from 0% – 20% (Minh et al, 2013). Therefore, OOP payments may increase when insurance coverage, with the present reimbursement conditions, is expanded.
Health care providers are reimbursed by Vietnam Social Security (VSS), which is the national agency administering social health insurance. The fee schedule for reimbursements was decided on in 1995, and has been updated only twice, in 2006 and 2012. In between updates the cost for providing medical services increased and providers charged the difference to patients via user fees. There is a strong fiscal decentralization of the health care system in Vietnam where local and provincial agencies manage their own revenue accounts and therefore have the possibility to compensate insufficient funding from central government through increased OOP payments from patients (Priwitzer, 2012; Ramesh, 2013).
The reimbursements to providers are in part based on fee-for-service, i.e. providers are paid a certain sum for each particular type of service. This may give providers the incentive to oversupply services and choose those that on the fee schedule are more expensive and profitable. In the insurance regulations there is no limit on how high the total copayment expenditure can be for a patient. This structure may lead to higher OOP payments for patients.
The primary health care facilities, in particular the commune health stations, have quality problems. Many of them are understaffed, e.g. only two thirds of them have a medical doctor, and other key inputs are also lacking. This leads to patients turning to higher levels in the health care system where the copayment rates are higher or seeking private health care not covered by social health insurance (Somanathan et al, 2014).
More than half of the OOP payments are made on private sector facilitates and self-treatment; buying drugs from drug vendors and pharmacies (Somanathan et al, 2014). In addition to this, households may have substantial costs not covered by insurance for transportation, food, lodging of accompanying informal caregivers, and informal payments when using health care. To have health insurance better protect the people against the costs of health problems are for these reasons not only about expanding coverage to new groups, but also about deepening coverage for those insured; extending it to cover more of the costs (Lieberman and Wagstaff, 2009).
21
Another health insurance problem concerns the fact that the insured may not want to use their insurance when accessing health care. In a study on data from 2008 it was found that only two thirds of the insured used their insurance when accessing health care. The reported reasons were perceived poor quality of the health services covered by the insurance (discussed above for primary health care), but also longer waiting times for, and unfair treatment of, the insured (Ha, 2011). The following narrative is an example from a focus group discussion:
I had a relative being treated in K Hospital (a central cancer hospital) in Hanoi. He had a health insurance card but chose the user pays mechanism as it helped to save both money and time. If he had used his health insurance card, he would have had to wait two days to be fully checked. But it took him a morning to receive the same services when he paid with his own money. The total cost for two days, including indirect costs and service fees, were much higher than what he would have been reimbursed by the health insurance agency.
(Ha, 2011, p. 28)
Finally, informal payments appear to be common in Vietnam but evidence is scarce in regard to the scale of this phenomena. This may be gifts or money; “envelope money”, as the Vietnamese call it. In a study done in 1992 81% of users of health care said they had made informal payments (Lewis, 2007). In more recent studies, from the last few years of the last decade, around one third of respondents reported having paid bribes to medical staff, even though the perception of what is a bribe varies. As much as 70% of medical staff reported in another study from the same time that they had received informal payments (Vian, Brinkerhoff, Feeley, Salomon, and Vien, 2011).
In the background above a description is given of the two central problem complexes in this thesis; catastrophic health care payments and health insurance reform. The purpose has been to place the studies of the thesis, reported and discussed in the coming sections, in the more general setting in which they were done. That also necessitated a brief description of the economic development in Vietnam, the policies to enhance it, and the development in the health sector in relation to this.
22
Objectives
The general objective of this thesis is to contribute to the discussion in Vietnam on how large the problems of out-of-pocket and catastrophic health expenditure are and to assess important aspects of health insurance as a means to reduce the problems. Studies have been done on: how large the problems of out-of-pocket health care spending are for the whole population and for a special sub-group; the elderly, the population’s valuation of alternative solutions, and an assessment made on an implemented health insurance reform.
Specific objectives
To compare the estimations of catastrophic health expenditure in Vietnam done with three different data sets of which two are cross-sectional and one is a longitudinal study over a full year. (Paper I.)
To estimate the size of catastrophic health expenditure and impoverishment in a potentially vulnerable group in this context: the elderly households in Vietnam. (Paper II.)
To assess the effects on private health expenditure and health care utilization of an implemented health insurance reform: The Health Care Funds for the Poor. (Paper III.)
To study the value that a rural Vietnamese population attaches to different health insurance programmes in relation to a strictly out-of-pocket health financing system. (Paper IV.)
23
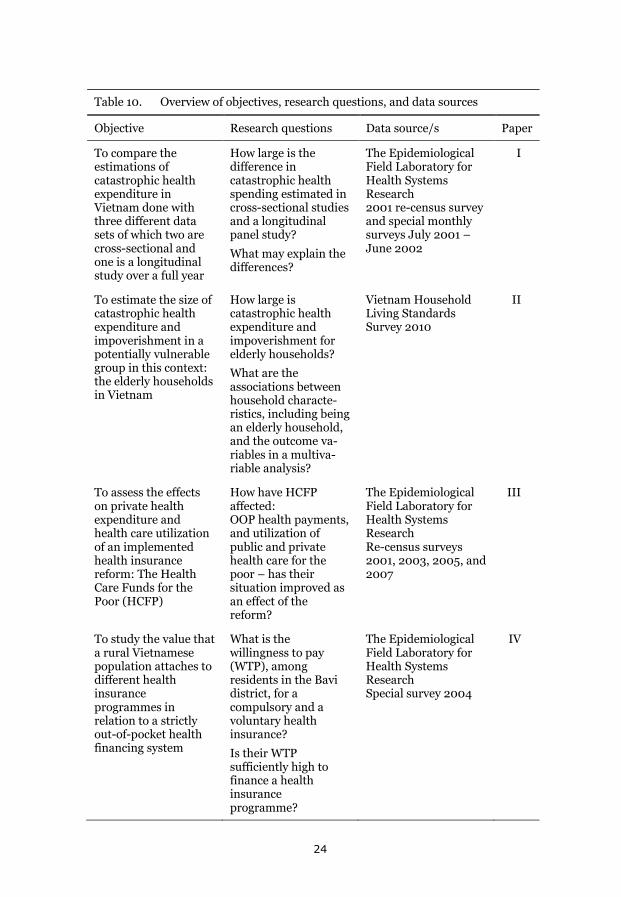
Table 10. Overview of objectives, research questions, and data sources
Objective Research questions Data source/s Paper
To compare the estimations of catastrophic health expenditure in Vietnam done with three different data sets of which two are cross-sectional and one is a longitudinal study over a full year
How large is the difference in catastrophic health spending estimated in cross-sectional studies and a longitudinal panel study?
What may explain the differences?
The Epidemiological Field Laboratory for Health Systems Research 2001 re-census survey and special monthly surveys July 2001 – June 2002
I
To estimate the size of catastrophic health expenditure and impoverishment in a potentially vulnerable group in this context: the elderly households in Vietnam
How large is catastrophic health expenditure and impoverishment for elderly households?
What are the associations between household characte-ristics, including being an elderly household, and the outcome va-riables in a multiva-riable analysis?
Vietnam Household Living Standards Survey 2010
II
To assess the effects on private health expenditure and health care utilization of an implemented health insurance reform: The Health Care Funds for the Poor (HCFP)
How have HCFP affected: OOP health payments, and utilization of public and private health care for the poor – has their situation improved as an effect of the reform?
The Epidemiological Field Laboratory for Health Systems Research Re-census surveys 2001, 2003, 2005, and 2007
III
To study the value that a rural Vietnamese population attaches to different health insurance programmes in relation to a strictly out-of-pocket health financing system
What is the willingness to pay (WTP), among residents in the Bavi district, for a compulsory and a voluntary health insurance?
Is their WTP sufficiently high to finance a health insurance programme?
The Epidemiological Field Laboratory for Health Systems Research Special survey 2004
IV
24
Materials and methods
The materials and methods used in this thesis will be presented for each of the papers below following first: an overview of the data sources, and then, a description of the method used to estimate catastrophic expenditure (which is done in both Papers I and II).
Data Sources
The data for the studies in this thesis come from two main different data sources; The Epidemiological Field Laboratory for Health Systems Research (FilaBavi), 2001-2007, and the Vietnam Household Living Standards Survey (VHLSS) 2010.
In 1999, Vietnamese and Swedish public health scientists (from the Health Strategy and Policy Institute, Hanoi Medical University, and the Ministry of Health in Vietnam, and from Karolinska Institutet, Umeå University, and the Nordic School of Public Health in Sweden) established an epidemiological field laboratory in the Bavi district in northern Vietnam. The center of the district is 60 kilometers west of Hanoi. The Bavi district had 235,000 inhabitants when the field site was started. Through cluster sampling, proportional to population size, 67 clusters were selected with a population size of 51,024 inhabitants in 67 clusters (Chuc & Diwan, 2003).
A baseline household survey was done in 1999. Household data were collected on health, living conditions, expenditure, income, health care, and the economic status of the households (a classification done by local leaders). Individual data was collected on background variables such as age, gender, education, occupation etc. Since then, there has been a re- census done every second year and in between that quarterly surveys on vital data. The surveyors, responsible for collecting the field data, are graduates from secondary school. They have received continuous training and updates. The FilaBavi infrastructure has also allowed for special surveys in between or in connection to the regularly planned ones (Chuc & Diwan, 2003).
FilaBavi data are used in three of the studies presented in this thesis, papers I, III, and IV. In Paper I, the FilaBavi re-census 2001 is used (questionnaire in annex 1). There was also a special survey done starting in July 2001 and ending in June 2002. In this survey household representatives were interviewed once a month during the yearlong period (questionnaire in annex 2). In Paper III, data from four re-censuses are used; 2001, 2003,
25
2005, and 2007. The same households are followed over this period (questionnaire in annex 1). For Paper IV there was a special survey within FilaBavi done in 2004 (questionnaire in annex 3).
Paper II is based on data from the Vietnam Household Living Standards Survey. Living standards surveys in Vietnam were first done in 1993 and 1998 and were then called Vietnam Living Standards Survey (VLSS). From 2002 they have been done at two year intervals and the name has been expanded to Vietnam Household Living Standards Survey (VHLSS). The surveys are conducted by the General Statistics Office (GSO). They have been set up with technical support from the World Bank and follow the survey methods in the World Bank’s Living Standards Measurement Program. The data from VHLSS are generally considered to be of high quality (Haughton & Nguyen, 2010).
For paper II data from VHLSS 2010 has been used (questionnaire in annex 4). Data from the most recent survey, VHLSS 2012, was not available when Paper II was drafted. VHLSS 2010 covers the following areas: demographics, education, labor – employment, health and health care, income, consumption expenditure, durable goods, housing, participation in poverty alleviation programmes, household business, and characteristics of communes (General Statistics Office, 2014b).
Catastrophic health expenditure and impoverishment
The size of catastrophic health expenditure is being estimated both in Paper I and in Paper II. Therefore an explanation of the methodo used is given here.
Different methods, and different thresholds, have been used to determine when a household’s health spending is catastrophic (see e.g. Wagstaff and Doorslayer, 2003). This causes problems of comparability and was described in the background section above (see page 7). Catastrophic health spending is estimated in relation either to household income or expenditure or some definition of household capacity to pay. In addition to this, different thresholds for when OOP health spending is large enough to be deemed catastrophic are used. This is noted in a recent review of 105 studies on catastrophic spending (Alam and Mahal, 2014). However, the reviewers also note that there is one method, developed by researchers at WHO, which has attained an “overwhelming popularity” resulting in many studies.
26
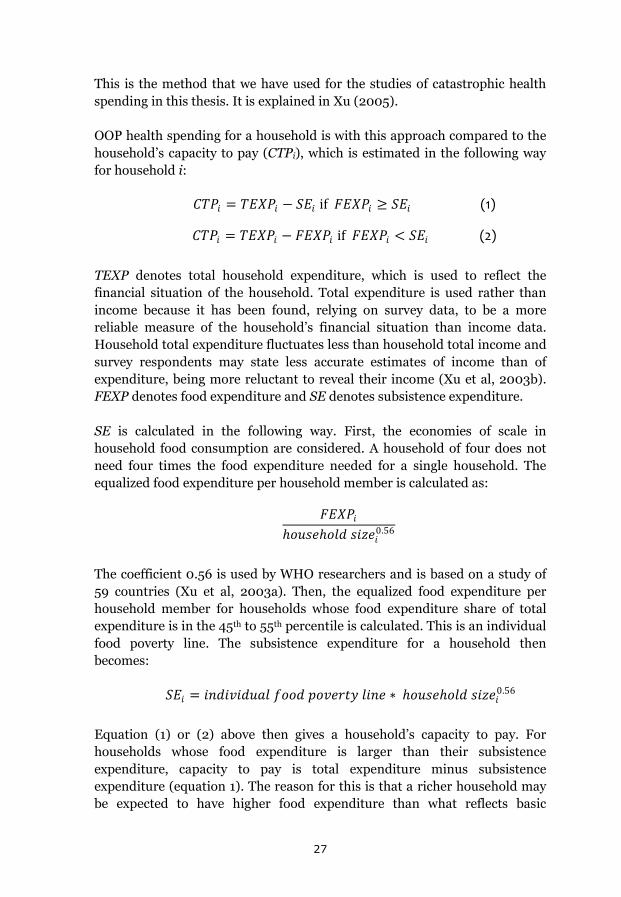
This is the method that we have used for the studies of catastrophic health spending in this thesis. It is explained in Xu (2005).
OOP health spending for a household is with this approach compared to the household’s capacity to pay (CTPi), which is estimated in the following way for household i:
𝐶𝐶𝐶𝐶𝐶𝐶𝑖𝑖 = 𝐶𝐶𝑇𝑇𝑇𝑇𝐶𝐶𝑖𝑖 − 𝑆𝑆𝑇𝑇𝑖𝑖 if 𝐹𝐹𝑇𝑇𝑇𝑇𝐶𝐶𝑖𝑖 ≥ 𝑆𝑆𝑇𝑇𝑖𝑖 (1)
𝐶𝐶𝐶𝐶𝐶𝐶𝑖𝑖 = 𝐶𝐶𝑇𝑇𝑇𝑇𝐶𝐶𝑖𝑖 − 𝐹𝐹𝑇𝑇𝑇𝑇𝐶𝐶𝑖𝑖 if 𝐹𝐹𝑇𝑇𝑇𝑇𝐶𝐶𝑖𝑖 < 𝑆𝑆𝑇𝑇𝑖𝑖 (2)
TEXP denotes total household expenditure, which is used to reflect the financial situation of the household. Total expenditure is used rather than income because it has been found, relying on survey data, to be a more reliable measure of the household’s financial situation than income data. Household total expenditure fluctuates less than household total income and survey respondents may state less accurate estimates of income than of expenditure, being more reluctant to reveal their income (Xu et al, 2003b). FEXP denotes food expenditure and SE denotes subsistence expenditure.
SE is calculated in the following way. First, the economies of scale in household food consumption are considered. A household of four does not need four times the food expenditure needed for a single household. The equalized food expenditure per household member is calculated as:
𝐹𝐹𝑇𝑇𝑇𝑇𝐶𝐶𝑖𝑖ℎ𝑜𝑜𝑜𝑜𝑜𝑜𝑜𝑜ℎ𝑜𝑜𝑜𝑜𝑜𝑜 𝑜𝑜𝑖𝑖𝑠𝑠𝑜𝑜𝑖𝑖0.56
The coefficient 0.56 is used by WHO researchers and is based on a study of 59 countries (Xu et al, 2003a). Then, the equalized food expenditure per household member for households whose food expenditure share of total expenditure is in the 45th to 55th percentile is calculated. This is an individual food poverty line. The subsistence expenditure for a household then becomes:
𝑆𝑆𝑇𝑇𝑖𝑖 = 𝑖𝑖𝑖𝑖𝑜𝑜𝑖𝑖𝑖𝑖𝑖𝑖𝑜𝑜𝑜𝑜𝑖𝑖𝑜𝑜 𝑓𝑓𝑜𝑜𝑜𝑜𝑜𝑜 𝑝𝑝𝑜𝑜𝑖𝑖𝑜𝑜𝑝𝑝𝑝𝑝𝑝𝑝 𝑜𝑜𝑖𝑖𝑖𝑖𝑜𝑜 ∗ ℎ𝑜𝑜𝑜𝑜𝑜𝑜𝑜𝑜ℎ𝑜𝑜𝑜𝑜𝑜𝑜 𝑜𝑜𝑖𝑖𝑠𝑠𝑜𝑜𝑖𝑖0.56
Equation (1) or (2) above then gives a household’s capacity to pay. For households whose food expenditure is larger than their subsistence expenditure, capacity to pay is total expenditure minus subsistence expenditure (equation 1). The reason for this is that a richer household may be expected to have higher food expenditure than what reflects basic
27
𝐶𝐶𝑇𝑇𝑇𝑇𝐶𝐶𝑖𝑖 ≥ 𝑆𝑆𝑇𝑇𝑖𝑖 and 𝐶𝐶𝑇𝑇𝑇𝑇𝐶𝐶𝑖𝑖 − 𝑂𝑂𝑂𝑂𝐶𝐶 ℎ𝑜𝑜𝑖𝑖𝑜𝑜𝑝𝑝ℎ 𝑐𝑐𝑖𝑖𝑝𝑝𝑜𝑜 𝑜𝑜𝑒𝑒𝑝𝑝𝑜𝑜𝑖𝑖𝑜𝑜𝑖𝑖𝑝𝑝𝑜𝑜𝑝𝑝𝑜𝑜𝑖𝑖 < 𝑆𝑆𝑇𝑇𝑖𝑖
necessities. Measuring it this way, though, would not give an appropriate measure of capacity to pay for a household whose actual food expenditure is lower than its estimated subsistence expenditure. This may happen for poorer households. For such a household capacity to pay is total expenditure minus actual food expenditure (equation 2).
A household will, with this approach, have catastrophic health expenditure when its OOP payments for health are equal to or exceeds 40% of its capacity to pay.
Catastrophic health spending constitutes, as has been discussed in the background section above, a risk for impoverishment. A household is considered to be impoverished if it becomes poor as a result of OOP health payments. The following applies to such a household:
28
Doing estimations of catastrophic health spending in cross-sectional and longitudinal studies (Paper I)
In 2003 a paper was published in The Lancet reporting estimations of catastrophic health expenditure in 59 countries, one of them being Vietnam (Xu et al, 2003a). The highest proportion was found in Vietnam – 10.5% of the households. A few years earlier WHO had reported very high OOP payments for health in Vietnam – 80% of total health care expenditure – and ranked Vietnam as one of the most unfair countries in the world when it came to health care financing (compare the background section, page 15).
The data for Vietnam in the Lancet paper was obtained from the Vietnam Living Standards Survey (VLSS) 1997/98. We had access to two different data sets. One was the 2001 FilaBavi re-census. The other was a special survey done in FilaBavi where the same households were interviewed during a yearlong period, from July 2001 to June 2002. This offered a possibility for comparisons.
How the FilaBavi censuses were done is described in the section on data sources above. The special survey was done as a basis for an MPH thesis (Thuan, 2002). The interviewers in this study were employed by the FilaBavi project and thus had the training and experience from doing re-censuses and quarterly surveys. Out of the FilaBavi larger sample one out of eighteen households were randomly sampled, which resulted in a sample of 629 households for the special survey. These households were interviewed in the first week of each of the twelve months during the study period. In between interviews the households were asked to keep daily notes of, among other things, their total expenditure, food expenditure, and health care expenditure.
Since both of these FilaBavi surveys included the necessary data for estimating catastrophic expenditure, this allowed for comparing the estimations from FilaBavi with the, in the Lancet paper, reported estimations from VLSS 1997/98. There was one important difference in the data, though. Food expenditure in the VLSS included the value of consumed food from own production. Since farmers constituted around 80% of the population in the Bavi district at the time (Chuc & Vinod, 2003), this, if not adjusted for, would cause comparability problems. To adjust for this we used data from VLSS 1997/98 on the share of food consumption from own production (Table 11).
29
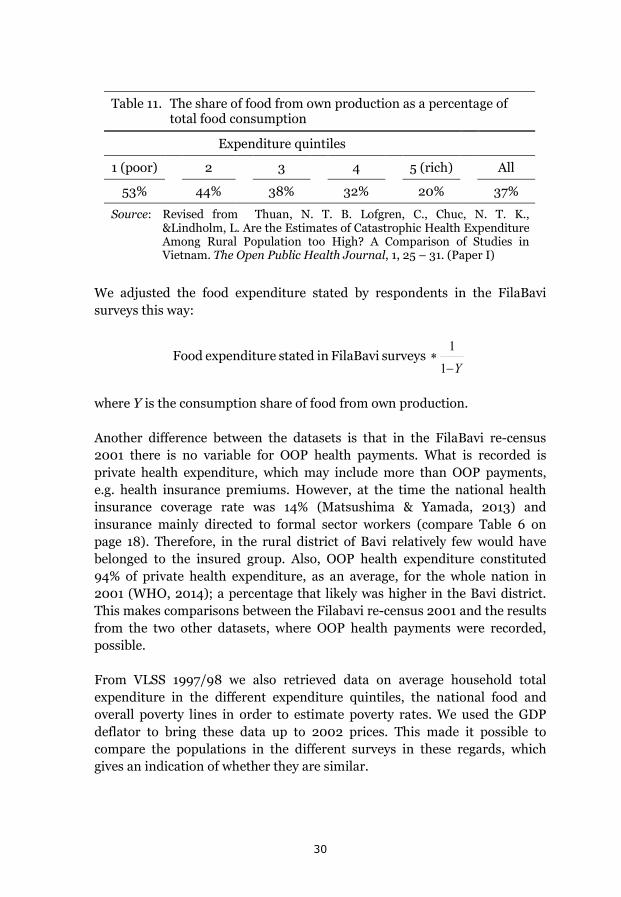
Table 11. The share of food from own production as a percentage of
total food consumption
Expenditure quintiles
1 (poor) 2 3 4 5 (rich) All
53% 44% 38% 32% 20% 37%
Source: Revised from Thuan, N. T. B. Lofgren, C., Chuc, N. T. K., &Lindholm, L. Are the Estimates of Catastrophic Health Expenditure Among Rural Population too High? A Comparison of Studies in Vietnam. The Open Public Health Journal, 1, 25 – 31. (Paper I)
We adjusted the food expenditure stated by respondents in the FilaBavi surveys this way:
surveys FilaBavi in stated eexpenditur FoodY−
∗1
1
where Y is the consumption share of food from own production.
Another difference between the datasets is that in the FilaBavi re-census 2001 there is no variable for OOP health payments. What is recorded is private health expenditure, which may include more than OOP payments, e.g. health insurance premiums. However, at the time the national health insurance coverage rate was 14% (Matsushima & Yamada, 2013) and insurance mainly directed to formal sector workers (compare Table 6 on page 18). Therefore, in the rural district of Bavi relatively few would have belonged to the insured group. Also, OOP health expenditure constituted 94% of private health expenditure, as an average, for the whole nation in 2001 (WHO, 2014); a percentage that likely was higher in the Bavi district. This makes comparisons between the Filabavi re-census 2001 and the results from the two other datasets, where OOP health payments were recorded, possible.
From VLSS 1997/98 we also retrieved data on average household total expenditure in the different expenditure quintiles, the national food and overall poverty lines in order to estimate poverty rates. We used the GDP deflator to bring these data up to 2002 prices. This made it possible to compare the populations in the different surveys in these regards, which gives an indication of whether they are similar.
30
The two main research questions are: how large is the difference in catastrophic health spending estimated in cross-sectional studies and a longitudinal panel study, and what may explain the differences?
Studying catastrophic health spending in a vulnerable group – the elderly (Paper II)
The development of OOP health payments and catastrophic health spending is described in the background section above. During the past twenty years there has been a reduction of the ratio of household OOP spending to household total health expenditure; from 80% to 49%. The share of households having catastrophic health spending has been reduced from 11% to 4%.
These are, however, estimated averages for the whole population. The reductions are large but the ratios are still of a size large enough to consider these health financing characteristics as important problems. When designing future policy reforms to reduce the problems further, it is of importance to go beyond national averages and study population groups that may be expected to be more vulnerable than the average household. We have focused on the situation for one such group, the elderly.
In Paper II, catastrophic health expenditure and impoverishment is reported for elderly households. We hypothesize that they are a particularly vulnerable group. What constitutes an elderly household can be defined in different ways. For studies on Vietnam one such definition is a household that includes at least one person 60 years of age or older (see e.g. Minh, Phuong, & Saksena, 2012). This is a broad definition that includes households where the elderly person is the only elderly one of many and younger household members, as well as households in which all the members are 60 years or older. Our interest was to find the households where the elderly dominate. In the final analysis we choose to define an all-elderly household as a household where all members are at least 60 years old.
The retirement age in Vietnam is 60 years for men and 55 years for women and this is why 60 years was chosen as a cut-off. There is an ongoing discussion in the country on raising the retirement age to 62 for men and 60 for women because projections show that pension funds are not financially sustainable in the present system (Thanh Nien News, 2014). The choice of
31
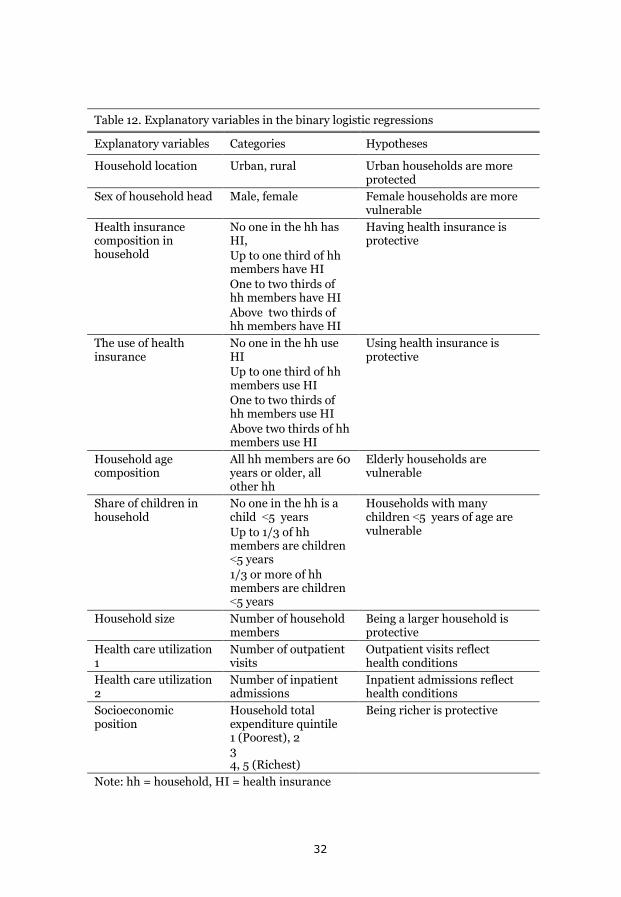
Table 12. Explanatory variables in the binary logistic regressions
Explanatory variables Categories Hypotheses
Household location Urban, rural Urban households are more protected
Sex of household head Male, female Female households are more vulnerable
Health insurance composition in household
No one in the hh has HI, Up to one third of hh members have HI One to two thirds of hh members have HI Above two thirds of hh members have HI
Having health insurance is protective
The use of health insurance
No one in the hh use HI Up to one third of hh members use HI One to two thirds of hh members use HI Above two thirds of hh members use HI
Using health insurance is protective
Household age composition
All hh members are 60 years or older, all other hh
Elderly households are vulnerable
Share of children in household
No one in the hh is a child ˂5 years Up to 1/3 of hh members are children ˂5 years 1/3 or more of hh members are children ˂5 years
Households with many children ˂5 years of age are vulnerable
Household size Number of household members
Being a larger household is protective
Health care utilization 1
Number of outpatient visits
Outpatient visits reflect health conditions
Health care utilization 2
Number of inpatient admissions
Inpatient admissions reflect health conditions
Socioeconomic position
Household total expenditure quintile 1 (Poorest), 2 3 4, 5 (Richest)
Being richer is protective
Note: hh = household, HI = health insurance
32
60 years as a cutting point suits both the present situation and a possible raise of the retirement age in line with the present proposals.
Elderly households may be particularly vulnerable to the problems of health financing. They are likely to live on a lower income, and they are likely to have more health problems, than households in which the members are younger. To study this we have obtained data from the Vietnam Household Living Standards Survey (VHLSS) 2010. Today the data from VHLSS 2012 have been published, but at the time our study was done VHLSS 2010 was the latest published survey. VHLSS has been described in the section on data sources above.
The two basic questions in our study of the elderly households are: how large is catastrophic health expenditure and impoverishment for these households? and, if catastrophic expenditure and impoverishment is found to be larger for the elderly households than for the average household, what are the associations between household characteristics, including being an elderly household, and the outcome variables in a multivariable analysis?
In the study there was first a descriptive analysis done. Households OOP health payments as a share of household capacity to pay, the share of households having catastrophic health expenditure, and the share of households being impoverished were studied for households with differences in age composition.
The age composition of households was also, in the descriptive analysis, related to household total expenditure quintiles (a socioeconomic classification), to health care utilization (outpatient visits and inpatient admissions), and to the extent household members have health insurance. This is of interest because if a larger share of the elderly households is found to have catastrophic health care expenditure than the average household, is this a result of them e.g. living on a lower expenditure (income) level or having less of protection from health insurance than the average household?
To examine the second question a multivariable analysis was done using binary logistic regression. The dependent variable in one regression was “having catastrophic health spending or not” and in another regression “being impoverished or not”. The independent variables were chosen from the rich data material in VHLSS based on our hypotheses of what would be associated with the outcome on each of the dependent variables. They are described in Table 12.
33
Studying if a health insurance reform improves the situation for those insured (Paper III)
The large OOP payments for health that followed the Doi Moi reforms has been, and is, of major concern for the Vietnamese government. In the early 1990’s, a reform process was started aiming at protecting people from financial shocks caused by health problems. The policy choice became to develop health insurance as the primary source of health financing (Somanathan et al, 2014).
The development of health insurance has been described in the background section above (compare Table 6 on page 18). One important reform was implemented in 2002 through the Government Decision 139; the Health Care Funds for the Poor (HCFP). In 2009 we became interested in studying the effects of this reform. Two assessments had been done at the time using data from VHLSS 2004 (Wagstaff, 2007) and from VHLSS 2002 and 2004 (Axelson, Bales, Minh, Ekman, & Gerdtham, 2009). Since these studies focused on the short term effects of the reform we wanted to explore the effects using a longer time perspective. We chose to use FilaBavi data from the re-censuses in 2001, 2003, 2005, and 2007.
The beneficiaries of the HCFP reform were households classified as poor according to the national poverty line, households in ethnic minority groups in specified mountain provinces, and households in areas specified as economically disadvantaged. In 2003 there were 11 million beneficiaries constituting 14% of the Vietnamese population (Thanh, Löfgren, Phuc, Chuc, & Lindholm, 2010 – Paper III). The insurance package covered both outpatient and inpatient care but in the beginning only for public health care facilities. In 2005 a new law opened up health insurance coverage (including HCFP) for using private providers as well, but so far few private providers have been contracted into the system (Axelson et al, 2010).
The questions we wanted to study were:
How has the HCFP reform affected 1) household healthcare expenditure, 2) utilization of public and 3) private health care for the poor. Has their situation improved in these regards as an effect of the reform?
For the first question we studied how household healthcare expenditure as a percentage of total household expenditure has changed from 2001 to 2007. As was pointed out for Paper I, OOP health expenditure was not recorded in the FilaBavi re-censuses. There is a difference between the variable household health care expenditure and OOP health expenditure. Health
34
insurance premiums, for instance, is included in the former but not in the latter. However, OOP health payments constitute the bulk of private health expenditure. In 2001 OOP expenditure constituted 94% of private health expenditure, a share that in 2007 had only decreased by three percentage points (WHO, 2014).
The motivation for asking question 2 is that in general the quality of public healthcare is better, the higher up in the system it is given. We have differentiated between the utilization at commune health stations, district health centers and provincial/central hospitals for public health care. There is also a quality issue concerning private health care. In Vietnam, this is a very heterogeneous group of caregivers. In the Bavi district, it includes public health staff seeing patients after office hours, private clinics, and traditional healers. The conclusions from a community based survey in a rural area of Vietnam done in 2001 was that the quality of privately provided health care was significantly lower than for public care (Tuan, Dung, Neu, & Dibley, 2005).
So, if household health care expenditure as a percentage of total household expenditure has decreased for the poor, and if their use of public facilities has increased and that of private facilities decreased during the study period, this would be an improvement for the HCFP beneficiaries. We have also studied self-treatment and pharmacy visits. Self-treatment, in this study, means that they treat themselves with something available at home, including treatment without drugs, treatment with some herbs available in their gardens etc. Visits to a pharmacy means they buy drugs with or without the advice of a pharmacist.
Over the period of seven years, from 2001 to 2007, the values of the variables we are interested in changed for a number of reasons. It has been pointed out in the background that economic growth was very high during the period. Households became richer. Government health care expenditure showed a strong increase (compare Table 5, page 16). Finding answers to our questions means isolating the effects of HCFP from everything else of relevance that happened.
To do this, we have used propensity score matching, studying the differences in the change of the variables between beneficiaries of HCFP and a control group. Propensity score matching is a method by which one can compare those that are “treated” or “exposed” (the beneficiaries of HCFP) to those unexposed (not receiving benefits from HCFP) holding constant other factors of relevance. In a randomized controlled trial the exposed and unexposed groups would be identical in all other aspects except for the
35
exposure. Propensity score matching is a way to mimic this when a randomized controlled trial is not possible (Oakes & Johnson, 2006).
To compare the exposure group and the control group we have done a logistic regression where the independent variable is whether you are exposed or not (a beneficiary of HCFP or not). The covariates are variables that we hypothesize are predictive of being exposed or not. The result of the regression is a propensity score for each case (household) being the probability of being exposed. We then use nearest neighbor matching; we compare households with similar propensity scores in the exposed group and in the control group. This means that we compare the exposed households to households in the control group who are similar in relevant characteristics but were not exposed.
We did not have information about which households that were the beneficiaries of HCFP. That information rests with the managers of HCFP at the provincial and local level. We assumed that the households in the FilaBavi dataset that were, by the communal peoples committees, classified as “poor” or “very poor” were covered. We also assumed that households living in the mountainous areas and economically disadvantage areas (in the Bavi district) were covered by the HCFP. By, in that way, identifying the exposed group we could make comparisons to the “nearest neighbors”; those not covered (not classified as “poor” or “very poor” by local leaders) but sharing the same characteristics as the covered.
To estimate the propensity scores in the logistic regression we used variables characterizing the household head (age, sex, schooling, ethnicity, religion, marital status, and occupation), and a row of household characteristics (among them distance to health facilities, household size, income, expenditure, debts, proportion of elderly and children, and sickness episodes).
Studying how people value health insurance (Paper IV)
When basing a country’s health financing largely on health insurance important questions are: to what extent will people join the insurance, and to what extent will they use it? This depends on the value they place on the insurance.
36
In 2004, the health insurance coverage rate in Vietnam was 23% (Ha, 2011). The plan was then to have universal coverage by 2010 (Prime Minister Decision number 35/2001/QD-TTg). To contribute to the discussion on how to achieve this we did a study on the willingness to pay (WTP) that households have for health insurance.
The number of contingent valuation studies eliciting WTP is rapidly increasing in health care (Drummond, Sculper, Torrance, O’Brian & Stoddart, 2005; van der Gaag, 2007). For studies on the feasibility of health insurance a contingent valuation method is well suited. The result will be a measure of the benefits that the health insurance creates for the households expressed in money units, which then may be compared to the costs for the health care provided through the insurance. This is what we wanted to do, again using the FilaBavi resources. We asked two main questions:
What is the willingness to pay, among households in the Bavi district, for a compulsory and for a voluntary health insurance?
Is their willingness to pay sufficiently high to finance a health insurance programme?
In 2004, from the larger FilaBavi sample, we randomly selected 30 households from each cluster, which resulted in 2,070 households. We also deliberately selected the households so that half of them would have women as household heads. These households were interviewed by the ordinary FilaBavi interviewers doing the re-censuses and the quarterly surveillance.
When eliciting WTP, a scenario is constructed describing the product for which WTP questions will be asked. This is the scenario presented to the respondents in our study:
We presented the respondents with three different health financing systems. The first one, A, was a strict OOP system; so strict that there would be no exemption cards. Households would pay the full cost for their health care utilization. B was a compulsory health insurance. The costs would be paid by the households through insurance premiums. They would be based on community rating where higher income households would pay more than lower income ones. C was a voluntary insurance based on risk rating; in this case based on the number of households members, children, and elderly in the households.
In the interviews household respondents were asked to choose the one of the three systems they preferred the most. Following that, they were asked about
37
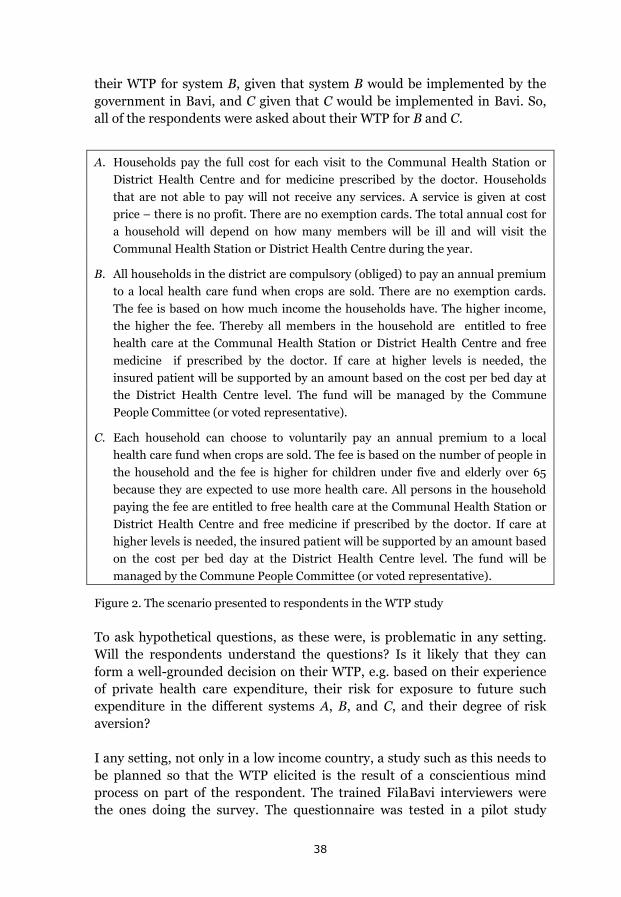
their WTP for system B, given that system B would be implemented by the government in Bavi, and C given that C would be implemented in Bavi. So, all of the respondents were asked about their WTP for B and C.
A. Households pay the full cost for each visit to the Communal Health Station or District Health Centre and for medicine prescribed by the doctor. Households that are not able to pay will not receive any services. A service is given at cost price – there is no profit. There are no exemption cards. The total annual cost for a household will depend on how many members will be ill and will visit the Communal Health Station or District Health Centre during the year.
B. All households in the district are compulsory (obliged) to pay an annual premium to a local health care fund when crops are sold. There are no exemption cards. The fee is based on how much income the households have. The higher income, the higher the fee. Thereby all members in the household are entitled to free health care at the Communal Health Station or District Health Centre and free medicine if prescribed by the doctor. If care at higher levels is needed, the insured patient will be supported by an amount based on the cost per bed day at the District Health Centre level. The fund will be managed by the Commune People Committee (or voted representative).
C. Each household can choose to voluntarily pay an annual premium to a local health care fund when crops are sold. The fee is based on the number of people in the household and the fee is higher for children under five and elderly over 65 because they are expected to use more health care. All persons in the household paying the fee are entitled to free health care at the Communal Health Station or District Health Centre and free medicine if prescribed by the doctor. If care at higher levels is needed, the insured patient will be supported by an amount based on the cost per bed day at the District Health Centre level. The fund will be managed by the Commune People Committee (or voted representative).
Figure 2. The scenario presented to respondents in the WTP study
To ask hypothetical questions, as these were, is problematic in any setting. Will the respondents understand the questions? Is it likely that they can form a well-grounded decision on their WTP, e.g. based on their experience of private health care expenditure, their risk for exposure to future such expenditure in the different systems A, B, and C, and their degree of risk aversion?
I any setting, not only in a low income country, a study such as this needs to be planned so that the WTP elicited is the result of a conscientious mind process on part of the respondent. The trained FilaBavi interviewers were the ones doing the survey. The questionnaire was tested in a pilot study
38
where 15 interviews were made with head of households not belonging to the sample. A new version of the questionnaire was developed based on the pilot study and further discussed in four focus groups made up of interviewers. All of the interviewers were trained on how to perform the interviews, once the questionnaire was finalized..
The WTP question was done in a bidding format with an open ended follow up question. The respondents were given a starting bid for each of the systems B and C: Would you be willing, for your household, to pay 45,00o (Vietnamese dong) per month for the insurance, yes or no? If yes or no, how much would be the maximum amount you would be willing to pay?
This starting bid, 45,000 dong per month, was based on the special yearlong study done in Bavi 2001 – 2002 (previously described, see page 29). The average monthly health expenditure for the households was in that study 43,208 dong, which was rounded off to the starting bid. The determinants of WTP were studied based on hypothesis about what predicts WTP.
Ethical approval
Ethical approval for the surveillance activities of the Epidemiological Field Laboratory for Health Systems Research (FilaBavi) was given by the Research Ethics Committee at Umeå University (reference number 02 – 420).
There was also additional ethical approval of the special study done in FilaBavi 2001 – 2002 where heads of households were interviewed once every month from July 2001 to June 2002.It was approved by the Scientific and Ethical Committee at Hanoi Medical University, and the Ministry of Health (Decision -QD-BYT-2001) and agreed on by local authorities and heads of households.
39

40
Results
What will be reported and discussed in this, and the following section, is that the yearlong panel study on catastrophic healthcare expenditure in the Bavi district (Paper I) cast interesting perspectives on the estimations of catastrophic spending estimated through cross-sectional studies. In the yearlong perspective (now, preceding the results and the discussion) the estimates are considerably smaller than what we found in the cross sectional studies. Reasons are; many households do not face catastrophic spending month after month, households cope in different ways with the catastrophe and manage to get back on track. Also, adherence to the stated recall period in the cross sectional studies may play a large role.
However, many households still face severe financial problems due to health care spending. Even though policies in Vietnam have been successful in considerably bringing down the very high OOP health spending reported some fifteen years ago, they are still at a problematically high level. And, for vulnerable groups they still are alarmingly high. One such group consists of elderly households (Paper II). Their situation resembles what was found for the entire population around the year 2000. This is one serious task to address in the future health insurance reform process.
Health insurance reforms do have a positive effect (Paper III). The burden of health spending on the household budget has on average lightened for the poor as a result of Health Care Funds for the Poor reform. However, the health insurance system in Vietnam faces a multitude of problems. One of them is the trust, or rather lack of trust, that the Vietnamese have, or do not have, for their health insurance system (Paper IV). A majority, in our findings, prefer an OOP system. Why?
In this introduction to the results section there is a mixture of results and discussion. The reason is simply a need to align the papers, and the findings in them, with the history of health financing problems and reforms in Vietnam described in the background. Below there will be a distinction between results and the discussion about them. Here are the results of the studies:
41
Comparing catastrophic health expenditure estimated from three different data sets (Paper I)
In the study, estimations of catastrophic health expenditure, that have been done using three different datasets, are compared. One estimation was done by Xu et al. (2003a) using data from VLSS 1997/98. The other two estimations have been done by the authors of Paper I using FilaBavi data; the re-census 2001, and a special yearlong survey done from July 2001 to June 2002. This has been described in the methods section.
VLSS 1997/98 and the FilaBavi re-census are cross-sectional surveys with a monthly recall period, while the FilaBavi yearlong survey consisted of a panel that was followed throughout the year. The households were interviewed once every month; the recall period was one month also for this survey.
Data were retrieved in the Filabavi re-census for 10,220 of the 11,089 households in the database. For the yearlong survey 629 households were sampled. At the end of the survey period, complete data had been collected for 621 of these households.
A comparison of average household total expenditure in the different expenditure quintiles was done between the three datasets and they turned out to be of roughly the same size. Also, the poverty rate is similar in the datasets. That may allow for the comparisons between them.
Catastrophic health expenditure was estimated using the method described in the methods section (compare page 26 ff.) Household OOP health expenditure was used for the estimations based on data from VLSS and the FilaBavi yearlong study. In the FilaBavi re-census OOP payments were not recorded so household private health expenditure was used instead. In this case the difference between these two measurements is very small, as explained in the methods section (page 30).
The main research questions were:
How large is the difference in catastrophic health spending estimated in cross sectional studies and a longitudinal panel study?
What may explain the differences?
42
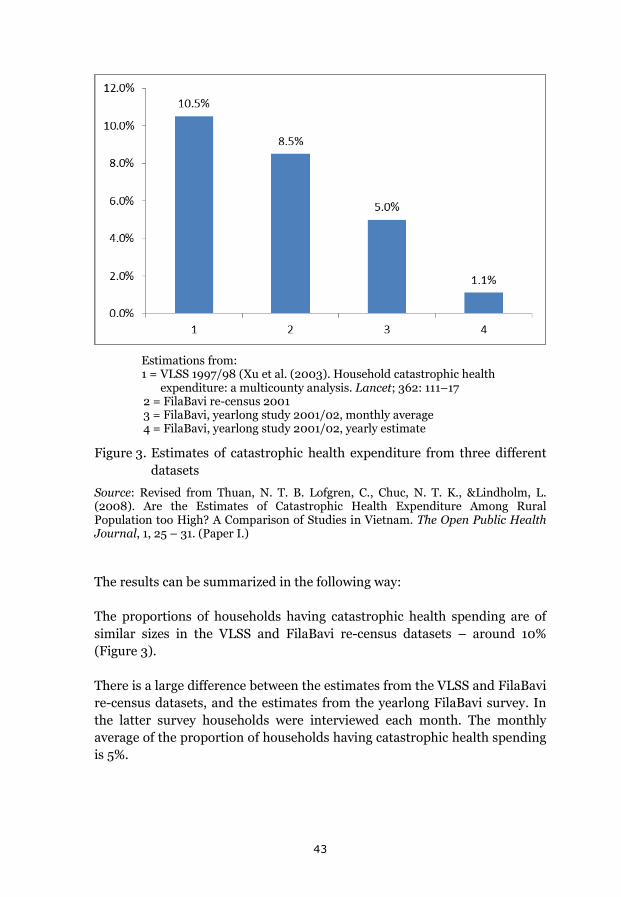
Estimations from: 1 = VLSS 1997/98 (Xu et al. (2003). Household catastrophic health
expenditure: a multicounty analysis. Lancet; 362: 111–17 2 = FilaBavi re-census 2001 3 = FilaBavi, yearlong study 2001/02, monthly average 4 = FilaBavi, yearlong study 2001/02, yearly estimate
Figure 3. Estimates of catastrophic health expenditure from three different datasets
Source: Revised from Thuan, N. T. B. Lofgren, C., Chuc, N. T. K., &Lindholm, L. (2008). Are the Estimates of Catastrophic Health Expenditure Among Rural Population too High? A Comparison of Studies in Vietnam. The Open Public Health Journal, 1, 25 – 31. (Paper I.)
The results can be summarized in the following way:
The proportions of households having catastrophic health spending are of similar sizes in the VLSS and FilaBavi re-census datasets – around 10% (Figure 3).
There is a large difference between the estimates from the VLSS and FilaBavi re-census datasets, and the estimates from the yearlong FilaBavi survey. In the latter survey households were interviewed each month. The monthly average of the proportion of households having catastrophic health spending is 5%.
43
These percentages all refer to a monthly period. For the whole year, in the FilaBavi yearlong study, the proportion of households having catastrophic health spending is 1%.
What explains these differences? That is the second question made above. To this, I will return in the discussions section.
Catastrophic health expenditure and impoverishment for the elderly (Paper II)
When studying the situation for the elderly, we made two questions:
How large is catastrophic health expenditure and impoverishment for elderly households?
If this is found to be larger for the elderly households than for average households, what are the associations between household characteristics, including being an elderly household, and the outcome variables in a multivariable analysis?
The study of the elderly is based on data from VHLSS 2010. In the dataset there are 9,398 households representing 22,334,062 households in the population. The VHLSS households consist of 37,001 individuals representing 86,466,052 individuals in the nation.
Most households (71%) are composed of only younger individuals, in the sense that there is no household member aged 60 or above. For 12% of the households the proportion of elderly (60 and above) is up to one third. For another 9% the elderly makes up one to two thirds of the household. Finally, for 8% of the households, the proportion of elderly is between two thirds and one hundred percent. We have focused on a group that is more narrowly defined. We focus on the “all-elderly” households where every household member is aged 60 or above. The reason for this interest is the rapid aging of the Vietnamese population in combination with the urbanization; a process mainly driven by the younger (compare page 13). In the future, more of the elderly will likely be “left alone”.
What characterizes these all-elderly households? In short, they are small, they live on a small income, and they consume more health care than the average household. And – their healthcare OOP expenditure in relation to their total expenditure, the percentages of them that face catastrophic health
44
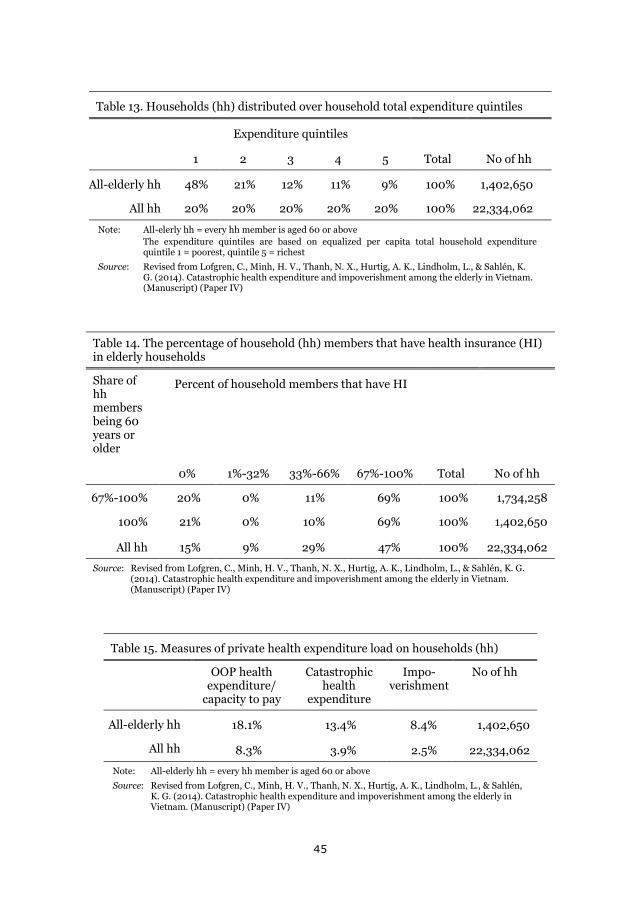
Table 13. Households (hh) distributed over household total expenditure quintiles
Expenditure quintiles
1 2 3 4 5 Total No of hh
All-elderly hh 48% 21% 12% 11% 9% 100% 1,402,650
All hh 20% 20% 20% 20% 20% 100% 22,334,062
Note: All-elerly hh = every hh member is aged 60 or above The expenditure quintiles are based on equalized per capita total household expenditure
quintile 1 = poorest, quintile 5 = richest
Source: Revised from Lofgren, C., Minh, H. V., Thanh, N. X., Hurtig, A. K., Lindholm, L., & Sahlén, K. G. (2014). Catastrophic health expenditure and impoverishment among the elderly in Vietnam. (Manuscript) (Paper IV)
Table 14. The percentage of household (hh) members that have health insurance (HI) in elderly households
Share of hh members being 60 years or older
Percent of household members that have HI
0% 1%-32% 33%-66% 67%-100% Total No of hh
67%-100% 20% 0% 11% 69% 100% 1,734,258
100% 21% 0% 10% 69% 100% 1,402,650
All hh 15% 9% 29% 47% 100% 22,334,062
Source: Revised from Lofgren, C., Minh, H. V., Thanh, N. X., Hurtig, A. K., Lindholm, L., & Sahlén, K. G. (2014). Catastrophic health expenditure and impoverishment among the elderly in Vietnam. (Manuscript) (Paper IV)
Table 15. Measures of private health expenditure load on households (hh)
OOP health expenditure/
capacity to pay
Catastrophic health
expenditure
Impo-verishment
No of hh
All-elderly hh 18.1% 13.4% 8.4% 1,402,650
All hh 8.3% 3.9% 2.5% 22,334,062
Note: All-elderly hh = every hh member is aged 60 or above
Source: Revised from Lofgren, C., Minh, H. V., Thanh, N. X., Hurtig, A. K., Lindholm, L., & Sahlén, K. G. (2014). Catastrophic health expenditure and impoverishment among the elderly in Vietnam. (Manuscript) (Paper IV)
45
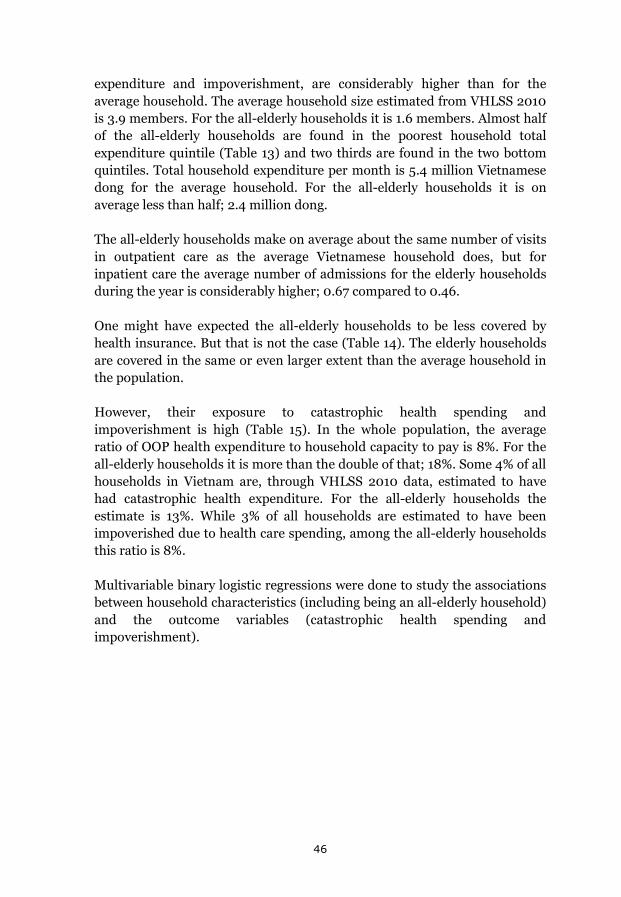
expenditure and impoverishment, are considerably higher than for the average household. The average household size estimated from VHLSS 2010 is 3.9 members. For the all-elderly households it is 1.6 members. Almost half of the all-elderly households are found in the poorest household total expenditure quintile (Table 13) and two thirds are found in the two bottom quintiles. Total household expenditure per month is 5.4 million Vietnamese dong for the average household. For the all-elderly households it is on average less than half; 2.4 million dong.
The all-elderly households make on average about the same number of visits in outpatient care as the average Vietnamese household does, but for inpatient care the average number of admissions for the elderly households during the year is considerably higher; 0.67 compared to 0.46.
One might have expected the all-elderly households to be less covered by health insurance. But that is not the case (Table 14). The elderly households are covered in the same or even larger extent than the average household in the population.
However, their exposure to catastrophic health spending and impoverishment is high (Table 15). In the whole population, the average ratio of OOP health expenditure to household capacity to pay is 8%. For the all-elderly households it is more than the double of that; 18%. Some 4% of all households in Vietnam are, through VHLSS 2010 data, estimated to have had catastrophic health expenditure. For the all-elderly households the estimate is 13%. While 3% of all households are estimated to have been impoverished due to health care spending, among the all-elderly households this ratio is 8%.
Multivariable binary logistic regressions were done to study the associations between household characteristics (including being an all-elderly household) and the outcome variables (catastrophic health spending and impoverishment).
46
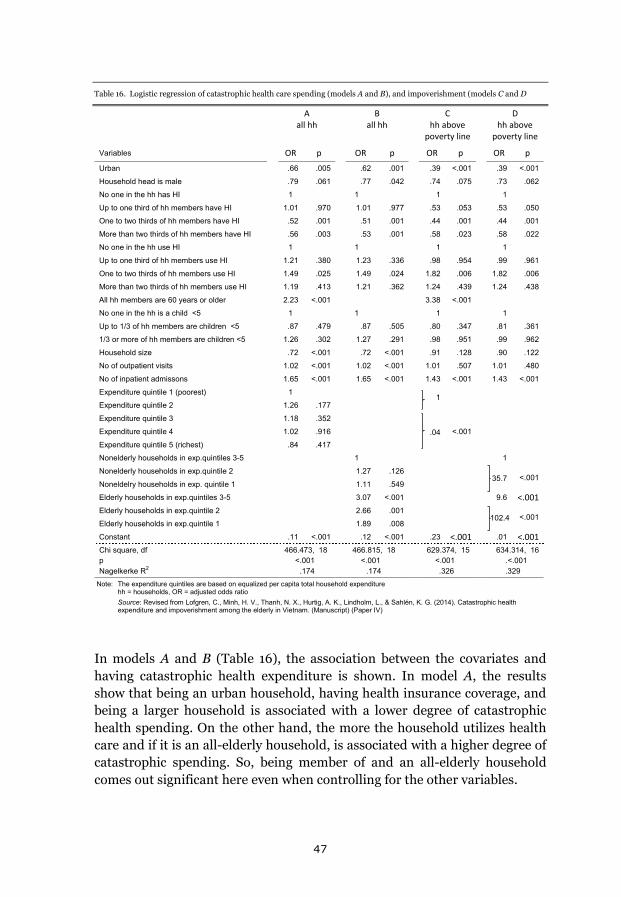
A
all hh B
all hh C
hh above poverty line
D hh above
poverty line
Variables OR p OR p OR p OR p
Urban .66 .005 .62 .001 .39 ˂.001 .39 ˂.001
Household head is male .79 .061 .77 .042 .74 .075 .73 .062
No one in the hh has HI 1 1 1 1
Up to one third of hh members have HI 1.01 .970 1.01 .977 .53 .053 .53 .050
One to two thirds of hh members have HI .52 .001 .51 .001 .44 .001 .44 .001
More than two thirds of hh members have HI .56 .003 .53 .001 .58 .023 .58 .022
No one in the hh use HI 1 1 1 1
Up to one third of hh members use HI 1.21 .380 1.23 .336 .98 .954 .99 .961
One to two thirds of hh members use HI 1.49 .025 1.49 .024 1.82 .006 1.82 .006
More than two thirds of hh members use HI 1.19 .413 1.21 .362 1.24 .439 1.24 .438
All hh members are 60 years or older 2.23 ˂.001 3.38 ˂.001
No one in the hh is a child ˂5 1 1 1 1
Up to 1/3 of hh members are children ˂5 .87 .479 .87 .505 .80 .347 .81 .361
1/3 or more of hh members are children ˂5 1.26 .302 1.27 .291 .98 .951 .99 .962
Household size .72 ˂.001 .72 ˂.001 .91 .128 .90 .122
No of outpatient visits 1.02 ˂.001 1.02 ˂.001 1.01 .507 1.01 .480
No of inpatient admissons 1.65 ˂.001 1.65 ˂.001 1.43 ˂.001 1.43 ˂.001
Expenditure quintile 1 (poorest) 1 1
Expenditure quintile 2 1.26 .177 Expenditure quintile 3 1.18 .352
.04 ˂.001
Expenditure quintile 4 1.02 .916 Expenditure quintile 5 (richest) .84 .417 Nonelderly households in exp.quintiles 3-5 1 1
Nonelderly households in exp.quintile 2 1.27 .126 35.7 ˂.001
Noneldelry households in exp. quintile 1 1.11 .549 Elderly households in exp.quintiles 3-5 3.07 ˂.001 9.6 ˂.001
Elderly households in exp.quintile 2 2.66 .001 102.4 ˂.001
Elderly households in exp.quintile 1 1.89 .008 Constant .11 ˂.001 .12 ˂.001 .23 ˂.001 .01 ˂.001 Chi square, df p Nagelkerke R2
466.473, 18 ˂.001
.174
466.815, 18 ˂.001
.174
629.374, 15 ˂.001 .326
634.314, 16 .˂.001 .329
Note: The expenditure quintiles are based on equalized per capita total household expenditure hh = households, OR = adjusted odds ratio
Source: Revised from Lofgren, C., Minh, H. V., Thanh, N. X., Hurtig, A. K., Lindholm, L., & Sahlén, K. G. (2014). Catastrophic health expenditure and impoverishment among the elderly in Vietnam. (Manuscript) (Paper IV)
Table 16. Logistic regression of catastrophic health care spending (models A and B), and impoverishment (models C and D
In models A and B (Table 16), the association between the covariates and having catastrophic health expenditure is shown. In model A, the results show that being an urban household, having health insurance coverage, and being a larger household is associated with a lower degree of catastrophic health spending. On the other hand, the more the household utilizes health care and if it is an all-elderly household, is associated with a higher degree of catastrophic spending. So, being member of and an all-elderly household comes out significant here even when controlling for the other variables.
47
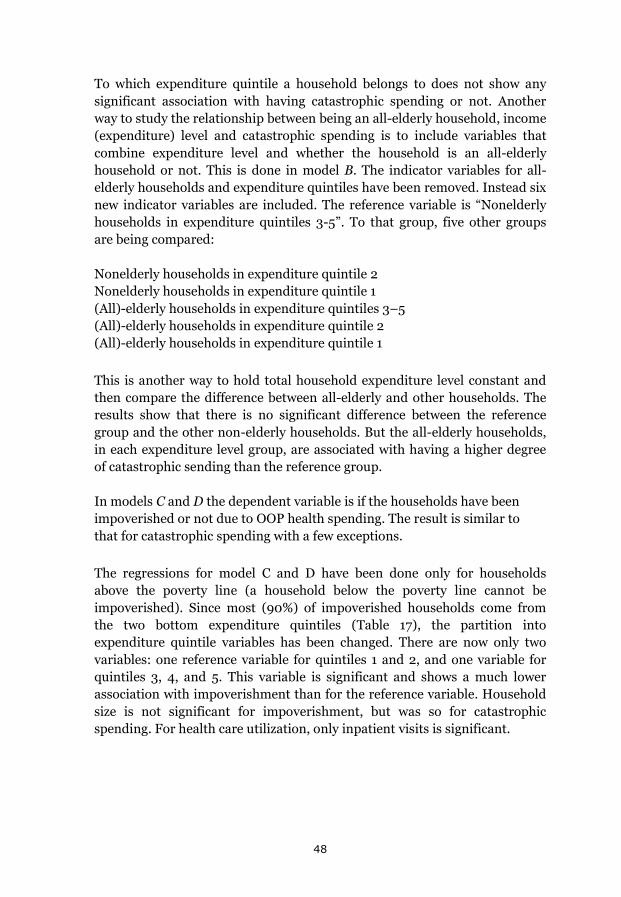
To which expenditure quintile a household belongs to does not show any significant association with having catastrophic spending or not. Another way to study the relationship between being an all-elderly household, income (expenditure) level and catastrophic spending is to include variables that combine expenditure level and whether the household is an all-elderly household or not. This is done in model B. The indicator variables for all-elderly households and expenditure quintiles have been removed. Instead six new indicator variables are included. The reference variable is “Nonelderly households in expenditure quintiles 3-5”. To that group, five other groups are being compared:
Nonelderly households in expenditure quintile 2 Nonelderly households in expenditure quintile 1 (All)-elderly households in expenditure quintiles 3–5 (All)-elderly households in expenditure quintile 2 (All)-elderly households in expenditure quintile 1
This is another way to hold total household expenditure level constant and then compare the difference between all-elderly and other households. The results show that there is no significant difference between the reference group and the other non-elderly households. But the all-elderly households, in each expenditure level group, are associated with having a higher degree of catastrophic sending than the reference group.
In models C and D the dependent variable is if the households have been impoverished or not due to OOP health spending. The result is similar to that for catastrophic spending with a few exceptions.
The regressions for model C and D have been done only for households above the poverty line (a household below the poverty line cannot be impoverished). Since most (90%) of impoverished households come from the two bottom expenditure quintiles (Table 17), the partition into expenditure quintile variables has been changed. There are now only two variables: one reference variable for quintiles 1 and 2, and one variable for quintiles 3, 4, and 5. This variable is significant and shows a much lower association with impoverishment than for the reference variable. Household size is not significant for impoverishment, but was so for catastrophic spending. For health care utilization, only inpatient visits is significant.
48
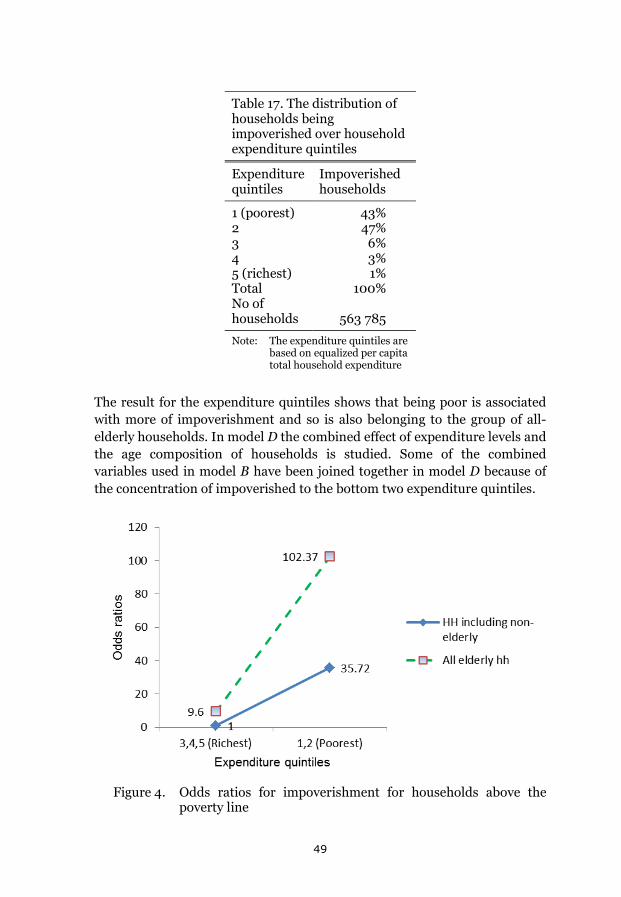
Table 17. The distribution of households being impoverished over household expenditure quintiles
Expenditure quintiles
Impoverished households
1 (poorest) 43% 2 47% 3 6% 4 3% 5 (richest) 1% Total 100% No of households
563 785
Note: The expenditure quintiles are based on equalized per capita total household expenditure
The result for the expenditure quintiles shows that being poor is associated with more of impoverishment and so is also belonging to the group of all-elderly households. In model D the combined effect of expenditure levels and the age composition of households is studied. Some of the combined variables used in model B have been joined together in model D because of the concentration of impoverished to the bottom two expenditure quintiles.
Figure 4. Odds ratios for impoverishment for households above the
poverty line
49
The reference variable is again “Nonelderly households in expenditure quintiles 3-5”. The results (Table 16 and Figure 4) show that being an all-elderly household is associated with much more of impoverishment also when expenditure level is controlled for.
Catastrophic health expenditure and impoverishment were found to be very large problems for the all-elderly households in comparison with the population at large. The results of the multivariable analysis are addressed in the discussions section below.
The effects of a health insurance reform for the poor (Paper III)
How was health expenditure and health care utilization for the poor affected by the Health Care Funds for the Poor (HCFP), established in 2002? Was the situation for the poor improved because of the reform? These were the questions we made when planning to study the effects of the reform.
We used FilaBavi data for the period 2001 – 2007 and compared the development of health expenditure and utilization for the beneficiaries of HCFP to a control group using propensity score matching. In the FilaBavi dataset there were 10,711 households for whom valid information was found in the re-censuses done in 2001, 2003, 2005, and 2007. Of these households 14.6% were classified as poor.
The results show the following for health care expenditure. (A common terminology in propensity score matching is being used. Households classified as poor and thereby beneficiaries of HCFP belong to the “treated” group, others belong to the “control” group from which households are chosen in the matching with the treated – see Table 18 and Table 19).
Both for treated and controls, household health care expenditure as a percentage of total household expenditure was largely reduced in this time period (Table 18). Almost all of the reduction took place in the first period; 2001 – 2003.
How much of this reduction for the treated may be attributed to the HCFP? The results of the comparison with similar households through propensity score matching is shown in Table 19).
50
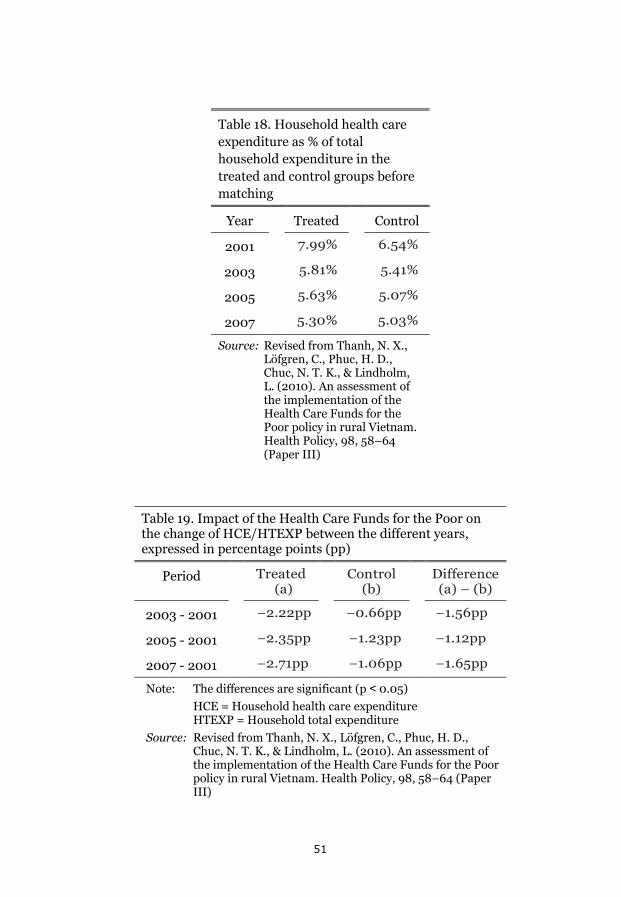
Table 18. Household health care expenditure as % of total household expenditure in the treated and control groups before matching
Year Treated Control
2001 7.99% 6.54%
2003 5.81% 5.41%
2005 5.63% 5.07%
2007 5.30% 5.03%
Source: Revised from Thanh, N. X., Löfgren, C., Phuc, H. D., Chuc, N. T. K., & Lindholm, L. (2010). An assessment of the implementation of the Health Care Funds for the Poor policy in rural Vietnam. Health Policy, 98, 58–64 (Paper III)
Table 19. Impact of the Health Care Funds for the Poor on the change of HCE/HTEXP between the different years, expressed in percentage points (pp)
Period Treated (a)
Control (b)
Difference (a) – (b)
2003 - 2001 −2.22pp −0.66pp −1.56pp
2005 - 2001 −2.35pp −1.23pp −1.12pp
2007 - 2001 −2.71pp −1.06pp −1.65pp
Note: The differences are significant (p ˂ 0.05) HCE = Household health care expenditure
HTEXP = Household total expenditure Source: Revised from Thanh, N. X., Löfgren, C., Phuc, H. D.,
Chuc, N. T. K., & Lindholm, L. (2010). An assessment of the implementation of the Health Care Funds for the Poor policy in rural Vietnam. Health Policy, 98, 58–64 (Paper III)
51
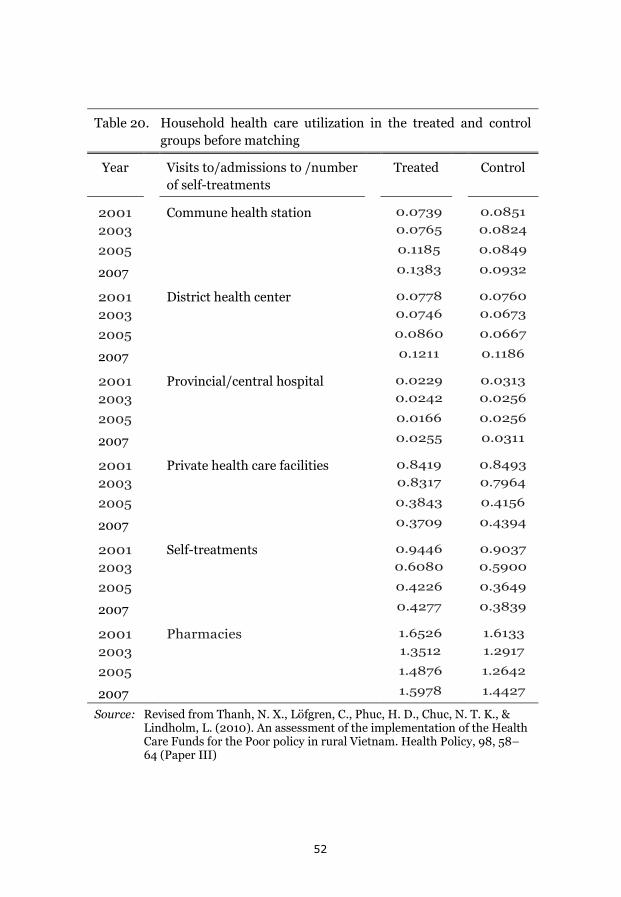
Table 20. Household health care utilization in the treated and control groups before matching
Year Visits to/admissions to /number of self-treatments
Treated Control
2001 Commune health station 0.0739 0.0851
2003 0.0765 0.0824
2005 0.1185 0.0849
2007 0.1383 0.0932
2001 District health center 0.0778 0.0760
2003 0.0746 0.0673
2005 0.0860 0.0667
2007 0.1211 0.1186
2001 Provincial/central hospital 0.0229 0.0313
2003 0.0242 0.0256
2005 0.0166 0.0256
2007 0.0255 0.0311
2001 Private health care facilities 0.8419 0.8493
2003 0.8317 0.7964
2005 0.3843 0.4156
2007 0.3709 0.4394
2001 Self-treatments 0.9446 0.9037
2003 0.6080 0.5900
2005 0.4226 0.3649
2007 0.4277 0.3839
2001 Pharmacies 1.6526 1.6133
2003 1.3512 1.2917
2005 1.4876 1.2642
2007 1.5978 1.4427
Source: Revised from Thanh, N. X., Löfgren, C., Phuc, H. D., Chuc, N. T. K., & Lindholm, L. (2010). An assessment of the implementation of the Health Care Funds for the Poor policy in rural Vietnam. Health Policy, 98, 58–64 (Paper III)
52
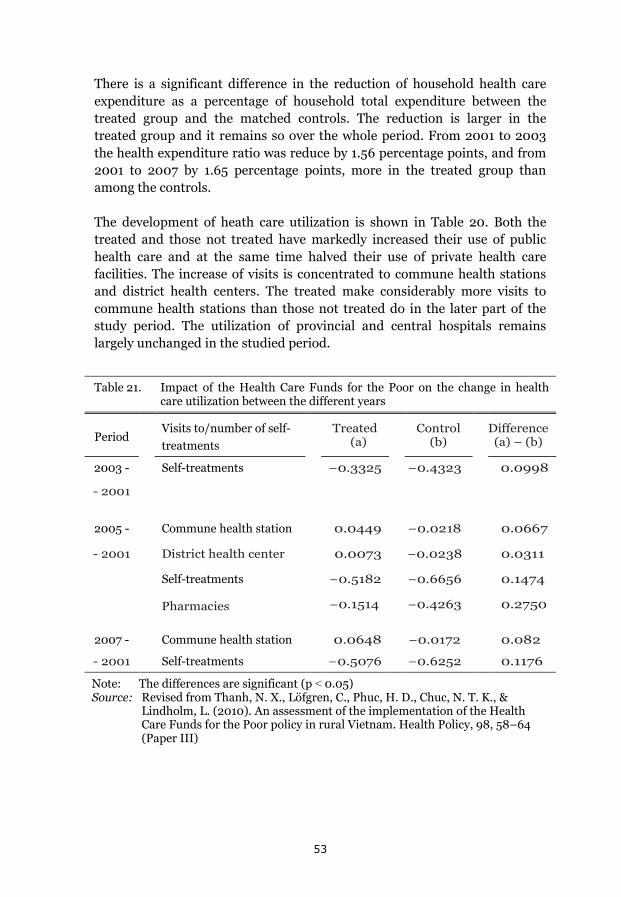
There is a significant difference in the reduction of household health care expenditure as a percentage of household total expenditure between the treated group and the matched controls. The reduction is larger in the treated group and it remains so over the whole period. From 2001 to 2003 the health expenditure ratio was reduce by 1.56 percentage points, and from 2001 to 2007 by 1.65 percentage points, more in the treated group than among the controls.
The development of heath care utilization is shown in Table 20. Both the treated and those not treated have markedly increased their use of public health care and at the same time halved their use of private health care facilities. The increase of visits is concentrated to commune health stations and district health centers. The treated make considerably more visits to commune health stations than those not treated do in the later part of the study period. The utilization of provincial and central hospitals remains largely unchanged in the studied period.
Table 21. Impact of the Health Care Funds for the Poor on the change in health
care utilization between the different years
Period Visits to/number of self-treatments
Treated
(a) Control (b) Difference
(a) – (b)
2003 - Self-treatments −0.3325 −0.4323 0.0998
- 2001
2005 - Commune health station 0.0449 −0.0218 0.0667
- 2001 District health center 0.0073 −0.0238 0.0311
Self-treatments −0.5182 −0.6656 0.1474
Pharmacies −0.1514 −0.4263 0.2750
2007 - Commune health station 0.0648 −0.0172 0.082
- 2001 Self-treatments −0.5076 −0.6252 0.1176
Note: The differences are significant (p ˂ 0.05) Source: Revised from Thanh, N. X., Löfgren, C., Phuc, H. D., Chuc, N. T. K., &
Lindholm, L. (2010). An assessment of the implementation of the Health Care Funds for the Poor policy in rural Vietnam. Health Policy, 98, 58–64 (Paper III)
53
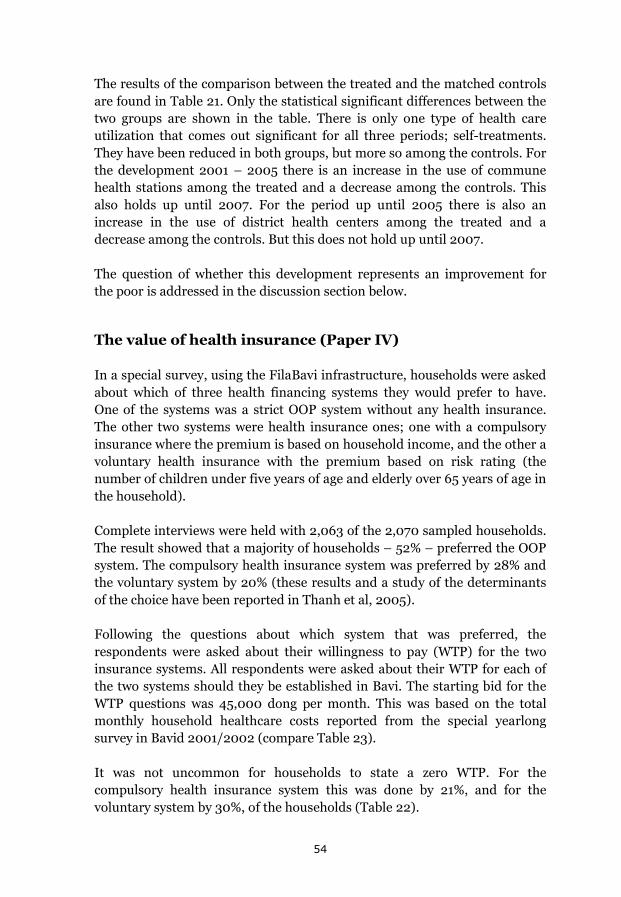
The results of the comparison between the treated and the matched controls are found in Table 21. Only the statistical significant differences between the two groups are shown in the table. There is only one type of health care utilization that comes out significant for all three periods; self-treatments. They have been reduced in both groups, but more so among the controls. For the development 2001 – 2005 there is an increase in the use of commune health stations among the treated and a decrease among the controls. This also holds up until 2007. For the period up until 2005 there is also an increase in the use of district health centers among the treated and a decrease among the controls. But this does not hold up until 2007.
The question of whether this development represents an improvement for the poor is addressed in the discussion section below.
The value of health insurance (Paper IV)
In a special survey, using the FilaBavi infrastructure, households were asked about which of three health financing systems they would prefer to have. One of the systems was a strict OOP system without any health insurance. The other two systems were health insurance ones; one with a compulsory insurance where the premium is based on household income, and the other a voluntary health insurance with the premium based on risk rating (the number of children under five years of age and elderly over 65 years of age in the household).
Complete interviews were held with 2,063 of the 2,070 sampled households. The result showed that a majority of households – 52% – preferred the OOP system. The compulsory health insurance system was preferred by 28% and the voluntary system by 20% (these results and a study of the determinants of the choice have been reported in Thanh et al, 2005).
Following the questions about which system that was preferred, the respondents were asked about their willingness to pay (WTP) for the two insurance systems. All respondents were asked about their WTP for each of the two systems should they be established in Bavi. The starting bid for the WTP questions was 45,000 dong per month. This was based on the total monthly household healthcare costs reported from the special yearlong survey in Bavid 2001/2002 (compare Table 23).
It was not uncommon for households to state a zero WTP. For the compulsory health insurance system this was done by 21%, and for the voluntary system by 30%, of the households (Table 22).
54
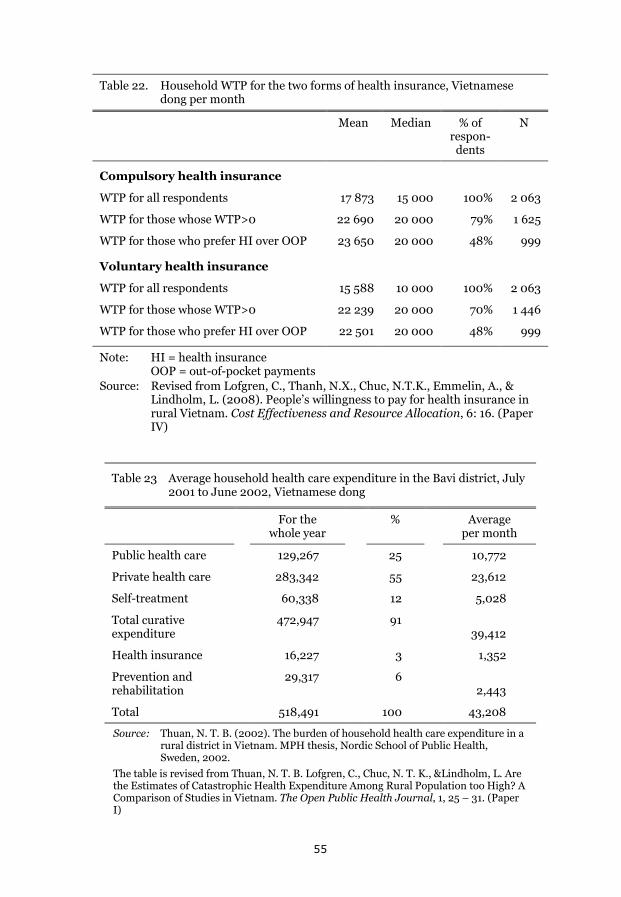
Table 22. Household WTP for the two forms of health insurance, Vietnamese dong per month
Mean Median % of respon-
dents
N
Compulsory health insurance
WTP for all respondents 17 873 15 000 100% 2 063
WTP for those whose WTP>0 22 690 20 000 79% 1 625
WTP for those who prefer HI over OOP 23 650 20 000 48% 999
Voluntary health insurance
WTP for all respondents 15 588 10 000 100% 2 063
WTP for those whose WTP>0 22 239 20 000 70% 1 446
WTP for those who prefer HI over OOP 22 501 20 000 48% 999
Note: HI = health insurance OOP = out-of-pocket payments
Source: Revised from Lofgren, C., Thanh, N.X., Chuc, N.T.K., Emmelin, A., & Lindholm, L. (2008). People’s willingness to pay for health insurance in rural Vietnam. Cost Effectiveness and Resource Allocation, 6: 16. (Paper IV)
Table 23 Average household health care expenditure in the Bavi district, July 2001 to June 2002, Vietnamese dong
For the whole year
% Average per month
Public health care 129,267 25 10,772
Private health care 283,342 55 23,612
Self-treatment 60,338 12 5,028
Total curative expenditure
472,947 91 39,412
Health insurance 16,227 3 1,352
Prevention and rehabilitation
29,317 6 2,443
Total 518,491 100 43,208
Source: Thuan, N. T. B. (2002). The burden of household health care expenditure in a rural district in Vietnam. MPH thesis, Nordic School of Public Health, Sweden, 2002.
The table is revised from Thuan, N. T. B. Lofgren, C., Chuc, N. T. K., &Lindholm, L. Are the Estimates of Catastrophic Health Expenditure Among Rural Population too High? A Comparison of Studies in Vietnam. The Open Public Health Journal, 1, 25 – 31. (Paper I)
55
The average WTP per month ranges from 18,000 for all respondents, and 23000 for respondents with a WTP above zero, to 24,ooo for respondents preferring a health insurance system over the OOP one.
Comparing to the household health care costs estimated in the special yearlong FilaBavi survey 2001/2002, the average WTP for all respondents is around 40% of the starting bid. WTP for respondents with a WTP above zero is around half of the starting bid. At the time this study was done in Bavi, costs for private health care dominated the total household health care costs (55%, compare Table 23). The average WTP stated would cover household costs for public health care and self-treatment, but not the costs for private health care.
We raised two questions in this study. How much are households willing to pay for two different health insurance systems, and is their WTP sufficiently high to finance the insurance programmes. The second question will be addressed in the discussion section.
56
Discussion
Methodological considerations
Household total expenditure as a basis for estimating catastrophic spending
In the description above of how catastrophic spending is being estimated (compare page 27) using household total expenditure rather than income is motivated. Reasons given are that expenditure fluctuates less than income and that respondents may be less unwilling to reveal their expenditure than their income. However, also for expenditure there are a number of limitations that might cause expenditure not to accurately reflect the financial situation of households. Expenditure may also be misreported. Respondents may not wish to reveal all expenditure. Also, in the type of surveys used for the studies reported in this thesis, the respondents may simply not be aware of all the expenditure in the households. The estimation of food from own production, which is used in the VHLSS (Paper II) and based on VHLSS averages for household expenditure quintiles estimated on FilaBavi data (Paper I), may not accurately reflect the quantity and quality of these products and therefore not be accurately priced. Differences in the recall period between different surveys may also lead to problems of comparability (Howe et al, 2012).
However, there appears to be a consensus among researchers that, in a low income country setting, using expenditure is better than using income (Deaton & Saidi, 2002).
Other methods for assessing the financial situation for households, or their wellbeing, include using some index of assets, the education, and the occupation of household members. It is also possible to have community members classify the socioeconomic position of households (Howe et al, 2012). In Paper III we use a local leaders’ classification into “poor” and “very poor” households in an attempt to determine who the beneficiaries were of the Health Care Funds for the Poor.
In a FilaBavi study of different poverty measurements there was a large difference in the reported household income and expenditure. The median of household total monthly income was 61,000 dong whereas the total expenditure median was 213,140 (Khe, Eriksson, Phuong, Höjer, & Diwan, 2003).
57
Estimating catastrophic health spending – a limited view.
There are a considerable number of studies on catastrophic health spending done in different countries (Alam and Mahal, 2014). This makes comparisons possible to the extent that the same or similar methods have been used. In Vietnam, the estimates of catastrophic spending from 1998, 2002, and 2010 may be related to the development of OOP health spending and the growth of health insurance, which was done in the background section. However, it is important to point out the limited perspective, given by estimates of catastrophic spending, on the difficulties households face when confronted with health problems.
In Figure 1 (page 7) the conceptual framework of the financial effects of diseases/injuries on households was illustrated. High OOP health payments may lead to catastrophic spending and this will be captured using the method we have chosen for our studies. However, to the extent that household members loose working time because of ill-health, and possibly other household members also do so giving informal care, the household will lose income, which we have not captured in our studies (and typically is not included in studies of catastrophic spending). There are studies indicating that the size of lost income may be 2-4 times larger than the medical costs patients have to pay (McIntyre, Thiede, Dahlgren, & Whitehead, 2005). In a study of the financial effects on Vietnamese households of injuries, the average income losses corresponded to 11 working months among poor households, and 15 working months among non-poor households compared to the average wage in the different groups (Thanh, Hang, Chuc, Rudholm, Emmelin, & Lindholm, 2006).
However, a motivation for not including lost income, a least not in a composite measure, is that the catastrophic health spending concept was created to reflect effects for households of the health financing system. It is not a function of a health financing system to protect people against the loss of income when they cannot work. There are other social security systems set up for that purpose (Wagstaff, 2009).
One might also question the choice to only include OOP payments in the estimates. Household payments to some form of pre-payment scheme could, for instance, potentially be of a size large enough to affect the estimates (Wagstaff, & van Doorslayer, 2003).
Most studies of catastrophic spending are cross-sectional. They give a point estimate. In Vietnam little is known on the more long term effects; on how households cope with large health expenditure. They may e.g. reduce their
58
non-medical spending, borrow money, and sale assets. In a longer run, one would not expect an equally high percentage of households having catastrophic spending as one finds in a cross-sectional study with, say, a recall period of one month. The study reported in paper I gives an interesting perspective of this since a panel of households were followed during a yearlong period. Many of the households, which during a single month experience catastrophic spending, do not on a yearly basis show the same high proportion of medical spending.
These limitations of the estimates of catastrophic spending are also relevant for the estimates of impoverishment, as they have been done in Paper II. One would, for instance, not expect the proportion of impoverished during a single month to be equally high for e.g. a yearlong period.
However, there is another factor not included in the illustration of the conceptual framework in figure 1. Some households, likely poor ones, may decide not to seek health care when they encounter a health problem. They thereby avoid OOP health spending and may not be recorded as having catastrophic spending or being impoverished. But if the health problems lead to less work and loss of income they may in reality have dropped below some poverty line. Estimates of impoverishment, done with the method we have used, could therefore be underestimated (Alam & Mahal, 2014).
Statistical methods
The statistical methods used in the studies presented in this thesis are well established, standard, methods. In paper II, the study of catastrophic health spending among the elderly households, binary logistic regression is used to study the associations between household characteristics and the outcome on catastrophic spending and impoverishment respectively. Four models are specified; two including all households and two with only households above the poverty line. To study the combined effects of household total expenditure and household age composition, new combined variables were created for two of the models.
For Paper III, the assessment of the Health Care Funds for the Poor (HCFP), propensity score matching is being used. This method is suited for observational studies where those exposed to a treatment (in this case being beneficiaries of HCFP) may be expected to as a group differ in characteristics to the untreated. By matching, such differences can be adjusted for (Oakes, & Johnson, 2006). Propensity score matching is becoming increasingly popular in health care research (Austin, 2010). How the method was used is further described in the methods section (see page 36).
59
In paper IV, interval regression is being used to study the determinants of household willingness to pay (WTP) for health insurance. This is a regression method well suited for data that are concentrated to certain values. When respondents state their maximum WTP they tend to heap to convenient, rounded off, values. By using interval regression one can let these stated values represent intervals rather than precise values (Brannas, 1987).
Studying willingness to pay
The rationale for, and the method used to study household willingness to pay (WTP) for health insurance, have been presented above in the methods section. In addition to that description there are two questions that needs a discussion; the bidding format for the WTP questions and possible biases in the answers given by respondents.
The WTP question was done in a combined bidding and open ended format. Respondents were given a starting bid and then an open ended follow up question about their maximum WTP. There are other formats for the WTP question such as payment cards, and the take-it-or-leave it method. There is no consensus on which method that is most reliable in the low and middle income country setting (Shono, Kondo, Ohmae, & Okubo, 2014). Several recent studies on the WTP for health insurance have used a bidding format (e.g. Shafie, & Hassali,2013; Khan, & Ahmed, 2013).
There are a number of potential biases in a WTP study. If the scenario presented to the respondents is not specified clearly enough so that the respondents understand it to mean something different than what is intended, then the elicited WTP does not answer the study question posed. This may happen if the respondents include something into the scenario, which is not meant to be there, or excludes something which is in there. Another type of bias occurs if the respondents on purpose states a WTP, which is lower or higher compared to their true WTP. This may be a strategic behavior on part of the respondents with a purpose to affect the outcome of the study in a direction preferred by the respondents. It may also happen that respondents answer in such a way they believe will please the interviewer (Mitchell, & Carson, 1989).
Giving the respondents a first bid, as we did, is associated with a possible starting point, or anchoring bias. The respondents’ thinking about how much they would be willing to pay is firmly affected by the starting bid (the anchor) in such a way that if the bid would have been something different, so would their stated WTP. In the research of Daniel Kahneman and others,
60
(Kahneman, 2011) this has been repeatedly tested and proven. Kahneman writes:
[It] is an anchoring effect. It occurs when people consider a particular value for an unknown quantity before estimating that quantity. What happens is one of the most reliable and robust results of experimental psychology: the estimates stay close to the number that people considered – hence the image of an anchor.
Kanheman, 2011, p. 119
The potential biases will be further discussed below in relation to the findings of the WTP study.
The Bavi district versus the nation as a whole
In Paper I there is a comparison between data from the nationwide Vietnam Living Standards Survey 1997/98 and FilaBavi data from the same period. In papers III, and IV the effects of the Health Care Funds for the Poor, and the willingness to pay for health insurance, are studied based on FilaBavi data. How representative is this for Vietnam as a whole, or at least for rural areas?
The Bavi district was chosen as a location of the demographic surveillance site (DSS) because it includes low lands, high lands, and mountainous areas, and was considered typical of Vietnam concerning health status and socioeconomic conditions (Chuc, & Diwan, 2003). This is typical for how the geographical location of a DSS normally is chosen. It should be located reasonably far away from major cities, but not placed in a peripheral area of the country. It should contain a mix of religious and ethnic groups as well as low and highland areas typical of the country (Byass, Worku, Emmelin, & Berhane, 2007). However, there has been no validation study done on how the Bavi district relates to the nation as a whole in relevant aspects for the studies presented in this thesis. Strictly seen, it is therefore not possible to, with any degree of certainty, assess the national representativeness of Bavi when it comes to e.g. household total expenditure or health care expenditure.
That said, however, it must be pointed out that the reason for establishing a DSS is that national health data may be incomplete, infrequently collected, and sometimes of questionable quality. In a DSS, a population in a smaller area is mapped and continuously followed. The FilaBavi site has been described above (page 25). A baseline survey was done in 1999 followed by quarterly surveys on vital data and re-censuses every second year. These in-
61
depth data certainly has the potential to be of a considerably higher quality than national data in the low income country setting. And – given that the geographical location of the site is chosen on the basis that it will provide data that can, when national high quality data are missing, be taken as nationally representative; this allows for generalizations from the data. Paradoxically, if one could definitively answer the question about the national representativeness of the data from a DSS, you wouldn’t need the DSS anyway.
There has been an interesting study done on Swedish data on this (Byass, Sankoh, Tollman, Högberg, & Wall, 2011). In Sweden, historical data on health and demographics are detailed enough to allow for comparisons between national and more local data. The year 1925 was chosen for the study since health, demographics, and socioeconomic conditions at that time in Sweden were similar to the situation in many low and middle income countries today. Data on causes of mortality, live births, stillbirths, infant deaths, and maternal mortality were studied in the counties of Sweden, each representing about 5% of the population. Outliers among the counties, such as the capital and remote areas, were excluded. The remaining 80% of the counties were found to closely resemble national data on demographic and mortality patterns. A conclusion in the study is that “Unsubstantiated claims that local sub-national population data are ‘unrepresentative’ or ‘only local’ should not therefore predominate over likely representativity” (Byass et al, 2011, p.1).
62
Main findings
The general objective of this thesis, as stated under Objectives above, is to contribute to the discussion in Vietnam on how large the problems of out-of-pocket and catastrophic health expenditure are, and to assess important aspects of health insurance as a means to reduce the problems. The main findings on this; our contributions to the discussion about these problems in Vietnam, in the two studies on catastrophic expenditure and the two on health insurance, are:
The estimates of catastrophic health spending may be overestimated, for two reasons: (1) A relatively short recall period is common in the studies. When interpreting estimates, such as 10% of the households having catastrophic spending, this may overstate the lasting financial effects of temporary ill-health since many households over time manage to cope with temporary high health spending. (2) Survey respondents may include health expenditure that they had before the recall period. The conclusion of this, however, is not to diminish the problem. When the same method is being used, this allows for comparisons between groups, and comparisons over time. This serves the good purpose of identifying vulnerable groups and assessing the effects of health financing reforms. This is what we have done in two of the other studies.
The elderly is such a vulnerable group. Our study on their situation, concerning catastrophic spending and impoverishment is, to my knowledge, the only one that has identified the depth of the financial problems due to health care that many of them experience.
Our study on the effects in a longer term of a health insurance reform; the Health Care Funds for the Poor, shows that it led to a considerable reduction in household health care expenditure in relation to household total expenditure. However, the effects on health care utilization were weak. There has only been one other study on the more long term effects. It supports our findings on both expenditure and utilization.
For health insurance to have a considerable effect, people have to use it. However, one problem in Vietnam is that people appear reluctant to use their health insurance when utilizing health care. Our study on the willingness to pay (WTP) for health insurance, which to my knowledge is the only WTP study on health insurance done in Vietnam, supports the notion that people value health insurance relatively low.
The findings are being further discussed below.
63
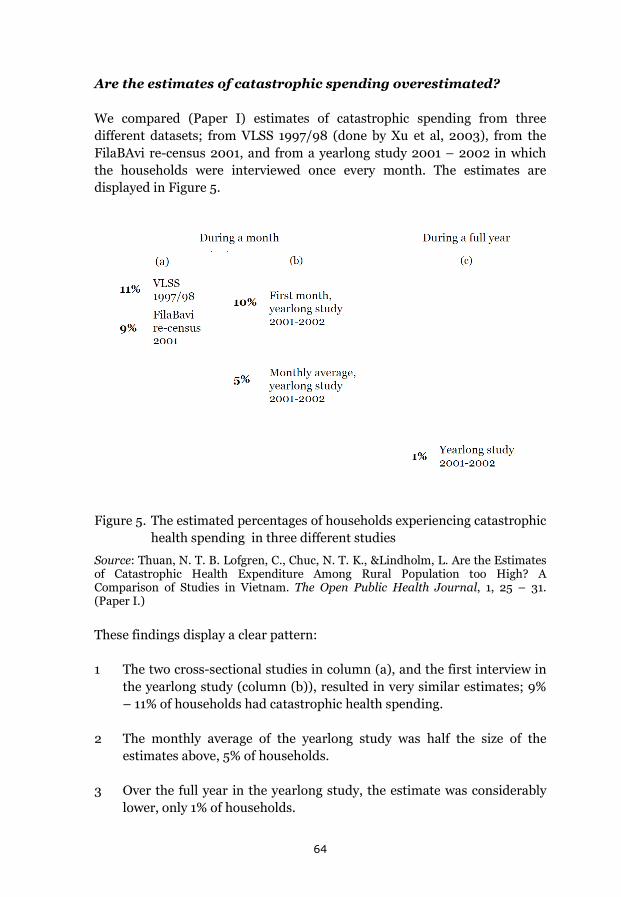
Are the estimates of catastrophic spending overestimated?
We compared (Paper I) estimates of catastrophic spending from three different datasets; from VLSS 1997/98 (done by Xu et al, 2003), from the FilaBAvi re-census 2001, and from a yearlong study 2001 – 2002 in which the households were interviewed once every month. The estimates are displayed in Figure 5.
Figure 5. The estimated percentages of households experiencing catastrophic health spending in three different studies
Source: Thuan, N. T. B. Lofgren, C., Chuc, N. T. K., &Lindholm, L. Are the Estimates of Catastrophic Health Expenditure Among Rural Population too High? A Comparison of Studies in Vietnam. The Open Public Health Journal, 1, 25 – 31. (Paper I.)
These findings display a clear pattern:
1 The two cross-sectional studies in column (a), and the first interview in the yearlong study (column (b)), resulted in very similar estimates; 9% – 11% of households had catastrophic health spending.
2 The monthly average of the yearlong study was half the size of the estimates above, 5% of households.
3 Over the full year in the yearlong study, the estimate was considerably lower, only 1% of households.
64
All of these three surveys had a recall period of one month (in the yearlong study there was an interview done every month). The fact that the estimate for the full year period, when the monthly data are aggregated to a year, is so much lower than what is estimated for one month in the other surveys is not surprising. Not all, or even most of, households that during one month experience a health shock that leads to high healthcare expenditure, continue to do so month after month, which results in a much lower proportion of households having catastrophic expenditure over the whole year.
But the difference between the monthly average in the yearlong study and the two cross-sectional studies calls for an explanation. We believe it to be; that when you have a monthly recall period in a cross-sectional study, households having had large healthcare expenditure in the period preceding the month before the interview was done, will tend to include such expenditure, or at least part of it, in their estimates. This is, in our data, supported by the fact that the estimate from the first interview done in the yearlong study is similar to the estimates from the two cross-sectional studies. In this first interview, the respondents in the yearlong study were in the same situation as the respondents in the cross-sectional studies. But in the months to follow in the yearlong study, households were aware of their previous estimates and had also kept daily notes of their expenditure during each month. This, very likely, led to more accurate monthly estimates.
This is supported by research. In a literature review of measurement errors in surveys of healthcare (Heijink, Xu, Saksena, & Evans, 2011) researchers found that infrequent and large expenditure is better captured with longer recall periods. In a study of 719 household expenditure surveys on the ratio of household health expenditure to household total expenditure (Lavado, Brooks, & Hanlon, 2013), it was in a regression analysis found that a one month extension of the recall period led to a 6% reduction of the health expenditure share. In another study data from the World Health Survey in 43 countries was used (Lu, Chin, Li, & Murray, 2009). The survey had two questions about hospitalization costs; one with a four week recall period and another with a recall period of eleven months. The ratio of average annual health spending using one month over eleven months recall was studied. For 39 of the 43 countries the ratio was larger than one so the shorter recall period led to larger estimates.
Our interest in these questions does not come from a wish to diminish the problem of catastrophic health expenditure. Being illustrated are potential comparability problems between different studies. In the background section this was described concerning the variation in methods used; using
65
expenditure versus income or capacity to pay, and using different thresholds (see page 7). The use of different recall periods may obviously also matter. For the estimates of catastrophic spending used in this thesis to describe the development in Vietnam, and to study he situation for the elderly, the same method and recall period have been used.
However, estimates are done both on FilaBavi data and national living standards surveys data. In Paper I, a limited comparison between FilaBavi data and VLSS data was done on household total expenditure in the different expenditure quintiles and of the estimated poverty rates. We concluded that the datasets are similar in these respects and that this indicates a possibility for comparisons. A rationale for why FilaBavi data may be taken as nationally representative was also given in the section on methodological considerations above.
Using studies of catastrophic health spending to identify vulnerable groups
If you use the same method to study catastrophic spending and impoverishment; estimates of these phenomena are well suited to compare health financing problems in different groups of the population and over time for these groups. Thereby, they can give important inputs into the health insurance reform process.
Working on a project concerning elderly care in Vietnam, it lay near to us to hypothesize that the elderly is a vulnerable group in this context that may be important to study. The research done commonly defined an elderly household as one where there was at least one household member 60 years or older. Since this is a very heterogeneous group, we wanted to narrow down the definition and chose the “all-elderly” households where everybody is at least 60 years of age. The results were clear (Paper II):
They all-elderly households have on average high OOP payments for health in comparison to their capacity to pay, 18% compared to 8% for all households, 13% of them have catastrophic health spending compared to 4% for all households, and 8% are impoverished compared to 3% for all households
To explore the associations between the outcome variables and household characteristics, we used multivariable binary logistic regressions with having catastrophic health expenditure or not, and being impoverished or not, as the dependent variables.
66
Regression results have been given in the results section above (see page 47). Being an all-elderly household was associated with a considerably higher degree of catastrophic spending and impoverishment also when controlling for the effects of other household characteristics. For impoverishment, belonging to richer expenditure quintiles was at the same time associated with a lower degree of impoverishment. In contrast, expenditure quintile belonging was not significant for catastrophic expenditure.
The bivariate relations between expenditure quintile belonging and the two outcome variables is strong for impoverishment; 90% of the impoverished come from the two bottom quintiles. It is weaker for catastrophic expenditure with 47% of those experiencing this coming from the two bottom quintiles.
In a different model for the regressions, we explored the relation between household expenditure level, being and all-elderly household, and the outcome variables through using variables that combine expenditure level and household age composition. For catastrophic spending this showed that in comparison with non-elderly households in the top three expenditure quintiles, being an all-elderly household in all quintiles is associated with more of catastrophic spending.
Cross-sectional data do not provide a base for determining causal relationships. What we can study are the associations between group belonging and the outcome variables. So, we cannot answer the question of, to what extent, it is being all-elderly households or other factors that lead to their vulnerability for catastrophic spending and impoverishment. However, the associations found through the logistic regressions point to the need for further studies on this; what are the specific conditions for the all-elderly households that make them this vulnerable?
Deeper knowledge on this will be an input to the future health insurance reform process. Interestingly enough, while our assessment of the Health Care Funds for the Poor showed that the ratio of household health care expenditure to household total expenditure was considerably reduced for the insured as an effect of the reform, no such effects were found in a similar study for insured poor elderly households studying the same period as in our study; 2001 – 2007 (Thanh, & Lindholm. 2012). For some reason the insurance doesn’t seem to work equally good for the elderly as it does for the poor insured as a total group. Also, interesting, in our study of the WTP for health insurance; the higher the age of the household head, the lower the stated WTP, when in a regression controlling for the other determinants of WTP.
67
Studying the effects of health insurance on health spending and utilization
Our study (Paper III) shows that one impact of the HCFP for the insured was a reduction of household health expenditure as a percentage of total household expenditure by 1.65 percentage points for the period 2001 – 2007. This ratio was 7.99% in 2001, so the estimated reduction due to the reform was considerable.
For health care utilization only two changes are significant for the whole period up to 2007. The treated (the insured) increased their utilization of commune health stations and decreased their utilization of self-treatment as effects of the reform. Up to 2005, there was also a significant increase in the use of district health centers and a decrease of visits to pharmacies for the treated due to the reform.
The HCFP reform has been assessed in three other studies; by Wagstaff (2007 and 2010), and by Axelson et al. (2009). Wagstaff (2007) used data from VHLSS 2004 and compared the insured to controls using propensity score matching. For health care spending he found that HCFP had no significant impact on total OOP spending but that the reform reduced catastrophic health expenditure (which was defined as expenditure in excess of 10% of non-food spending) for the insured. The effects on utilization were large; there was a significant increase in both outpatient and inpatient care, but more so for the latter form of care. The increase of care was pronounced for commune health stations, district and provincial hospitals, while care at private providers showed a marked decrease. However, among the very poor, the bottom decile, there was almost no significant effect on utilization. The effects on catastrophic spending, though, were concentrated to the two bottom deciles.
Axelsson et al. (2009) employed both a cross-sectional and a panel approach using data from VHLSS 2002 and 2004 doing propensity score matching. In the cross-sectional study (2004 data) they found that household total health expenditure significantly decreased for the insured. The decrease in their expenditure was also significant for inpatient care and for self-medication. Catastrophic health expenditure (in excess of 20% of non-food spending) also significantly decreased for the insured. There was no significant change in total outpatient and inpatient visits, but a significant change away from visits at private facilities to public; and among the latter a shift from lower to higher level facilities. The panel study showed, for utilization, in large similar results as the cross-sectional one but only the increase of visits at commune
68
level was significant. For expenditure, the only significant result in the panel study, was a decrease for the insured in expenditure for inpatient care.
The results of these two studies are similar in several respects. In both, catastrophic expenditure was found to be reduced as well as private health care utilization. Both also found an increase in the use of public care; Axelsson et al. here also found a shift to higher levels of care. Differences in the results were that Wagstaff, but not Axelson et al., found that both outpatient and inpatient visits increased while Axelsson et al., but not Wagstaff, found that total health expenditure and self-medication decreased.
A reason for us to do our study was that we wanted to assess the more long term effects of the reform. Wagstaff (2007) and Axelsson et al. use data from 2004. One clear conclusion that can be drawn from our study, also in comparison with the two referenced studies, is that the household financial burden of health expenditure has been reduced as an effect of the reform and that this appears to be a lasting (at least up till 2007) effect. We studied household health expenditure as a share of household total expenditure. Wagstaff studied OOP heath expenditure as a share of capacity to pay (›10%); and so did Axelson et al. (›20%). All three of these measures showed a decrease for the treated as an effect of the reform.
For health care utilization the only lasting, and overarching the whole period (except for the first two years), impacts in our study is the increase in communal health station utilization, and the decrease of self-treatments. We did not find any significant effects for the utilization of private health facilities, nor did we see any significant effects on the use of higher level public health care.
Wagstaff (2010) also studied effects in the longer run through propensity score matching using data from VHLSS 2002, 2004, and 2006. He found no effects on health care utilization, with this longer term study. However, the OOP health spending for the insured was found to have been substantially reduced. In Wagstaff (2010) there was no estimate for catastrophic spending, but his finding on reduced OOP spending is in line with our results.
Has the HCFP reform improved the situation for the poor? This was the question we raised above (see page 34). An improvement would be if their health care expenditure share of total expenditure has decreased, and if they use less of private care and more of public care, preferably also more at higher levels.
69
For the health care expenditure burden on households: yes, there is a clear, and lasting (for the period we studied), improvement. For utilization, the increased use of commune health station among the insured and the decrease in self-treatment may indicate an improvement, but the results are weaker. We cannot see a shift from private care, nor do we observe effects on higher level public care.
How could health insurance work better?
In view of the positive effects of the HCFP on health expenditure, but the weak effects on utilization, a question is how the insurance can be improved. This is a multifaceted question but one of the many important aspects it concerns is peoples trust in the insurance delivering a protection worth its cost, and people’s willingness to use the insurance.
How much are the households willing to pay for health insurance, and is this sufficient to finance a health insurance system? These were two questions we asked when doing the study on the value on health insurance (Paper IV).
The results are summarized in Table 24. The average household WTP for all households is less than half of household total health expenditure, and only slightly higher for those whose WTP is larger than zero and for those who prefer health insurance over a system totally relying on OOP payments.
Can we rely on this elicited WTP? Or is it a result of biases in the eliciting process? In the section above on methodological considerations possible biases were briefly described. We followed a typology developed by Mitchell and Carson (1989) when considering the risk of bias affected stated WTP. One such bias is strategic. The respondents state a WTP other than the true one, because they believe it will serve their interest. In our case, this could be respondents that did not wish to have a health insurance system and for that reason stated a lower WTP than they would actually have were the health insurance system to be implemented. We cannot determine to what extent this might have happened. If the fact that of those that stated a zero WTP, 90% belong to the group that preferred the OOP system over the two health insurance alternatives is an indication of strategic bias, then that would mean that average WTP in our study is underestimated.
Another risk is to have a compliance bias, meaning that the respondents want to please the interviewers. In our case, with a starting bid of 45,000 dong given by the interviewers, compliance oriented respondents would state a WTP close to the bid. This, however, does not seem to have happened to any larger extent since the average WTP is so much lower than the bid.
70
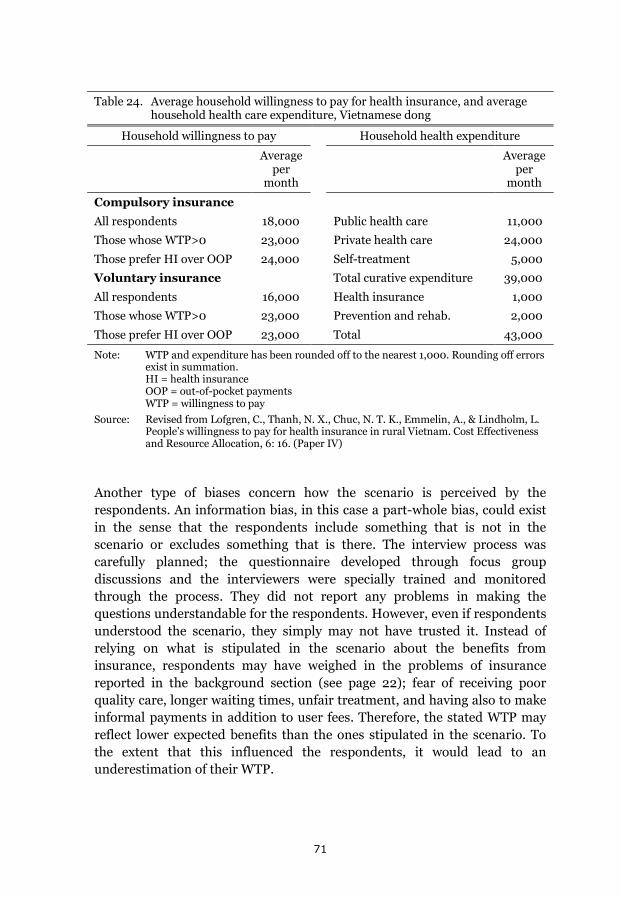
Table 24. Average household willingness to pay for health insurance, and average
household health care expenditure, Vietnamese dong
Household willingness to pay Household health expenditure
Average per
month
Average per
month
Compulsory insurance
All respondents 18,000 Public health care 11,000
Those whose WTP>0 23,000 Private health care 24,000
Those prefer HI over OOP 24,000 Self-treatment 5,000
Voluntary insurance Total curative expenditure 39,000
All respondents 16,000 Health insurance 1,000
Those whose WTP>0 23,000 Prevention and rehab. 2,000
Those prefer HI over OOP 23,000 Total 43,000
Note: WTP and expenditure has been rounded off to the nearest 1,000. Rounding off errors exist in summation. HI = health insurance OOP = out-of-pocket payments WTP = willingness to pay
Source: Revised from Lofgren, C., Thanh, N. X., Chuc, N. T. K., Emmelin, A., & Lindholm, L. People’s willingness to pay for health insurance in rural Vietnam. Cost Effectiveness and Resource Allocation, 6: 16. (Paper IV)
Another type of biases concern how the scenario is perceived by the respondents. An information bias, in this case a part-whole bias, could exist in the sense that the respondents include something that is not in the scenario or excludes something that is there. The interview process was carefully planned; the questionnaire developed through focus group discussions and the interviewers were specially trained and monitored through the process. They did not report any problems in making the questions understandable for the respondents. However, even if respondents understood the scenario, they simply may not have trusted it. Instead of relying on what is stipulated in the scenario about the benefits from insurance, respondents may have weighed in the problems of insurance reported in the background section (see page 22); fear of receiving poor quality care, longer waiting times, unfair treatment, and having also to make informal payments in addition to user fees. Therefore, the stated WTP may reflect lower expected benefits than the ones stipulated in the scenario. To the extent that this influenced the respondents, it would lead to an underestimation of their WTP.
71
In Paper IV we conclude that the starting point, or anchoring, bias does not seem likely to have had any effect on stated WTP since the average WTP is so much lower than the bid of 45,000 dong that the respondents were given. However, this may be questioned. Relying on the research by Kahneman and others, referred to in the section on methodological considerations above, leads to the question of what would have happened if the bid would have been, say, the double of the one given? Would the elicited average WTP then also have been doubled?
These potential biases mean that conclusions from the WTP study must be drawn with caution. Our conclusion is that, in spite of the potential biases, the relatively low elicited WTP likely corresponds to respondents preferences in the sense that it reflects their WTP for the health insurance system as it functions in practice. For this speaks the fact that more than half of them preferred the out-of-pocket system over the insurance systems, and that many of the insured in Vietnam are reported to not using their insurance when accessing health care; only two thirds of the insured were found to do so in a study on 2008 data (Ha, 2011). In light of this, a relatively low WTP is not surprising.
Is the elicited WTP sufficiently high to finance a health insurance system? In Paper IV we compare to premiums in, at the time, existing health insurance programmes in Vietnam. We also designed a low cost programme for which the WTP would be sufficient. Our conclusion was that WTP is sufficiently high in comparison with the lower range of premiums in existing programmes and that it would cover the costs for public health care with the utilization pattern at the time. However, if there would be a considerable shift from private to public care, the WTP is too low to finance this. Such a shift has occurred from 2004, when the WTP study was done, to 2012 (compare Table 4, page 15). Today, therefore, the conclusion is that this low WTP would not be sufficient to finance a sustainable health insurance programme.
This raises another question. The WTP study was done ten years ago. Do the results still reflect household preferences? There is no way of knowing to what extent they do, but the likely reasons discussed above are still being discussed as problems. The low utilization rate of health insurance today and plausible explanations – fear of receiving poor quality care, longer waiting times, and so on – are reported in recent studies (see page 22).
It therefore seems likely that also for today, improving the total coverage rate of health insurance, and reducing the problems of differential treatment of insured versus uninsured, is important in a strive to make health insurance work better.
72
Concluding remarks
Catastrophic health expenditure presents one view, but a limited such, on the health financing problems households may run into when facing health problems. The measurement does not capture associated income losses. The view is also limited in the sense that the problems of households abstaining from needed care because of the cost are not captured. When, as often, the studies are cross-sectional they do not capture what happens in the longer run, and provides no information of how households cope with health care expenditure. In addition to this, there may be a recall bias leading to overestimations.
There is an obvious need for future studies filling in these gaps. Information beyond what we can see today is important as guiding tools for the future reform process. However, even with these shortcomings, estimations of catastrophic spending through cross-sectional surveys provide essential information. Given that they are done with the same method, they provide possibilities for comparisons, between population groups and over time. So instead of abstaining from using them because of their limitations, they should be used more.
VHLSS data have been used for one of our studies. Since the VHLSS is considered to be of good quality, and includes the necessary data, they could be regularly used by the General Statistics Office to produce estimates of catastrophic spending and impoverishment; for the population as a whole and for targeted groups. Doing this over time will provide policy makers with essential information about who are the vulnerable groups and about the change in conditions for such groups over time.
One such group appears to be the elderly, in particular the households which only include elderly persons. These households today (2010) constitute 6% of Vietnamese households (1,402,650 households). But they will be expected to substantially grow; in numbers and as a share of all households. Vietnam is undergoing a rapid aging and urbanization process (described in the background), the latter leading to younger people moving from the countryside to the cities and leaving the elderly behind. Today these households face much larger health financing problems than do the population on average. Our study on their situation leads to the question – is being all-elderly households a contributing factor, beside income and others, in explaining their hardships? Again, there is a need for future studies to better tailor health insurance programmes to the need of the all-elderly households.
73
Furthermore, for health insurance – in this thesis represented by the Health Care Funds for the Poor (HCFP) and the streamlined variants of an OOP system, a compulsory health insurance system, and a voluntary one – the weak effects on utilization and households’ low valuation of the constructed systems stand out. How will the obstacles to better functioning health insurance programmes be tackled?
The need not only to expand insurance coverage, but also to deepen it, has been described in the background section. In addition the problems of differential treatment between insured and uninsured needs to be addressed. And so does the continuous existence of informal payments in the health sector. Our studies on catastrophic health expenditure and on health insurance, are not focused on these questions. But they do point to the problems.
74
Epilogue
What is the largest health problem in the world? This is a question I now and then make to our master students in the health systems course when I first meet them. Students’ suggestions are usually communicable diseases, such as HIV/AIDS, or the growing chronic diseases. I then add my suggestion: the biggest world health problem is malfunctioning health systems. For many diseases/health problems there are existing effective remedies but for many people in need around the world they are not accessible. Health services may simply not exist where people live or – they cost too much to access. For many, the knowledge and technologies exist to reduce the health problems but they are not affordable.
I have been encouraged to add something in the cover story about myself. People do this, I have seen, as a prologue or as a section about the researcher. Working at the place I do, I think an epilogue is in place.
However, my story about the work I have done is at least to some extent told in the following acknowledgements. So, I’ll keep it shorter here, limited to only one issue; equity. One of my interests through life has been questions of equity. I got, for instance, involved in student politics when I first came to the university in the fall of 1970. I was a member of the student union board working with educational issues. That meant fighting for students’ rights – e.g. not to be barred from the university or deprived of student loans because of study failures. Ours was a young university that to a large extent recruited students from families and settings lacking in academic traditions. I remember myself as a student representative in the board of the Arts and Humanities Faculty arguing against a professor who, from the course literature at the Language Department, wanted to remove a book about a big strike in the mines of northern Sweden, which was given a lot of attention at the time. His argument was that it didn’t fulfil the criteria for language learning material. He was very likely right. But I defended the place for those settings and people that were far away from the academic world.
Our interest and activities in those days were also internationally oriented, discussing ways to support the poor and oppressed people of the world. I think back at this, now when I have completed the cover story. Studies I have been part of during my time at Epidemiology and Global Health are equity oriented. For instance, how large are the health financing problems for the population, in particular for the vulnerable; e.g. the poor and the elderly?
75
A big health problem in this respect is malfunctioning health systems. And one way in which they are malfunctioning concerns health financing. Certainly, to improve health financing systems a row of efficiency questions have to be addressed. But it pleases me that the studies I have been part of mainly address the equity aspects.
76

Acknowledgements
I am a pretty (well, in the sense, rather) old man. I started to work at Umeå University in the fall of 1975. I was an assistant on a project evaluating grants to unemployed people geographically moving to new jobs. I was also offered to do a little teaching. Thank you Åke Dahlberg and Jörn Stage! Writing this I realize that these acknowledgements, if covering all those that I would want to thank would be the biggest section of the thesis by far. For you see, I have so many to thank.
So what do you do when your scope is too large; you narrow it down. These acknowledgements are directed to all of you who have helped me in my academic work, and so in particular for the thesis. I hope that you, my friends outside of academia, understand this. But still, being 64 years old and working at the university since I was 25, the list is so long.
So, therefore, this is the hardest part to write. And the time I have for writing it is in no competition the shortest compared to what I have devoted to other sections. I am close to what you did Anneli, writing the acknowledgements the night before printing. Thus I fear that I will, very likely, miss mentioning some of you being most important. But it needs to be done, so here goes.
I’ll start by narrowing it down further; directly to thesis work.
This thesis is about Vietnam. I am fortunate because I have been giving the possibility to go to Vietnam a number of times. I have met wonderful people. One of them is Thanh, one of my supervisors. Thanh, Thank you! You have done the most impressive journey of all, I think. Getting into medical training at Hanoi Medical University, getting into research, and now being an associate professor in Edmonton, Canada. You have given me invaluable knowledge about Vietnam and I have prospered from your ideas in supervision and from working together with you on three of the papers in this thesis. The only thing I regret is that we, on the one time when you planned it, missed the opportunity to have snake wine in Hanoi, but hopefully sometime in the future? (And, the goat wine certainly was a decent substitute.)
And then my main supervisor and friend, Klas-Göran Sahlén. Thank you! I don’t know which of the two, supervisor or friend, means most at this time. And that Klasse, says a lot about the process and the help and advice you have been giving me!
77
I was also blessed with other supervisors.
Lars Lindholm. Thank you! We know each other all the way back from Skellefteå and have been good friends for a long time. We have a difference of opinion about who was responsible when you (or others as you claim) devastated my student room back in 1971, but that has never been a problem. Lars is the reason I am at EPI1 (more about that later) and subsequently a root of this thesis. I have benefitted so much from the discussion we have had; on the thesis, health economics, world problems, and personal ones. Well, this goes for Klasse too; about the discussions I mean.
Anna-Karin Hurtig. We have planned courses and lectures together and discussed educational and administrative issues and now my thesis. I think there are few persons with the intelligence, experience, and maturity enough to qualify as truly wise. But Anna-Karin, you absolutely do. And that resulted in so many good advices for my thesis. Thank you!
Writing papers is a group work and it has involved more than my supervisors. Hoang Van Minh, who managed to make the data from the Vietnam Household Living Standards Survey understandable for me. Ho Dang Phuc, who was essential for gathering the data from FilaBavi – the demographic surveillance site. Nguyen Thi Bich Thuan, we wrote several papers together, one of which is in this thesis. And Nguyen Thi Kim Chuc, leading the FilaBavi work. Le Van Hoi and Nguyen Tien Anh, you are not my co-authors but you helped me so much in Hanoi. You are all so great people! Thank you!
And Anders Emmelin, well you are in this category – too. So I’ll thank you here. But you also place in other categories. One of them is the work we have done to manage the master programme. I succeeded you as a director of studies. Most definitely, couldn’t have done without your help and advice. But most important, thank you for the friendship! And, Maria Emmelin, that includes you too!
And then, two very important persons – our present and former chair at EPI – who have given me the chance, and encouraged me, to do this thesis: Anneli Ivarsson and Lars Weinehall. Thank you!
1 Epidemiology and Global Health, Department of Public Health and Clinical Medicine
78

Outside the group of supervisors and co-authors, there are others who have taken their time to discuss the cover story and papers and given me advice that I appreciate so much. I particularly want to mention three of you who have gone out of your way to do this and also spent considerable time doing it: Anna Myléus, without whom the cover story, among other important things, would have missed the “red thread” (ask a Swede) and I would have missed our discussions, Hans Stenlund, for all the statistical and friendly advice, and Nawi Ng for volunteering to go through the whole thing towards the end, taking your time to read and be part of the supervisor meetings, and not sighing too much, instead pointing out a row of weaknesses. Thank you my friends! You are just great!
And, in addition to you, people took their time in seminars to be reviewers on my work. Anni-Maria Pulkki-Brännström, Inna Feldman, and John Kinsman. Thank you!
And Katrina Nordyke; you took the time to look at my English in the thesis. Thank you so much! And, Cẩm Tú Nguyễn, now back in Hanoi after two years here, thank you for taking time on a weekend to go to a hospital and making the photo on the cover page!
Writing this, thanking you who more directly have been involved in my thesis writing, I feel a strong need to thank another group that makes it all possible. I was considering thanking you guys first of all. That certainly goes for the two of you, Birgitta Åström and Ulrika Harju, who have guided me in the administrative jungle of doing a thesis. But you see, my life at EPI has largely been about teaching and administering this as a director or studies. And I couldn’t have done that without the two of you mentioned and the following persons: Anna-Lena Johansson, Barbro Larsson, Barbro Skogh, Carolina Näslund, Karin Johansson, Lena Mustonen, Sabina Bergstén, Susanne Walther, and Veronika Lodwika. The competencies and proficiencies – and the great friendliness – in our past and present administrator group go beyond everything! When I started as a director of studies, Karin Johansson was the master programme administrator – ask her who really was leading the development then. So you guys; thank you all so very much!
And I am not forgetting three more guys in the administrative gang. You know, I tend to be at work late at night sometimes. But you are never alone at EPI. From the darkened staircase (light goes out a midnight) you can hear the slamming of the doors when Göran Lönnberg travels from room to room fixing people’s computer problems. And Jerzy Pilch, you did that before, though not allocated to the same hours, I believe. Anyway, both of you have
79
been so helpful in solving my computer problems (like when half of my directory had mysteriously disappeared). So, thank you! And then, Andreas Ekholm. There was a time, a few years ago, when we feared for the future (non-) existence of our master programmes due to the heavy tuition fees levied on non-European students. We counted and counted and made budgets. And they turned out to be accurate – only thanks to your competence. So, thank you Andreas!
In the 1990’s Lars Lindholm invited me to come teach on EPI courses in health economics. I was then at the Department of Economics. This collaboration evolved so that in the beginning of the 2000’s I was asked if I wanted to work half time at EPI, and a few years later whether full time would interest me. It did, not because I had any wish to get away from the Economics department, but because, having turned above 50 years of age, I realized that this might be my last chance to do something else than I had been doing for some 25 years. I really liked it at Economics, and the people in that department are just great, so it was with butterflies in my stomach that I decided to go the EPI way. It certainly helped a lot that I was so well received. Stig Wall (chair at EPI then) and Karl-Gustaf Löfgren (chair at Economics then); do you remember the meeting we had? It was on Stig’s initiative with the purpose of facilitating a smooth transition. And it worked. Thank you Stig and Kalle!
Then came all the great people I got to meet at EPI. One of my first office room buddies comes into mind; Kristina Lindvall. We are both from Schtaan; one of the most fascinating places at least in the northern hemisphere. You know, my supervisors went on about what my contribution to knowledge is in the thesis. Now I am thinking; what, if anything, is my contribution to EPI? And, of course – the Schtaan fika week that we have exposed our colleagues to for a number of years now! Thank you, Kristina, for all the fun we had doing it, and for the pep-talks you have been giving me lately!
Anna Rosén, Berit Edvardsson, Helene Johansson, Maria Wiklund, and Kristina Edvardsson were other colleagues sitting in mine or the adjoining office during my first time at EPI. We got ourselves a refrigerator, remember, that we put in the common hallway our offices shared. Plans were to fill it up and invite others over for a party. But that never happened and the fridge is now out of order, I believe. Well, all good things don’t happen. Thank you, guys!
Then I was moved from the ground to the first floor starting as director of studies. Two menacing things were hanging over us during this period; the
80
new tuition fees and the national evaluation of public health programmes done by the national agency for higher education. They were connected. It was important to get a good result of the evaluation for e.g. the struggle at our university in being prioritized in the distribution of student scholarships. In retrospect, we were successful in both these things. The reason for this is that we have a very committed teaching staff. That makes life as a director of studies simple. Thank you all!
Two persons that I want to mention are Malin Eriksson and Kjerstin Dahlblom. Malin, we isolated ourselves at Folkets Hus, together with Nawi, when writing the self-evaluation reports. Thank you for tearing yourself away from research to do this! And Kjerstin, thank you for relieving me from being director of studies so that I could work on my thesis!
Now I am on the second floor. Lennarth Nyström and Urban Janlert are in an adjoining office. Always encouraging. Lennarth telling me to postpone the whole thing if it got to stressful and take some vacation during the summer. I was tempted at times, but decided to follow the motto “it’s never too late to give up”. Thank you both!
Friends, I’d like to go on and address all of you with thanks! Ann Sörlin, for finding an intelligent way to get me into the PhD programme, Fredrik Norström, for the encouragement, teaching together and the discussions, and … As I said in the beginning, the list is so long. So therefore, thanks to all of you!
And, I said that the people at the Department of Economics are great. Since this is a thesis at EPI I will address you more briefly. But there are some of you older ones; Roger Axelsson, Solweig Brand, Kurt Brännäs, Roger Jacobsson, Karl-Gustaf Löfgren, Åsa Löfström, Jörn Stage, and Olle Westerlund, that I do want to thank this way for the knowledge, experience and friendship you have been giving me! Then, there are so many more of you at Economics, and at the business school, and in the social sciences building, and in the administration’s building. I just could go on and on …
I said I am not going to thank you that are outside of work. But of course, there are three of you that are most important of all: My sons, David and John. And Alison, now moving to Stockholm and David. Thank you for all the joy, happiness, and warmth you mean to me!
81

82
References
Adams, Jr, R., H. (2002). Poverty Reduction in Vietnam 1988 to 1997/98. A Country Case Study. (USAID. Technical Report). Washington: USAID. Retrieved August 5, 2014 at http://pdf.usaid.gov/pdf_docs/PNACR805.pdf
Alam, K., & Mahal, A. (2014). Economic impacts of health shocks on households in low and middle income countries: a review of the literature. Globalisation and Health, 10. 21.
Austin, P. C. (2011). Optimal caliper widths for propensity-score matching when estimating differences in means and differences in proportions in observational studies. Pharmaceutical Statistics, 10, 150–161.
Axelson, H., Bales, S., Minh, P. D., Ekman B., & Gerdtham, U. (2009). Health financing for the poor produces promising short-term effects on utilization and out-of-pocket expenditure: evidence from Vietnam. International Journal for Equity in Health, 8, 20.
Brannas, K. (1987) Linear regression with grouped data on the dependent variable. Metrol, 45, 63-79.
Britannica Online Encyclopedia. (2014). Vietnam War (1954-75). Retrieved August 5, 2014 at http://www.britannica.com/EBchecked/topic/628478/Vietnam-War
Byass, P., Worku, A., Emmelin, A., & Berhane, Y. (2007). DSS and DHS: longitudinal and cross-sectional viewpoints on child and adolescent mortality in Ethiopia. Population Health Metrics, 5, 12.
Byass, P., Sankoh, O., Tollman, S. M., Högberg, U., & Wall, S. (2011). Lessons from History for Designing and Validating Epidemiological Surveillance in Uncounted Populations. PLoS ONE, 6, 8.
Chuc, N., T., K., & Dung, P. H. (Eds.). (2002). FILABAVI. An epidemiological field laboratory. A demographic surveillance site for the study of health sector reform in Vietnam. Hanoi. Medical Publishing House.
83
Chuc, N. T. K., & Diwan, V. K. (2003). FilaBavi, a demographic surveillance site, an epidemiological field laboratory in Vietnam. Scandinavian Journal of Public Health, 31 (suppl. 62):3–7.
Deaton, A., & Zaidi, S. (2002). Guidelines for Constructing Consumption Aggregates for Welfare analysis. (World Bank LSMS Working Paper No. 135). Washington DC: World Bank.
Do, N., Oh, J. & Lee, J. S. (2014). Moving toward Universal Coverage of Health Insurance inVietnam: Barriers, Facilitating Factors, and Lessons from Korea. Journal of Korean Medical Science, 29, 919 – 925.
Drummond, M. F., Sculper, M. J., Torrance, G. W., O’Brian, B. J., & Stoddart, G. l. (Eds.) (2005). Methods for the Economic Evaluation of Health Care Programmes. 3rd edition. Oxford: Oxford University Press.
Duong, L.B. & Liem, N.T. (2011). From Countryside to Cities. Socioeconomic Impacts of Migration in Vietnam. Institute for Social Development Studies. Hanoi: Workers’ Publishing House.
Ekman, B., Liem, N. T., Duc, H. A., & Axelson, H. (2008). Health insurance reform in Vietnam: a review of recent developments and future challenges. Health Policy and Planning, 23, 252–263.
General Statistics Office of Vietnam. (2014a). Data results of the Viet Nam Household Living Standards Survey 2012. Retrieved August 11, 2014 at http://www.gso.gov.vn/default_en.aspx?tabid=515&idmid=5&ItemID=14995
General Statistics Office of Vietnam. (2014b). Data results of the Viet Nam Household Living Standards Survey 2010. Retrieved August 11, 2014 at http://www.gso.gov.vn/default_en.aspx?tabid=515&idmid=5&ItemID=12426
Glennie, J. (2011). The role of aid to middle-income countries: a contribution to evolving EU development policy. (ODI working paper 331.) Oversees Development Institute, London.
84
Glewwe, P. (2004). An Overview of Economic Growth and Household Welfare in Vietnam in the 1990s. In Glewwe, P, Agrawal, N. Dollar, D. (Eds.), Economic Growth, Poverty and Household Welfare: Policy Lessons from Vietnam (pp. 1-26). Washington, DC: World Bank.
Gottret, P., & Schieber, G. (2006). Health Financing Revisited. A Practioner’s Guide. The World Bank, Geneva.
Ha, D. A. (2011). Social health insurance as a means to achieving universal coverage and more equitable health outcomes. Sub-report of Viet Nam. Hanoi: unicef.
Ha, T. H. A., Berman, P., & Larsen, U. (2002). Household utilization and expenditure on private and public health services in Vietnam. Health, Policy and Planning, 17(1), 61–70.
Haughton, D, & Nguyen, P. (2010). Multilevel Models and Inequality in Viet Nam. Journal of Data Science, 8, 289 – 306.
Heijink, R., Xu, K., Saksena, P., & Evans, D. (2011). Validity and comparability of out-of-pocket health expenditure from household surveys: a review of the literature and current survey instruments. Geneva: World Health Organization; (Discussion Paper No. 1-2011)
Howe, L. D., Galobardes, B, Matijasevich, A., Gordon, D., Johnston, D., Onwujekwe, O., et al. (2012). Measuring socio-economic position for epidemiological studies in low- and middle-income countries: a methods of measurement in epidemiology paper. International Journal of Epidemiology, 2012, 1–16.
Khan, J. A. M., & Ahmed, S. (2013). Impact of educational intervention on willingness-to-pay for health insurance: A study of informal sector workers in urban Bangladesh. Health Economics Review, 3, 12
Kahneman, D. (2011). Thinking Fast and Slow. London: Penguin Books
Khe, N. D., Eriksson, B., Phuong, D. N., Höjer, B., & Diwan, V. K. (2003). Faces of Poverty: sensitivity and specificity of economic classifications in rural Vietnam. Scandinavian Journal of Public Health, 31 (suppl. 62): 70–75.
85
Lavado, R. F., Brooks, B. P. C., & Hanlon, M. (2013). Estimating health expenditure shares from household surveys. Bulletin of the World Health Organization, 91, 519-524.
Lewis, M. (2007). Informal Payments and The Financing of Health Care in Developing and Transition Countries. Health Afffairs, 26 (4), 984-997.
Lofgren, C., Thanh, N. X., Chuc, N. T. K., Emmelin, A., & Lindholm, L. People’s willingness to pay for health insurance in rural Vietnam. Cost Effectiveness and Resource Allocation, 6: 16
Lieberman, S. S., & Wagstaff, A. (2009). Health Financing in Vietnam. Looking Forward. (Health, Nutrition, and Population Series No. 47388). Geneva: The World Bank.
Lu, C., Chin, B., Li, G., & Murray, C. J. L. (2009). Limitations of methods for measuring out-of-pocket and catastrophic private health expenditures. Bulletin of the World Health Organization, 87, 238–44.
Malesky, E. & London, J. (2014). The Political Economy of Development in China and Vietnam. Annual Review of Political Science, 17:20.1–20.25
Matsushima, M., & Yamada, H. (2013). Public Health Insurance in Vietnam towards Universal Coverage: Identifying the challenges, issues, and problems in its design and organizational practices. (OSIPP Discussion Paper: DP-2013-E-003). Osaka: Osaka School of International Public Policy.
McIntyre, D., Thiede, M., Dahlgren, G. & Whitehead, M. (2005). What are the economic consequences for households of illness and of paying for health care in low- and middle income country contexts? Social Science & Medicine 62: 858–865
Minh, H.V., Phuong, N.T.K. & Saksena, P. (2012). Assessment of Financial Protection in the Viet Nam Health System: Analyses of Vietnam Living Standards Survey Data 2002-2010. Research report. Hanoi: World Health Organization in Vietnam. Hanoi Medical University.
Minh, H.V., Phuong, N.T.K., Saksena, P., James, C.D. & Xu, K. (2013). Financial burden of household out-of pocket health expenditure in
86
Viet Nam: Findings from the National Living Standard Survey 2002-2010. Social Science & Medicine 96: 258-263
Ministry of Health. (2013). Joint Annual Health Review 2013. Towards Universal Coverage. Hanoi
Mitchell, C. R., Carson, T. R. (1989). Using survey to value public goods: The contingent valuation method. Washington, D.C.: Resources for the Future;
Oakes, J.M., & Johnson, P.J. (2006). Propensity score matching for social epidemiology. In Oakes, J. M. & Kaufman J. S. (Eds.) Methods in social epidemiology. (pp.364-386). San Francisco, CA: Jossey-Bass.
Overseas Development Institute. (2011). Viet Nam’s progress on economic growth and poverty reduction: Impressive improvements. London: ODI publications. Retrieved July 29, 2914 at http://www.developmentprogress.org/sites/developmentprogress.org/files/resource_report/viet_nam_report_-_master_0.pdf
Prime Minister Decision number 35/2001/QD-TTg. Dated March 19, 2002 on Approval strategy on health care for all from 2001 to 2010. Hanoi, Vietnam
Priwitzer, K. (2012). The Vietnam Health Care System in Change. A Policy Network Analysis of a Southeast Asian Welfare Regime. Singapore: Institute of Southeast Asian Studies.
Ramesh, M. (2013). Health Care Reform in Vietnam: Chasing Shadows. Journal of Contemporary Asia, 43 (3), 399–412.
Shafie, A. A., & Hassali, M.A. (2013). Willingness to pay for voluntary community-based health insurance: Findings from an exploratory study in the state of Penang, Malaysia. Social Science & Medicine, 96, 272–276.
Shono, A., Kondo, M., Ohmae, H., & Okubo, I. (2014). Willingness to pay for public health services in rural Central Java, Indonesia: Methodological considerations when using the contingent valuation method. Social Science & Medicine, 110, 31–40.
87
Somanathan, A., Tandon, A., Dao, H. L, Hurt, K. L., & Fuenzalida-Puelma, H. L. (2014). Moving toward Universal Coverage of Social Health Insurance in Vietnam. Assessment and Options. Washington: The World Bank.
Somanathan, A., Dao, H. L., & Tien, T. V. (2013). Integrating the Poor into Universal Health Coverage in Vietnam. Washington, World Bank.
Summers, C. (2014). How Vietnam became a coffee giant. BBC News Magazine. Retrieved August 5, 2014 at http://www.bbc.com/news/magazine-25811724
Vian, T., Brinkerhoff, D. Feeley, F. G., Salomon, M., & Vien, N T. K. (2011). Confronting Corruption in the Health Sector in Vietnam: Patterns and Prospects. (Health and Development Discussion Paper No. 14). Boston: Boston University School of Public Health
Thanh, N. X, Lofgren, C., Rudholm, N., Chuc, N., T., K., Emmelin, A, &Lindholm. L. (2005). People's preferences for health care financing options: A choice experiment in rural Vietnam. In Thanh, N.X. The injury poverty trap in rural Vietnam. PhD thesis. Umeå University, Epidemiology and Public health sciences.
Thanh, N. X., Hang, H. M., Chuc, N. T. K., Rudholm, N., Emmelin, A., & Lindholm, L. (2006). Does “the injury poverty trap” exist? A longitudinal study in Bavi, Vietnam. Health Policy, 78, 249–257.
Thanh, N. X., Löfgren, C., Phuc, H. D., Chuc, N. T. K., & Lindholm, L. (2010). An assessment of the implementation of the Health Care Funds for the Poor policy in rural Vietnam. Health Policy, 98, 58–64.
Thanh, N., & Lindholm, L. (2012). Has Vietnam Health care funds for the poor policy favored the elderly poor? BMC Health Services Research, 12, 333.
Thanh Nien News. (2014). Vietnam may lift retirement age to save pension fund. . Retrieved August 10, 2014 at http://www.thanhniennews.com/society/vietnam-may-lift-retirement-age-to-save-pension-fund-26267.html
Thuan, N. T. B. (2002). The burden of household health care expenditure in a rural district in Vietnam. MPH thesis, Nordic School of Public Health, Sweden, 2002.
88
Thuan, N. T. B. Lofgren, C., Chuc, N. T. K., &Lindholm, L. (2008). Are the Estimates of Catastrophic Health Expenditure Among Rural Population too High? A Comparison of Studies in Vietnam. The Open Public Health Journal, 1, 25 – 31.
Tsuboi, Y. (2007). Twenty Years After the Adoption of the Doi Moi Policy. Graduate School of Political Science. Waseda University. Retrieved August 5, 2014 at https://dspace.wul.waseda.ac.jp/dspace/bitstream/2065/12801/1/43_070321-Tsuboi-e.pdf
Tuan, T., Dung, V. T. M., Neu, I., & Dibley, M. J. (2005). Comparative quality of private and public health service in rural Vietnam. Health Policy and Planning, 20, 5, 319-327.
van deer Gaag, J. Health Care for the World’s Poorest. Is Voluntary (Private) Health Insurance an Option? Policy brief. International Food Policy Research Institute. Washington. Retrieved August 20, 2014 from http://www.ifpri.org/sites/default/files/publications/beijingbrief_vandergaag.pdf
Wagstaff, A., & van Doorslayer. (2003). Catastrophic and impoverishment in paying for health care: with applications to Vietnam 1993-1998. Health Economics. 12, 921-934.
Wagstaff, A. (2007). Health insurance for the poor: initial impacts of Vietnam’s healthcare fund for the poor. Policy Research Working Paper # WPS 4134. WashingtonDC: World Bank.
Wagstaff, A. (2009). Measuring financial protection in health. In Smith, P.C., Mossialos, E., Papanicolas, I., & Leatherman, S. Performance Measurement for Health System Improvement. Experience, Challenges and Prospects (pp. 114-137). Cambridge: Cambridge University Press.
Wagstaff, A. (2010). Estimating health insurance impacts under unoserved heterogeneity: the case of Vietnam’s Health Care Funds for the Poor. Health Economics 19, 189–208.
World Bank (1992). Vietnam: Population, Health and Nutrition Sector Review. (Report No. 10289–VN). East Asia and Pacific Regional Office.
89
World Bank (2001). Vietnam Growing Healthy: A review of Vietnam’s health sector. Geneva: The World Bank.
World Bank. (2012). World Development Indicators 2012. Geneva: The World Bank
World Bank Data Base (2014b). Retrieved July 15, 2014, from http://data.worldbank.org/news/newest-country-classifications-released
World Bank Data Base (2014c). Retrieved August 5, 2014, from http://data.worldbank.org/indicator/NY.GDP.PCAP.CD
World Bank Data Base (2014d). Retrieved August 7, 2014, from http://data.worldbank.org/country/vietnam
World Bank in Vietnam. (2012). Well Begun, Not Yet Done: Vietnam’s Remarkable Progress on Poverty Reduction and the Emerging Challenges. Hanoi
World Health Organization. (2000). Health Systems: Improving Performance. (The World health Report, 2000.) Geneva.
World Health Organization. (2010). Health Systems Financing. The Path to Universal Coverage. (The World health Report, 2010.) Geneva
*World Health Organization. (2014a). Country profile: Vietnam. Global Health Observatory Data Repository. Retrieved April 28, 2014, from http://apps.who.int/gho/data/?theme=country&vid=21300
World Health Organization. (2014). Global Health Expenditure Database. Retrieved July 15, 2014 from http://www.who.int/health-accounts/ghed/en/
World Health Organization. (2014c). Indicator Code Book. National Health Accounts. Retrieved July 18, 2014,from http://apps.who.int/nha/database/DocumentationCentre/Index/en
Wyszewianski, L. (1986). Fionancially Catastrophic and High-Cost Cases: Definitions, Distinctions, and Their Implications for Policy Formation. Inquiry, 23: 382-394.
90
Xu, K., Evans, D.B., Kawabata, K., Zeramdini, R., Klavus, J. & Murray. C.J.L. (2003a). Household catastrophic health expenditure: a multicountry analysis. Lancet; 362: 111–17
Xu, K., Klavus, J., Kawabata, K., Evans, D.B., Hanvoranvongchai, P., Ortiz, J.P., Zeramdini, R., Murray, C.J.L. (2003b). Household health system contributions and capacity to pay: definitional, empirical and technical challenges. In: Murray, C.J.L, & Evans, D.B.(Eds.) Health systems performance assessment: debate, new methods and new empiricism (pp. 533-542). Geneva: World Health Organization
Xu, K. (2005). Distribution of halth payments and catastrophic expenditures. Methodology. (Discussion paper number 2 – 2005). Geneva: World Health Organization.
Xu, K., Evans, D. B., Carrin, G., Aguilar-Rivera, A. M., Musgrove, P., & Evans, T. (2007). Protecting Households from Catastrophic Health Spending. Health Affairs, 26, 4, 972 – 983.
91

92
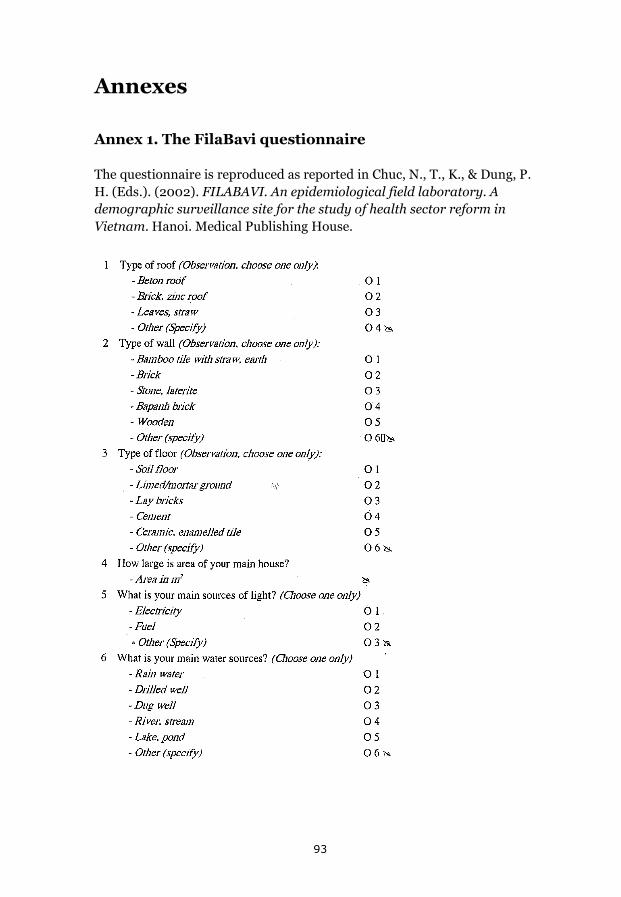
Annexes
Annex 1. The FilaBavi questionnaire
The questionnaire is reproduced as reported in Chuc, N., T., K., & Dung, P. H. (Eds.). (2002). FILABAVI. An epidemiological field laboratory. A demographic surveillance site for the study of health sector reform in Vietnam. Hanoi. Medical Publishing House.
93
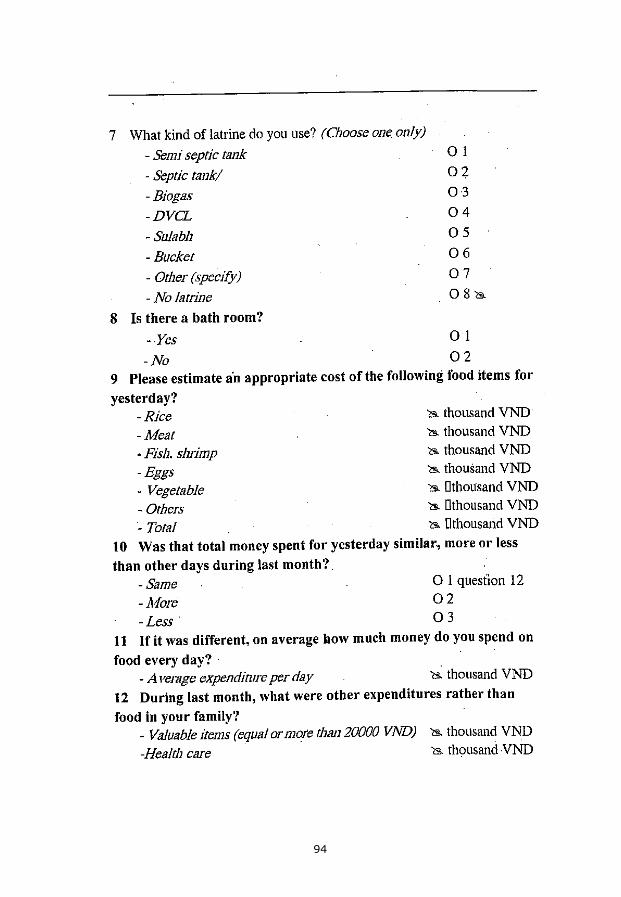
94
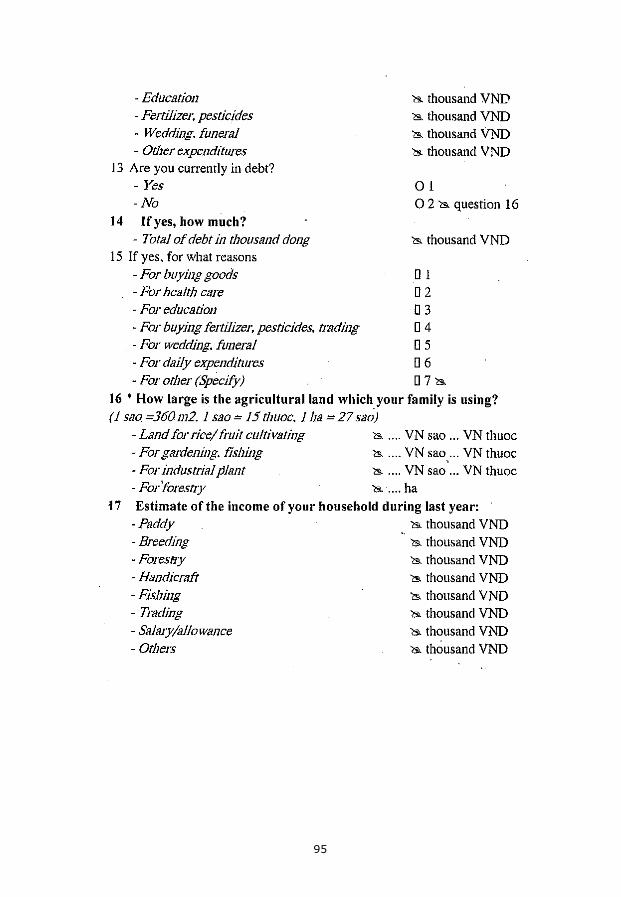
95
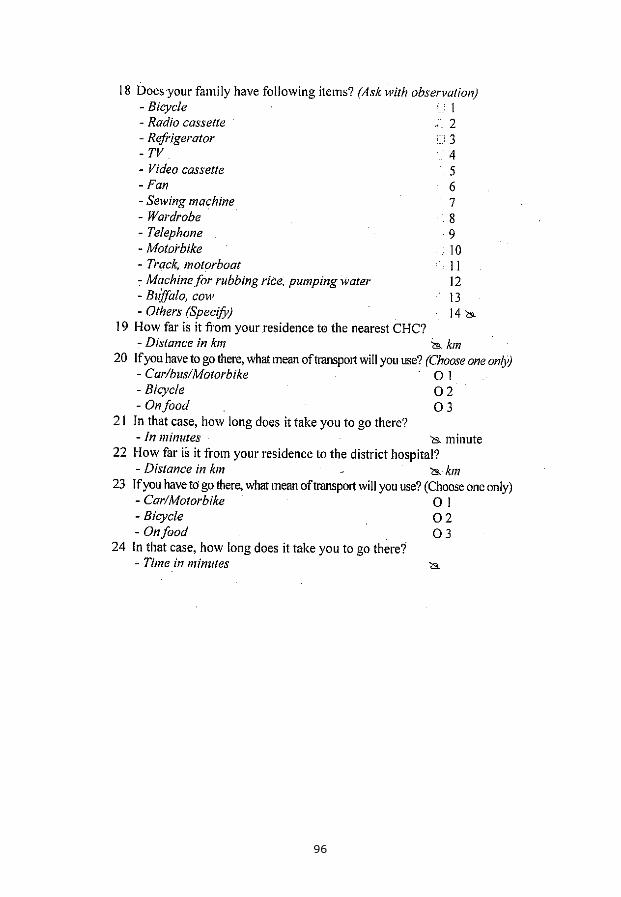
96
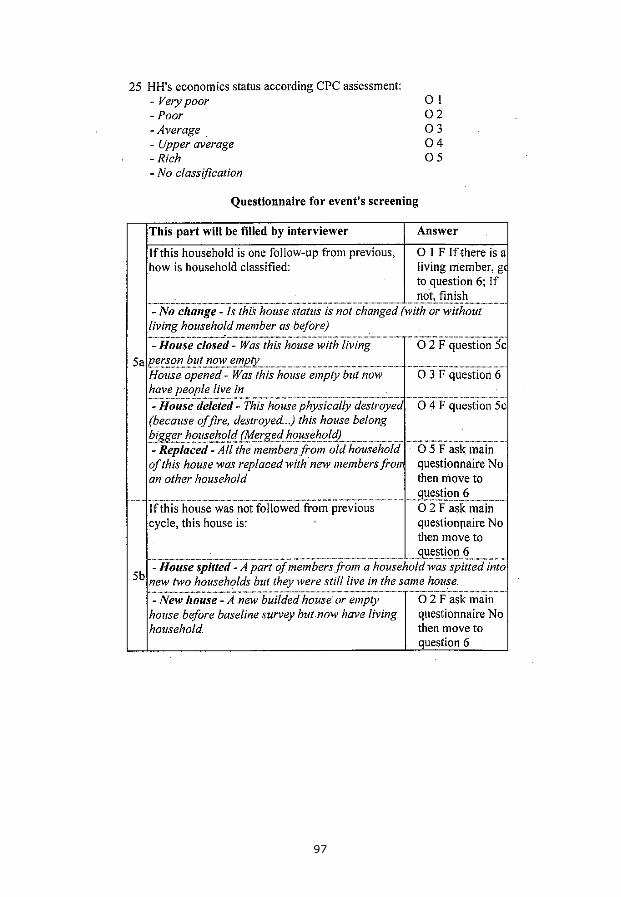
97
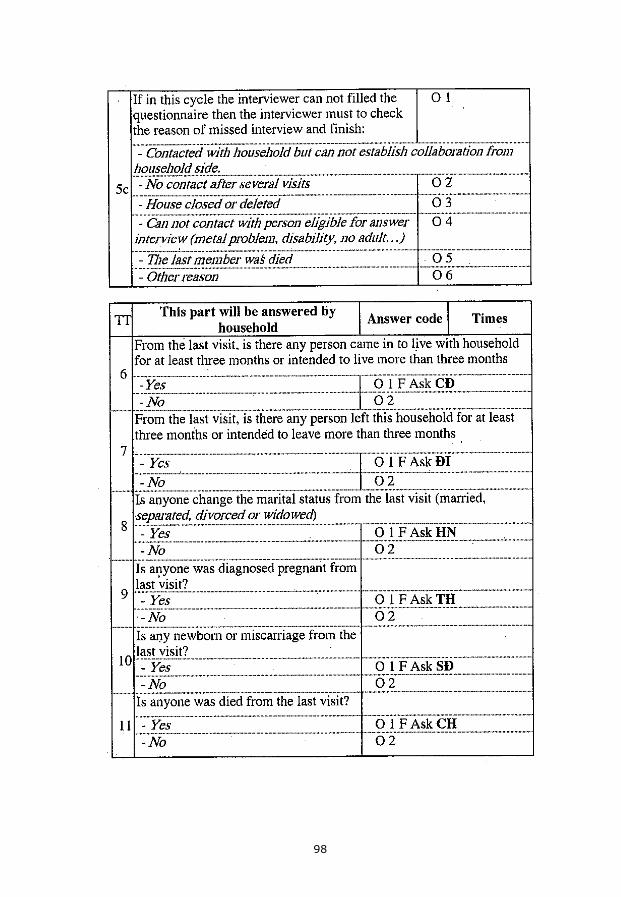
98
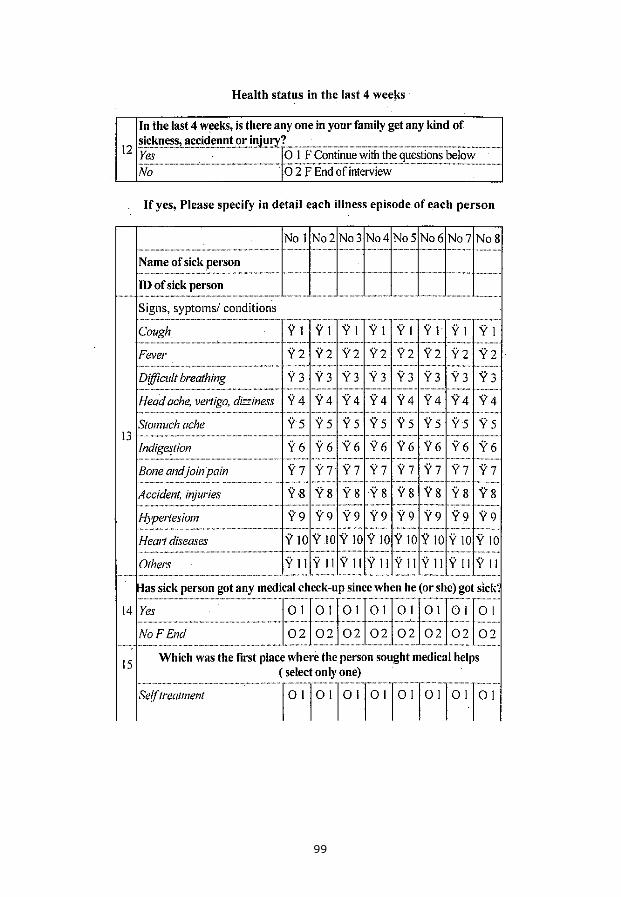
99
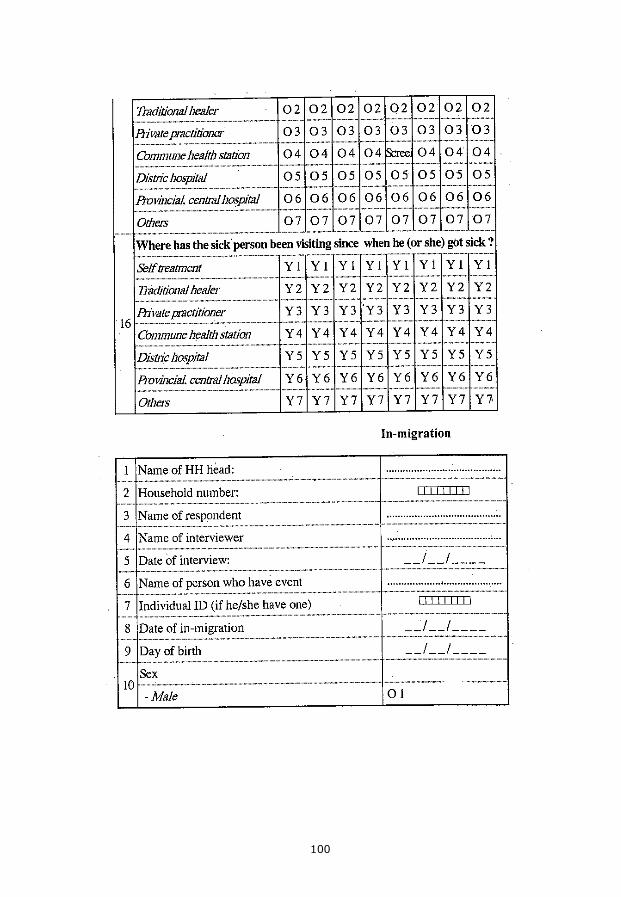
100
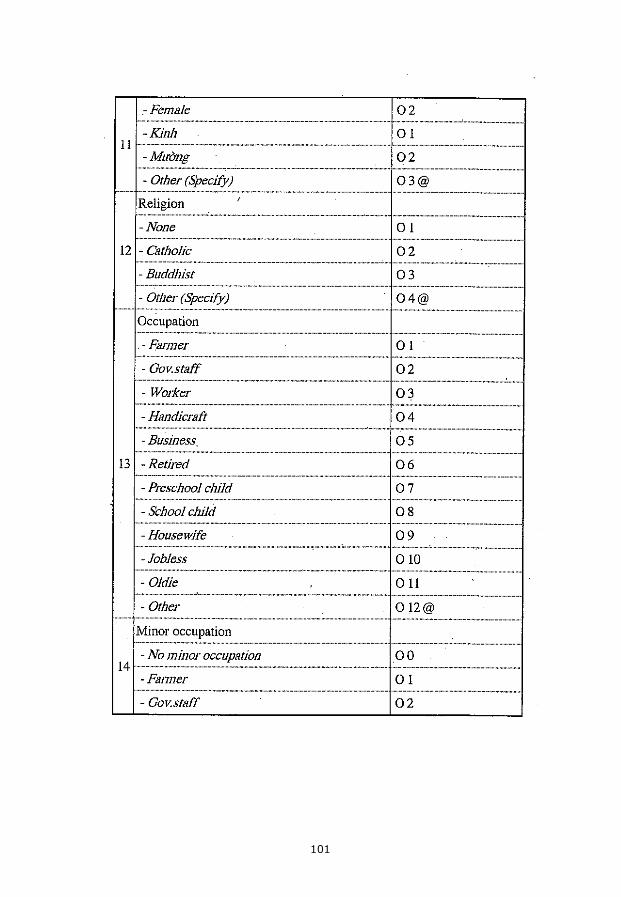
101
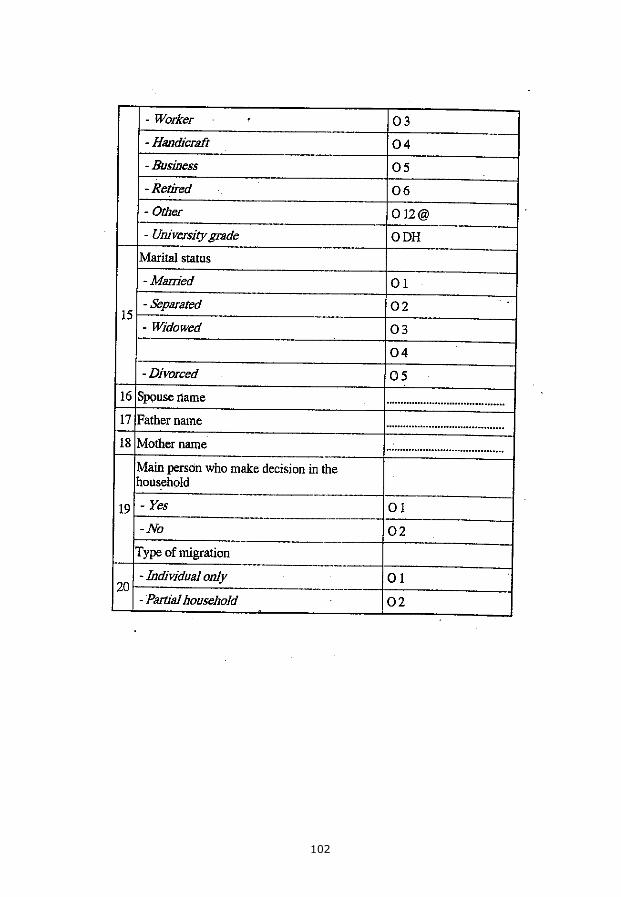
102
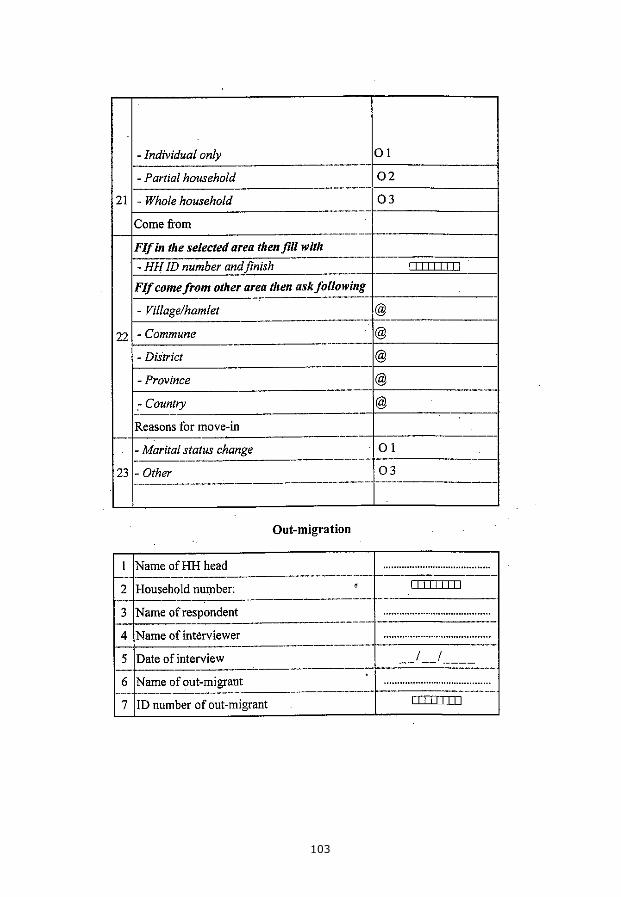
103
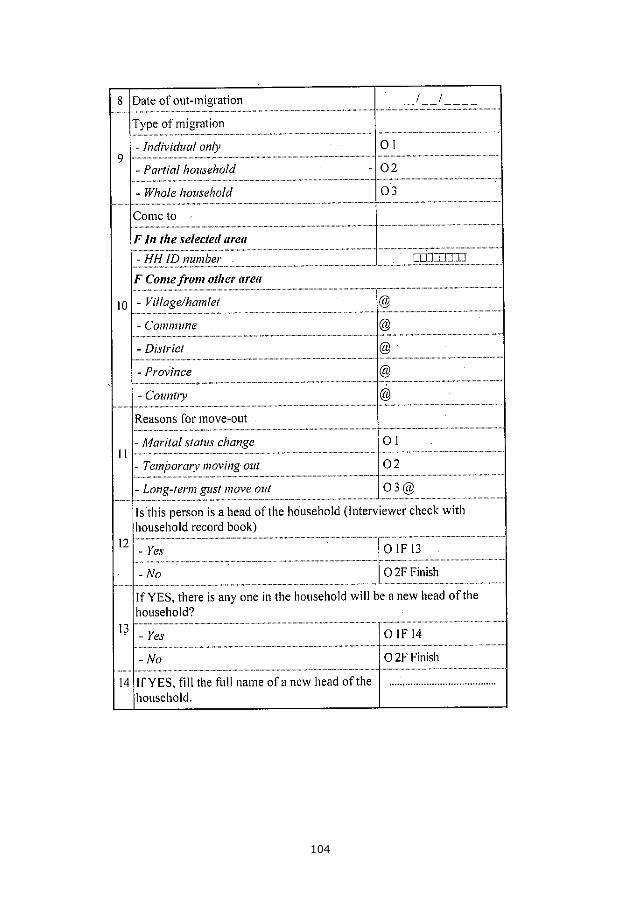
104
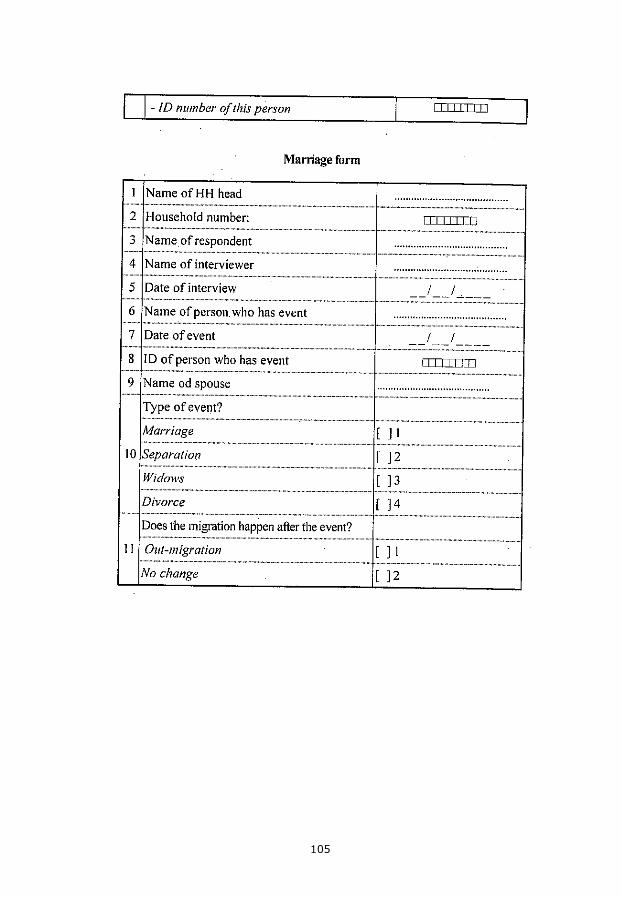
105
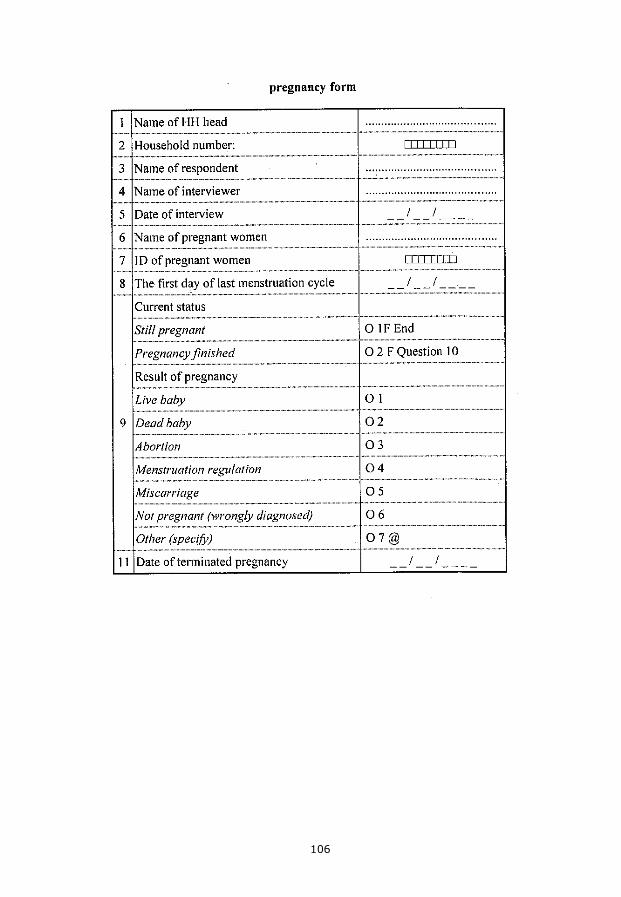
106
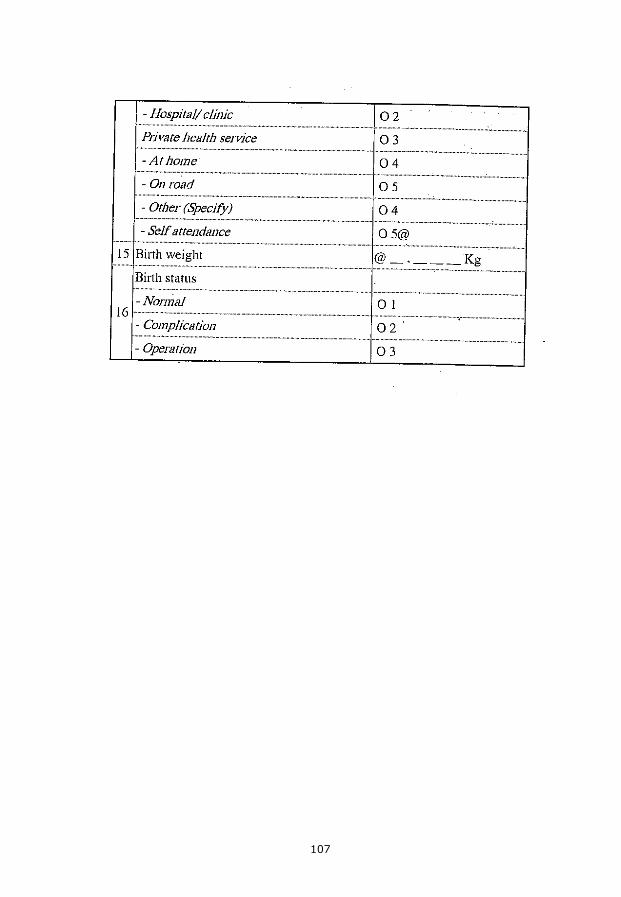
107
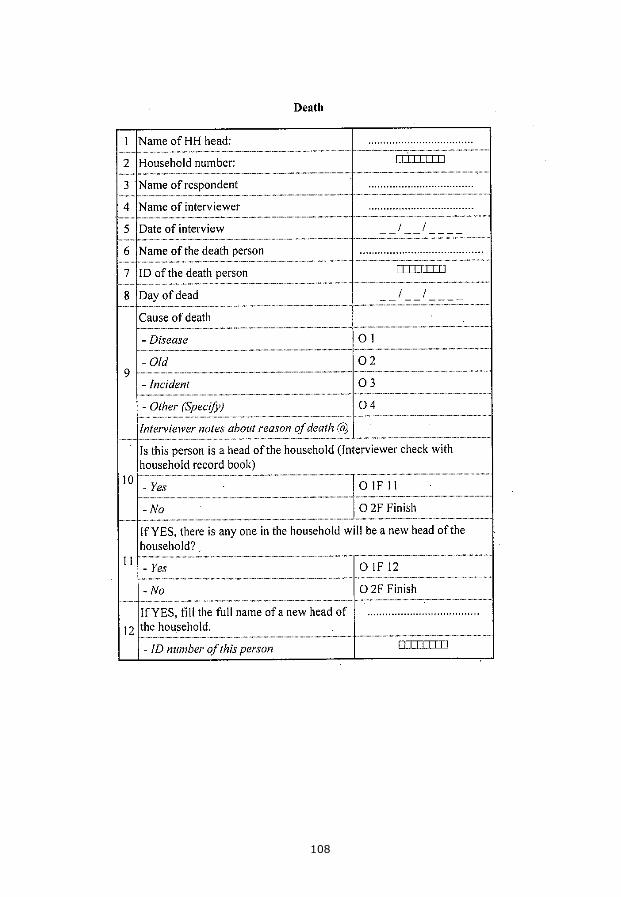
108
Annex 2. FilaBavi yearlong study (2001/2002) questionnaire
The questionnaire is reproduced as reported in Thuan, N. T. B. (2002). The burden of household health care expenditure in a rural district in Vietnam. MPH thesis, Nordic School of Public Health, Sweden, 2002.
109
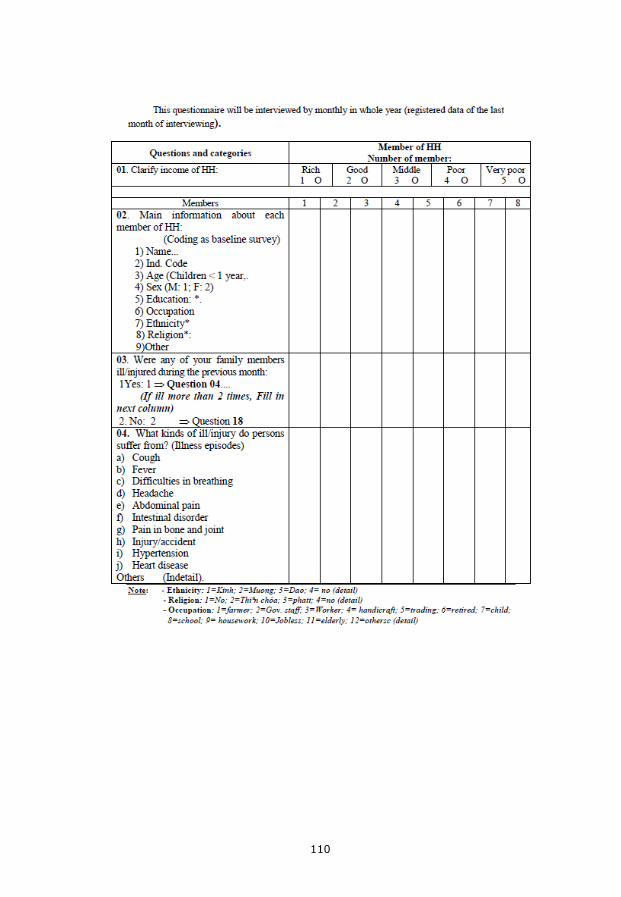
110
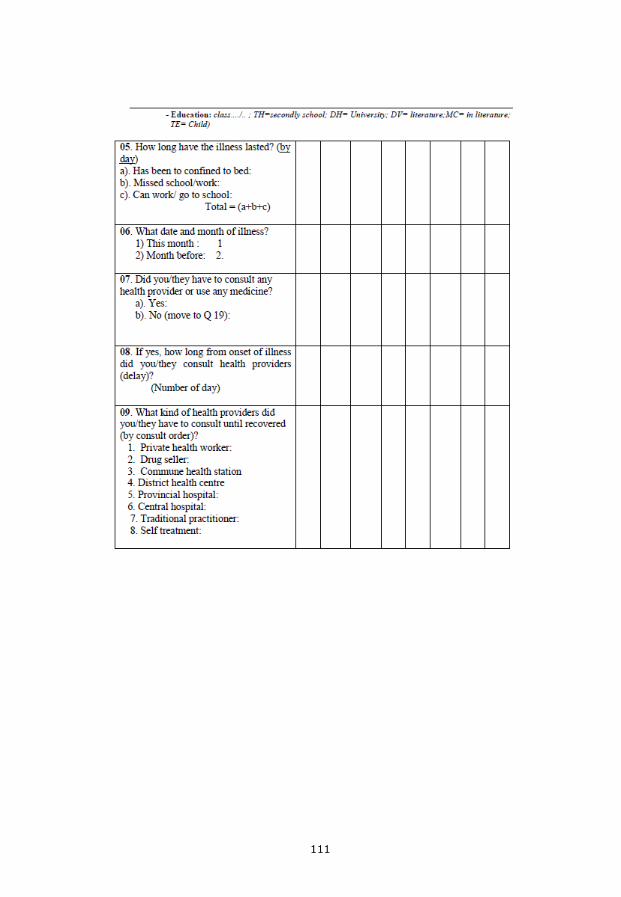
111
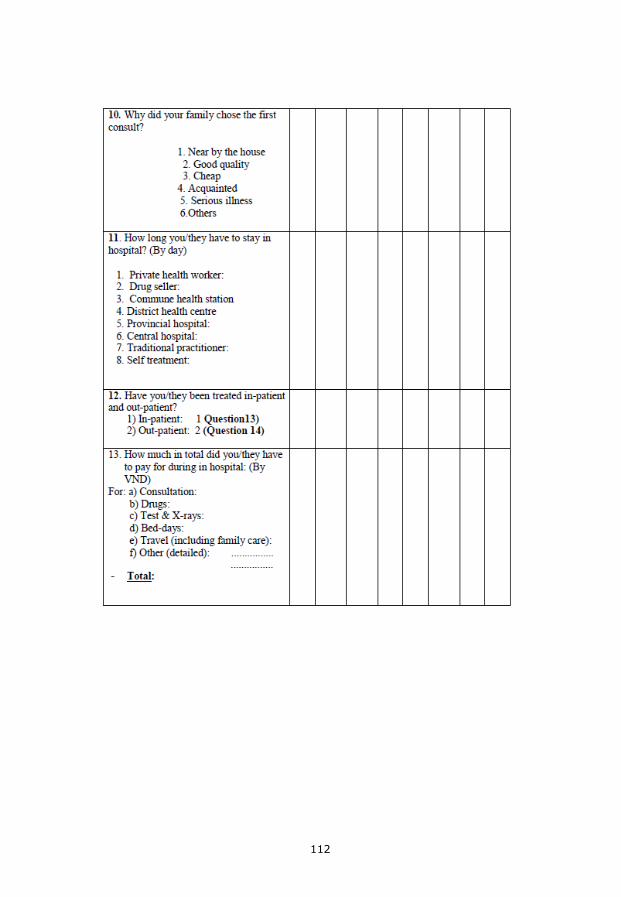
112
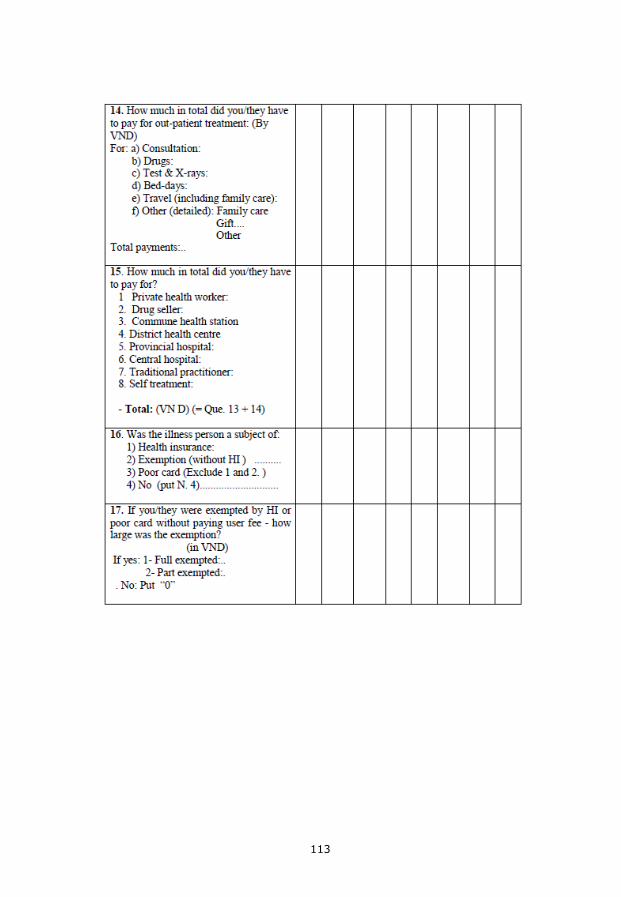
113
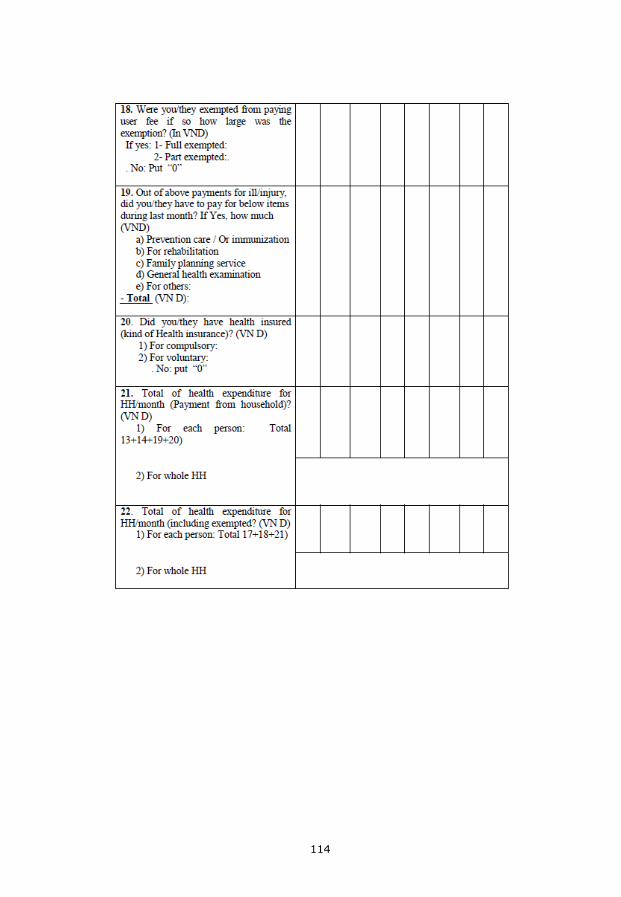
114
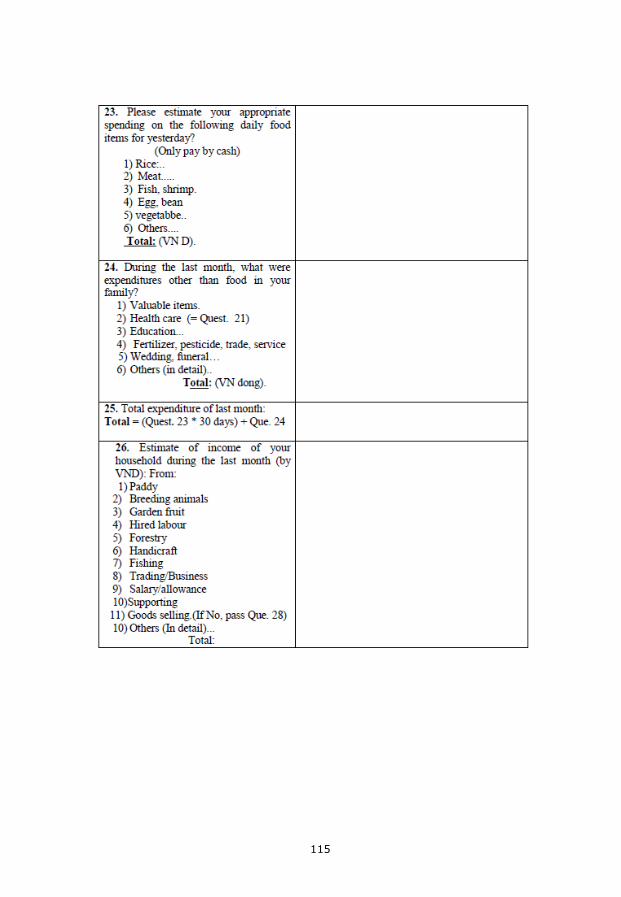
115
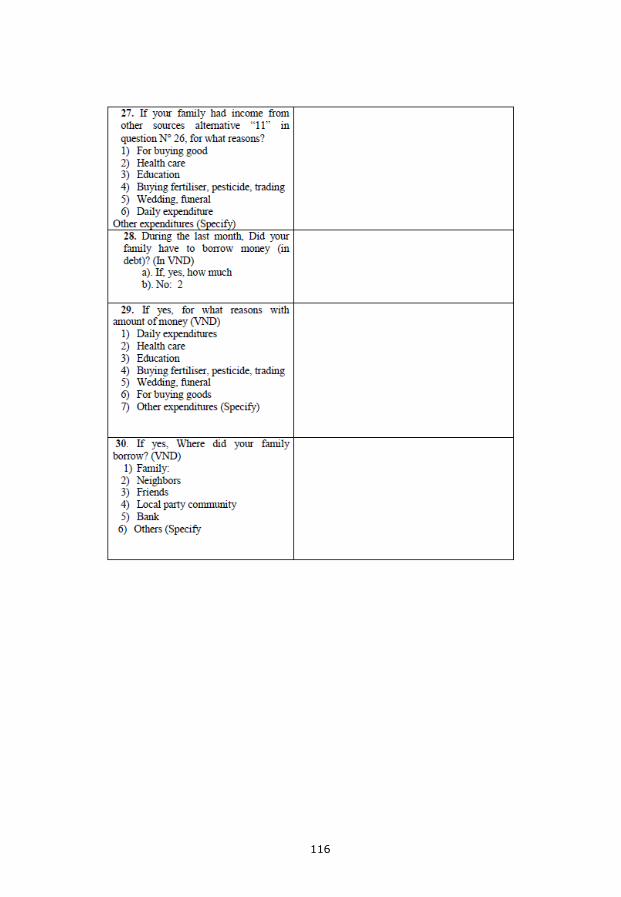
116
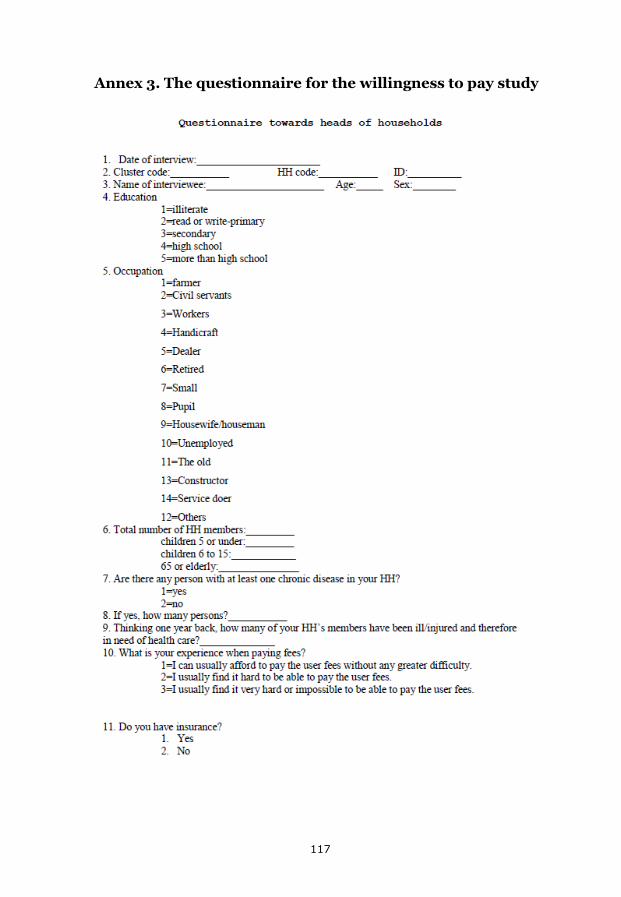
Annex 3. The questionnaire for the willingness to pay study
117
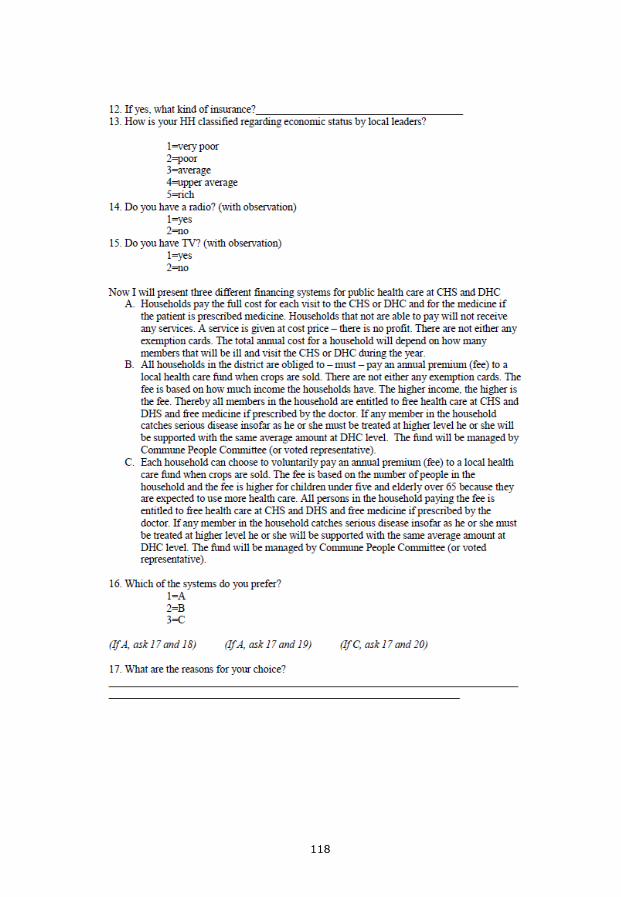
118
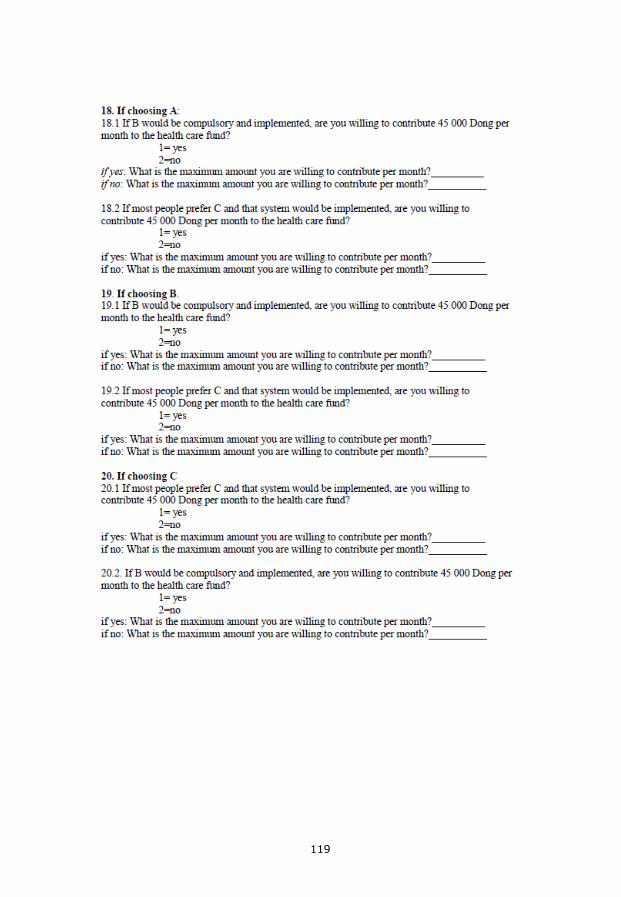
119
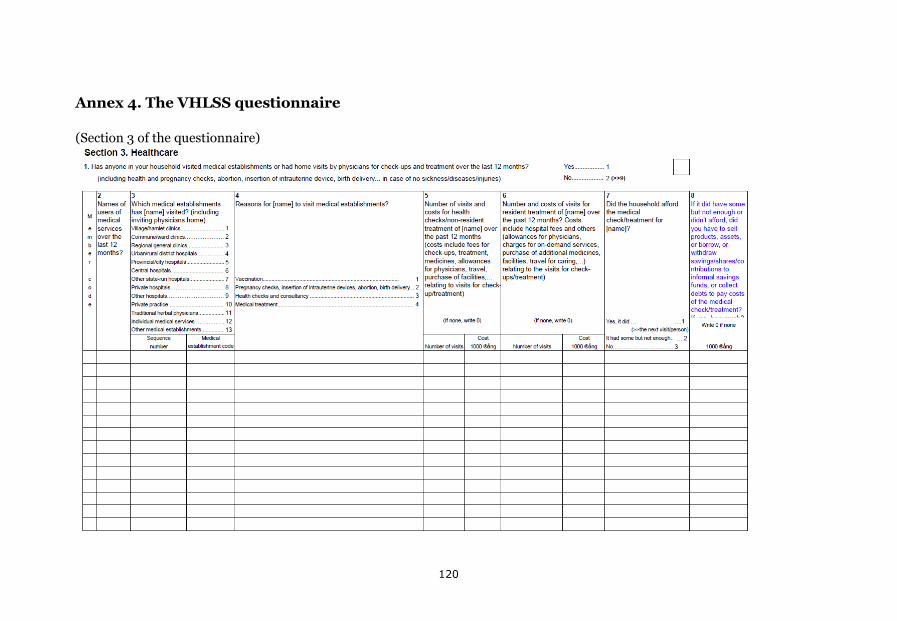
Annex 4. The VHLSS questionnaire
(Section 3 of the questionnaire)
120
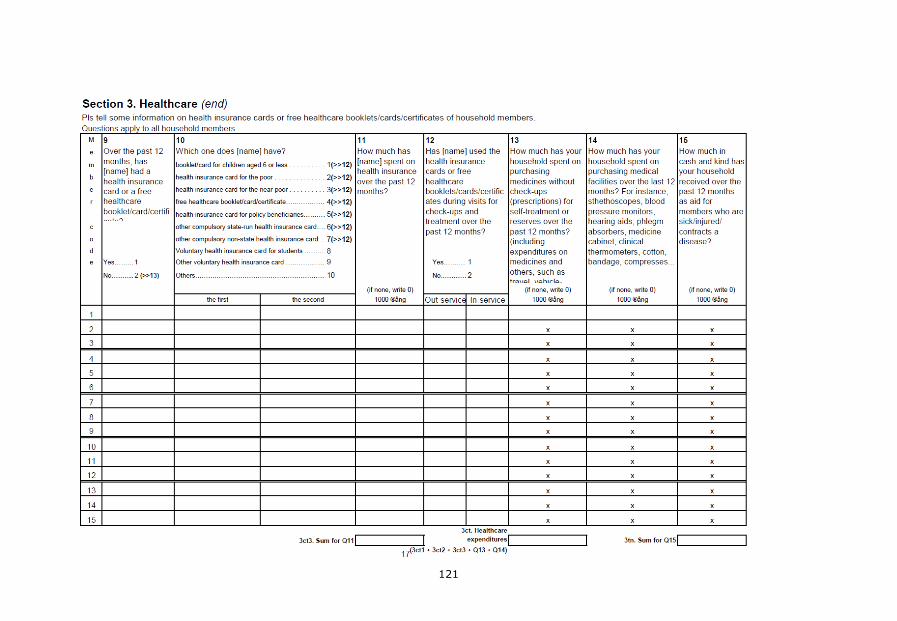
121