CATALYTIC HYDROGENENOLYSIS OF BIORENEWABLE …
141
CATALYTIC HYDROGENOLYSIS OF BIORENEWABLE SUBSTRATES TO PREPARE POLYOLS By Yaoyan Xi A DISSERTATION Submitted to Michigan State University In partial fulfillment of the requirement For the degree of DOCTOR OF PHILOSOPHY Chemical Engineering 2010
Transcript of CATALYTIC HYDROGENENOLYSIS OF BIORENEWABLE …

CATALYTIC HYDROGENOLYSIS OF BIORENEWABLE SUBSTRATES TO PREPARE POLYOLS
By
Yaoyan Xi
A DISSERTATION
Submitted to Michigan State University
In partial fulfillment of the requirement For the degree of
DOCTOR OF PHILOSOPHY
Chemical Engineering
2010
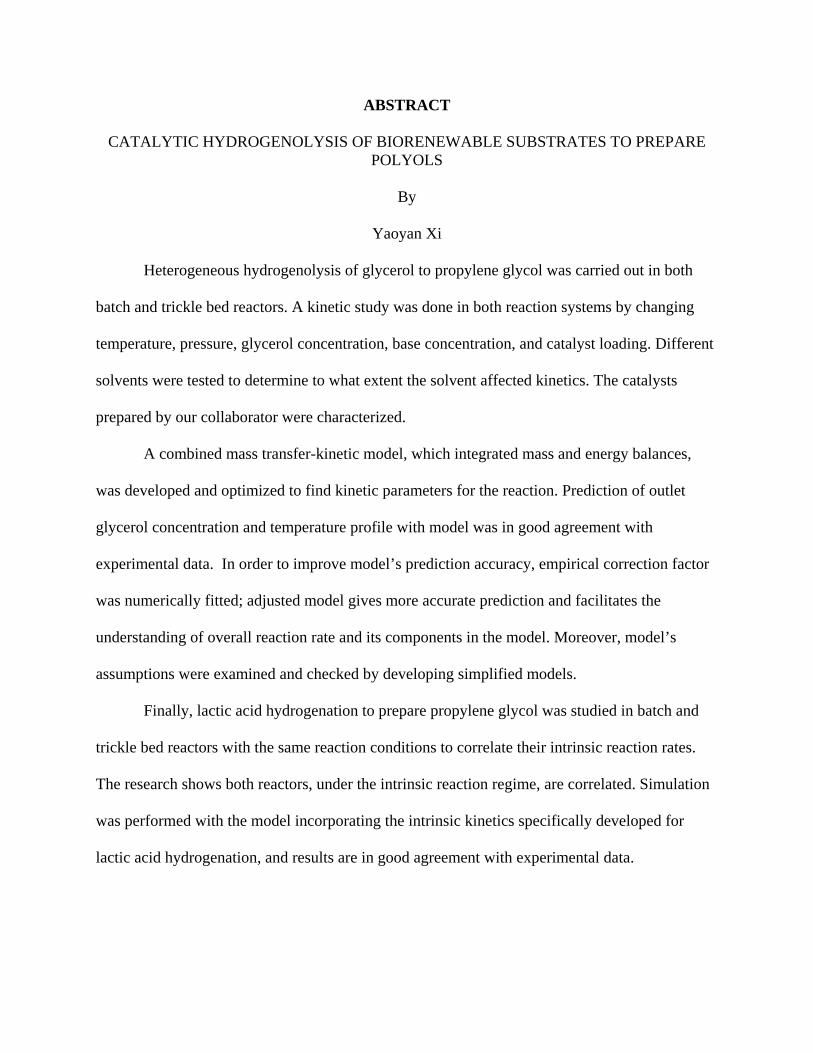
ABSTRACT
CATALYTIC HYDROGENOLYSIS OF BIORENEWABLE SUBSTRATES TO PREPARE POLYOLS
By
Yaoyan Xi
Heterogeneous hydrogenolysis of glycerol to propylene glycol was carried out in both
batch and trickle bed reactors. A kinetic study was done in both reaction systems by changing
temperature, pressure, glycerol concentration, base concentration, and catalyst loading. Different
solvents were tested to determine to what extent the solvent affected kinetics. The catalysts
prepared by our collaborator were characterized.
A combined mass transfer-kinetic model, which integrated mass and energy balances,
was developed and optimized to find kinetic parameters for the reaction. Prediction of outlet
glycerol concentration and temperature profile with model was in good agreement with
experimental data. In order to improve model’s prediction accuracy, empirical correction factor
was numerically fitted; adjusted model gives more accurate prediction and facilitates the
understanding of overall reaction rate and its components in the model. Moreover, model’s
assumptions were examined and checked by developing simplified models.
Finally, lactic acid hydrogenation to prepare propylene glycol was studied in batch and
trickle bed reactors with the same reaction conditions to correlate their intrinsic reaction rates.
The research shows both reactors, under the intrinsic reaction regime, are correlated. Simulation
was performed with the model incorporating the intrinsic kinetics specifically developed for
lactic acid hydrogenation, and results are in good agreement with experimental data.

ACKNOWLEDGEMENTS
I would like to thank my academic advisor, Dr. Dennis J. Miller, for his guidance and
support in my research projects. I would also like to thank Dr. Bruce Dale, Dr. Lawrence Drzal,
Dr. Ramini Narayan, and Dr. James Jackson for serving on my graduate committee. Finally, I
would like to acknowledge the generous financial and technical support provided by Department
of Energy, Pacific Northwestern National Laboratory, and Michigan Economic Development
Cooperation.
iii

TABLE OF CONTENTS
LIST OF TABLES…………………………………………………………………..…..vii
LIST OF FIGURES…………………………………………………………...................ix
LIST OF SYMBOLS……………………………………………………………............xii
PART I GENERAL INTRODUCTION
CHAPTER 1 LITERATURE REVIEW ………………………………………………………………...1
1.1. Current Developments in Glycerol Applications……….…………………………1 1.2. Prior Arts in Glycerol Hydrogenolysis...…………………………………………..1 1.3. Prior Arts in Trickle Bed Reactor Modeling…………...………………………….4
CHAPTER 2 EXPERIMENTAL SYSTEMS AND METHODS……………………………………….6 2.1. Chemicals……………………………………………………………………….…6 2.2. Catalysts and Characterization………………………………………………….…6 2.3. Apparatus and Operations………………………………………………………... 7 2.3.1. Batch Reactors and Operations………………………………………………..7 2.3.2. Trickle Bed Reactors and Operations ………………………………………...9 2.4. Sampling and Analysis …………………………………………………………..11
PART II EXPERIMENTS AND DISCUSSIONS
CHAPTER 3 EXPERIMENTS IN THE BATCH REACTORS……………………………………….14 3.1. Experiments in Batch Reactors…………………………………………………..14 3.2. Result Reproducibility …………………………………………………………..16 3.3. Effect of Base Promoter …………………………………………………….…...17 3.4. Effect of Catalyst Loading ……………………………………………………....19 3.5. Mass Transfer Analysis………………………………………………………......22 3.6. Effect of Reaction Temperature……………………………………………….....22 3.7. Effect of Different Solvents………………………………………………….......23 3.8. Effect of Impurities in Feedstock………………………………………………...26 3.9. Catalyst Specific Kinetic Study……………………………………………….…28
CHAPTER 4 EXPERIMENTS IN CONTINUOUS TRICKLE BED REACTOR…….………….…..31 4.1. Reaction Mass Conservation………………………………………………..........31
iv

4.2. Catalyst Specific Kinetic Study…………………………………………………34 4.2.1. PNNL 58959-72-1 Catalyst............................................................................34 4.2.2. PNNL 59260-33E Catalyst.............................................................................40 4.2.3. PNNL 59260-51-65 Catalyst……………………………………………......43
PART III REATION RATE MODELING AND CORRELATION
CHAPTER 5 INTEGRAL MODEL FOR GLYCEROL HYDROGENOLYSIS IN TRICKLE BED …….……………………………………………………………………………………44 5.1. Kinetic Model…………………………………………………………………...44 5.2. Reactor Model…………………………………………………………………..47 5.3. Mass Transfer…………………………………………………………………...49 5.4. Solution Method and Kinetic Parameter Optimization…………………………53
5.5. Results…………………………………………………………………………..54 5.5.1. Modeling of PNNL Trickle Bed Experiments…………………………..….54 5.5.2. Modeling of MSU Trickle Bed Experiments…………………………….....62
5.6. Extended Model with Partial Wetting Efficiency Correction Factor ()…..…...63 5.6.1. Rationale and Methodology……………………………………………..….63 5.6.2. Data Fitting Results……………………………………………………..…..65 5.7. Examination of Simplified Models for Trickle Bed Reactors……………..…...67 5.7.1. Isothermal Catalyst Bed…………………………………………………... .68 5.7.2. Simplified Rate Expression………………………………………………...69 5.7.3. Fully Wetted Catalyst bed……………………………………………….…70
5.8. Gas-Liquid Mass Transfer Coefficient Sensitivity Analysis...............................71 5.9. Commercial Production Simulation…………………………………………....72
CHAPTER 6 TRICKLE BED MODEL WITH CORRECTED RATE EXPRESSIONS..……….….73 6.1. Results…………………………………… ...…………………………….…….73 6.2. Evaluation of Model Assumptions……………………………………….……..79 6.2.1. Isothermal Catalyst Bed….……………………………………………….. .80 6.2.2. Fully Wetted Catalyst Bed……………………………………………….....81 6.2.3. Gas-Liquid Mass Transfer Coefficient Sensitivity Analysis…………….…83 6.3. Conclusions……………………...………………………………………..….....83
CHAPTER 7 INTRINSIC REACTION RATE CORRELATION FOR BATCH AND TRICKLE BED REACTORS……………………………………………………………..………….…85 7.1. Kinetic Model for Lactic Acid Conversion ...……………………………….…86 7.2. Parallel Experiment Runs………..…………………………………………..…87 7.2.1. Batch Reactor Experiments…………………………………………….…..88 7.2.2. Trickle Bed Reactor Experiments……………………………………….....89 7.3. Trickle Bed Reactor Modeling ……………………...………………………....93
7.4. Results and Discussion……………………….……………………………..….96 7.4.1. Comparison of Trickle Bed Model (Cases 1-4) with Experiments……….101
v

7.4.2. Comparison of Batch and Trickle Bed Reaction Rates…………………...104 7.5. Conclusions…………………………………………………………………....105
CHAPTER 8 CONCLUSION AND RECOMMENDATIONS FOR FUTURE WORK………...107
APPENDICES APPENDIX A. Detailed Derivation of Kinetic Model …………………………....111
APPENDIX B. Corrected Derivation of Kinetic Model…..…………………….…114 APPENDIX C. Microsoft Excel Macro Program…………………………….….....117
LIST OF REFERENCES………………………………………………………….…..120
vi

LIST OF TABLES
Table 2-1. Catalyst characterization summaries………………………………………7
Table 3-1. Batch reaction conditions………………………………………………….15
Table 3-2. Analysis reproducibility …………………………………………………..16
Table 3-3. Initial reaction rates with various catalyst loadings..…………...................21
Table 3-4. Weisz-Prater calculation results…………………………………………...22
Table 3-5. BAT 12 and BAT 13 glycerol concentrations...…………………………...23
Table 3-6. Initial reaction rates with different solvents…………………………….....25
Table 3-7. Reaction rates of different catalysts ………………………………………30
Table 4-1. Mass balance of TBR 7, TBR 8, and TBR 9……………………………....32
Table 4-2. Trickle bed reaction conditions……………………………………………33
Table 4-3. Glycerol consumption rate in TBR 7 and TBR 9……………………….....34
Table 4-4. Reaction rate for different feed flow rates…...………………………….....38
Table 4-5. Reaction rate for different feed flow rates…...………………………….....41
Table 4-6. Experiment results summary (TBR 21-30)…….………………………….43
Table 5-1. Physical properties used for trickle bed modeling………………………...53
Table 5-2. Summary of PNNL Trickle Bed Run Conditions and Results..…….……..55
Table 5-3. Optimal kinetic parameters for rate expression (PNNL data based)…...….56
Table 5-4. Optimal kinetic parameter summary (MSU TBR15~19 based)……….…..62
Table 5-5. Optimal kinetic parameter summary (MSU TBR 20~30 based)……… ...63
Table 5-6. Partial wetting correction factor results……………………...……….……66
vii

Table 5-7. Optimal parameters from isothermal catalyst bed assumption..…………...68
Table 5-8. Optimal parameters for model with simplified rate expression……………69
Table 5-9. Commercial process simulation summary……………………………...….72
Table 6-1. Summary of Trickle Bed Run Conditions and Results …………...….……74
Table 6-2. Optimized Kinetics Parameter for Rate Expression…….…………………75
Table 7-1. Constants in Kinetic Model for Lactic Acid Hydrogenation……………....87
Table 7-2. Lactic Acid Hydrogenolysis Trickle Bed Experiments……………………90
Table 7-3. Propylene Glycol Formation Rates in Trickle Bed and Batch Reactors
(T=90℃; 8.3 MPa H2; 1.0 M solution lactic acid feed)..............................92 Table 7-4. Results of Trickle Bed Modeling (Cases 1-4) of Lactic Acid Hydrogenolysis……………………………………………………….........98
viii

LIST OF FIGURES
Figure 2-1. Schematic configuration of a batch reactor (Parr 300ml).…….………….8
Figure 2-2. Schematic configuration of a trickle bed reactor….………………...........11
Figure 2-3. Trickle bed reactor entire process schematic……………………………..13
Figure 3-1. Effect of base promoter presence on glycerol conversion (200°C, 1000 psig, initial glycerol concentration: 1.0 mol/l, Re/Ni/C catalyst, 1.5 g, 150 ml feedstock)……………………………………………………………..17
Figure 3-2. Effect of base promoter presence on propylene glycol yield (200°C, 1000 psig, initial glycerol concentration: 1.0 mol/l, Re/Ni/C catalyst, 1.5 g, 150 ml feedstock)……………………………………………………………..18
Figure 3-3. Selectivity toward propylene glycol versus time with(out) base (200°C, 1000 psig, initial glycerol concentration: 1.0 mol/l, Re/Ni/C catalyst, 1.5 g, 150 ml feedstock)………………………………………………………...18
Figure 3-4. Effect of catalyst loading on glycerol conversion (200°C, 1000 psig, 1.0 M glycerol initial concentration, 1.0 M KOH, and equivalent catalyst loading per 100 ml feedstock for each reaction)…………………………………..19
Figure 3-5. Effect of catalyst loading on propylene glycol yield (200°C, 1000 psig, 1.0 M glycerol initial concentration, 1.0 M KOH, and equivalent catalyst loading per 100 ml feedstock for each reaction )…………………………20
Figure 3-6. Effect of catalyst loading on selectivity toward propylene glycol (200°C, 1000 psig, 1.0 M glycerol initial concentration, 1.0 M KOH, and equivalent catalyst loading per 100 ml feedstock for each reaction )………………...20
Figure 3-7. Effect of solvents on glycerol conversion (200°C, 1000 psig, 1.0M glycerol initial concentration, 0.11M KOH, 0.25 g Re/Ni/C, 50 ml feedstock)…....24
Figure 3-8. Effect of solvents on propylene glycol yield (200°C, 1000 psig, 1.0 M glycerol initial concentration, 0.11M KOH, 0.25 g Re/Ni/C, 50 ml feedstock)……………………………………………………………….....24
Figure 3-9. Effect of solvents on propylene glycol selectivity (200°C, 1000 psig, 1.0 M glycerol initial concentration, 0.11M KOH, 0.25 g Re/Ni/C, 50 ml feedstock)……………………………………………………………….…25
ix

Figure 3-10. Effect of feedstock impurities on glycerol conversion (190°C, 1200 psig, 40 wt% glycerol solution, 2 wt% NaOH, 0.5 g PNL-58969-10-1-R, 100 ml feedstock)…………………………………………………………….……26
Figure 3-11. Effect of feedstock impurities on propylene glycol yield (190°C, 1200 psig, 40 wt% glycerol solution, 2 wt% NaOH, 0.5 g PNL-58969-10-1-R, 100 ml feedstock)…………………………………………………………………27
Figure 3-12. Effect of feedstock impurities on selectivity toward propylene glycol (190°C, 1200 psig, 40 wt% glycerol solution, 2 wt% NaOH, 0.5 g PNL- 58969-10- 1-R, 100 ml feedstock)………………………………….…….27
Figure 3-13. Glycerol conversions with catalyst 59260-33E at different temperatures..29
Figure 3-14. Propylene glycol yield versus time at different temperatures…………….29
Figure 4-1. Effect of temperature on glycerol conversion in trickle bed reactor……...35
Figure 4-2. Effect of temperature on propylene glycol yield in trickle bed reactor…...35
Figure 4-3. Effect of temperature on selectivity toward propylene glycol in trickle bed reactor……………………………………………………………….….…36
Figure 4-4. Carbon balance versus time in trickle bed reactor………………….……..36
Figure 4-5. Effect of feed flow rate on glycerol conversion with catalyst 58959-72-1 (230°C, 1100 psig, 1.0 M glycerol, 0.25M NaOH, 30 ml catalyst)…………………………………………………………………....39
Figure 4-6. Effect of feed flow rate on propylene glycol yield with catalyst 58959-72-1 (230°C, 1100 psig, 1.0 M glycerol, 0.25M NaOH, 30 ml catalyst)…………………………………………………………………....39
Figure 4-7. Effect of feed flow rate on selectivity toward propylene glycol with catalyst 58959-72-1 (230°C, 1100 psig, 1.0 M glycerol, 0.25M NaOH, 30 ml catalyst)……………………………………………………………..…40
Figure 4-8. Effect of feed flow rate on glycerol conversion with catalyst 59260- 33E (190°C,1200 psig, 1.0 M glycerol, 0.25 M NaOH, 45 ml catalyst)... .41
Figure 4-9. Effect of feed flow rate on propylene glycol yield with catalyst 59260-33E (190°C,1200 psig, 1.0 M glycerol, 0.25 M NaOH, 45 ml catalyst)…………………………………………………………………....42
Figure 4-10. Effect of feed flow rate on selectivity toward propylene glycol with catalyst 59260-33E (190°C,1200 psig, 1.0 M glycerol, 0.25 M NaOH, 45
x

ml catalyst)………………………………………………………………..42
Figure 5-1. Steady state concentration profiles in the wetted fraction of the trickle bed reactor…………………………………………………………….….51
Figure 5-2. Outlet glycerol simulated and experimental conversions ………….…….57
Figure 5-3. Parity plot of experimental versus predicted GO conversion.……….…...58
Figure 5-4. Predicted vs. experimental temperature profiles in trickle bed...………...59
Figure 5-5a. Simulated GO concentration profiles in trickle bed for different inlet temperatures……………………………………………………………...60
Figure 5-5b. Simulated GO concentration profiles in trickle bed for different liquid feed flow rates…………………………………………………………………60 Figure 5-5c. Simulated GO concentration profiles in trickle bed at different NaOH concentrations…………………………………………………………….61
Figure 5-6. Effect of pressure on outlet GO conversion from trickle bed reactor…….61
Figure 5-7. Parity plot for MSU experiments………………………………….. …….63
Figure 6-1. Trickle bed simulation parity plot with corrected rate expression..….…...75
Figure 6-2. Predicted vs. experimental temperature profile in trickle bed...………….76
Figure 6-3a. Simulated GO concentration profiles in trickle bed for different inlet temperatures………………………………………………………………77
Figure 6-3b. Simulated GO concentration profiles in trickle bed for different liquid feed flow rates.………………………………………………………………....78
Figure 6-3c. Simulated GO concentration profiles in trickle bed at different NaOH concentrations………………………………………………...…………..78
Figure 6-4. Effect of pressure on outlet GO conversion from trickle bed reactor…….79
Figure 7-1. Propylene glycerol yield versus time in a batch reactor at 363K and 8.3
MPa H2……………………………………………………………………………………………………...88
Figure 7-2. Propylene glycerol yield (363K; 8.3MPa H2) versus time with different flow rates…………………………………………………………….……91
Figure 7-3. Parity plot of model simulation versus experiment results....………...…100
xi

LIST OF SYMBOLS
CGO glycerol concentration (kmol/m3 fluid)
CH2,L hydrogen concentration in bulk liquid phase (kmol/m3 fluid)
CH2,S hydrogen liquid phase concentration at catalyst surface (kmol/m3 fluid)
CGA·S glyceraldehyde concentration (kmol/m3 fluid)
CS free site concentration on catalyst surface (kmol/m3 fluid)
COH- base concentration (kmol/m
3 fluid)
Ctotal total site concentration on catalyst surface (kmol/m3 fluid)
CLA lactic acid concentration, kmol/m3 fluid
C*
H2 equivalent hydrogen bulk concentration, kmol/m3 fluid
CH2, L hydrogen concentration on gas-liquid interface, kmol/m3 fluid
CH2,S hydrogen concentration on liquid-solid interface, kmol/m3 fluid
CI·S adsorbed intermediate concentration (kmol/m3 fluid)
Cp specific heat of solution (kJ/kg/K)
dp catalyst particle diameter (m)
De,H2 hydrogen effective diffusivity (m3 fluid/m cat/sec)
xii
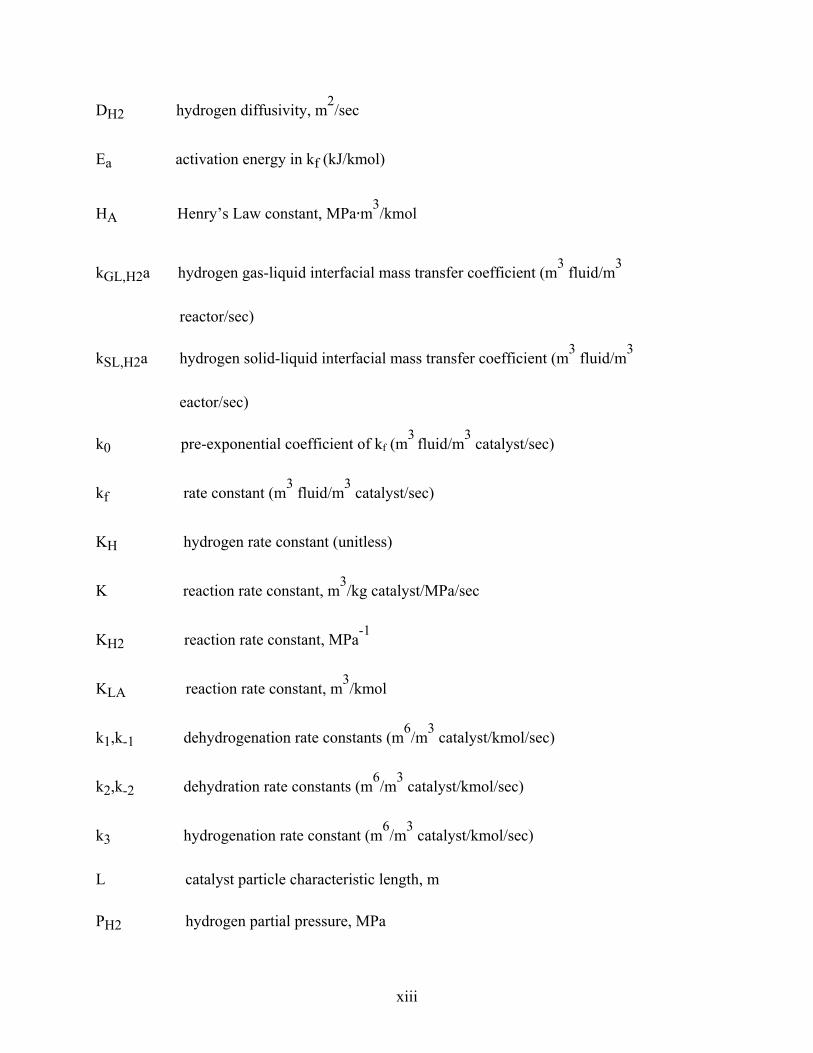
DH2 hydrogen diffusivity, m2/sec
Ea activation energy in kf (kJ/kmol)
HA Henry’s Law constant, MPa∙m3/kmol
kGL,H2a hydrogen gas-liquid interfacial mass transfer coefficient (m3 fluid/m
3
reactor/sec)
kSL,H2a hydrogen solid-liquid interfacial mass transfer coefficient (m3 fluid/m
3
eactor/sec)
k0 pre-exponential coefficient of kf (m3 fluid/m
3 catalyst/sec)
kf rate constant (m3 fluid/m
3 catalyst/sec)
KH hydrogen rate constant (unitless)
K reaction rate constant, m3/kg catalyst/MPa/sec
KH2 reaction rate constant, MPa-1
KLA reaction rate constant, m3/kmol
k1,k-1 dehydrogenation rate constants (m6/m
3 catalyst/kmol/sec)
k2,k-2 dehydration rate constants (m6/m
3 catalyst/kmol/sec)
k3 hydrogenation rate constant (m6/m
3 catalyst/kmol/sec)
L catalyst particle characteristic length, m
PH2 hydrogen partial pressure, MPa
xiii

-RLA,G lactic acid global reaction rate, kmol/kg catalyst/sec
-RLA,obs lactic acid intrinsic reaction rate, kmol/kg catalyst/sec
r1 dehydrogenation rate (kmol/m3 catalyst/sec)
r2 dehydration rate (kmol/m3 catalyst/sec)
r3 hydrogenation rate (kmol/m3 catalyst/sec)
R reactor radius (m)
Robv observed reaction rate (kmol/m3 reactor/sec)
t time (sec)
T temperature (K)
Tc coolant temperature (K)
∆HR heat of reaction (kJ/kmol)
Uo overall heat transfer coefficient, J/m2/K/sec
XGO glycerol conversion at trickle bed outlet
εW fraction of bed wetted
εP catalyst particle porosity
εB bed porosity (m3 void/m
3 reactor)
ηH2 hydrogen effectiveness factor
ρ fluid density (kg/m3)
xiv

xv
τ trickle bed residence time (m3 reactor·sec/m
3 fluid)
φ Thiele modulus

1
Part I General Introduction
Chapter 1 Literature Review
1.1. Current Developments in Glycerol Applications
At present, the chemical industry worldwide is heavily dependent on petroleum and its
derivatives. Given that petroleum resources are limited and will be depleted sooner rather than
later, it is important for chemical industries to find alternatives to sustain their growth.1-5
Biomass is a promising choice given that it (1) is available in large amounts, (2) is easily
accessed, and (3) has potential for a broad spectrum of products via environmentally friendly
processes.6-10
Glycerol can be readily derived from biomass sources such as sugarcane and
straw and is currently produced mainly by the petrochemical and biodiesel industries without
efficient use despite its tremendous potential. Therefore, this research project is to join the global
effort to explore chemicals from biomass and to develop value added processes in the face of the
current bleak conventional energy future. Propylene glycol is selected as the value added
synthesis product from glycerol in this project, based on its current various applications in the
pharmaceuticals, cosmetics, and auto cooling media.11,12
At the same time, propylene glycol’s
unique molecular structure, two hydroxyls, allows derivatization for potential monomers for the
polymer industry.13,14
1.2. Prior Arts in Glycerol Hydrogenolysis
A great number of papers and patents have been published regarding the preparation of
propylene glycol by glycerol hydrogenolysis.15-17
Previous research focused mainly on either

2
(1) catalyst formulation followed by reaction condition optimization, (2) mechanistic
investigations, or (3) propylene glycol preparation by hydrogenolysis of glycerol on metal or
alloy catalysts. Casale et al.18
tried ruthenium catalyst modified with sulfides in a basic
environment. Main products were 1,2-propanediol and lactic acid. Ratio of sulfide ions to
ruthenium in the catalyst was chosen to range from 0.2 to 5 moles of sulfur ions per mole of
ruthenium. The base was a compound selected from the group consisting of hydroxides of alkali
metal, alkaline earth metal, sodium carbonates, and quaternary ammonium salts and was used in
a quantity to bring pH within a range of 8 to 13. Reaction temperature was over 200°C, and
pressure was between 5~20 MPa. According to data provided in the patent, glycerol is
completely converted, and selectivity toward propylene glycol, lactic acid, ethylene glycol,
ethanol, and i-propanol is 75.2%, 13.4%, 5.1%, 0.6%, and 2.0%, respectively. The remainder is
gaseous side products. This result can apply to impure glycerol, which brings huge leverage for
this patent.
Schuster et al.19
investigated a process where glycerol was hydrogenated to propylene
glycol with a catalyst containing active metals such as cobalt, copper, manganese, and
molybdenum. Weight percentage for each metal was suggested as 40-70% of cobalt, 10-20% of
copper, 0 to 10% of manganese, and 0-10% of molybdenum. This catalyst might additionally
contain inorganic polyacids and/or heteropolyacids in an amount of up to 10% by weight, based
on the total weight. Reactions were conducted at temperatures ranging from 200~250°C and
pressures ranging from 200~325 bars. Analysis with HPLC shows that reaction mixture contains
95.8 wt% of 1,2-propanediol, 3.2 wt% n-propanol, and no glycerol.
3
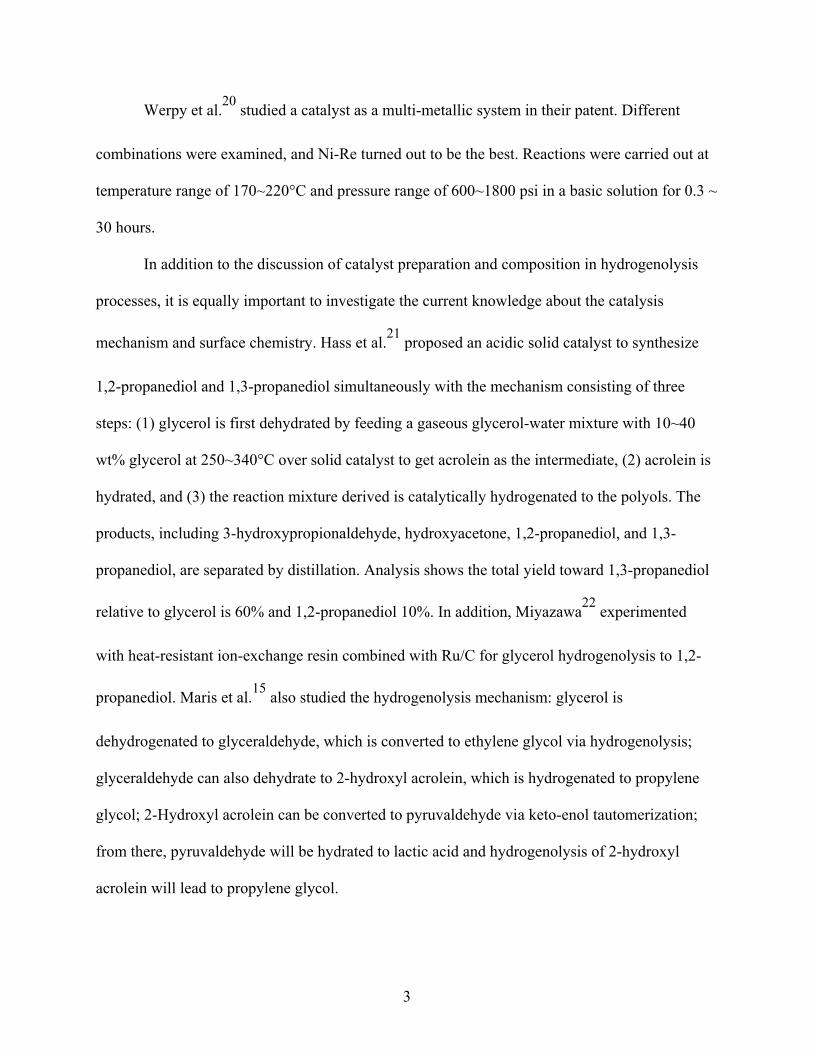
Werpy et al.20
studied a catalyst as a multi-metallic system in their patent. Different
combinations were examined, and Ni-Re turned out to be the best. Reactions were carried out at
temperature range of 170~220°C and pressure range of 600~1800 psi in a basic solution for 0.3 ~
30 hours.
In addition to the discussion of catalyst preparation and composition in hydrogenolysis
processes, it is equally important to investigate the current knowledge about the catalysis
mechanism and surface chemistry. Hass et al.21
proposed an acidic solid catalyst to synthesize
1,2-propanediol and 1,3-propanediol simultaneously with the mechanism consisting of three
steps: (1) glycerol is first dehydrated by feeding a gaseous glycerol-water mixture with 10~40
wt% glycerol at 250~340°C over solid catalyst to get acrolein as the intermediate, (2) acrolein is
hydrated, and (3) the reaction mixture derived is catalytically hydrogenated to the polyols. The
products, including 3-hydroxypropionaldehyde, hydroxyacetone, 1,2-propanediol, and 1,3-
propanediol, are separated by distillation. Analysis shows the total yield toward 1,3-propanediol
relative to glycerol is 60% and 1,2-propanediol 10%. In addition, Miyazawa22
experimented
with heat-resistant ion-exchange resin combined with Ru/C for glycerol hydrogenolysis to 1,2-
propanediol. Maris et al.15
also studied the hydrogenolysis mechanism: glycerol is
dehydrogenated to glyceraldehyde, which is converted to ethylene glycol via hydrogenolysis;
glyceraldehyde can also dehydrate to 2-hydroxyl acrolein, which is hydrogenated to propylene
glycol; 2-Hydroxyl acrolein can be converted to pyruvaldehyde via keto-enol tautomerization;
from there, pyruvaldehyde will be hydrated to lactic acid and hydrogenolysis of 2-hydroxyl
acrolein will lead to propylene glycol.

4
Beyond the discussion of catalyst preparation and reaction mechanism, a great number of
kinetic studies have been done. Suppes et al.23
studied the effects of temperature, hydrogen
pressure, initial water content, choice of catalyst and its reduction temperature, and catalyst
loading. This study also validated a new reaction pathway for converting glycerol to propylene
glycol via the acetol intermediate. Shanks et al.24 studied ruthenium on carbon catalyst in batch
reactor at two pH levels to obtain kinetic data. Langmuir-Hinshelwood type models were
developed from experimental data to describe glycerol hydrogenolysis to propylene glycol,
ethylene glycol, and further degradation of glycols. Their study also determined the competitive
adsorption coefficients for reaction species.
1.3. Prior Arts in Trickle Bed Reactor Modeling
Our research project is designed to prepare for the scale-up of glycerol hydrogenolysis
after initial research conducted in the batch reactors to provide insight into the catalysis
mechanism and kinetics. Therefore, moving on to a multiphase reactor environment is an
obvious choice in order to achieve the ultimate goal of commercial production. Multiphase
reactors are widely used in the production of petroleum-based fuels, commodity and specialty
chemicals, pharmaceuticals, and polymers.25-30 Trickle bed reactors are especially favored,
thanks to their easy installation, various configurations, flexible operating conditions, and good
mass transfer between phases. They are widely employed in hydro-treating processes such as
hydrogenolysis, hydrodesulfurization, hydrocracking, and hydrorefining.31-33
Studies that correlate trickle bed reactor performance with operating conditions have
been conducted. Larachi et al.34
investigated the gas-liquid interfacial mass transfer in a trickle
5
bed reactor at the elevated pressure, and proposed a rigorous thermodynamic model accounting
for liquid and gas nonidealities along with pressure, gas and liquid superficial velocities, liquid
viscosity, and packing size. Iliuta et al.35 studied the fluid dynamics and the gas-liquid mass
transfer characteristics in a trickle bed reactor. A more quantitative model was established by Al-
Dahhan et al.36
taking into account flow regime transition, liquid holdup, pressure drop, gas-
liquid interfacial area, mass transfer coefficient, and catalyst wetting efficiencies in both the
liquid-limited and the gas-limited scenarios. Huang et al.37
studied the heat transfer
characteristics of a trickle bed reactor on the laboratory scale and determined four factors
influencing the local fluid-solid convective heat transfer coefficient. A correlation for catalyst
wetting efficiency in a pressurized trickle bed reactor was developed by Al-Dahhan et al.38
to
correlate the laboratory and pilot scale reactors’ data. Tronconi et al.39
developed a mathematical
model to characterize carbohydrate hydrogenolysis.
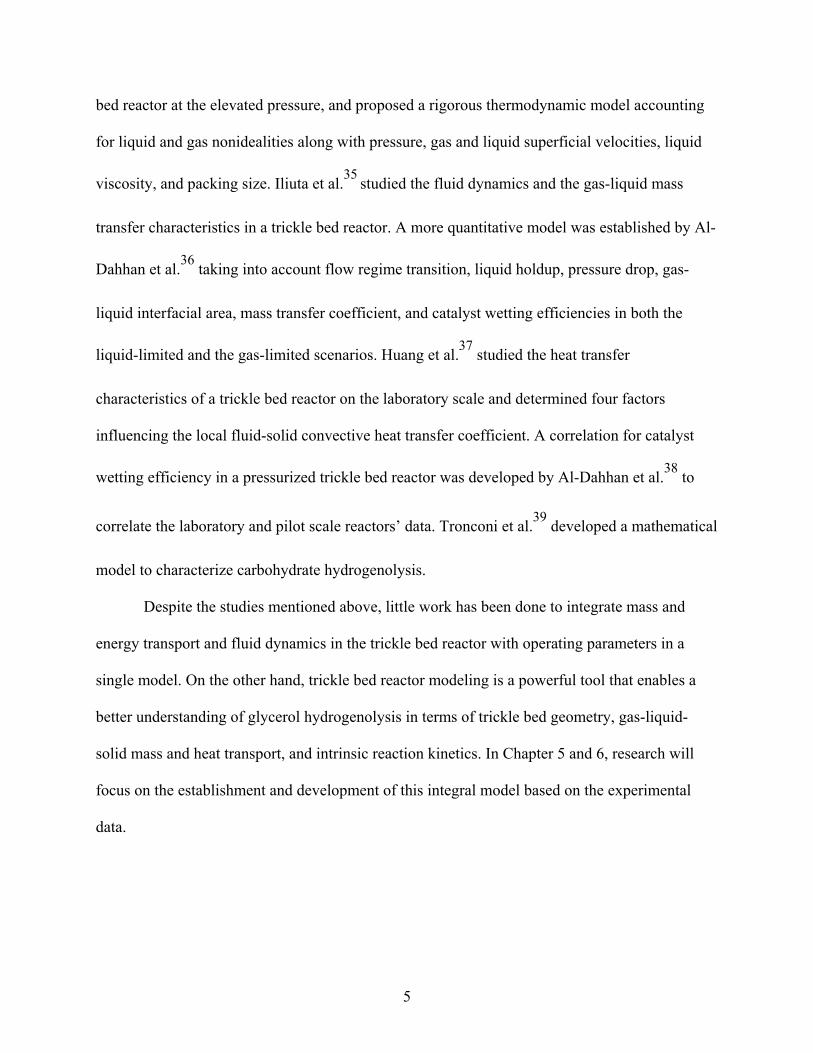
Despite the studies mentioned above, little work has been done to integrate mass and
energy transport and fluid dynamics in the trickle bed reactor with operating parameters in a
single model. On the other hand, trickle bed reactor modeling is a powerful tool that enables a
better understanding of glycerol hydrogenolysis in terms of trickle bed geometry, gas-liquid-
solid mass and heat transport, and intrinsic reaction kinetics. In Chapter 5 and 6, research will
focus on the establishment and development of this integral model based on the experimental
data.

6
Chapter 2 Experimental Systems and Methods
This chapter will mainly introduce the chemicals, the apparatus, and the analytical
instruments and methods employed in the research.
2.1. Chemicals
Ultrahigh purity gases used in our research - hydrogen (99.999%), nitrogen (99.99%),
helium (99.999%), and oxygen (99.99%) - are produced by Linde Gas LLC. The gas mixture
serving as a gas chromatography (GC) analysis standard is produced by AGA Specialty Gas,
where methane, carbon monoxide, carbon dioxide, and hydrogen volume percentages are 2.15%,
2.05%, 2.10%, and 93.7%, respectively. Anhydrous glycerol, or 1,2,3-propanetriol (99.9%),
sodium hydroxide pellets (98.7%), 2-propanol (99.9%), lactic acid (88.9%), and water (99.99%)
are produced by J.T. Baker. Potassium hydroxide pellets (85%), 1-propanol (98%), and sodium
stearate (99%) are manufactured by Sigma-Aldrich, Inc. Sodium chloride (96%) and 1-butanol
(99.56%) are produced by Mallinckrodt, Inc. Propylene glycol (99.5%) is produced by Jade
Scientific, Inc. Ethylene glycol (99.0%) is produced by Spectrum, Inc. Finally, anhydrous
ethanol and sulfuric acid (98%) are produced by Pharmco-Aaper, Inc. and Columbus Chemical
Industries, Inc., respectively.
2.2. Catalysts and Characterization
All catalysts used in our research were prepared by vendors or our collaborators at Pacific
Northwest National Laboratory (PNNL) and consist of active metals such as ruthenium, nickel,
and rhenium loaded onto active carbon. Proprietary catalysts prepared by PNNL were provided

7
with a wide variety of active metal combinations. The catalyst used for the lactic acid
hydrogenolysis study is a 5 wt% ruthenium on coal-based activated carbon (-15+30 mesh,
Calgon Carbon Corp). Inert glass beads (150 to 220 µm) were purchased from Sigma-Aldrich
Co. Catalysts used in glycerol hydrogenolysis were characterized and are listed in Table 2-1.
Table 2-1. Catalyst characterization summaries
Description(Unit) Re/Ni/C 59260-33E 58969-10-1-R 58959-10-1
B.E.T. Area
(m2/g catalyst)
1500±35 840±20 790±15 745±15
Quantity H2 adsorbed (µmol/g catalyst)
18.42 2.04 26.31 62.39
Metal Dispersion (%)
5.60 0.07 0.63 9.18
Metallic Surface Area
(m2/ g catalyst)
1.23 0.02 0.31 4.47
All the physisorption analyses used nitrogen, and chemisorption experiments were done
with hydrogen. Catalyst characterization was done with a Micromeritics 2010 Accelerated
Surface And Porosimetry (ASAP) Analyzer, and catalyst porosimetry test was done with an
Micromeritics AutoPore IV 9500.
2.3. Apparatus and Operations
2.3.1. Batch Reactors and Operations
Two types of batch reactors were used in our research: 1) a Parr 4560 mini reactor (300
ml capacity) with a Parr 3960 M process controller, and 2) a Parr 5000 multiple reactor system (6

8
× 75 ml capacity) with a Parr 4871 process controller. Figure 2-1 shows the configuration of a
300 ml batch reactor.
Catalyst was ground to fine powder and loaded into a 300 ml or 75 ml autoclave and
reduced at 280°C in the hydrogen atmosphere at 500 psi overnight. The magnetic stirrer operated
at 1000 rpm to reduce the heat transfer resistance. The reactor was cooled to room temperature,
and the feedstock was transferred into the autoclave. After being purged several times, the batch
reactor was heated to the temperature set point (180~230°C) and pressurized to the reaction
pressure (1000~1500 psi), and the reaction was started. Agitation speed was maintained at 1000
rpm for all the batch runs to ensure catalyst suspension in the reacting fluid and to minimize gas-
liquid mass transport resistance.
Figure 2-1. Schematic configuration of a batch reactor (Parr 300ml).

9
2.3.2. Trickle Bed Reactors and Operations
Unlike the experiments performed in the batch reactors where the reactor design and
geometry played a less important role in determining mass transfer limits, the trickle bed reactor
and catalyst bed configuration influences, if not heavily, reaction kinetics. Therefore, a catalyst
bed was built to utilize the specific configuration of the trickle bed reactor constructed in the
Miller-Jackson group. The trickle bed reactor consists of a 316 stainless steel tube of 2.5 cm
outer diameter and 1.3 cm inner diameter with a length of 22 cm (45 cm3) catalyst bed. The
entire tube length is 71 cm. Top layer of stainless steel balls takes up 0.15 m, and bottom layer of
glass beads uses 0.24 m. Stainless steel balls (2 mm diameter) were used to facilitate heat
transfer and even liquid feedstock distribution, and glass beads (2 mm diameter) were situated to
support the catalyst bed at the elevated pressure. The reactor features an oil jacket to control
temperature and an internal thermowell to accommodate thermocouple. A Chromel- Alumel
thermocouple (Omega KQXL-116U-24, ungrounded junction, and 1.5 mm × 60 cm in length)
was used to measure temperature profile. Reactor temperature was maintained by a Julabo SE-6
recirculating oil bath that circulates silicon oil through the reactor jacket. The schematic
configuration of the trickle bed reactor is shown in Figure 2-2. In the reactor, pressure was
maintained constant (8.3 MPa in most runs) via a back pressure regulator, and hydrogen flow
rate was monitored by a Porter mass flow controller. Hydrogen was saturated with water in the
saturation tank (2 × 300 ml, Whitney 304L) at the reaction temperature before it entered the top
of trickle bed. Liquid feed solution was fed to the reactor through a Bio-Rad HPLC pump.
Accessories used along with the trickle bed reactor include a stainless steel feedstock charger,
funnels, filters, magnetic stirrers, graduated glass cylinders, stainless steel screens, and an A&D
electronic balance.

10
For the glycerol hydrogenolysis experiments, the amount of catalyst in the trickle bed
reactor was calculated to achieve the same retention time for liquid feedstock as in the trickle bed
reactor of our collaborator PNNL. The catalysts prepared by PNNL needed to be preliminarily
reduced and passivated. The catalyst was heated at 1.5°C/min to 290°C with a combination of
15/85 (V/V) hydrogen/nitrogen flowing through the trickle bed within a range of 100 to 200
standard cubic centimeters per minute (sccm) at 200 psi. After 290°C was reached and catalyst
bed was held there for 3 hours, the flow was switched to 100% hydrogen. Passivation followed
by flowing 5 vol% oxygen in helium to cool the trickle bed reactor to room temperature. The
procedure was repeated for the whole batch of catalyst to make it ready for the secondary
reduction before each experiment.
For the lactic acid hydrogenolysis experiments, the catalyst was packed into the trickle
bed reactor between a section of glass beads (below) to support the catalyst particles and a set of
stainless steel beads (above) to help preheat the liquid feed prior to contacting the catalyst.
Following the initial packing of a catalyst into the trickle bed, the catalyst was reduced by
heating the trickle bed from room temperature at 1.5°C /min to 290°C and kept for 3 hours in
100 psi hydrogen atmosphere at 100 sccm flow rate. After reduction, the trickle bed was cooled
to reaction temperature with hydrogen still flowing. Once the system pressure and hydrogen flow
rate were steady, the liquid feed pump was started, and cocurrent flow of hydrogen and lactic
acid solution were delivered to the trickle bed top.

11
Figure 2-2. Schematic configuration of a trickle bed reactor.
2.4. Sampling and Analysis
Samples were usually taken every hour in the batch reactors during the course of the
reactions and analyzed afterwards. Sampling in the trickle bed runs is slightly different: samples
were taken every hour by directing the exiting liquid phase from trickle bed reactor to a sampling
tank (50 ml, Whitney 304L stainless steel) for five minutes; otherwise, this continuous liquid
phase was directed to a collection tank ( 500 ml, Whitney 304L stainless steel). The complete
process and instrument diagram (P&ID) is shown in Figure 2-3. A Varian gas chromatograph
(GC, Model 2300) was used to analyze gas samples taken to close the carbon balance. Liquid

12
phase samples were analyzed with HPLC after being diluted 15-50 times depending on feedstock
initial concentration.
Two HPLC’s were used for liquid phase samples, and they use different detectors: an LC
90 UV detector and a Waters 410 LC RI detector were used in the first HPLC with a Bio-Rad
XP-87H column, and the samples were injected with a Waters 717 auto sampler with a Perkin-
Elmer 410 LC pump. The second HPLC used an LDC Analytical RI detector and a Spectra
System UV 3000 detector with a Bio-Rad XP-87H column. Species concentrations were
determined from the comparison with a multipoint calibration curve using an external standard.
A material balance was then conducted by entering species concentrations into an Excel
spreadsheet.

13
Figure 2-3. Trickle bed reactor entire process schematic.

14
Part II Experiments and Discussions
Chapter 3 Experiments in the Batch Reactors
This chapter mainly focuses on the experiments with various catalysts and their kinetic
performance for a better understanding of the hydrogenolysis mechanism and therefore,
optimizing the catalyst performance in the batch reactors.
3.1. Experiments in Batch Reactors
For the experiments carried out in the batch reactors, four catalysts were studied:
Re/Ni/C, PNNL-59260-33E, PNNL-58969-10-1-R, and PNNL-58959-10-1. All the catalysts are
PNNL’s proprietary materials. Reaction conditions, such as temperature and pressure, were
changed to investigate their effects on the reaction kinetics and catalyst performance. Different
base promoters and solvents were also tested and compared. To bring this study closer to
industrial reality, impurities were added to feedstock, and their effects on the system were
studied. More details for each subtopic will be discussed. Reaction conditions for the batch
reactors are listed in Table 3-1.
Control experiments were conducted with no base present (BAT 3, 1000 psi H2) and with
no hydrogen present (BAT 11, 0.11 M KOH). No glycerol conversion was observed in these
experiments. The carbon balance for each reaction is excellent. Given the excellent mass
conservation and the fact that reactant solution density does not change much, carbon balance
was calculated with compounds’ concentrations from HPLC analysis and then compared with the
initial glycerol concentration. For instance, in BAT 3

15
Table 3-1. Batch reaction conditions
Serial No.
Tempera-ture (℃)
Pressure (psi)
Initial Glycerol
Concentration ( mol/l)
Base Initial Base
concentration(mol/l)
Solvent Feedstock
volume (ml)
Catalyst Weight
(g) Catalyst ID
BAT 3 200 1000 1.0 - - water 150 1.5 Re/Ni/C BAT 4 200 1000 1.0 KOH 1.0 water 150 1.5 Re/Ni/C BAT 6 200 1000 1.0 KOH 1.0 water 100 0.75 Re/Ni/C BAT 8 200 1000 1.0 KOH 1.0 water 150 0.75 Re/Ni/C BAT 9 200 1000 1.0 KOH 0.11 water 100 0.5 Re/Ni/C
BAT 10 200 1000 1.0 KOH 0.11 water 100 0.5 Re/Ni/C BAT 11 200 225 1.0 KOH 0.11 water 100 0.5 Re/Ni/C BAT 12 200 1500 1.0 KOH 0.11 water 100 0.5 Re/Ni/C BAT 13 220 1500 1.0 KOH 0.11 water 100 0.5 Re/Ni/C BAT 15 200 1000 1.0 KOH 0.11 ethanol 50 0.25 Re/Ni/C
BAT 16 200 1000 1.0 KOH 0.11 n-propanol 50 0.25 Re/Ni/C
BAT 18 200 1000 1.0 KOH 0.11 isopropanol 50 0.25 Re/Ni/C
BAT 19 200 1000 1.0 KOH 0.11 water 50 0.25 Re/Ni/C
BAT 29 200 1000 1.0 KOH 0.11 water 100 0.5 58959-10-1 BAT 30 200 1000 1.0 KOH 0.11 water 100 0.5 58959-10-1
BAT 35 190 1200 4.86 NaOH 0.57 water 100 0.5 58969-10-1-
R
BAT 36* 190 1200 4.86 NaOH 0.57 water 100 0.5
58969-10-1-R
BAT 37**
190 1200 4.86 NaOH 0.57 water 100 0.5 58969-10-1-
R
BAT 40 190 1200 4.86 NaOH 0.57 water 100 0.5 58959-
72-1-R&P BAT 46 190 1200 4.86 NaOH 0.57 water 100 1.0 59260-33E BAT 47 175 1200 4.86 NaOH 0.57 water 100 1.0 59260-33E
* 0.5 g Na stearate was added to feedstock to study the impurity’s effect on the reaction. ** 0.5 g NaCl was added to feedstock to study the impurity’s effect on the reaction.

16
the initial glycerol concentration was 0.99 M. After one hour, HPLC analysis showed glycerol
concentration was 0.98 M and propylene glycol concentration was 0.014 M. Therefore, at 1 hour,
reaction carbon balance equals
(0.98 + 0.014) / 0.99 × 100%
that is, 100.40%. In this light, analysis precision and reproducibility must be ensured.
3.2. Result Reproducibility (BAT 9 and BAT 10)
To test system reproducibility and reliability, two experiments, BAT 9 and BAT 10, were
done with identical reaction conditions (200°C,1000 psi, 1.0 M glycerol initial concentration,
0.11 M KOH, 0.5g Re/Ni/C, 100 ml feedstock), where no samples were collected before the
reactions were finished. Table 3-2 shows the final product concentrations after the 7-hour long
reaction. Each sample was analyzed twice to test HPLC reproducibility and reliability.
Table 3-2. Analysis reproducibility
Description BAT 9 BAT 10
Compounds Sample
1 Sample
2
Final Concentration
(mol/l)
Sample1
Sample 2
Final Concentration
(mol/l)
Lactic Acid 0.227 0.219 0.223±0.004 0.160 0.159 0.159±0.003
Glycerol 0.0138 0.0130 0.0134
±0.0004 0.05049 0.05032
0.05041 ±0.00005
Ethylene glycol 0.0540 0.0530 0.0535
±0.0005 0.0467 0.0478
0.0472 ±0.0005
Propylene glycol 0.426 0.420 0.423±0.003 0.418 0.414 0.416±0.002
Table 3-2 shows the reasonably reliable performances both from the reaction system and
from the analysis system. Glycerol concentration disparity shown in both reactions is relatively
17
large due to high conversion of glycerol and low glycerol concentration at the end of reactions.
Also, on the magnitude of 0.01 to 0.05 mol/l, analysis error from HPLC plays a more significant
role, which explains the difference of glycerol final concentrations from BAT 9 and BAT 10.
Lactic acid concentration from both reactions is also different due to the early stage of the
research and experiments.
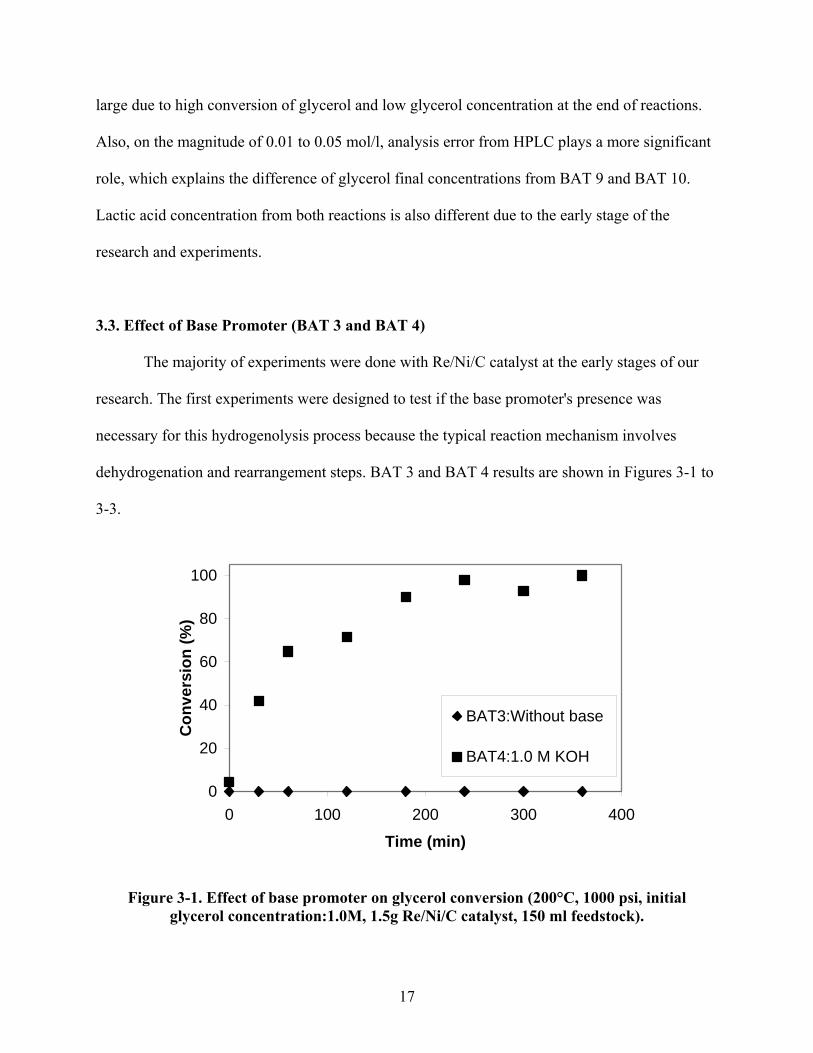
3.3. Effect of Base Promoter (BAT 3 and BAT 4)
The majority of experiments were done with Re/Ni/C catalyst at the early stages of our
research. The first experiments were designed to test if the base promoter's presence was
necessary for this hydrogenolysis process because the typical reaction mechanism involves
dehydrogenation and rearrangement steps. BAT 3 and BAT 4 results are shown in Figures 3-1 to
3-3.
0
20
40
60
80
100
0 100 200 300 400
Time (min)
Co
nve
rsio
n (
%)
BAT3:Without base
BAT4:1.0 M KOH
Figure 3-1. Effect of base promoter on glycerol conversion (200°C, 1000 psi, initial glycerol concentration:1.0M, 1.5g Re/Ni/C catalyst, 150 ml feedstock).

18
0
10
20
30
40
50
60
0 100 200 300 400
Time (min)
Yie
ld (
%)
BAT3:Without base
BAT4:1.0 M KOH
Figure 3-2. Effect of base promoter on propylene glycol yield (200°C, 1000 psi, initial glycerol concentration: 1.0 M, 1.5 g Re/Ni/C catalyst, 150 ml feedstock).
0
10
20
30
40
50
60
0 100 200 300 400
Time (min)
Sel
ecti
vity
(%
)
BAT 3:Without base
BAT 4:1.0 M KOH
Figure 3-3. Selectivity toward propylene glycol versus time with and without base
(200°C, 1000 psi, initial glycerol concentration: 1.0 M, 1.5 g Re/Ni/C catalyst, 150 ml feedstock).

19
From these figures, no glycerol was converted in BAT 3 (no base) versus ready
conversion in BAT 4 with KOH in the feedstock. At the early stages of this study, KOH was
applied mainly at 0.11M concentration in order to be comparable with our project collaborator,
PNNL; later, NaOH was used for the same reason.
3.4. Effect of Catalyst Loading (BAT 4, BAT6, and BAT 8)
The amount of catalyst used in experiments decides the amount of active surface where
reactions take place. Therefore, catalyst loading was changed in BAT 4, BAT 6, and BAT 8 to
investigate how loading affects reaction rate.
0
10
20
30
40
50
60
70
80
90
100
0 100 200 300 400
Time(min)
Co
nve
rsio
n(%
)
BAT 4: 1.0g Re/Ni/C
BAT 6: 0.75g Re/Ni/C
BAT 8: 0.5g Re/Ni/C
Figure 3-4. Effect of catalyst loading on glycerol conversion (200°C, 1000 psi, 1.0 M glycerol initial concentration, 1.0 M KOH, and designated catalyst loading per 100 ml
feedstock for each reaction).

20
0
10
20
30
40
50
60
0 100 200 300 400
Time(min)
Yie
ld(%
)
BAT 4:1.0g Re/Ni/C
BAT 6:0.75g Re/Ni/C
BAT 8:0.5 g Re/Ni/C
Figure 3-5. Effect of catalyst loading on propylene glycol yield (200°C, 1000 psi, 1.0 M glycerol initial concentration, 1.0 M KOH, and designated catalyst loading per 100 ml
feedstock for each reaction ).
0
10
20
30
40
50
60
70
80
0 100 200 300 400Time(min)
Se
lec
tiv
ity
(%)
BAT 4: 1.0g Re/Ni/C
BAT 6: 0.75g Re/Ni/C
BAT 8: 0.5g Re/Ni/C
Figure 3-6. Effect of catalyst loading on selectivity toward propylene glycol (200°C, 1000 psi, 1.0 M glycerol initial concentration, 1.0 M KOH, and designated catalyst
loading per 100 ml feedstock for each reaction ).

21
At higher catalyst loading such as in BAT 4 and BAT 6, glycerol conversion was higher,
and so was propylene glycol yield. Since propylene glycol yield difference was more pronounced
relative to glycerol conversion, selectivity toward propylene glycol was lower at the higher
catalyst loading. Given that our research focused mainly on boosting reaction selectivity, a lower
catalyst loading was adopted. In the subsequent batch reaction studies, catalyst loading was
always 0.5 grams per 100 ml feedstock. To better understand the kinetic effect of catalyst
loading, reaction rate was calculated for three reactions as following:
Microsoft Excel was used to fit a trend line for all glycerol concentration data derived
from HPLC analysis. Linear or exponential correlations usually work well in our study.
Differentiation of this trend line at time equals zero allowed initial reaction rates to be calculated.
Finally, the units of reaction rate were converted from mol/l/hr to mol/hr/g catalyst. Since data
from three experiments are scattered, uncertainty will arise when initial reaction rate is calculated
with data points at the early stage of reaction. Several fitting options were tried, and results are
listed in Table 3-3. Initial reaction rate is relatively close for all three loadings.
Table 3-3. Initial reaction rates with various catalyst loadings
Run Catalyst loading
per 100 ml solution (g)
Low initial rate (mol/g cata./hr)
High initial rate (mol/g cata./hr)
BAT 4 1.0 0.0228 0.0660
BAT 6 0.75 0.0256 0.0760
BAT 8 0.5 0.0276 0.0514

22
3.5. Mass Transfer Analysis
As a matter of fact, BAT 6 boasts one of the highest glycerol conversions of all the batch
reactions, and therefore mass transfer analysis was done for glycerol and hydrogen in this
experiment to determine if internal diffusion limits reaction rate. The Weisz-Prater modulus was
calculated for both species with the following formula:
' 2( )A cWP
e As
r obs RC
D C
(3-1)
where r’A(obs) stands for observed actual reaction rate, ρc for catalyst dry density, R for catalyst
particle radius, De for diffusivity, and CAS for the reactant concentration on the catalyst particle
external surface. A spreadsheet was created according to this formula and the computation shows
the Weisz-Prater modulus for glycerol and hydrogen is significantly less than one, which means
that the reaction is not mass transfer limited. Calculation results are listed in Table 3-4.
Table 3-4. Weisz-Prater calculation results
Compound CWP Glycerol 4.7E-2
Hydrogen 1.8E-4
3.6. Effect of Reaction Temperature (BAT 12 and BAT 13)
BAT 12 (200°C, 1500 psi, 0.11M KOH, 0.5 g Re/Ni/C, 100 ml feedstock, and 1.0 M
initial glycerol solution) and BAT 13 (220°C, 1500 psi, 0.11M KOH, 0.5 g Re/Ni/C, 100 ml
feedstock, and 1.0 M initial glycerol solution) were done to test the effect of reaction temperature
23
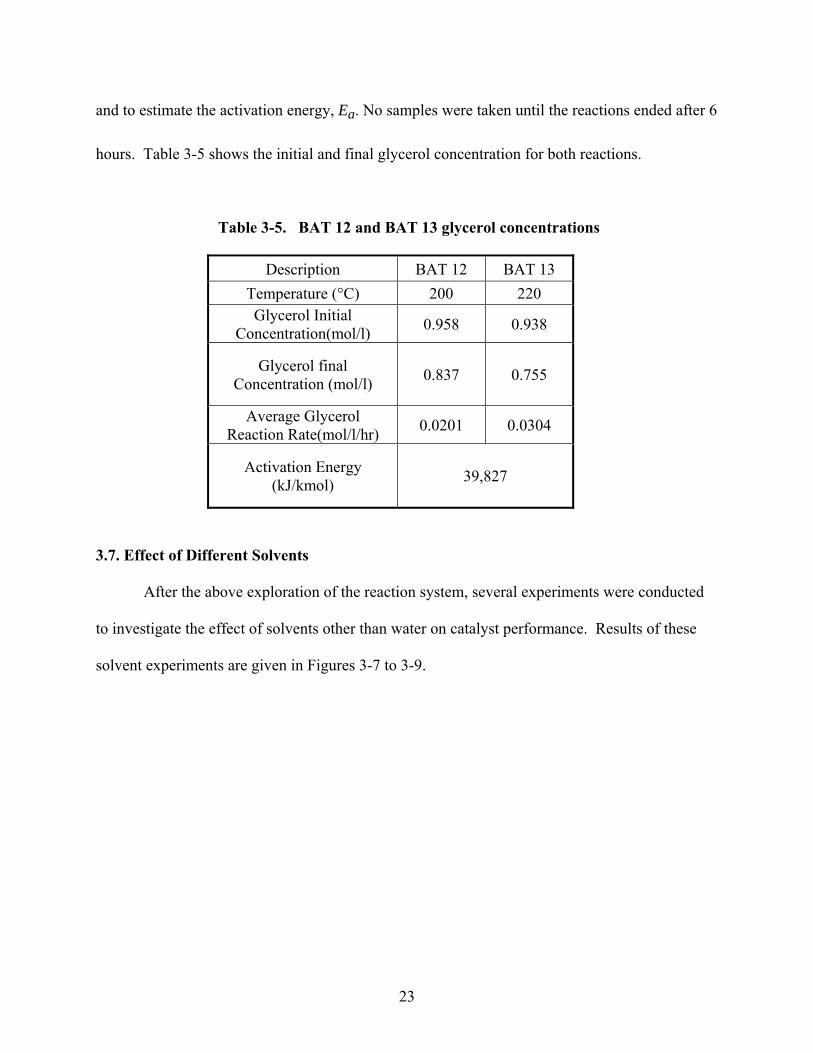
and to estimate the activation energy, Ea. No samples were taken until the reactions ended after 6
hours. Table 3-5 shows the initial and final glycerol concentration for both reactions.
Table 3-5. BAT 12 and BAT 13 glycerol concentrations
Description BAT 12 BAT 13
Temperature (°C) 200 220 Glycerol Initial
Concentration(mol/l) 0.958 0.938
Glycerol final Concentration (mol/l)
0.837 0.755
Average Glycerol Reaction Rate(mol/l/hr)
0.0201 0.0304
Activation Energy (kJ/kmol)
39,827
3.7. Effect of Different Solvents
After the above exploration of the reaction system, several experiments were conducted
to investigate the effect of solvents other than water on catalyst performance. Results of these
solvent experiments are given in Figures 3-7 to 3-9.

24
0
10
20
30
40
50
60
0 50 100 150 200 250 300 350Time(min)
Co
nve
rsio
n(%
)
BAT 15: EthanolBAT 16: n-PrOHBAT 18: i-PrOHBAT 19: Water
Figure 3-7. Effect of solvents on glycerol conversion (200°C, 1000 psi, 1.0 M glycerol initial concentration, 0.11M KOH, 0.25 g Re/Ni/C, 50 ml feedstock).
0
2
4
6
8
10
12
14
16
18
20
0 50 100 150 200 250 300 350Time(min)
Yie
ld(%
)
BAT 15: Ethanol
BAT 16: n-PrOH
BAT 18: i-PrOH
BAT 19: Water
Figure 3-8. Effect of solvents on propylene glycol yield (200°C, 1000 psi, 1.0 M glycerol initial concentration, 0.11M KOH, 0.25 g Re/Ni/C, 50 ml feedstock).

25
0
10
20
30
40
50
60
70
80
90
100
0 50 100 150 200 250 300 350
Time(min)
Sel
ecti
vity
(%)
BAT 15: Ethanol
BAT 16: n-PrOH
BAT 18: i-PrOH
BAT 19: Water
Figure 3-9. Effect of solvents on propylene glycol selectivity (200°C, 1000 psi, 1.0 M
glycerol initial concentration, 0.11M KOH, 0.25 g Re/Ni/C, 50 ml feedstock).
As the figures show, organic solvents boost glycerol conversion, propylene glycol yield,
and selectivity towards propylene glycol relative to water. Reaction rates were calculated for
each reaction, and results are listed in Table 3-6 along with hydrogen solubility at 25°C and 1000
psi.40
Table 3-6. Initial reaction rates with different solvents
Solvent Ethanol 1-Propanol 2-Propanol Water
Initial rate (mol/g. cata/hr)
0.0237 0.0183 0.0036 0.0069
Solubility ( ml STP/g
solvent) 5.88 N/A 4.81 1.22
26
Neither solvent vapor pressure nor hydrogen solubility exhibits a defining correlation
between solvent and reaction kinetics. Group member Dr. Simona Marincean did a similar series
of experiments, and also could not correlate solvent properties with kinetics.
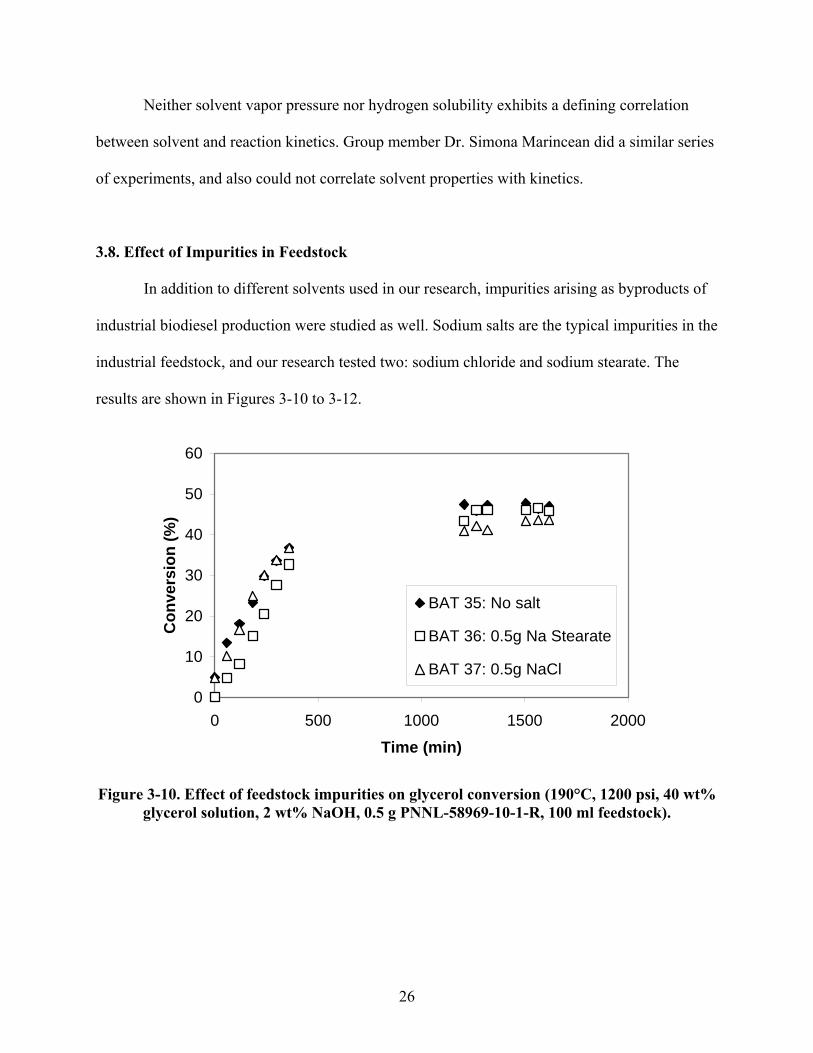
3.8. Effect of Impurities in Feedstock
In addition to different solvents used in our research, impurities arising as byproducts of
industrial biodiesel production were studied as well. Sodium salts are the typical impurities in the
industrial feedstock, and our research tested two: sodium chloride and sodium stearate. The
results are shown in Figures 3-10 to 3-12.
0
10
20
30
40
50
60
0 500 1000 1500 2000
Time (min)
Co
nve
rsio
n (
%)
BAT 35: No salt
BAT 36: 0.5g Na Stearate
BAT 37: 0.5g NaCl
Figure 3-10. Effect of feedstock impurities on glycerol conversion (190°C, 1200 psi, 40 wt% glycerol solution, 2 wt% NaOH, 0.5 g PNNL-58969-10-1-R, 100 ml feedstock).

27
0
5
10
15
20
25
30
35
0 500 1000 1500 2000Time (min)
Yie
ld (
%)
BAT 35: No salt
BAT 36: 0.5g Na Stearate
BAT 37: 0.5g NaCl
Figure 3-11. Effect of feedstock impurities on propylene glycol yield (190°C, 1200 psi, 40 wt% glycerol solution, 2 wt% NaOH, 0.5 g PNNL-58969-10-1-R, 100 ml feedstock).
0
20
40
60
80
100
120
0 500 1000 1500 2000
Time (min)
Sel
ecti
vity
(%
)
BAT 35: No salt
BAT 36: 0.5g Na Stearate
BAT 37: 0.5g NaCl
Figure 3-12. Effect of feedstock impurities on selectivity toward propylene glycol (190°C, 1200 psi, 40 wt% glycerol solution, 2 wt% NaOH, 0.5 g PNNL-58969-10-
1-R, 100 ml feedstock).

28
The three experiments show similar conversion, yield, and selectivity, despite the
addition of the impurities NaCl and Na stearate. These salts are usually present in the feedstock
during industrial production and possibly poison the catalyst. BAT 35 through BAT 37 show the
presence of impurities does not impose a serious danger to the catalyst and reaction.
3.9. Catalyst Specific Kinetic Study
The third catalyst tested in the batch reactor was PNNL-59260-33E. This catalyst was
also the first catalyst studied in the trickle bed reactor. In order to get the information about
reaction activation energy and preexponential factor in the Arrhenius equation, reactions were
done at three different temperatures: 160°C, 175°C, and 190°C at the pressure of 1200 psi in a 40
wt% glycerol and 2.1 wt% NaOH solution. No reaction was detected with HPLC for BAT 48,
which was carried out at 160°C. Figures 3-13 and 3-14 show glycerol conversion and propylene
glycol yield versus time. Glycerol conversion is very low due to the low activity of 59260-33E
catalyst. At this narrow and small range of glycerol concentration, conversion is also quite
scattered between 1% and 6%, which produces fluctuation for the selectivity toward propylene
glycol. The overall carbon balance, however, is good.

29
0.0
1.0
2.0
3.0
4.0
5.0
6.0
7.0
0 100 200 300 400
Time (min)
Co
nve
rsio
n (
%)
BAT 47: 175C
BAT 46: 190C
Figure 3-13. Glycerol conversions with catalyst 59260-33E at different temperatures.
0.0
0.5
1.0
1.5
2.0
2.5
3.0
0 100 200 300 400
Time (min)
Yie
ld (
%)
BAT 47: 175C
BAT 46: 190C
Figure 3-14. Propylene glycol yield versus time at different temperatures.

30
From Figure 3-14, reaction activation energy can be calculated based on propylene glycol
concentration relative to time. This value is 99,064 kJ/kmol. Reaction rates were calculated for
these two catalysts and listed in Table 3-7.
Table 3-7. Reaction rates of different catalysts
Catalyst 58969-10-1-R 59260-33E Reaction rate(mol/
m2 metallic surface
area/hr) 0.2103 0.2915
Both PNNL catalysts give an excellent carbon balance, and PNNL-58969-10-1-R used in
BAT 35 shows better conversion and yield. This difference is due to the metal constituents’
molar ratio in the catalysts. This information is crucial, as feedback, to optimize catalyst
preparation and process design in the future.

31
Chapter 4 Experiments in Continuous Trickle Bed Reactor
The trickle bed reactor is one of the most commonly used reactors for hydrogenolysis on
the manufacturing scale. In order to scale up catalysts and processes, a pilot scale trickle bed
reactor was built in our research facilities, and catalysts were packed and tested to study the
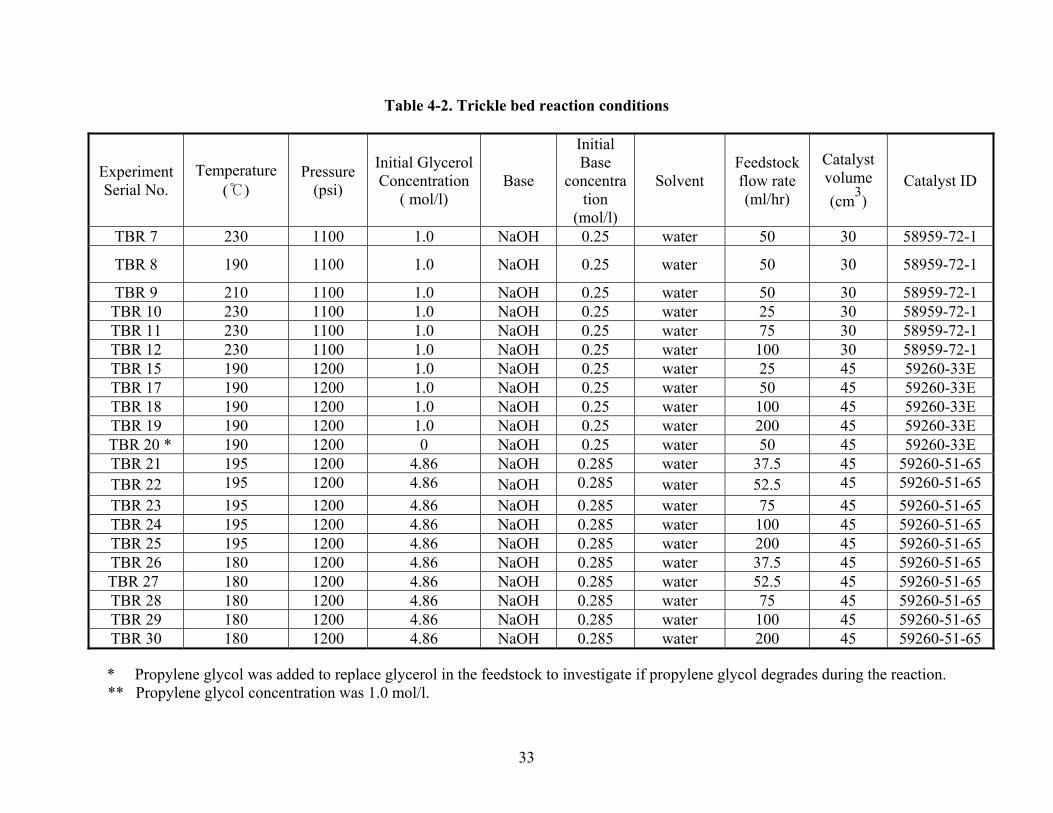
effects of conditions and hydrodynamics on glycerol hydrogenolysis rate. Three catalysts were
tested in the trickle bed reactor: reaction conditions are summarized in Table 4-2 on following
page.
4.1. Reaction Mass Conservation
Liquid feedstock flow rate was controlled by a HPLC pump and could be varied, based
on the experiment conditions desired. Gas flow rate was monitored by an electronic mass flow
controller and was also variable. During start up and between sample collections, reactor effluent
was collected to purge the product collection system. At steady state, samples were collected
every 30 to 60 minutes and analyzed via HPLC using an external standard method. Before each
sample, effluent was collected in a sample vial for four minutes to purge the sample tank. Then
the sample was collected in the sample tank for five minutes before being transferred to the vial.
All the samples were diluted with the mobile phase before HPLC analysis. After the sample
collection was complete, the continuous liquid phase product was again directed to a collection
tank. At the end of the experiment, the weights of the collection tank, purge effluent, and
samples were measured, recorded, and compared with the actual quantity of feed solution
consumed. Table 4-1 shows that the overall mass conservation during reaction was good. Water
(150 g) was loaded into the hydrogen saturation tank each time before reaction and was

32
recovered and its mass measured at the end of the experiment (Table 4-1, water recovered).
Table 4-1 shows that water loss was within a very reasonable scope of acceptance, and its
influence on the sample concentration was negligible.
Table 4-1. Mass balance of TBR 7, TBR 8, and TBR 9
Exp. S/N
Collection tank
recovery (g)
Mass of Samples
(g)
Mass of sample purge
(g)
Total recovery
(g)
Feed Consumpti
on (g)
Water Recovered
(g)
TBR 7 307.8 57.3 18.6 383.7 382.7 142.0
TBR 8 441.7 52.9 20.7 515.3 546.8 134.3
TBR 9 465.5 52.3 24.5 542.3 529.2 142.3
33
Table 4-2. Trickle bed reaction conditions
Experiment Serial No.
Temperature (℃)
Pressure (psi)
Initial Glycerol Concentration
( mol/l) Base
Initial Base
concentration
(mol/l)
Solvent Feedstock flow rate (ml/hr)
Catalyst volume
(cm3)
Catalyst ID
TBR 7 230 1100 1.0 NaOH 0.25 water 50 30 58959-72-1
TBR 8 190 1100 1.0 NaOH 0.25 water 50 30 58959-72-1
TBR 9 210 1100 1.0 NaOH 0.25 water 50 30 58959-72-1 TBR 10 230 1100 1.0 NaOH 0.25 water 25 30 58959-72-1 TBR 11 230 1100 1.0 NaOH 0.25 water 75 30 58959-72-1 TBR 12 230 1100 1.0 NaOH 0.25 water 100 30 58959-72-1 TBR 15 190 1200 1.0 NaOH 0.25 water 25 45 59260-33E TBR 17 190 1200 1.0 NaOH 0.25 water 50 45 59260-33E TBR 18 190 1200 1.0 NaOH 0.25 water 100 45 59260-33E TBR 19 190 1200 1.0 NaOH 0.25 water 200 45 59260-33E
TBR 20 * 190 1200 0 NaOH 0.25 water 50 45 59260-33E TBR 21 195 1200 4.86 NaOH 0.285 water 37.5 45 59260-51-65 TBR 22 195 1200 4.86 NaOH 0.285 water 52.5 45 59260-51-65
TBR 23 195 1200 4.86 NaOH 0.285 water 75 45 59260-51-65 TBR 24 195 1200 4.86 NaOH 0.285 water 100 45 59260-51-65 TBR 25 195 1200 4.86 NaOH 0.285 water 200 45 59260-51-65 TBR 26 180 1200 4.86 NaOH 0.285 water 37.5 45 59260-51-65
TBR 27 180 1200 4.86 NaOH 0.285 water 52.5 45 59260-51-65 TBR 28 180 1200 4.86 NaOH 0.285 water 75 45 59260-51-65 TBR 29 180 1200 4.86 NaOH 0.285 water 100 45 59260-51-65 TBR 30 180 1200 4.86 NaOH 0.285 water 200 45 59260-51-65
* Propylene glycol was added to replace glycerol in the feedstock to investigate if propylene glycol degrades during the reaction.
** Propylene glycol concentration was 1.0 mol/l.

34
4.2. Catalyst Specific Kinetic Study
4.2.1. PNNL 58959-72-1 Catalyst
For catalyst PNNL-58959-72-1, reaction temperature and liquid feedstock pumping rate
were varied to test their effects on the reaction system. TBR 7 and TBR 9 were done at 230°C
and 210°C, respectively, with the same pressure (1100 psi), pumping rate (50 ml/hr), feedstock
(1.0 M glycerol and 0.25M NaOH), and molar ratio (hydrogen: glycerol = 5:1). Figures 4-1
through 4-3 show the glycerol conversion, propylene glycol yield, and selectivity toward
propylene glycol versus time during the course of the reactions.
Higher temperature boosts glycerol conversion and propylene glycol yield. Selectivity
toward propylene glycol is modestly higher at 230°C in TBR 7. Also, Figure 4-4 gives the
carbon balance during reaction; experiments always reclaim more than 90% of the carbon from
the reaction system at steady state. Based on the steady state conversion, average reaction rate in
the trickle bed for both temperatures could be calculated, and the results are listed in Table 4-3.
Table 4-3. Glycerol consumption rate in TBR 7 and TBR 9
Run Temperature (°C) Reaction rate
(mol/hr/g catalyst)
TBR 7 230 5.727E-4
TBR 9 210 3.783E-4

35
0
10
20
30
40
50
60
70
80
90
100
0 200 400 600 800Time (min)
Co
nve
rsio
n (
%)
TBR 7: 230C
TBR 9: 210C
Figure 4-1. Effect of temperature on glycerol conversion in trickle bed reactor.
0
2
4
6
8
10
12
14
0 100 200 300 400 500
Time(min)
PG
Yie
ld (
%)
TBR 7: 230C
TBR 9: 210C
Figure 4-2. Effect of temperature on propylene glycol yield in trickle bed reactor.

36
0
10
20
30
40
50
60
70
0 100 200 300 400 500
Time (min)
PG
Sel
ecti
vity
(%)
TBR 7: 230C
TBR 9: 210C
Figure 4-3. Effect of temperature on selectivity toward propylene glycol in trickle bed reactor.
0
10
20
30
40
50
60
70
80
90
100
0 100 200 300 400 500Time (min)
C B
alan
ce (
%)
TBR 7: 230C
TBR 9: 210C
Figure 4-4. Carbon balance versus time in trickle bed reactor.
To test the effect of partial wetting of catalyst particles, the liquid feed rate was changed
from 25 ml/hr to 100 ml/hr in TBR 7 to TBR 12, with all other conditions being the same. In

37
addition to reducing the residence time of liquid in the trickle bed reactor, a higher liquid feed
rate will make catalyst particles more fully wetted and limit hydrogen access to the catalyst
surface. On the other hand, a slower feedstock flow rate will make catalyst particles partially
wetted, where three phase mass transfer will be carried out. Since the reaction rate is not
hydrogen limited inside the catalyst particles (given Weisz-Prater modulus in Table 4-4), a
slower flow rate will boost glycerol conversion and propylene glycol yield. This is observed in
Figures 4-5 to 4-7, where the results of these reactions are presented.
In case of a higher flow rate in the trickle bed reactor where catalyst is fully wetted, the
comparison can be made with the batch reactor where catalyst is also fully immersed and
therefore wetted. At this point, only PNNL 59260-33E was used in both reactors but conditions
were different (initial glycerol concentration). In Part III of this dissertation, we will discuss the
parallel experiments with the identical reaction conditions for this investigation.
At the steady state for all four experiments, more than 90% carbon balance closure was
achieved. Not much reaction happened at the higher flow rate (100 ml/hr in TBR 12). Average
reaction rates in the trickle bed, in terms of glycerol consumption, were calculated and are listed
in Table 4-4 along with Weisz-Prater modulus.

38
Table 4-4. Reaction rate for different feed flow rates
Run TBR 10 TBR 7 TBR 11 TBR 12 Flow
rate(ml/hr) 25 50 75 100
Glycerol W-P modulus
2.90E-3 5.79E-3 8.69E-3 1.16E-2
Hydrogen W-P modulus
1.12E-2 2.23E-2 3.35E-2 4.46E-2
Average reaction rate
in bed (mol/hr/g catalyst)
4.432E-4 5.727E-4 5.735E-4 4.632E-4
The values used to calculate the Weisz-Prater modulus at reaction conditions are as follows:
Hydrogen Diffusivity De, H2=5.50 × 10 -8 m2
/sec
Glycerol Diffusivity De, GO=1.27 × 10 -8 m2
/sec
Hydrogen concentration CH2=6.00 × 10 -2 kmol/m
3
Effective particle radius R=2.00 × 10 -4 m
Catalyst density ρc=1.40 × 10 3 kg/m
3

39
0
20
40
60
80
100
0 100 200 300 400 500
Time (min)
Co
nve
rsio
n (
%)
TBR 7: 50 ml/hr
TBR 10: 25 ml/hr
TBR 11: 75ml/hr
TBR 12: 100 ml/hr
Figure 4-5. Effect of feed flow rate on glycerol conversion with catalyst 58959-72-1 (230°C, 1100 psi, 1.0 M glycerol, 0.25M NaOH, 30 ml catalyst).
0
2
4
6
8
10
12
14
16
18
20
0 100 200 300 400 500
Time (min)
PG
Yie
ld (
%)
TBR 7: 50 ml/hr
TBR 10: 25 ml/hr
TBR 11: 75 ml/hr
TBR 12: 100 ml/hr
Figure 4-6. Effect of feed flow rate on propylene glycol yield with catalyst 58959-72-1 (230°C, 1100 psi, 1.0 M glycerol, 0.25M NaOH, 30 ml catalyst).

40
0
10
20
30
40
50
60
70
80
90
100
0 100 200 300 400 500 600Time (min)
PG
Sel
ecti
vity
(%
)
TBR 7: 50ml/hr
TBR 10: 25ml/hr
TBR 11: 75ml/hr
TBR 12: 100ml/hr
Figure 4-7. Effect of feed flow rate on selectivity toward propylene glycol with catalyst 58959-72-1 (230°C, 1100 psi, 1.0 M glycerol, 0.25M NaOH, 30 ml catalyst).
4.2.2. PNNL 59260-33E Catalyst
For the first series of experiments run in the trickle bed (catalyst PNNL-58959-72-1),
performance was reasonably good, and results were indicative of catalyst reactivity. However,
improvement w needed for glycerol conversion and propylene glycol yield. Therefore, the
second series of experiments was carried out with catalyst 59260-33E in the trickle bed with the
similar configuration. Catalyst reduction and operation procedure were the same.
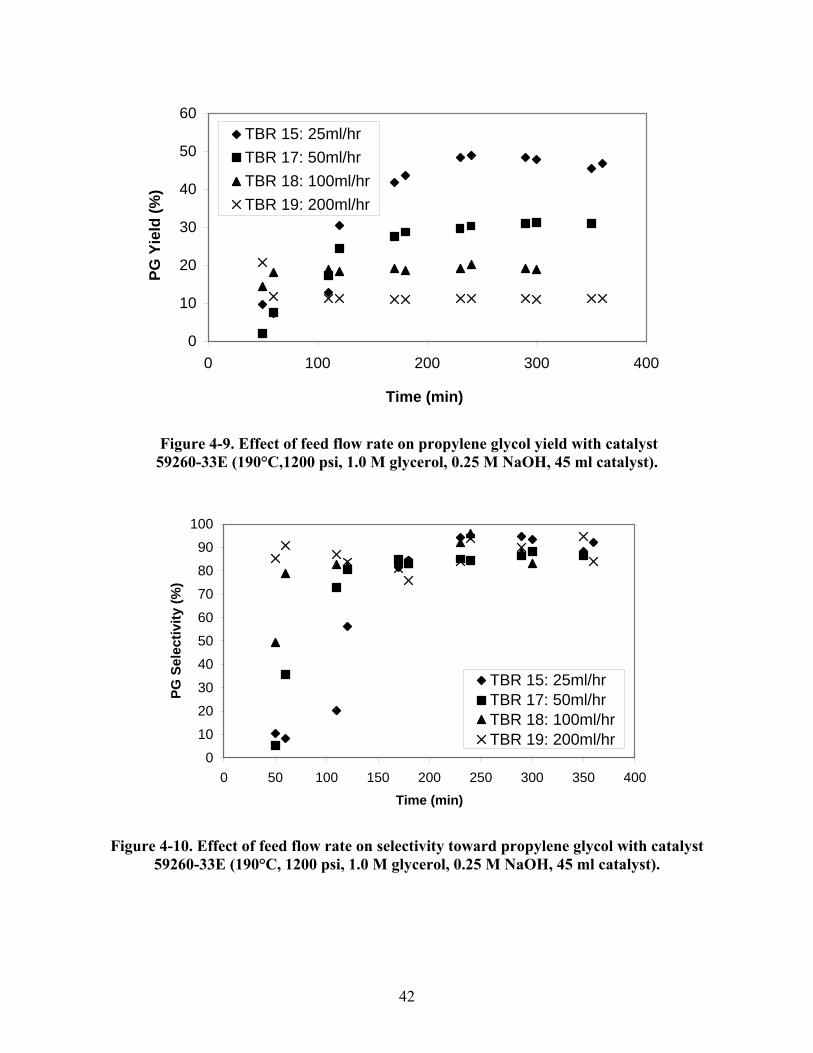
Liquid feedstock flow rate was tested at 25 ml/hr, 50 ml/hr, 100 ml/hr, and 200 ml/hr in
TBR 15 through 19 with all the other conditions the same: 1200 psi, 190°C, 1.0 M glycerol, 0.25
M NaOH, and hydrogen: glycerol mole ratio = 5:1. This catalyst (59260-33E) shows a higher
glycerol conversion than catalyst PNNL-58959-72-1 at the same flow rate. Yield and selectivity
toward propylene glycol are also boosted significantly. Conversion, yield, and selectivity are
constant once reaction system reaches the steady state, as shown in Figures 4-8 to 4-10. Carbon

41
balance is very good for all the experiments. Average glycerol consumption rate in the trickle
bed was calculated and is listed in Table 4-5.
Table 4-5. Reaction rate for different feed flow rates
Run TBR 15 TBR 17 TBR 18 TBR 19 Flow rate (ml/hr)
25 50 100 200
Average reaction rate (mol/gcat/hr)
6.609E-4 9.254E-4 1.173E-3 1.270E-3
0
10
20
30
40
50
60
70
80
90
100
0 100 200 300 400
Time(min)
Gly
cero
l C
on
vers
ion
(%)
TBR 15: 25ml/hrTBR 17: 50ml/hrTBR 18: 100ml/hrTBR 19: 200ml/hr
Figure 4-8. Effect of feed flow rate on glycerol conversion with catalyst 59260-33E (190°C, 1200 psi, 1.0 M glycerol, 0.25 M NaOH, 45 ml catalyst).
42
0
10
20
30
40
50
60
0 100 200 300 400
Time (min)
PG
Yie
ld (
%)
TBR 15: 25ml/hr
TBR 17: 50ml/hr
TBR 18: 100ml/hr
TBR 19: 200ml/hr
Figure 4-9. Effect of feed flow rate on propylene glycol yield with catalyst 59260-33E (190°C,1200 psi, 1.0 M glycerol, 0.25 M NaOH, 45 ml catalyst).
0
10
20
30
40
50
60
70
80
90
100
0 50 100 150 200 250 300 350 400
Time (min)
PG
Sel
ecti
vity
(%
)
TBR 15: 25ml/hrTBR 17: 50ml/hrTBR 18: 100ml/hrTBR 19: 200ml/hr
Figure 4-10. Effect of feed flow rate on selectivity toward propylene glycol with catalyst 59260-33E (190°C, 1200 psi, 1.0 M glycerol, 0.25 M NaOH, 45 ml catalyst).
43
4.2.3. PNNL 59260-51-65 Catalyst
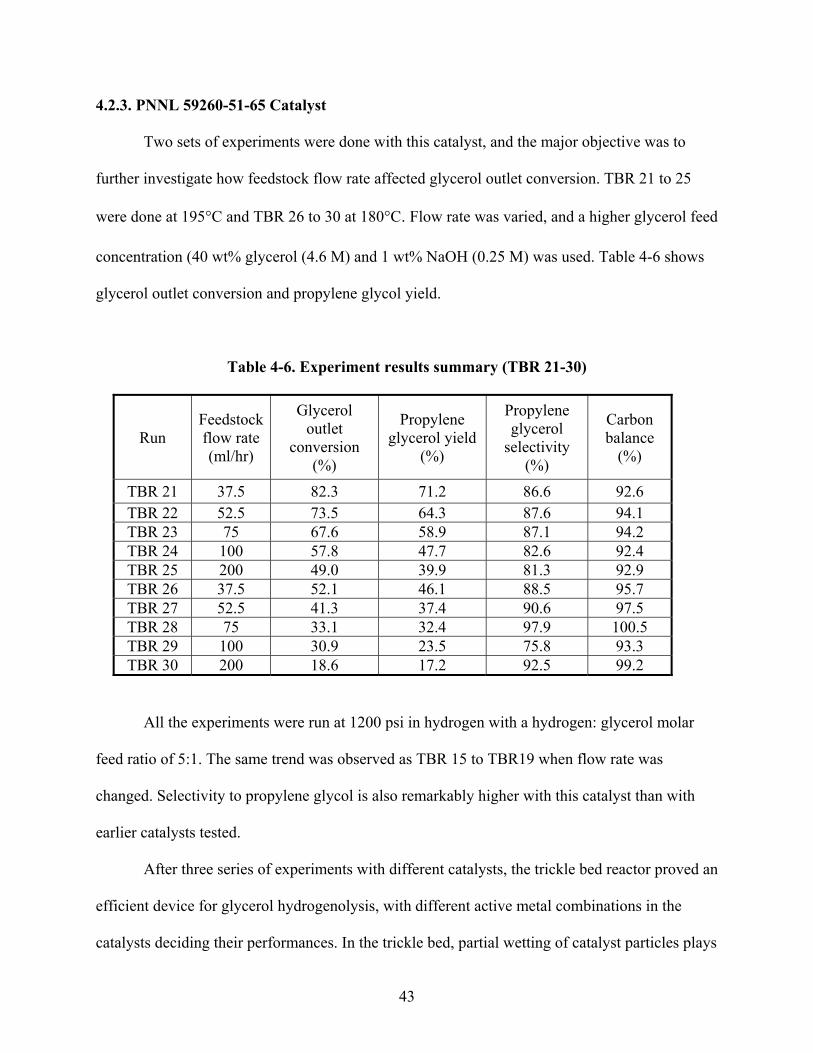
Two sets of experiments were done with this catalyst, and the major objective was to
further investigate how feedstock flow rate affected glycerol outlet conversion. TBR 21 to 25
were done at 195°C and TBR 26 to 30 at 180°C. Flow rate was varied, and a higher glycerol feed
concentration (40 wt% glycerol (4.6 M) and 1 wt% NaOH (0.25 M) was used. Table 4-6 shows
glycerol outlet conversion and propylene glycol yield.
Table 4-6. Experiment results summary (TBR 21-30)
Run Feedstock flow rate (ml/hr)
Glycerol outlet
conversion (%)
Propylene glycerol yield
(%)
Propylene glycerol
selectivity (%)
Carbon balance
(%)
TBR 21 37.5 82.3 71.2 86.6 92.6 TBR 22 52.5 73.5 64.3 87.6 94.1 TBR 23 75 67.6 58.9 87.1 94.2 TBR 24 100 57.8 47.7 82.6 92.4 TBR 25 200 49.0 39.9 81.3 92.9 TBR 26 37.5 52.1 46.1 88.5 95.7 TBR 27 52.5 41.3 37.4 90.6 97.5 TBR 28 75 33.1 32.4 97.9 100.5 TBR 29 100 30.9 23.5 75.8 93.3 TBR 30 200 18.6 17.2 92.5 99.2
All the experiments were run at 1200 psi in hydrogen with a hydrogen: glycerol molar
feed ratio of 5:1. The same trend was observed as TBR 15 to TBR19 when flow rate was
changed. Selectivity to propylene glycol is also remarkably higher with this catalyst than with
earlier catalysts tested.
After three series of experiments with different catalysts, the trickle bed reactor proved an
efficient device for glycerol hydrogenolysis, with different active metal combinations in the
catalysts deciding their performances. In the trickle bed, partial wetting of catalyst particles plays

44
an important role in interfacial mass transfer, which determines the quantity of active sites on the
catalyst surface accessible to hydrogen to make hydrogenolysis happen. Also, the trickle bed
geometry contributes to reaction kinetics; in the following chapter regarding modeling, some
scenarios involving various geometries are simulated and evaluated.

45
Part III Reaction Rate Modeling and Correlation
Chapter 5 Integral Model for Glycerol Hydrogenolysis in Trickle Bed
A detailed model of glycerol hydrogenolysis has been developed that includes a
mechanistically based kinetic rate expression, energy transport, mass transport through the liquid
phase, and partial wetting of the trickle bed. Optimal kinetic parameters based on all the data
collected, either at Pacific Northwest National laboratory or at MSU, from the trickle bed system
were determined via regression analysis. Model predictions agree with experimental data and
accurately predict trends in reactor performance with liquid flow rate, temperature, hydrogen
pressure, and base promoter concentration. The kinetic rate expression represents truly intrinsic
kinetics and is compared with batch reactor data to unify reactions in both environments. The
model is thus a useful tool for predicting laboratory reactor performance and for preliminary
design of commercial-scale trickle bed systems.
Due to a wrong stoichiometry used in the proposed catalytic mechanism, the intrinsic rate
expression to be discussed in this chapter was incorrectly derived but correction will be made in
Chapter 6. Since we have done the data analyses in their completeness with the current intrinsic
rate expression, we decided to present the results and discussion for demonstration purposes. In
Chapter 6, correct derivation and corresponding discussion will be carried out.
5.1. Kinetic Model
The establishment of the reactor model begins with development of
a kinetic rate expression based on the accepted reaction mechanism for glycerol hydrogenolysis.
In simplified form, the mechanism involves (i) dehydrogenolysis of glycerol to an adsorbed

46
glyceraldehyde analog (GA·S), (ii) rearrangement and dehydration of (GA• S) to a second
adsorbed intermediate (I·S) analogous to pyruvaldehyde or 2-hydroxyl acrolein, and (iii)
hydrogenolysis of the intermediate to propylene glycol (PG).
(5-1)
(5-2)
(5-3)
The rate expression for each step shown above can be written as follows:
(5-4)
(5-5)
(5-6)
Equating all three rates, invoking the site balance,
(5-7)
eliminating the concentrations of adsorbed intermediates, and dismissing two terms in the
denominator lead to the final expression:
(5-8)
Those two terms dismissed (CH2COH-, CH2CGO) are cross terms whose influence on
rate can adequately be described by CGOCOH- and C2
H2 terms. Thus, glycerol hydrogenolysis
1
1
2
2
3
2
2
k
k
k
k
k
GO S GA S H
GA S OH I S OH
I S H PG S
2
2
1 1 1
2 2 2
3 3
GO S GA S H
G A S I SOH OH
I S H
r k C C k C C
r k C C k C C
r k C C
total S G A S I SC C C C
2
22
f H GO OH
GO H HOH
k C C Cr
C C K C

47
reaction kinetics are described in terms of a preexponential factor k0, a reaction activation energy
Ea, and an adsorption constant KH that is independent of temperature. This rate expression
captures essential features of glycerol hydrogenolysis: partial order with respect to glycerol and
hydroxide, and negative order with respect to hydrogen at high pressures. The complete
derivation of the kinetic rate expression is given in Appendix A of this dissertation.
The rate expression derived for GO hydrogenolysis does not contain any information
about selectivity to products, even though historically methane, ethylene glycol, and lactic acid
are noted as byproducts of GO hydrogenolysis to PG. In this study, the catalyst showed
selectivities to PG between 88 and 95% of theoretical over the range of operating conditions,
with byproducts ethylene glycol (2-3%), lactic acid (1-3%), and alcohols (methanol, ethanol,
propanol) (1.5-3.5%) consuming the remainder of GO. To include formation of these byproducts
explicitly in this model would require an additional rate expression for each species; such
additional complexity is not warranted because byproduct yields are relatively constant and it
would be extremely difficult to obtain distinct rate expressions for byproduct formation from
solely the outlet concentrations of those species.
5.2. Reactor Model
The trickle bed model for glycerol hydrogenolysis is developed for steady state operation
by assuming one-dimensional plug flow and using the glycerol molar balance and the reactor
energy balance. The molar balance for glycerol is given by
(5-9)
GOG
dCR
d

48
where τ is defined as reactor volume divided by liquid flow rate.
For GO hydrogenolysis in the trickle bed, it is not necessary to write a molar balance
for the gas-phase. The significant molar excess of hydrogen used in reactions (5:1 H2:GO) and
the formation of negligible quantities of gas-phase products (less than 1% of GO is converted to
methane) means that the gas phase is essentially composed of hydrogen and water at its vapor
pressure over the reacting solution. Thus, gas composition does not change down the length of
the trickle bed. Further, the high gas-phase pressure (3-12 MPa) results in very small gas
superficial velocities through the reactor (< 10 cm/min) and thus low pressure drop (< 10 kPa),
so gas-phase has essentially no influence on liquid flow in the trickle bed.
The energy balance includes terms for heat generation by reaction and energy removal
by the coolant surrounding the reactor.
(5-10)
The overall heat transfer coefficient (Uo) between the catalyst bed and coolant was taken as 100
J/m2/sec/K;
41 varying this value by ±20% led to larger variations between predicted and
experimental temperature profiles in the trickle bed, so this value was used for all simulations.
The jacket temperature (Tc) used in the reactor model was taken as the recirculating oil bath set
point temperature.
It is worth noting that temperature changes in the trickle bed should be dampened by the
phase equilibrium between the liquid and gas phases. Energy liberated by reaction raises the
liquid phase temperature, but that rise in temperature is offset by the corresponding increase in
0( ) 2( )( ) ( )
pR G c
d C T UH R T T
d R

49
water vapor pressure which forces the energy liberated in reaction to produce more water vapor
to re-establish equilibrium. Thus, for a constant water mole fraction in the liquid phase and
negligible pressure drop in the reactor, the reactor temperature should be approximately constant.
5.3. Mass Transfer
In order to calculate the hydrogen concentration at the catalyst particle surface (CH2, S),
the concentration gradient for each compound in the steady state, three-phase reactor system is
defined as shown in Figure 5-1. The global reaction rate RG is a summation of reaction rates
occurring in both wetted and unwetted factions of the trickle bed (Eq. 5-11 below). This
approach is taken because liquid velocities in the reactor are low under our operating conditions,
and the bed is only partially wetted. In the wetted fraction, mass transport resistances across the
liquid film surrounding the catalyst particles must be accounted for (Figure 5-1); hence, the rate
expression must include hydrogen concentration expressed as CH2,S. In the unwetted fraction,
there is no liquid layer surrounding the catalyst particle, and thus hydrogen gas has direct access
to the catalyst surface. Its concentration can be taken as the gas phase equivalent, C*
H2. It is
assumed that the liquid in both wetted and unwetted fractions is replenished continuously.
(5-11)
The hydrogenolysis reaction is hydrogen limited in the catalyst particles, because of the
low solubility of hydrogen in water (~0.05 M) in comparison to the glycerol concentration used
2 2 2 2
2 2
*,
2 *2,
(1 ) (1 )(1 )H f H S GO H f H GOOH OH
G W B W BGO H GO HH S HOH OH
k C C C k C C CR
C C K C C C K C

50
(1.0 to 4.8 M). Therefore, a first order approximation is used for the effectiveness factor for
hydrogen intraparticle diffusion:
(5-12)
where
(5-13)
At the steady state in the wetted fraction of the bed, hydrogen flux across gas-liquid and
liquid-solid interfaces should equal hydrogen consumption rate in the catalyst. Therefore, the
following relationship can be established:
(5-14)
2tanh
H
226
p f
p H
d k
D
2 2 2 2 2 2
22
2
*, , , , ,
,
2,
( ) ( )
(1 )
GL H H H L SL H H L H S
f H S GO OHH B
GO H H SOH
k a C C k a C C
k C C C
C C K C

51
Figure 5-1. Steady state concentration profiles in the wetted fraction of the trickle bed reactor.
CH2, S can be solved by the following cubic equation, which is derived from Eq.5-14:
2 2 2 22 2 2 2
2 2 2 2
2 22 2
2 2
2 2
2 2
2 2 *, , ,3 2
, , ,, , , ,
, ,,
, ,
2 2 * 2,
, ,
*
1
GL H SL H H H GL H HH S GL H H H H S
GL H SL H SL H GL H
f GL H SL HH B f GO H SOH
GL H SL H
f GL H H GO OH
SL H GL H
k ak ak k k a CC k ak C C
k a k a k a k a
k k ak ak C C C
k a k a
k k a C C C
k a k a
2 2
*, 0f GL H H GO OH
k k aC C C
(5-15)
The mass transfer coefficients kGL,H2 and kLS,H2 were determined for the trickle bed
correlations by Goto and Smith:42
0.39 1/2
0.397.8 ReL L
GLp
D Sck a
d (5-16)

52
0.56 1/3
0.5645 ReL L
LSp
D Sck a
d (5-17)
where Sc stands for Schmidt number, Re for Reynolds number, D for hydrogen diffusivity, and
dp for catalyst particle diameter.
ReL L p
LL
U d
(5-18)
LL
LSc
D
(5-19)
The wetting efficiency of the trickle bed was correlated by Al-Dahhan et al.38 as follows:
1/9
1/3 1 [( / ) /1.104Re L
W LL
P Z g
Ga
(5-20)
where ReL L p
LL
U d
(5-18)
and 3 2 3
2 3(1 )
p L BL
L B
d gGa
(5-21)
All the other physical properties were taken from the literature 43
or were estimated from
existing correlations; values are given in Table 5-1.

53
Table 5-1. Physical properties used for trickle bed modeling
Description Unit Value
Particle size m 0.0008
Particle porosity 0.6
Particle wet density kg/m3 1400
Catalyst Dry Bulk Density kg/m
3 400
Bed depth m 0.273
Bed porosity - 0.5
Reactor radius m 0.006
Liquid viscosity kg/m/sec 0.00014
Liquid density kg/m3 1100
Gas viscosity kg/m/sec 1.38E-05
Glycerol liquid diffusivity m
2/sec 1.27E-08
Hydrogen liquid diffusivity m
2/sec 5.5E-08
Liquid surface tension kg/sec
2 0.0432
5.4. Solution Method and Kinetic Parameter Optimization
The mass and energy balance equations were numerically integrated over the reactor
length using Euler’s method in a program written in Microsoft Excel which is shown in
Appendix B. At each point along the integration, the surface hydrogen concentration CH2,S was
determined via the cubic equation shown in Eq. 5-15. All the concentrations and rates were then
calculated at that point, and the step to the subsequent point was taken.
The reactor model was applied to several sets of steady state trickle bed reactor runs
using different catalysts at widely varying conditions. For each set of data, the outlet glycerol
conversion was predicted in each experiment from the model, and then the kinetic parameters in
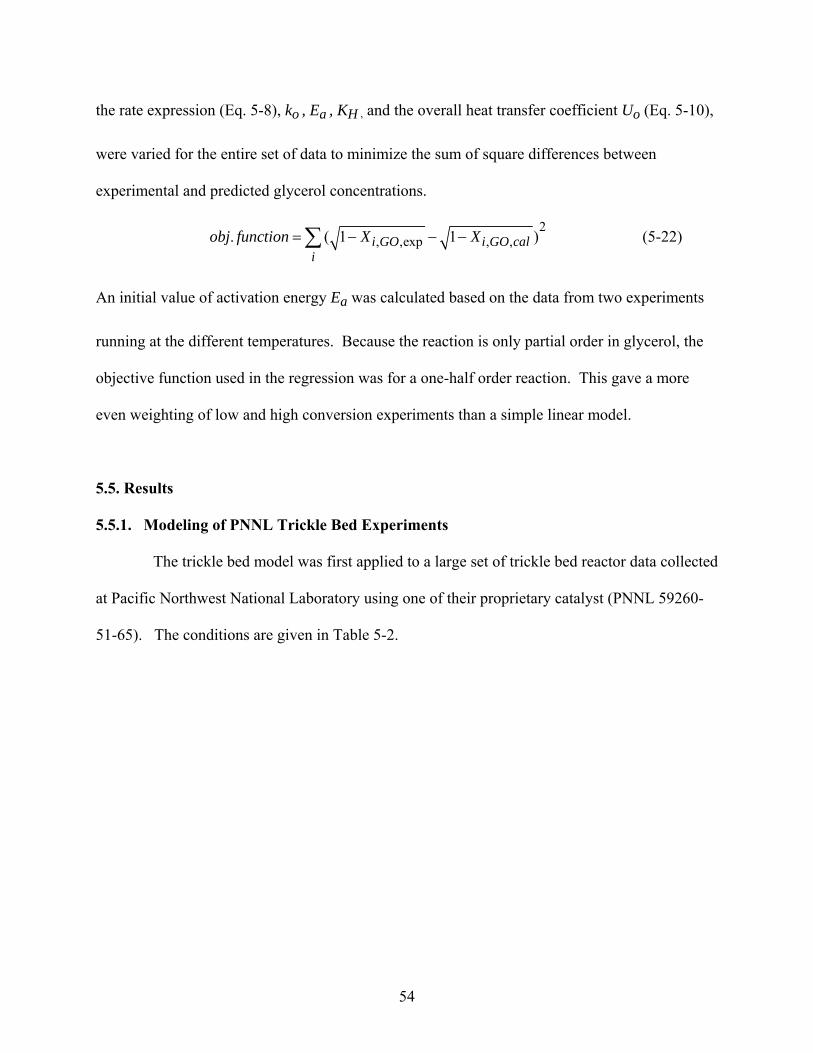
54
the rate expression (Eq. 5-8), ko , Ea , KH , and the overall heat transfer coefficient Uo (Eq. 5-10),
were varied for the entire set of data to minimize the sum of square differences between
experimental and predicted glycerol concentrations.
2
, ,exp , ,. ( 1 1 )i GO i GO cali
obj function X X (5-22)
An initial value of activation energy Ea was calculated based on the data from two experiments
running at the different temperatures. Because the reaction is only partial order in glycerol, the
objective function used in the regression was for a one-half order reaction. This gave a more
even weighting of low and high conversion experiments than a simple linear model.
5.5. Results
5.5.1. Modeling of PNNL Trickle Bed Experiments
The trickle bed model was first applied to a large set of trickle bed reactor data collected
at Pacific Northwest National Laboratory using one of their proprietary catalyst (PNNL 59260-
51-65). The conditions are given in Table 5-2.

55
Table 5-2. Summary of PNNL Trickle Bed Run Conditions and Results
Exp. #
Feed Inlet Temp.
(K)
Total Pressure
(MPa)
Feed flow rate
(ml/hr)
NaOH Conc. (M)
Experiment-al Glycerol Conversion
Predicted Glycerol
Conversion 1 468 8.27 50 0.58 0.90 0.92 2 464 8.27 50 0.58 0.95 0.95 3 467 8.27 50 0.28 0.81 0.78 4 464 8.27 50 0.14 0.69 0.54 5 475 8.27 50 0.14 0.83 0.74 6 453 8.27 50 0.14 0.46 0.39 7 463 8.27 35 0.14 0.79 0.70 8 463 8.27 25 0.14 0.86 0.84 9 473 8.27 35 0.14 0.87 0.82 10 473 8.27 35 0.14 0.89 0.88 11 453 8.27 50 0.28 0.65 0.56 12 475 8.27 50 0.28 0.94 0.94 13 463 8.27 35 0.28 0.89 0.91 14 463 8.27 25 0.28 0.94 0.98 15 453 8.27 35 0.28 0.75 0.71 16 473 8.27 35 0.28 0.96 0.99 17 453 8.27 25 0.28 0.79 0.86 18 473 8.27 25 0.28 0.98 1.00 19 463 8.27 35 0.28 0.91 0.92 20 463 11.03 35 0.28 0.88 0.88 21 463 5.52 35 0.28 0.91 0.93 22 463 2.76 35 0.28 0.64 0.54 23 463 13.79 35 0.28 0.82 0.85 24 468 13.79 35 0.28 0.91 0.92 25 468 8.27 35 0.28 0.96 0.97
The optimized values of the kinetic constants for the glycerol hydrogenolysis rate
expression (Eq. 5-8) are listed in Table 5-3. The predicted glycerol conversion was listed in the
final column of Table 5-2 to be compared with experiment measurement.

56
Table 5-3. Optimal kinetic parameters for rate expression (PNNL data based)
Description Unit Value
Pre exponential factor ko m3/kg catalyst /sec 8.99×10
8
Activation energy Ea kJ/kmol 86,000
Hydrogen coeff. KH - 425
Heat transfer coeff. Uo J/sec/m2/K 100
A comparison of experimental and predicted outlet glycerol concentrations over a wide
range of operating conditions is shown in Figures 5-2 and 5-3. It is seen that there is a good
agreement between predicted and experimental values over all conditions - a remarkable
outcome given that only the three kinetic constants (ko , Ea , and KH) are adjusted and all other
constants and coefficients governing hydrodynamics and mass/heat transfer in the model are
taken straight from literature or textbook correlations. For the optimized kinetic parameters, the
value of the object function in Eq. 5-22 is 0.10; in simplified terms, the average value of the
absolute difference between experimental and simulated outlet GO conversion is 0.042. Several
temperature profiles along the bed are given in Figure 5-4; again, the model predicts with good
accuracy the exotherm of about 10 K in the trickle bed reactor over the range of inlet
temperatures examined.
The model can also illustrate species concentration profiles in the trickle bed; Figure 5-5
gives predicted GO concentration profiles as a function of a) inlet temperature, b) liquid feed
flow rate, and c) feed base concentration at conditions that match those in the experiments
identified. Figure 5-6 compares the experimental and predicted GO conversion on total reactor
pressure; the sharp drop in conversion at the lowest pressure (2.76 MPa) is attributed to low

57
hydrogen partial pressure because water partial pressure at 463 K is 1.3 MPa, a significant
fraction of the total. The observed drop in GO conversion as pressure increases above ~6 MPa is
predicted by the mechanistically-based rate expression.
0
0.1
0.2
0.3
0.4
0.5
0.6
0.7
0.8
0.9
1
1 2 3 4 5 6 7 8 9 10 11 12 13 14 15 16 17 18 19 20 21 22 23 24 25
Experiment Serial Number
Gly
cero
l O
utl
et C
on
vers
ion
Experimental Estimated
Figure 5-2. Outlet glycerol simulated and experimental conversions.

58
0.3
0.4
0.5
0.6
0.7
0.8
0.9
1
0.3 0.4 0.5 0.6 0.7 0.8 0.9 1
Experimental GO Conversion
Pre
dic
ted
GO
Co
nve
rsio
n
Figure 5-3. Parity plot of experimental versus predicted GO conversion.

59
430
440
450
460
470
480
490
0 0.2 0.4 0.6 0.8 1
Fractional Reactor Length
Te
mp
era
ture
(K
)
Figure 5-4. Predicted vs. experimental temperature profiles in trickle bed. Inlet temperature: 453 K : (▬▬) – simulation, (◇) – experiment; 463 K: (- - -) – simulation, (□) – experiment; 473 K : (-·-·-) – simulation, (△) - experiment. Conditions: 8.27 MPa, liquid feed rate 35 ml/hr, 0.14 M NaOH.

60
0
0.5
1
1.5
2
2.5
3
3.5
4
4.5
5
0 0.2 0.4 0.6 0.8 1
Fractional Reactor Length
GO
Co
nce
ntr
atio
n (
kmo
l/m
3 )
Figure 5-5a. Simulated GO concentration profiles in trickle bed for different inlet temperatures. (---) – 453 K ; (- - -) – 463 K; (▬▬) – 473 K.
Conditions: 8.27 MPa, liquid feed rate 35 ml/hr, 0.28 M NaOH.
0
0.5
1
1.5
2
2.5
3
3.5
4
4.5
5
0 0.2 0.4 0.6 0.8 1
Fractional Reactor Length
GO
Co
nce
nra
tio
n (
kmo
l/m3)
Figure 5-5b. Simulated GO concentration profiles in trickle bed for different liquid
feed flow rates: (▬▬) – 50 ml/hr ; (- - -) – 35 ml/hr; (-·-·-) – 25 ml/hr . Conditions: 8.27 MPa, 463 K, 0.14 M NaOH.

61
0
0.5
1
1.5
2
2.5
3
3.5
4
4.5
5
0 0.2 0.4 0.6 0.8 1
Fractional Reactor Length
GO
Co
nce
ntr
atio
n (
km
ol/
m3 )
Figure 5-5c. Simulated GO concentration profiles in trickle bed at different NaOH
concentrations: (-·-·-) - 0.58 M; (- - -) - 0.28 M ; (▬▬) - 0.14 M . Conditions: 8.27 MPa, 464 K, liquid feed rate 50 ml/hr.
0.5
0.6
0.7
0.8
0.9
1
2 4 6 8 10 12 14
Pressure (MPa)
GO
Co
nv
ers
ion
Figure 5-6. Effect of total pressure on outlet GO conversion from trickle bed reactor. (▬▬) - simulation; (■) -experiment . Conditions: 463 K, liquid feed rate 35 ml/hr, 0.28 M NaOH.

62
5.5.2. Modeling of MSU Trickle Bed Experiments
Some data were also available from experiments run at MSU with low glycerol
conversion. Modeling was done on these data, too. Kinetic parameters were optimized for
glycerol conversion of TBR 15 through TBR 19 for catalyst PNNL-59260-33E, previously
described in Chapter 4, and the agreement between experiments and simulations was good.
These optimal kinetic parameters turned out different from those PNNL results due to different
catalyst and trickle bed reactor dimension. Table 5-4 shows all the values.
Table 5-4. Optimal kinetic parameter summary (MSU TBR15~19 based)
Description Unit Value
Pre exponential factor ko m3/kg catalyst /sec 8.99×10
8
Activation energy Ea kJ/kmol 87,300
Hydrogen coeff KH - 3,160
Heat transfer coeff. Uo J/sec/m2/K 100
Further, our modeling study extended to fit glycerol conversion data of TBR 20 through
TBR 30 where the same catalyst that was used in PNNL experiments (PNNL-59260-51-65) was
used, and optimal kinetic parameters were fitted, and optimal values are listed in Table 5-5.
Figure 5-7 shows the comparison between model simulation and experimental conversion. Our
model gives a reasonably good simulation for glycerol conversion over various reaction
conditions.
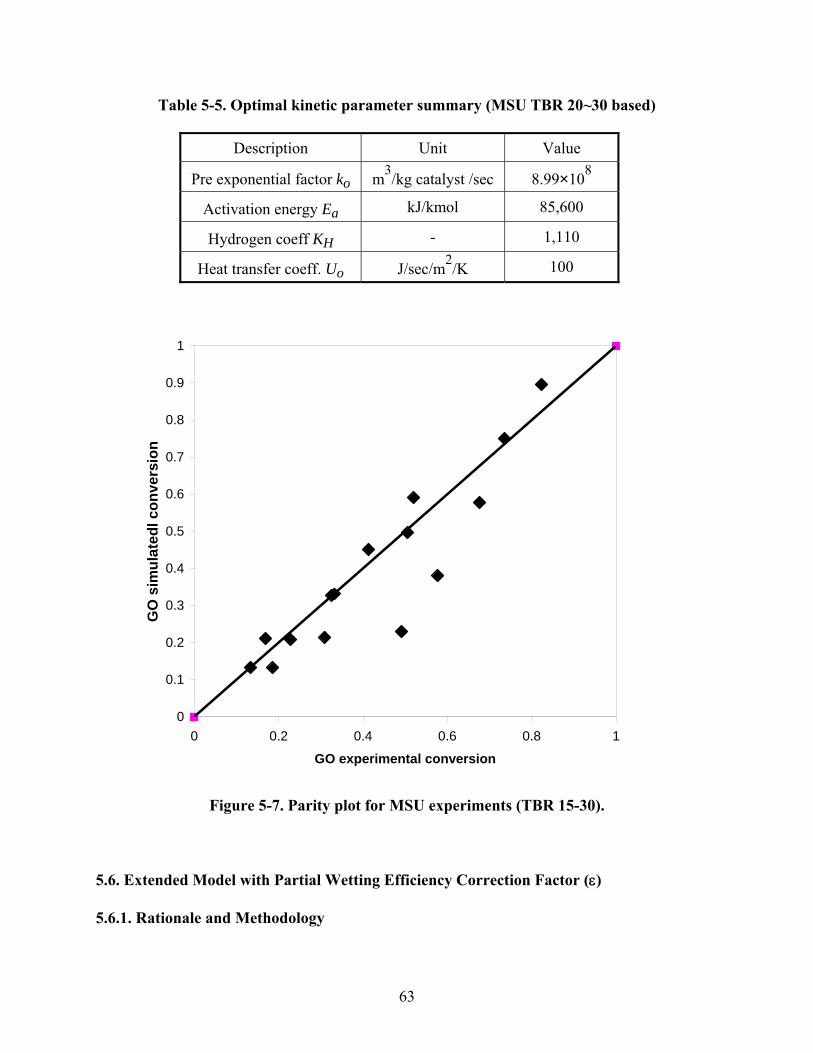
63
Table 5-5. Optimal kinetic parameter summary (MSU TBR 20~30 based)
Description Unit Value
Pre exponential factor ko m3/kg catalyst /sec 8.99×10
8
Activation energy Ea kJ/kmol 85,600
Hydrogen coeff KH - 1,110
Heat transfer coeff. Uo J/sec/m2/K 100
0
0.1
0.2
0.3
0.4
0.5
0.6
0.7
0.8
0.9
1
0 0.2 0.4 0.6 0.8 1
GO experimental conversion
GO
sim
ula
ted
l co
nve
rsio
n
Figure 5-7. Parity plot for MSU experiments (TBR 15-30).
5.6. Extended Model with Partial Wetting Efficiency Correction Factor ()
5.6.1. Rationale and Methodology

64
The trickle bed model assumes reaction rate be the combination of fully wetted rate and
unwetted rate, as shown in Eq. 5-11. In the unwetted rate term, catalyst is assumed to be
completely accessible by hydrogen, and the model predicts the outlet glycerol concentration
reasonably well. In order to better understand the effect of partial wetting, a partial wetting
efficiency correction factor ω was introduced to the unwetted part of the rate expression as
shown in Eq. 5-11-1 below. This factor allows us to better quantify the contribution of partial
wetted catalyst to the overall reaction rate.
(5-11-1)
Based on the optimal parameters (Ea , Uo , ko , and KH) from the previous simulation, the
correction factor ω was fitted manually to bring the predicted conversion from the model to the
value of the experimental conversion.
In some cases, the predicted conversion was lower than the actual glycerol outlet
conversion even though the largest possible correction factor (1) was applied. Therefore, the
preexponential factor ko had to be increased to make it possible that predicted conversion equals
the experimental conversion for correction factor values no greater than unity. Different values
were tried for ko, and maximum value seems to be 2.1 times as large as original optimal ko.
Beyond 2.1 ko, model crashes.
First, manual fitting of the correction factor was done for each experiment such that
experimental and predicted outlet conversions agree. Based on these values, some efforts were
made to correlate these values to operating conditions. This is a trial-and-error process, and tests
2 2 2 2
2 2
*,
2 *2,
(1 ) (1 )(1 )H f H S GO H f H GOOH OH
G W B W BGO H GO HH S HOH OH
k C C C k C C CR
C C K C C C K C

65
were done with different forms of equations (linear, logarithm, quadratic, etc.) and different
operating parameters such as base concentration (CNaOH) and liquid feed flow rate (m). With all
the formulae fitted by computer, correction factors for each experiment could be calculated and
put back in the model to get the prediction of glycerol outlet concentration. The best correlation
is the one with minimum error summation from the same objective function used in the previous
research.
5.6.2. Data Fitting Results
The values of the manually fitted correction factor ω are shown in the second sets of
columns of Table 5-6. These values of partial wetting correction factor ω are best correlated to
flow rate and base concentration:
ω =1000m0.430
CNaOH -0.235
(5-23)
where m is liquid feed flow rate (m3/sec) and CNaOH is inlet base concentration (kmol/m
3). The
insertion of the correction factor ω into Eq. 5-11 and the subsequent prediction of outlet GO
conversion from the model for the PNNL reactor data was done and is reported in the third set of
columns in Table 5-6. With the correlation factor ω included, the overall objective function
decreases from 0.100 to 0.052, and model’s prediction is much more accurate. It is difficult to
draw fundamental conclusions on partial wetting of the catalyst at this point; the partial wetting
model of Al-Dahhan provides a reasonable estimate but it is clear that additional dependency on
liquid flow rate comes into play in the current system.

66
Table 5-6. Partial wetting correction factor results
Base model Manually fitted Best correlation Correlation*
k0 = 8.99E+8 k0 = 1.89E+9 k0 = 1.89E+9 k0 = 1.89E+9 Run
XGO,exp XGO,cal Partial wetting
corr. XGO,cal
Partial wetting
corr. XGO,cal
Partial wetting corr.
XGO,cal
1 0.895 0.923 0.473 0.895 0.473 0.895 0.565 0.958
2 0.946 0.951 0.494 0.9445 0.473 0.930 0.565 0.981 3 0.812 0.776 0.546 0.8115 0.563 0.825 0.565 0.827 4 0.689 0.545 0.713 0.6895 0.662 0.658 0.565 0.594 5 0.834 0.740 0.655 0.834 0.662 0.838 0.565 0.774 6 0.459 0.390 0.597 0.459 0.662 0.494 0.565 0.442 7 0.788 0.704 0.614 0.788 0.568 0.757 0.485 0.692 8 0.863 0.840 0.534 0.863 0.492 0.834 0.419 0.774 9 0.870 0.823 0.592 0.870 0.568 0.856 0.485 0.800
10 0.894 0.876 0.550 0.894 0.568 0.905 0.485 0.851 11 0.649 0.556 0.600 0.649 0.563 0.620 0.565 0.622 12 0.938 0.942 0.519 0.938 0.563 0.960 0.565 0.961 13 0.892 0.911 0.476 0.892 0.483 0.897 0.485 0.899 14 0.942 0.980 0.399 0.942 0.418 0.954 0.4195 0.955 15 0.752 0.714 0.529 0.752 0.483 0.712 0.485 0.714 16 0.961 0.992 0.396 0.961 0.483 0.996 0.485 0.996 17 0.793 0.856 0.414 0.793 0.418 0.797 0.4195 0.798 18 0.980 0.999 0.311 0.980 0.418 0.999 0.4195 0.999 19 0.911 0.919 0.492 0.911 0.477 0.900 0.485 0.906 20 0.876 0.882 0.491 0.876 0.479 0.867 0.485 0.871 21 0.908 0.929 0.480 0.908 0.479 0.907 0.485 0.912 22 0.641 0.543 0.590 0.641 0.479 0.514 0.485 0.521 23 0.815 0.850 0.448 0.815 0.479 0.839 0.485 0.843 24 0.909 0.919 0.478 0.909 0.479 0.909 0.485 0.913 25 0.964 0.974 0.485 0.964 0.479 0.961 0.485 0.964
Error sum 0.1005 1.23E-5 0.052 0.112
* denotes that correction factor was calculated with Eq. 5-23-1.
Liquid feed flow rates play a more significant role in trickle bed wetting than any other
parameter. Therefore, the correction factor ω was also numerically fitted only to flow rate, so
Equation 5-23 can be rewritten as

67
ω=1359m0.430 (5-23-1)
The last two columns of Table 5-6 list the corrector factor and corresponding outlet glycerol
conversion. The value of the object function is 0.112, slightly worse than the original model and
much worse than the correlation with Equation 5-21. This shows the base concentration plays a
role in this correction factor, perhaps via changes in liquid viscosity or surface wetting that
depend on base concentration.
5.7. Examination of Simplified Models for Trickle Bed Reactors
Previous discussion regarding the trickle bed model took mass and energy transport and
reactor kinetics into account, and correction factor for partial wetting was introduced to better
understand partial wetting, but how can we validate these considerations? In order to answer this
question, examination of simplified models is necessary. The results from simplified models will
be compared with those from the model discussed in Section 5.5 applied to the PNNL reactor
data set in order to justify our work on modeling so far.
The trickle bed model incorporates several significant assumptions including a non-
isothermal catalyst bed, mechanistically-based intrinsic rate expression, multiple mass transfer
resistances, and partial wetting of the catalyst in the trickle bed. Here, we present simplifications
of the original model that examine each of these assumptions to determine if their inclusion in
the model is appropriate. The values of squared differences in outlet glycerol concentrations
between experiment and model in the original and simplified models are used as criteria for the
necessity of inclusion of each assumption in the model.

68
5.7.1. Isothermal Catalyst Bed
The reactor energy balance is eliminated for an isothermal catalyst bed, as temperature is
constant at the specified value. The glycerol molar balance was integrated via Euler’s method
for all experiments, and new optimized values of the kinetic parameters ko, KH, and Ea were
determined.
Table 5-7. Optimal parameters from isothermal catalyst bed assumption
Description Unit Value
Preexponential factor ko m3/kg catalyst /sec 1.08E+9
Activation energy Ea kJ/kmol 86,000
Hydrogen coeff. KH - 425
Heat transfer coeff. Uo J/sec/m2/K 100
With these optimal parameters, the value of the objective function (Eq. 5-22) for the
isothermal trickle bed is 0.094, essentially equivalent to 0.100 from original comprehensive
model. However, the observed temperature profile in the trickle bed cannot be represented by
the isothermal model, so the inclusion of the energy balance in the trickle bed simulation is
maintained.
It is entirely possible that the temperature gradient observed in reaction (Figure 5-4)
arises because of radial heat transfer limitations, which are not accounted for in the current
model. If this is true, then the isothermal model is a better representation of reality for GO
hydrogenolysis because of water vaporization dampening gradients as described earlier. In either
case, temperature effects do not play a large role in the trickle bed for GO hydrogenolysis.

69
5.7.2. Simplified Rate Expression
The mechanistically-based rate expression for GO hydrogenolysis (Eq. 5-8) includes two
terms in the denominator. Under some experimental conditions, the COH-CGO term is much
larger than KHCH22 at the reactor inlet, so the rate expression (Eq. 5-11) simplifies to the first
order dependence on hydrogen only (Eq. 5-24).
(5-24)
With all the other assumptions the same, the simplified rate expression was implemented,
and the trickle bed reactor balances were again integrated and kinetic parameters optimized. The
resulting optimized kinetic parameters are listed in Table 5-8. With the simplified rate
expression, the overall sum of squared differences (Eq. 5-22) is much larger (~3) than with the
original model (0.100). Thus, the simplified rate expression assuming first order hydrogen
dependence of rate does not predict trickle bed behavior as well as the rigorous rate expression
(Eq. 5-11).
Table 5-8. Optimal parameters for model with simplified rate expression.
Description Unit Simplified rate
expression Analytical rate
expression
Preexponential
factor ko m
3/kg catalyst
/sec 9.85E+7 1.15E+8
Activation energy Ea kJ/kmol 86,000 86,000
Hydrogen coeff. kH - - 425
Heat transfer coeff.
Uo J/sec/m
2/K 100 100
2 2 2 2*
,(1 ) (1 )(1 )G W B H f H S W B H f HR k C k C

70
5.7.3. Fully Wetted Catalyst Bed
The low liquid velocities used in experiments necessitate application of the partial
wetting correlation of Al-Dahhan.38
Here we examine the effect of wetting on glycerol outlet
conversion. First, the sensitivity of outlet GO conversion on fractional wetting was examined by
varying εw from 50% to 200% of the value calculated by Al-Dahhan. For outlet GO conversions
above 85%, varying the fraction wetted changed the outlet conversion by a maximum of 10%
(e.g. at a conversion of 85%, down to 77% for εw twice its calculated value and up to 92% for εw
half its calculated value). At lower conversion values, the fraction of the wetted bed had a
greater effect on overall glycerol conversion in the trickle bed, illustrating the importance of
partial wetting in the trickle bed process.
To examine the extreme condition of a fully wetted bed, the overall rate expression (Eq.
5-11) is simplified to contain only the term for the wetted catalyst as shown below (Eq. 5-25).
(5-25)
This fully-wetted bed rate expression was inserted into the reactor equations, and the
integration/optimization process was performed for all the trickle bed experiments. In this form,
the fully-wetted particle model significantly underpredicts outlet glycerol concentration from the
trickle bed for all the experimental conditions. This is because the gas-liquid mass transfer
resistance entirely limits the overall reaction rate in the fully-wetted bed, and the maximum
possible reaction rate thus becomes the maximum gas-liquid mass transfer rate in the bed: RG-L,
max = kGL,H2aC*
H2 (Eq. 5-14). Assuming this value as constant throughout the trickle bed, the
maximum possible glycerol conversion is about 55% at 8.5 MPa pressure, well below the values
2 2
2
,
2,
(1 )H f H S GO OH
G BGO H H SOH
k C C CR
C C K C

71
obtained experimentally. Thus, either the value of the gas-liquid mass transfer coefficient is
significantly higher than that predicted by the correlation of Goto and Smith,42
or reaction rate is
significantly enhanced by unwetted portions of the catalyst bed.
It is clear that partial wetting of the catalyst bed plays a significant role in determining
trickle bed behavior at low flow conditions. The approach to model partial wetting for this
reaction system leads to somewhat counterintuitive result that the unwetted portion of the bed
must contribute significantly to overall reaction rate. Although others have looked in some detail
at different ways to model partially wetted beds, the simplest approach, that of liquid
replenishing of the unwetted region from bulk taken here, appears to be a reasonable means of
characterizing wetting.
5.8. Gas-Liquid Mass Transfer Coefficient Sensitivity Analysis
The hydrogen gas-liquid mass transfer coefficient kGL,H2 from the correlation of Goto
and Smith42
was varied from 50% to 200% of its calculated value and inserted into the partial-
wetted trickle bed model for the PNNL reactor data set. For the full range of operating
conditions, the outlet glycerol conversion varied by less than 5% over the range of kGL,H2
investigated. This signifies that the unwetted portion of the bed is responsible for a significant
portion of reaction, and that in the wetted portion gas-liquid mass transfer only moderately
affects reaction rate.

72
5.9. Commercial Production Simulation
An initial commercial scale-up application of our model was done using the optimized
kinetic constants from the PNNL reactor data set to simulate a trickle bed reactor with a yearly
capacity of 100 million pounds of glycerol. Outlet glycerol conversion is over 90% with the right
trickle bed configuration and operating conditions. Three scenarios were studied: one was done
with the same WHSV as lab scale, the second with the same height/radius ratio as lab scale at
given catalyst bed volume, and finally with different height/radius ratio.
With the same WHSV, the catalyst bed volume is proportional to incoming flow rate. In
case of 100 MM lb/year glycerol capacity, the commercial bed volume is 9.8 m3. Bed length was
changed from 0.275 m (actual lab scale bed length) to 10 m. If the same diameter (0.0127 m) is
used, the number of tubes can be calculated, and outlet glycerol concentration can be simulated
by modifying our model accordingly.
For the other two cases, the same catalyst bed volume was used as case one, height and
radius of catalyst bed was calculated and model was updated accordingly to get glycerol outlet
concentrations. All the simulation glycerol conversion is listed in Table 5-9.
Table 5-9. Commercial process simulation summary
Scenario Description Glycerol Outlet Conversion (%)
0.275 m 98% 1.0 m 98% 3.0 m 97% 6.0 m 97%
Same WHSV
10.0 m 11% Same H/radius ratio H/radius=43.3 66%
H/radius=29 95% H/radius=30 90% H/radius=35 76%
Different H/radius ratio
H/radius=40 69%

73
Chapter 6 Trickle Bed Model with Corrected Rate Expressions
During the derivation process in the previous chapter, stoichiometry in Eq. 5-3 was
wrong. Two hydrogen molecules are needed in Eq. 5-3:
322
kI S H PG S (6-1).
Therefore, Eq. 5-6 becomes
2
23 3 I S Hr k C C (6-2)
and intrinsic rate expression changes to :
2
2
2
3 3
f GO HOH
GO H HOH
k C C Cr
C C K C
(6-3).
The derivation process is discussed in the Appendix B.
With the updated rate expression, the overall rate expression has to change as well:
(6-4) The ensuing discussion is the correction made to reflect these changes with the rest the same. 6.1. Results
The corrected reactor model was applied to the same set of steady state trickle bed reactor
experiments at a variety of operating conditions (Table 6-1) to predict outlet GO conversion in
each experiment.
2 2
2 2
2 *2,
3 *3,
(1 ) (1 )(1 )f GO f GOH S HOH OH
G W B W BGO H GO HH S HOH OH
k C C C k C C CR
C C K C C C K C

74
Table 6-1. Summary of Trickle Bed Run Conditions and Results
Exp. Number
Feed Inlet Temp (K)
Total Pressure
(MPa)
Feed flow rate
(ml/hr)
NaOH Conc. (M)
Experimental Glycerol
Conversion
Predicted Glycerol
Conversion 1 468 8.27 50 0.58 0.90 0.97 2 464 8.27 50 0.58 0.95 0.98 3 467 8.27 50 0.28 0.81 0.84 4 464 8.27 50 0.14 0.69 0.55 5 475 8.27 50 0.14 0.83 0.75 6 453 8.27 50 0.14 0.46 0.38 7 463 8.27 35 0.14 0.79 0.67 8 463 8.27 25 0.14 0.86 0.81 9 473 8.27 35 0.14 0.87 0.85 10 473 8.27 35 0.14 0.89 0.85 11 453 8.27 50 0.28 0.65 0.58 12 475 8.27 50 0.28 0.94 0.95 13 463 8.27 35 0.28 0.89 0.90 14 463 8.27 25 0.28 0.94 0.97 15 453 8.27 35 0.28 0.75 0.72 16 473 8.27 35 0.28 0.96 0.99 17 453 8.27 25 0.28 0.79 0.85 18 473 8.27 25 0.28 0.98 1.00 19 463 8.27 35 0.28 0.91 0.90 20 463 11.03 35 0.28 0.88 0.83 21 463 5.52 35 0.28 0.91 0.96 22 463 2.76 35 0.28 0.64 0.60 23 463 13.79 35 0.28 0.82 0.79 24 468 13.79 35 0.28 0.91 0.87 25 468 8.27 35 0.28 0.96 0.96
The strategy of the modeling exercise was to identify the set of kinetic parameters ko, Ea
(used for calculation of kf which is assumed to follow Arrhenius equation), and KH in the rate
expression (Eq. 6-3) that minimizes the objective function defined in Eq. 5-22 (essentially the
sum over all 25 experiments of the square of the differences in square roots of the experimental
and predicted GO outlet concentrations from the trickle bed reactor). Because the reaction is only
partial order in GO, this objective function, defined for a one-half order reaction, was found to

75
lead to the best overall fit of the data at both low and high GO conversions. To help in the
optimization, an initial value of activation energy Ea, calculated from batch reactor initial rate
data, was used in order to facilitate more rapid error minimization.
2
, ,exp , ,. ( 1 1 )i GO i GO cali
obj function X X (5-22)
Optimized values of the kinetic parameters are listed in Table 6-2. A comparison of
experimental and predicted outlet GO conversions for all experiments is given in Table 6-2 and
as a parity plot in Figure 6-1.
Table 6-2. Optimized kinetics parameters for rate expression (Eq. 6-3).
Description Unit Value
ko m6 fluid/kmol/m
3 catalyst/sec 8.26 ×10
10
Ea kJ/kmol 86,000
KH m3/kmol 4.86×10
4
0.3
0.4
0.5
0.6
0.7
0.8
0.9
1
0.3 0.4 0.5 0.6 0.7 0.8 0.9 1
Experimental GO Conversion
Pre
dic
ted
GO
Co
nve
rsio
n
Figure 6-1. Trickle bed simulation parity plot with corrected rate expression.

76
In general, there is good agreement between predicted and experimental reactor
performance – a remarkable outcome given that only the three kinetic constants are adjusted and
all other constants and coefficients governing hydrodynamics and mass/heat transfer in the
model are taken straight from literature or textbook correlations. For the optimized kinetic
parameters, the value of the objective function in Eq. 5-22 is 0.123; in simplified terms, the
average value of the absolute difference between experimental and simulated outlet GO
conversion is 0.0455. An example of the experimental and predicted temperature profiles along
the trickle bed at three different inlet temperatures is given in Figure 6-2; the model reasonably
predicts the mild exotherms in the trickle bed reactor over the temperature range examined.
430
440
450
460
470
480
490
0 0.2 0.4 0.6 0.8 1
Fractional Reactor Length
Tem
per
atu
re (
K)
Figure 6-2. Predicted vs. experimental temperature profile in trickle bed. Inlet temperature: 453 K (Exp. 6): (▬▬) – simulation, (◇) – experiment; 463 K (Exp. 7): (- - -) –
simulation, (□) – experiment; 473 K (Exp. 9): (-·-·-) – simulation, (△) - experiment. Conditions: 8.27 MPa, liquid feed rate 35 ml/hr, 0.14 M NaOH.
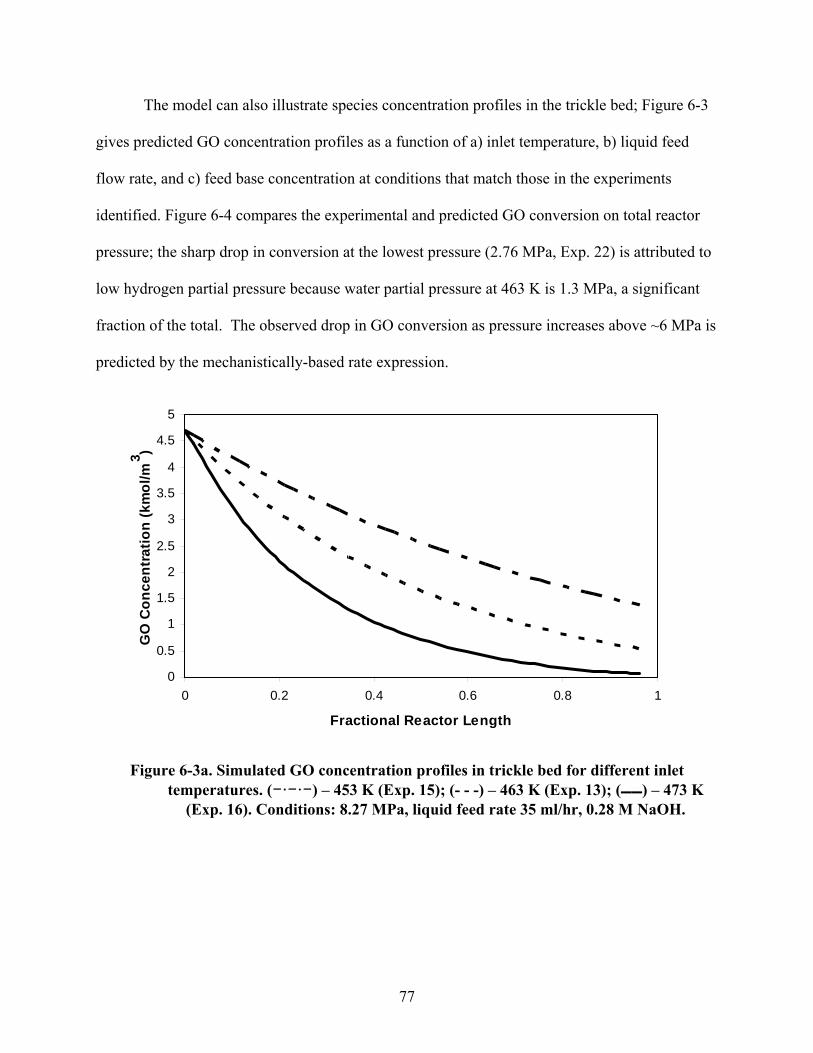
77
The model can also illustrate species concentration profiles in the trickle bed; Figure 6-3
gives predicted GO concentration profiles as a function of a) inlet temperature, b) liquid feed
flow rate, and c) feed base concentration at conditions that match those in the experiments
identified. Figure 6-4 compares the experimental and predicted GO conversion on total reactor
pressure; the sharp drop in conversion at the lowest pressure (2.76 MPa, Exp. 22) is attributed to
low hydrogen partial pressure because water partial pressure at 463 K is 1.3 MPa, a significant
fraction of the total. The observed drop in GO conversion as pressure increases above ~6 MPa is
predicted by the mechanistically-based rate expression.
0
0.5
1
1.5
2
2.5
3
3.5
4
4.5
5
0 0.2 0.4 0.6 0.8 1
Fractional Reactor Length
GO
Co
nc
en
tra
tio
n (
km
ol/
m3 )
Figure 6-3a. Simulated GO concentration profiles in trickle bed for different inlet temperatures. (-·-·-) – 453 K (Exp. 15); (- - -) – 463 K (Exp. 13); (▬▬) – 473 K
(Exp. 16). Conditions: 8.27 MPa, liquid feed rate 35 ml/hr, 0.28 M NaOH.

78
0
0.5
1
1.5
2
2.5
3
3.5
4
4.5
5
0 0.2 0.4 0.6 0.8 1
Fractional Reactor Length
GO
Co
nce
nra
tio
n (
kmo
l/m3 )
Figure 6-3b. Simulated GO concentration profiles in trickle bed for different liquid feed
flow rates: (▬▬) – 50 ml/hr (Exp. 4); (- - -) – 35 ml/hr (Exp. 7); (-·-·-) – 25 ml/hr (Exp. 8). Conditions: 8.27 Mpa, 463 K, 0.14 M NaOH.
0
0.5
1
1.5
2
2.5
3
3.5
4
4.5
5
0 0.2 0.4 0.6 0.8 1
Fractional Reactor Length
GO
Co
nce
ntr
atio
n (
kmo
l/m
3 )
Figure 6-3c. Simulated GO concentration profiles in trickle bed at different NaOH
concentrations: (-·-·-) - 0.58 M (Exp. 2); (- - -) - 0.28 M (Exp. 3); (▬▬) - 0.14 M (Exp. 4). Conditions: 8.27 MPa, 464 K, liquid feed rate 50 ml/hr.

79
0.5
0.6
0.7
0.8
0.9
1
2 4 6 8 10 12 14
Pressure (MPa)
GO
Co
nve
rsio
n
Figure 6-4. Effect of pressure on outlet GO conversion from trickle bed reactor. (▬▬) -
simulation; (■) -experiment . Conditions: 463 K, liquid feed rate 35 ml/hr, 0.28 M NaOH.
If the rate expression (Eq. 6-3) with coefficients from Table 6-2 is evaluated at 463 K at
the reactor inlet (CGO = 4.6 M; COH- = 0.28 M; PH2 = 8.3 MPa) and normalized to the catalyst
site density of 1.3 × 10⁻⁵
kmol/kg, the resulting turnover frequency (TOF) is approximately 0.31
kmol H2/kmol metal site/sec. This is a reasonable value for GO hydrogenolysis at these
conditions.
6.2. Evaluation of Model Assumptions
The trickle bed model incorporates several significant features including a non-isothermal
catalyst bed, mechanistically-based intrinsic rate expression, multiple mass transfer resistances,
and partial wetting of the catalyst in the trickle bed. Here we present simplifications of the

80
original model that examine each of these assumptions to determine if their inclusion in the
model is appropriate. The difference in value of the objective function given in Eq. 5-22 in the
original and simplified models is used as a criterion for the validity of inclusion of each
assumption in the model.
It is noted here that attempts were made to model glycerol hydrogenolysis with simple
nth
-order reaction kinetics in glycerol and hydrogen along with the mass transfer effects. None
of these kinetic models gave a reasonably approximation of the experimental trickle bed data.
Thus, inclusion of the mechanistically based rate expression with the observed dependence on
glycerol and hydrogen is an integral part of the modeling process.
6.2.1. Isothermal Catalyst Bed
The reactor energy balance Eq. 5-10 is eliminated for an isothermal catalyst bed, as
temperature is constant at the specified inlet value. The GO molar balance was integrated via
Euler’s method for all experiments, and the kinetic parameters ko and KH were re-optimized to
minimize the objective function. The new optimized values are KH = 4.6 × 10⁴ m
3/kmol and ko
= 8.83 × 10¹⁰
m6
fluid/kmol/m3 catalyst/sec. With these optimal isothermal bed parameters, the
value of the objective function Eq. 5-22 for the isothermal trickle bed is 0.106, a value slightly
smaller than the value of 0.123 obtained for the complete model. The average difference between
predicted and experimental GO conversions for the isothermal model is 0.040 vs. 0.045 for the
complete model.
Although the isothermal model thus appears to fit the GO conversion data slightly better
than the complete model, the fact that it cannot predict temperature gradients in the trickle bed,

81
which may be important in an expanded range of operation, makes it less attractive than the
complete model.
It is possible that reactor temperature gradients measured experimentally (Figure 6-3a)
arise in part because of radial heat transfer resistances, which are not accounted for in the model.
At this point, it is not possible to distinguish the effects of radial from axial temperature
gradients because of limited measurement capabilities.
6.2.2. Fully Wetted Catalyst Bed
The low liquid velocities used in experiments necessitate application of the partial
wetting correlation of Al-Dahhan. Here, we examine the effect of fractional wetting (εw) of the
catalyst bed on outlet conversion. First, the sensitivity of outlet GO conversion on fractional
wetting was examined by varying εw from 50% to 200% of the value calculated by Al-Dahhan.
For outlet GO conversions above 85%, varying the fraction wetted changed the outlet conversion
by a maximum of 10% (e.g. at a conversion of 85%, down to 77% for εw of twice its calculated
value and up to 92% for εw of half its calculated value). At lower conversion values, the fraction
wetted had a greater effect on overall GO conversion in the trickle bed, illustrating the
importance of partial wetting in the trickle bed process.
To examine the extreme condition of a fully wetted bed, the overall rate expression (Eq.
6-4) is simplified to contain only the term for the wetted catalyst as shown below (Eq. 6-5).
(6-5)
2
2
2,
3,
(1 )f GO H SOH
G BGO H H SOH
k C C CR
C C K C

82
This fully-wetted bed rate expression was inserted into the reactor equations and the
integration/optimization process was performed over all trickle bed data. In this form, the fully-
wetted particle model significantly underpredicts outlet GO concentration from the trickle bed at
all but the highest pressure (13.8 MPa) investigated. At the lower pressures, gas-liquid mass
transfer resistance limits the overall reaction rate in the fully-wetted bed, and the maximum
possible reaction rate thus becomes the maximum gas-liquid mass transfer rate in the bed: RG-L,
max = kGL,H2aC*
H2. Assuming this value as constant throughout the trickle bed, the maximum
possible GO conversion is about 57% at 8.3 MPa pressure (7.5 MPa H2 pressure), well below the
values obtained experimentally. At the highest pressure (13.8 MPa, Runs 23 and 24), the
predicted conversions are close to the experimental values, suggesting that the reaction is moving
away from being hydrogen mass transfer limited in the wetted fraction at high pressures.
Overall, however, the conclusion must be drawn that the unwetted portion of the catalyst bed
contributes significantly to reaction rate. It is possible that the actual value of the gas-liquid
mass transfer coefficient is significantly larger than that predicted by the correlation of Goto and
Smith42
and thus the bed could be nearly fully wetted and giving the observed conversions, but
that notion is inconsistent with the literature and the correlations used for both wetting and mass
transfer.
Further, the substantial body of literature on trickle bed reactors clearly indicates that
partial wetting of the catalyst bed plays a significant role in determining trickle bed behavior at
low flow conditions. The question of how the unwetted portion of a trickle bed reactor
contributes to reaction, as assumed here, seems difficult at first to reconcile. We make the
assumption that the pore volume of all catalyst particles in the bed are filled with liquid, and that

83
the bulk liquid flowing over part of the catalyst is continuously changing its path along the
trickle bed. Thus, while only a portion of the catalyst is wetted at any instant, the particular
portion wetted changes continuously. When catalyst particles are wetted, the liquid inside them
exchanges reactants and products with the bulk liquid, hence facilitating reaction when again
unwetted. This continuous liquid replenishing of the unwetted region from bulk liquid appears a
reasonable first approximation of characterizing partial wetted trickle beds, and avoids the major
challenges associated with attempting to model bed hydrodynamics.
6.2.3. Gas-Liquid Mass Transfer Coefficient Sensitivity Analysis
The hydrogen gas-liquid mass transfer coefficient kGL,H2 from the correlation of Goto
and Smith was varied from 50% to 200% of its calculated value and inserted into the partial-
wetted trickle bed model. Over the full range of experimental conditions, the outlet GO
conversion varied by less than five percentage points over the range of kGL,H2 investigated. This
outcome is partially explained by the fact that the reaction rate (Eq. 6-3) is weakly or even
negatively dependent on hydrogen concentration (CH2, S) at the catalyst particle, and also by the
fact that the unwetted portion of the trickle bed makes a substantial contribution to overall
reaction rate.
6.3. Conclusions
Experimental data of GO hydrogenolysis in a laboratory-scale trickle bed reactor have
been described with a one-dimensional, nonisothermal trickle bed reactor model involving a
mechanistically-based kinetic rate expression, intraparticle mass transport, interphase mass

84
transport, and partial wetting of the catalyst bed. The model is fit to the experimental data by
optimizing values of the kinetic constants in the rate expression. The rate expression predicts rate
dependencies on GO and H2 that vary significantly in order depending on particular experimental
conditions, indicating that the interplay between mass transport resistances, fractional wetting of
catalyst, and observed reaction rate is complex. Axial temperature gradients are small (<10oC)
yet play a role in the trickle bed, and the unwetted portion of the bed contributes significantly to
overall reaction rate. Accounting for all complexities and assumptions, the model reasonably
predicts the outlet conversion of GO from the trickle bed.

85
Chapter 7 Intrinsic Reaction Rate Correlation for Batch and Trickle Bed Reactors
Trickle bed reactors are commonly used on a commercial scale for hydrogenolysis of
liquid-phase reactants.44-46 Much work has been done to study mass transfer, energy transfer,
reaction kinetics, and partial wetting 47-50
of trickle bed reactors for the purpose of better
predicting and characterizing their operation. Even so, trickle bed reactors remain complex unit
operations that are often subject to mass transport and hydrodynamic limitations at practical
operating conditions. Because of these complications, laboratory and pilot-scale trickle bed
reaction studies often give results that are difficult to interpret from a fundamental viewpoint,
and scale-up of trickle beds is subject to uncertainty and risk.
In contrast to trickle beds, bench-scale batch reactors are easy to operate in an intrinsic
kinetic reaction mode and are thus effective tools for evaluating catalysts and conditions for
three-phase reactions. With greater control of mass transfer by vigorous agitation of fully-wetted
catalyst and temperature to control rate, batch reactors are efficient and reliable tools.
Despite the utility of batch reactors for fundamental reaction characterization, little work
has been done51-55
so far to relate batch reactor results to actual or potential trickle bed operation
for three phase reaction systems, particularly hydrogenolysis of aqueous-phase reactants derived
from biomass sources. This chapter will take such a step by examining the hydrogenolysis of
aqueous solutions of lactic acid to propylene glycol, a reaction system with high selectivity to PG
and few byproducts,56-58
over a carbon supported ruthenium catalyst in both trickle-bed and
batch reaction systems. The goal of this work is to gain the ability to predict trickle-bed
performance based on batch reaction studies to facilitate more efficient scale-up and design. We

86
do this by comparing reaction rates at different conditions and then analyzing to gain a better
understanding of the roles that mass transfer, heat transfer, and wetting play in the
hydrogenolysis.
7.1. Kinetic Model for Lactic Acid Conversion
Lactic acid hydrogenolysis kinetics in a stirred batch reactor with a catalyst similar to
that used in this work have been reported previously by Zhang et al.59
Experimental data were
fit to a mechanistically based Langmuir-Hinshelwood rate expression as is shown in Eq. 7-1.
Reaction rate coefficients, k, KH2, and KLA, were fit with MathCad to data at 403 K and 423K
with different catalyst loadings (0.5g, 1.0g, and 1.5g) in 100 g 1.15 M lactic acid solution at
different pressures (6.8 MPa, 10.2 MPa, and 13.6 MPa).
2
2 22(1 )
LA HLA
H H LA LA
kC Pr
K P K C
(7-1)
To apply Eq. 7-1 to this study, rate constants determined at 403 and 423 K were
extrapolated using an Arrhenius expression to the temperatures (353 K and 363 K) at which
reactions were carried out. Table 7-1 lists the values of the constants in the rate expression at all
five temperatures, with rate written on a unit catalyst volume basis.
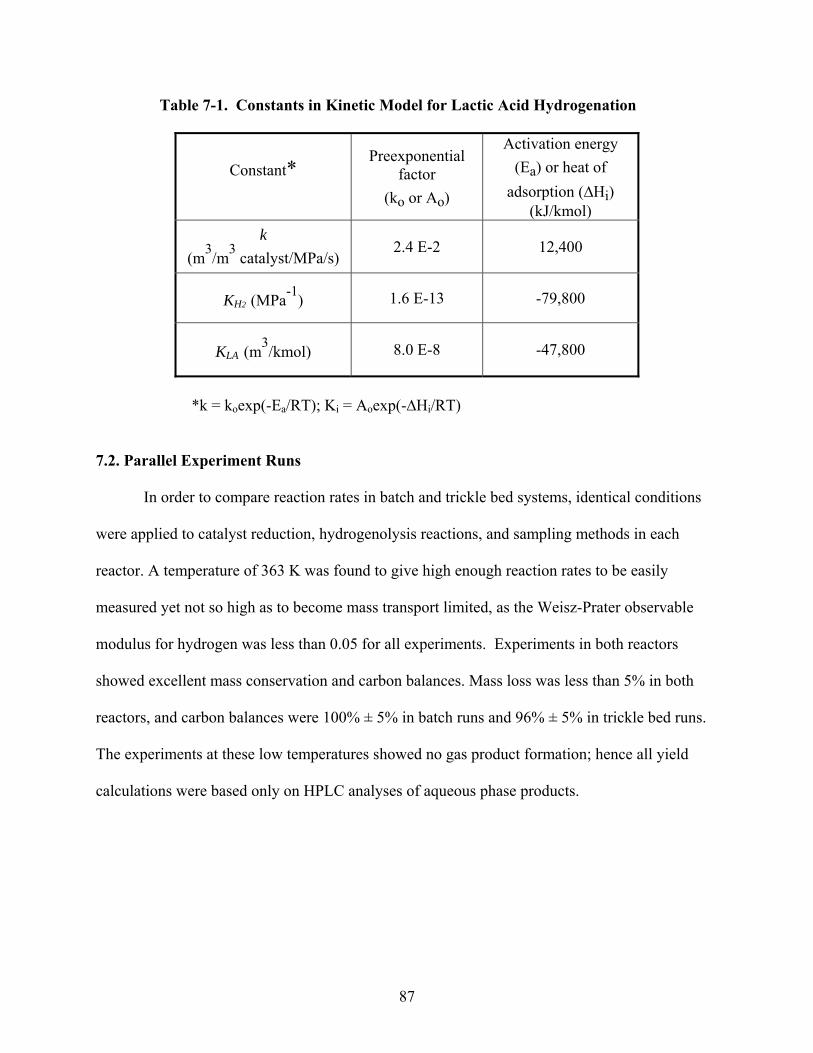
87
Table 7-1. Constants in Kinetic Model for Lactic Acid Hydrogenation
Constant*
Preexponential factor
(ko or Ao)
Activation energy
(Ea) or heat of
adsorption (∆Hi) (kJ/kmol)
k
(m3/m
3 catalyst/MPa/s)
2.4 E-2 12,400
KH2 (MPa-1
) 1.6 E-13 -79,800
KLA (m3/kmol) 8.0 E-8 -47,800
*k = koexp(-Ea/RT); Ki = Aoexp(-∆Hi/RT)
7.2. Parallel Experiment Runs
In order to compare reaction rates in batch and trickle bed systems, identical conditions
were applied to catalyst reduction, hydrogenolysis reactions, and sampling methods in each
reactor. A temperature of 363 K was found to give high enough reaction rates to be easily
measured yet not so high as to become mass transport limited, as the Weisz-Prater observable
modulus for hydrogen was less than 0.05 for all experiments. Experiments in both reactors
showed excellent mass conservation and carbon balances. Mass loss was less than 5% in both
reactors, and carbon balances were 100% ± 5% in batch runs and 96% ± 5% in trickle bed runs.
The experiments at these low temperatures showed no gas product formation; hence all yield
calculations were based only on HPLC analyses of aqueous phase products.

88
7.2.1. Batch Reactor Experiments
Experiments were carried out at 363 K, 8.3 MPa hydrogen pressure, an initial lactic acid
solution concentration in water of 1.0 kmol/m3, and a total liquid volume of 5.0×10
-5 m3. Three
different catalyst loadings (0.125g, 0.25g, and 0.5g) were examined to validate that reactions
take place in the intrinsic kinetic regime. Figure 7-1 shows propylene glycol yield with respect to
time for the different catalyst loadings.
0.00
2.00
4.00
6.00
8.00
10.00
12.00
0 50 100 150 200 250 300 350
Time (min)
Pro
pyl
ene
gly
col
(%)
Figure 7-1. Propylene glycol yield versus time in a batch reactor at 363 K and 8.3 MPa H2 (▲- 0.5 g catalyst; ■ - 0.25 g catalyst; ♦ - 0.125 g catalyst).
Figure 7-1 shows that propylene glycol yield is linear at low conversion, so lactic acid
hydrogenolysis rate is constant over the course of reaction. The value of the rate on a per unit
catalyst mass basis, determined from the slopes of the curves in Figure 7-1, is 5.8 × 10⁻⁷
± 3 ×
10-8
kmol/kg catalyst/sec. The value predicted by Eq. 7-1 is 5.3 × 10⁻⁷
kmol/kg catalyst/sec at

89
the same conditions, somewhat low but in reasonable agreement considering that the kinetic
constants were determined at significantly higher temperatures and extrapolated to 363 K.
7.2.2. Trickle Bed Reactor Experiments
For the trickle bed runs, three catalyst beds were constructed: one containing 19.0 g (45
cm3) catalyst, another 9.1 g (22.5 cm
3) catalyst, and a third containing 9.0 g (22.5 cm
3) catalyst
diluted with 22.5 cm3 inert glass beads as fines. The beds are noted according to volume in
Tables 7.2; the bed with glass bead fines is denoted with a star. The inert glass bead diameter for
the diluted bed (dfines ~ 0.02 cm) was chosen to be approximately one-tenth of the catalyst
particle’s diameter, as suggested by Tsamatsoulis et al.60
to enhance wetting of the catalyst.
The feed rate of lactic acid solution (1.0 M) was varied to investigate the effect of
catalyst particle wetting on lactic acid conversion and reaction rate. In order to achieve
experimental conditions consistent with those in the batch reactor, relatively high liquid feed
flow rates (up to 200 ml/hr) were applied. Several temperatures from 353 K to 373 K were
examined in trickle bed runs, and hydrogen flow rate was adjusted to maintain excess hydrogen
(a 2.5:1 molar ratio of hydrogen: lactic acid). It generally took 2-3 hours to reach steady state in
the trickle bed reactor. Reaction conditions are listed in Table 7-2 for all the trickle bed runs.

90
Table 7-2. Lactic Acid Hydrogenolysis Trickle Bed Experiments (at 1200 psi, 1.0 M initial lactic acid solution, and catalyst 3224-25-1)
The approach to steady state operation for each of the three different trickle bed reactors
at 363 K, 8.3 MPa H2, and flow rates of 100~200 ml/hr aqueous solution of lactic acid is shown
Experiment Serial No.
Temperature (℃)
Feedstock flow rate (ml/hr)
Catalyst volume
(cm3)
LA Conversion
PG Selectivity
Carbon Balance
TBR 34 140 25 45 0.999 0.464 0.466 TBR 35 140 50 45 1 0.684 0.684 TBR 36 140 75 45 0.995 0.676 0.683 TBR 37 140 100 45 1 0.584 0.584 TBR 38 140 200 45 0.994 0.508 0.511 TBR 39 120 200 45 0.886 0.726 0.758 TBR 40 120 100 45 0.921 0.699 0.723 TBR 41 120 75 45 0.9 0.73 0.757 TBR 42 120 50 45 0.952 0.668 0.683 TBR 43 120 25 45 0.86 0.636 0.687 TBR 44 100 50 45 0.991 0.784 0.786 TBR 45 100 50 45 0.98 0.827 0.83 TBR 46 100 100 45 0.841 0.824 0.852 TBR 47 80 50 45 0.649 0.564 0.915 TBR 48 60 50 45 0.243 0.222 0.979 TBR 49 80 200 45 0.205 0.9 0.98 TBR 50 90 200 45 0.356 0.851 0.947 TBR 51 90 100 45 0.617 0.856 0.911
TBR 53 80 100 45 0.389 0.812 0.927 TBR 54 90 200 22.5 0.127 0.898 0.987 TBR 55 90 100 22.5 0.217 0.953 0.99 TBR 56 80 100 22.5 0.147 0.924 0.988 TBR 57 80 200 22.5 0.052 1 1.013
TBR 58 90 100 22.5* 0.232 0.851 0.965
TBR 59 90 200 22.5* 0.108 0.979 0.998
TBR 60 90 1.0 22.5* 0.416 0.76 0.9
TBR 61 90 1.0 22.5* 0.551 0.867 0.927
TBR 62 80 25 22.5* 0.395 0.899 0.96
TBR 63 80 50 22.5* 0.245 0.917 0.98
TBR 64 80 100 22.5* 0.162 0.762 0.962
TBR 65 80 200 22.5* 0.081 0.756 0.98
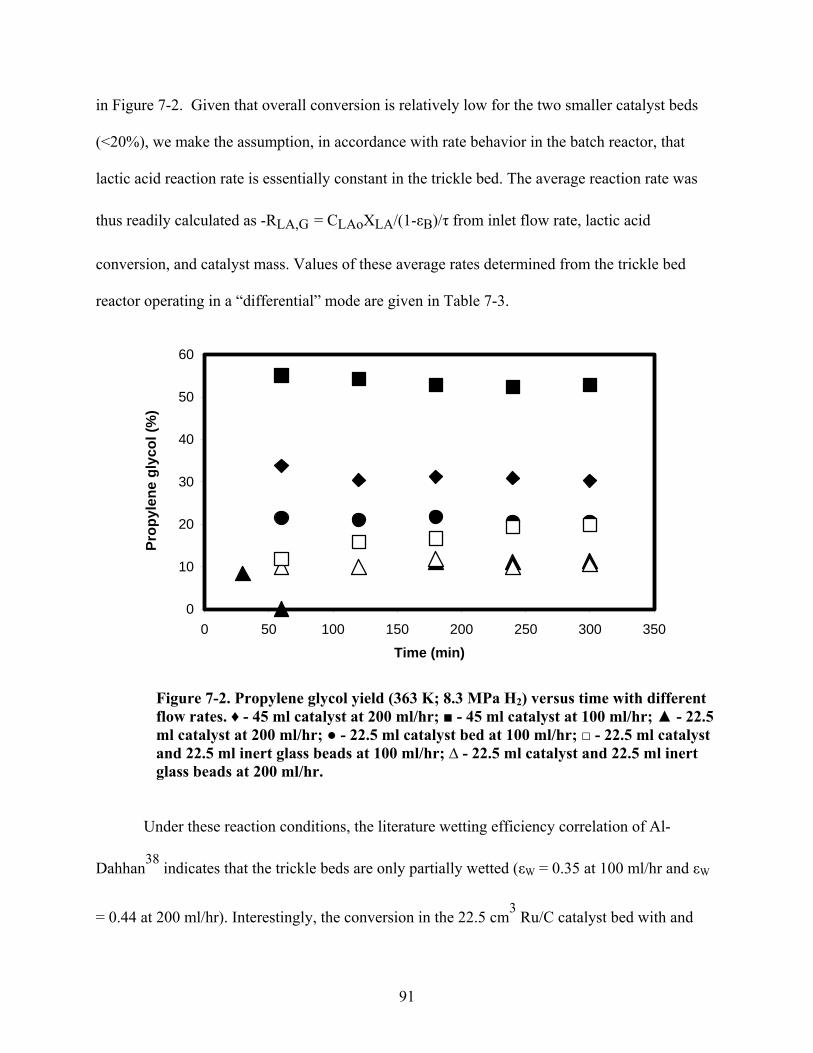
91
in Figure 7-2. Given that overall conversion is relatively low for the two smaller catalyst beds
(<20%), we make the assumption, in accordance with rate behavior in the batch reactor, that
lactic acid reaction rate is essentially constant in the trickle bed. The average reaction rate was
thus readily calculated as -RLA,G = CLAoXLA/(1-εB)/τ from inlet flow rate, lactic acid
conversion, and catalyst mass. Values of these average rates determined from the trickle bed
reactor operating in a “differential” mode are given in Table 7-3.
0
10
20
30
40
50
60
0 50 100 150 200 250 300 350
Time (min)
Pro
pyl
ene
gly
col
(%)
Figure 7-2. Propylene glycol yield (363 K; 8.3 MPa H2) versus time with different flow rates. ♦ - 45 ml catalyst at 200 ml/hr; ■ - 45 ml catalyst at 100 ml/hr; ▲ - 22.5 ml catalyst at 200 ml/hr; ● - 22.5 ml catalyst bed at 100 ml/hr; □ - 22.5 ml catalyst and 22.5 ml inert glass beads at 100 ml/hr; ∆ - 22.5 ml catalyst and 22.5 ml inert glass beads at 200 ml/hr.
Under these reaction conditions, the literature wetting efficiency correlation of Al-
Dahhan38
indicates that the trickle beds are only partially wetted (εW = 0.35 at 100 ml/hr and εW
= 0.44 at 200 ml/hr). Interestingly, the conversion in the 22.5 cm3 Ru/C catalyst bed with and

92
without fines is essentially the same – this suggests that either the addition of fines has relatively
little effect on the fraction of catalyst wetted, or that both beds are fully wetted and thus the
Table 7-3. Propylene glycol formation rates in trickle bed and batch reactors (T = 363 K; 8.3 MPa H2; 1.0 M solution lactic acid feed)
correlation of Al-Dahhan is not applicable to this aqueous phase system. The close agreement of
trickle bed and batch reaction rate, especially in the shorter bed and with fines present, is further
evidence that the trickle bed under these high liquid flow rates is essentially operating under
intrinsic kinetic conditions, and is thus fully wetted.
The higher average rate in the larger (45 cm3) trickle bed is not readily explained. The
conversion (30% and 55%) at these conditions is clearly higher than what could be considered
the differential mode of operation, but that would lead to a lower, not a higher, overall rate in the
bed because rate increases with lactic acid concentration in the range used. Wetting efficiency
should be the same in shorter and longer beds at the same flow rate, because the liquid velocity
(kg/m2/sec) is unchanged. Other possibilities, including liquid channeling, could lead to higher
conversions if the catalyst becomes only partially wetted in the lower regions of the larger beds.
Flow rate (ml/hr)
200 100
Catalyst bed mass (g)
RPG,G
(kmol/m3cat/sec)
9.1 5.5±0.4 × 10⁻⁴
5.1±0.4 × 10⁻⁴
9.1 + fines 5.1±0.4 × 10⁻⁴
4.9±0.4 × 10⁻⁴
Batch 4.6±0.3 × 10⁻⁴

93
At this point, we attribute the higher rate either to channeling which results in partial wetting or
to a greater exotherm in the bed because of the higher conversions, and thus a slight increase in
overall bed temperature results.
The results represent, to our knowledge, the first case of direct comparison of reaction
rates under identical conditions in aqueous batch and trickle bed reactions, and indicate that it is
possible to achieve intrinsic kinetics in a trickle bed reactor, albeit at conditions (e.g. high flow
rates and low conversions) that are far from those that would be chosen to optimize product
yields.
7.3. Trickle Bed Reactor Modeling
To further explore the relationship between trickle bed performance and intrinsic reaction
kinetics, experiments were completed in the trickle bed reactor at 353 K and 363 K at four
different flow rates (25 ml/hr, 50 ml/hr, 100ml/hr, and 200 ml/hr) with the 22.5 ml Ru/C catalyst
bed diluted with 22.5 ml inert glass beads as fines. Initial lactic acid concentration for all
experiments was 1.0 M, and hydrogen pressure was maintained constant at 8.3 MPa.
We have previously developed a detailed trickle bed reactor model for glycerol
hydrogenolysis that accounts for interphase mass transfer, temperature gradients, and catalyst
particle partial wetting. We apply that model here, in several simplified forms, to hydrogenolysis
of lactic acid, including the intrinsic kinetic expression shown in Eq. 7-1 to describe reaction
rate. The goal of this modeling is to identify those aspects and assumptions of the trickle bed
model that are important in predicting trickle bed reactor behavior.
The trickle bed reactor is modeled as a one-dimensional system with liquid in plug flow,
such that the molar balance for lactic acid can be written as

94
,(1 )LAB LA G
dCR
d
(7-2)
No balance for the gas phase is required – the gas phase is composed solely of water at its
vapor pressure and hydrogen, since there are no gas-phase products formed in LA
hydrogenolysis as is proved by the gas sample analysis. The reactor is assumed to be isothermal
for two reasons – first, its temperature is controlled by silicon oil that circulating at a high rate
through the jacket surrounding the reactor; and second, changes in reactor temperature are
dampened by water vaporization as temperature is increased to maintain saturation of the vapor
phase.
For the trickle bed, the rate expression (Eq. 7-1) can be written in terms of hydrogen
concentration instead of partial pressure using Henry’s law
2 2H A HP H C (7-3)
with the Henry’s law constant for hydrogen in water is equal to 120 MPa/M. 43
In the wetted fraction of the trickle bed reactor, the diffusion of hydrogen limits reaction
to a greater degree than lactic acid because it must diffuse across the gas-liquid interface and
because of its low concentration (solubility) in water (CH2*
= 0.068 M at 8.3 MPa pressure)
relative to lactic acid (~1.0 M). The trickle bed model must therefore account for mass transport
resistances of hydrogen across the gas-liquid and liquid-solid interfaces in the wetted fraction of
the trickle bed. At steady state, the hydrogen mass transfer rates must equal the hydrogen
consumption rate in the catalyst (-rH2 = 2(-rLA)):
2 2 2 2 2
*, , ,( ) ( ) 2 (1 )( )GL H H L LS H L H S H B LAk a C C k a C C r (7-4)

95
Inserting the rate expression (Equation 7-1) into Equation 7-4, the actual hydrogen concentration
in the liquid phase (CH2, L) and at the catalyst surface (CH2, S) can be found from the resulting
equations:
2 2,2
*,
H L
GL H LS H S
GL LS
k a C k a CC
k a k a
(7-5)
and
2 2 22 2 2
2 2 2 2
2 2
2 2
2 2 3 * 2, ,
2 2 * *
,
2 2 * *
(2 2 )
( 1 2 2 2
2 (1 ) ( ))
2
GL LS A GL LS H A LA LA H H AH H S H S
GL LS LA LA LA LA H A H H A H LA LA
H B A LA GL LS H S
LA LA GL LS H LS GL H LA
k a k a K H C k a k a K H K C K C H C
k a k a K C K C K H C K H C K C
kH C k a k a C
K C k a k a C k a k a C K
2
* 0LA GL LS HC k a k a C
(7-6)
Mass transfer coefficients (kGLa, kLSa) are calculated using the correlations of Goto and
Smith; 42
wetting efficiency (εW) is based on Al-Dahhan’s correlation; 38 both are given in
Chapter 5.
The observed reaction rate in the trickle bed reactor can be written most generally as the
sum of rates in a wetted fraction and in an unwetted fraction that is periodically replenished with
liquid and is thus reactive. 38
In this unwetted fraction, the liquid phase hydrogen concentration
is equal to its solubility from Henry’s law, as there is no liquid layer surrounding the catalyst for
hydrogen to diffuse through.
2 2 2 2
2 2 2 2
*,
, 2 * 2,
(1 )(1 ) (1 )
H LA A H S H LA A HLA G W W
LA LA H A H S LA LA H A H
kC H C kC H CR
K C K H C K C K H C
(7-7)

96
The intraparticle hydrogen mass transfer limitations are characterized by the generalized
Thiele modulus for hydrogen in the catalyst particles 61
,2
2
0.5
0
2 ( ) 4 ( )H SC
LA e LA HL r D r dC
(7-8)
which takes the following form when –rLA (Equation 7-1) is inserted:
,22 2 2
22 2 2 2
0.5
22 2
0
24
6 (1 ) (1 )
H SCLA A H H Hp
H p LA ALA LA H A H LA LA H A H
kC H C C dCdD kC H
K C K H C K C K H C
(7-9)
The value of the generalized modulus is less than 0.2 for all reaction conditions, so we assume
that the effectiveness factor is essentially unity in the model.
The molar balance (Eq. 7-2) is integrated numerically across the trickle bed volume using
Euler’s method in Microsoft Excel. At any position in the trickle bed reactor, where H2 pressure
and LA concentration are known, the value of CH2,S can be determined by solving Equation 7-6,
a cubic equation, with the Solver function in Microsoft Excel 7.0. With CH2,S, CH2,L, and ηH2
known, the reaction rate (Eq. 7-1) can be calculated and then lactic acid concentration
determined at the next increment along the reactor. In this way, the concentration profiles and
outlet conversion can be determined at each set of experimental conditions.
7.4. Results and Discussion
The trickle bed model described in Equation 7-2 to Equation 7-9 is referred to herein as
Case 1, or the complete model for the trickle bed. We have also examined several variations of
the model in order to better understand which model assumptions are important. These are given

97
below, and their results along with those of Case 1 are presented in Table 7-4. The catalyst beds
in Table 7-4 correspond to those described in Section 7.2.2 examined in this study.
Case 2 is the same as Case 1 except that the trickle bed is assumed to be fully wetted
(εW=1). Therefore, Equation 7-7 simplifies to
2 2
2 2
,, 2
,(1 )
H LA A H SLA G
LA LA H A H S
kC H CR
K C K H C
(7-10)
Case 3 is similar to Case 2, but reaction is assumed to take place only in the wetted
fraction of the catalyst in the trickle bed, with the wetted fraction (εW) given by the correlation
of Al-Dahhan. 38
In this case, Equation 7-7 is given as
2 2
2 2
,, 2
,(1 )
H LA A H SLA G W
LA LA H A H S
kC H CR
K C K H C
(7-11)
In Case 4, it is assumed that the trickle bed is fully wetted (εW=1), that there are no gas-
liquid or liquid-solid mass transfer resistances in the trickle bed (C*
H2= CH2, S), and that there
are no intraparticle resistances (ηH2=1). The reactor is thus considered as a plug flow reactor
with intrinsic reaction kinetics. The observed reaction rate is thus given by Eq. 7-1, and
Equations 7-4 to 7-9 do not apply.

98
Table 7-4. Results of Trickle Bed Modeling (Cases 1-4) of Lactic Acid Hydrogenolysis
# TBR S/N
Temperature (K)
Flow Rate
(ml/hr)
Exp. Conversion
Catalyst mass (g)
Case 1
Case 2
Case 3
Case 4 εW
1 εW
2
CH2,S inlet
(mol/l) Case 1
1 59 363 200 0.108 9.1* 0.136 0.113 0.050 0.153 0.436 0.706 0.042
2 58 363 100 0.232 9.1* 0.264 0.203 0.071 0.294 0.346 0.638 0.037
3 60 363 50 0.416 9.1* 0.491 0.352 0.100 0.535 0.274 0.576 0.031
4 61 363 25 0.551 9.1* 0.802 0.584 0.136 0.836 0.218 0.521 0.026
5 65 353 200 0.081 9.1* 0.068 0.064 0.028 0.071 0.436 0.706 0.053
6 64 353 100 0.162 9.1* 0.134 0.123 0.043 0.140 0.346 0.638 0.049
7 63 353 50 0.245 9.1* 0.260 0.229 0.064 0.272 0.274 0.576 0.045
8 62 353 25 0.395 9.1* 0.486 0.414 0.094 0.504 0.218 0.521 0.039
9 54 363 200 0.127 9.1 0.136 0.113 0.05 0.153 0.436 0.706 0.042
10 55 363 100 0.217 9.1 0.264 0.203 0.071 0.294 0.346 0.638 0.037
11 57 353 200 0.052 9.1 0.068 0.064 0.028 0.071 0.436 0.706 0.053
12 56 353 100 0.147 9.1 0.134 0.122 0.043 0.140 0.346 0.638 0.049
* denotes the diluted trickle bed

99
Table 7.4. (Cont’d)
# TBR S/N
Temperature (K)
Flow Rate
(ml/hr)
Exp. Conversion
Catalyst mass (g)
Case 1
Case 2
Case 3
Case 4 εW
1 εW
2
CH2,S inlet
(mol/l) Case 1
13 50 363 200 0.356 19.0 0.264 0.222 0.099 0.294 0.436 0.706 0.042
14 51 363 100 0.617 19.0 0.490 0.392 0.141 0.535 0.346 0.638 0.037
15 49 353 200 0.205 19.0 0.134 0.127 0.056 0.140 0.436 0.706 0.053
16 53 353 100 0.389 19.0 0.261 0.240 0.085 0.272 0.346 0.638 0.049
17 47 353 50 0.649 19.0 0.487 0.439 0.127 0.504 0.274 0.576 0.045
18 46 373 100 0.840 19.0 0.700 0.496 0.181 0.768 0.346 0.638 0.028
19 45 373 50 0.980 19.0 0.951 0.773 0.242 0.967 0.274 0.576 0.023
1 Wetting efficiency was calculated as per Al-Dahhan’s correlation:
1/91/3 1 ( / ) /
1.104Re LW L
L
P Z g
Ga
2 Wetting efficiency was calculated as per Al-Dahhan’s correlation at low pressure:
0.1461 0.07111.617 ReW L LGa
where 3 2
2Re ,P P L
L LL L
Ld d gGa

100
In analyzing the results given by the four cases, it is important to note that under all
conditions that reaction rate increases with lactic acid concentration and with hydrogen
concentration. Thus, the presence of mass transport resistances always decreases overall rate;
thus Case 4 represents the maximum possible conversion rate in the trickle bed, and Case 3 the
minimum possible conversion. It should also be noted that no parameters were adjusted to fit
the model results to experimental data; extrapolated kinetic constants were used from Table 7-1
and mass transfer coefficients were calculated directly from literature correlations.42
The
following parity plot shows the comparison between model simulation and experiment results.
Figure 7-3. Parity plot of model simulation versus experiment results.
0
0.1
0.2
0.3
0.4
0.5
0.6
0.7
0.8
0.9
1
0 0.2 0.4 0.6 0.8 1
Experiment
Sim
ula
tio
n
Case 1 Case 2 Case 3 Case 4

101
7.4.1. Comparison of Trickle Bed Models (Cases 1-4) with Experiments
Table 7-4 gives predicted outlet LA conversion for each of the four models (Cases 1-4)
developed for LA hydrogenolysis in the trickle bed. In analyzing the results for the four cases, it
is important to note that under all conditions the reaction rate increases with LA concentration
and with hydrogen concentration. Thus, the presence of mass transport resistances always
decreases overall rate. Case 4 therefore represents the maximum possible conversion in the
trickle bed, and Case 3 the minimum possible conversion. It should also be noted that the same
kinetic parameters, determined by fitting the data to the partially-wetted model (Case 1), were
used in all four models. All physical properties, wetted fractions, and mass transfer coefficients
were calculated directly from literature correlations as stated above.
The partially-wetted model (Case 1) presented in Eq. 7-2 – 7-9 predicts the outlet
conversions for all trickle bed runs reasonably well, except at low flow rates in the reactor bed
with fines (Runs 4 and 8), where it overpredicts conversion, and in the large reactor bed (Runs
15-19) where it underpredicts conversion. For the reactor bed with fines (Runs 1-8), the fully-
wetted model predicts the low flow rate conversion somewhat better – this makes sense in terms
of fines enhancing the fraction of catalyst wetted and hence matching the fully wetted model
more closely. We note that rate constants fitted to Runs 1-8 with the fully-wetted model (Case 2)
are essentially identical to those reported in Table 7-2, so the fully-wetted model is clearly
preferred for reactions in trickle beds with fines. The results for Case 3, with only the wetted
fraction reactive, clearly underpredict the experimental conversions for nearly all reactions;
results for Case 4, with no mass transfer resistances, clearly overpredict conversion, especially at
lower flow rates.

102
The value of the surface concentration (CH2,S) at the reactor inlet, given in the rightmost
column of Table 7-4, is a measure of the extent of mass transport resistances across the gas-
liquid and liquid-solid interfaces. At 353 K, where reaction is relatively slow, the value of CH2,S
is fairly close to that of the bulk liquid hydrogen concentration (0.068 M), indicating that gas-
liquid and liquid-solid mass transport cannot influence rate. As such, Cases 1, 2, and 4 give
nearly the same conversion at 353 K, because wetted and unwetted fractions give the same rate
when mass transfer resistances are minimal. At 363 K, and especially at 373 K (Runs 18-19), the
value of CH2,S in the wetted portion of the reaction is much less than the bulk liquid hydrogen
concentration, and each model predict a significantly different outlet conversion. Here the
partially wetted model gives a clearly superior fit of experimental results relative to the other
models (Cases 2-4).
In the partially-wetted model (Case 1), the reaction rate in the unwetted fraction is higher
than that in the wetted fraction, because the resistance to hydrogen transport across the liquid
film reduces the hydrogen concentration at the catalyst surface (CH2,S) in the wetted fraction of
the bed. Thus, Case 2, where the reactor is assumed fully wetted, always gives a lower
conversion than the partially-wetted model. For the partially-wetted model to be valid from a
physical standpoint, it is necessary to imagine that the wetting of the trickle bed is a dynamic
phenomenon such that the unwetted fraction is continuously replenished with the liquid phase.
This postulate appears to hold in LA hydrogenolysis, in part because the carbon support is
readily wetted by water and thus, although the liquid flows only over a portion of the catalyst
particles in the bed, the entire catalyst is internally wetted and therefore reactive.

103
Experimentally, there is little effect of fines on LA conversion in the trickle bed reactor at
high liquid flow rates (100 and 200 ml/hr), as evidenced by comparison of Runs 1, 2, 5, and 6
with Runs 9-12 in Table 7-1. This lack of influence of fines in the catalyst bed suggests that
either 1) the catalyst is partially wetted and the fines do not increase the fraction wetted, or 2) at
these flow rates the catalyst bed is nearly fully wetted with and without fines. Since the bed was
carefully packed and since the fully wetted model (Case 2) fits the experimental behavior in the
bed with fines well at low flow rates, we conclude that it is most likely that the bed is fully
wetted under the operating conditions used. Thus the correlations of Al-Dahhan et al.38
and El-
Hiswani et al.62
that were developed for hydrocarbons on metal oxides do not apparently predict
wetted fractions accurately for this aqueous phase system in which, as stated before, the carbon
support is hydrophilic. Yet despite the likelihood that these correlations underpredict fraction
wetted in this system, the reactor model accounting for partial wetting (Case 1), with the wetted
fraction predicted by the correlation of Al-Dahhan et al.38
does give the best fit of any model to
the collective experimental data and thus remains the preferred means of approaching trickle bed
modeling, especially at low liquid mass velocities. This suggests that the approach to modeling
is correct, even if the values of the wetted fractions are not.
Finally, the experimental conversions in the larger trickle bed reactor (Runs 13-18) are
greater than those predicted by the models in every experiment. The models consistently predict
the same conversion at similar residence times (catalyst mass/liquid flow rate) in small and large
beds, (Runs 10 and 13, Runs 12 and 15, Runs 3 and 14, Runs 7 and 16), but the experimentally
observed conversion in the larger reactor bed is consistently greater than that at the same
residence time in the smaller bed. The reason for this behavior is not known, but the results

104
suggest that laboratory trickle reactors should be preferably shorter rather than longer in order to
be best modeled and controlled.
7.4.2. Comparison of Batch and Trickle Bed Reaction Rates
Given that overall conversion is relatively low for the two smaller trickle catalyst beds
(<25%), we make the assumption, in accordance with the zero-order rate behavior in the batch
reactor, that hydrogenolysis rate is essentially constant in the trickle bed at these conditions. The
average reaction rate in the trickle bed is thus readily calculated via Eq. 7-12 as
RPG,G = CPG/(1-εB)/τ (7-12)
from the inlet flow rate, propylene glycol outlet concentration, and bed volume. Values of the
average rates determined from the trickle bed experiments at high flow rates in the two smaller
trickle beds are given in Table 7-3.
The average reaction rates in the trickle bed reactor (Table 7-3) approach those measured
in the batch reactor, especially in the shorter beds and with fines present. This result indicates
that the trickle bed reactors operating under these high liquid flow rates approach the intrinsic
kinetic regime of operation.
The similarity between batch and trickle bed rates is further evidence that the catalyst in
the trickle bed reactor is fully wetted, or nearly so, at these reaction conditions. As discussed
above, the fraction wetted predicted by Al-Dahhan et al.38
(εW = 0.35 at 100 ml/hr and εW = 0.44
at 200 ml/hr at these conditions) is apparently less than that actually wetted in the water/activated
carbon system present for LA hydrogenolysis. It is clear that predicting the effects of partial
wetting remains a challenging aspect of trickle bed reactor analysis.

105
The results in Table 7-3 represent, to our knowledge, one of few cases where trickle bed
reactors are purposefully operated in a “differential” model to achieve rates similar to those
obtained in a batch reactor. It is also noteworthy that product selectivity, which is a second major
issue in relating batch and trickle bed reactors, especially with biorenewable substrates, is similar
in both reactors under these conditions. It is therefore possible to approach intrinsic kinetic rates
and selectivity in a trickle bed reactor, albeit at conditions (e.g. high flow rates and low
conversions) that are far from those that would be chosen to optimize product yields in feasibility
or screening studies.
7.5. Conclusions
Laboratory-scale trickle bed reactors must be used carefully in order to characterize
heterogeneous reaction systems such as lactic acid hydrogenolysis that are gaseous reactant
limited. Under conditions of high flow rate and low temperature, and thus low reactant
conversion, it is possible to approach intrinsic kinetic reaction rates that are similar to those
found in conventional stirred batch systems. Under such conditions, the trickle bed approaches
fully-wetted behavior and essentially acts as a differential reactor. These conditions are thus
preferable for fundamental characterization of reaction kinetics and pathways.
Applying results of laboratory trickle bed reactor experiments at conditions aimed at
maximizing conversion and product yields must be done with caution, as the effects of partial
wetting and mass transport disguise reaction kinetics and product selectivities. It is possible to
model reactor behavior under these conditions by including wetting and mass transport, but
results must be viewed carefully in light of the challenges of predicting fractional wetting and
mass transport coefficients for different physical systems. Nevertheless, the use of such models,

106
based on intrinsic kinetics developed in batch reactors, appears to be a step forward in
understanding trickle bed behavior and in facilitating reasonable scale-up of trickle reactor
systems.

107
Chapter 8 Conclusion and Recommendations for Future Work
During the course of my thesis projects discussed in the prior chapters, systematic
investigation was carried out to screen multiple proprietary catalysts in terms of glycerol
conversion and selectivity toward propylene glycol in the batch reactors. Process optimization
was done with attention paid to catalyst loadings, temperature, reaction pressure, various organic
solvents other than water, and impurities present in the commercial manufacturing. This
investigation in the batch reactors provided important information and feedback to our project
collaborator and helped guide through catalyst synthesis and preparation.
Based on the study in the batch reactors, some candidates were selected for catalyst scale-
up in a pilot scale trickle bed reactor to investigate how flow dynamics influence the catalysis
and kinetics of glycerol hydrogenolysis system. Partial wetting of catalyst particle has a
pronounced effect on glycerol conversion and reaction rates, and a 5 to 10 K temperature profile
was observed along the catalyst bed central axis. All the assumptions adopted during the model
establishment were thoroughly examined by simplifying the original comprehensive model.
Predictions from such simplified models were compared with the experimental results and the
simulation from original comprehensive model, which proves and justifies the usage of
assumptions.
With all the experimental data available from vigorous runs from both MSU and PNNL
trickle beds, mechanistically based model was established to integrate mass and energy transfer
and partial wetting phenomenon for the data collected in PNNL. This comprehensive model
gives a reasonable simulation of the catalyst bed and a prediction of glycerol conversion over a

108
wide range of conditions. Moreover, temperature gradient observed inside the trickle bed was
simulated, too. Model gives a realistic depiction for isothermal bed.
Since experiments were run in both batch and trickle bed reactors, intrinsic rate correlation
was considered for the next stage of this research for a better understanding of reaction kinetics
and a possibly faster screening process. Given few side products and high selectivity, lactic acid
hydrogenolysis was chosen for this part of research. Our study shows that intrinsic reaction rate
stays the same regardless the reactors as long as the reaction lies in the intrinsic reaction regime.
Mechanistically based model for lactic acid hydrogenolysis predicts outlet conversion in the
trickle bed well. As for the future work, I will recommend three points for the consideration:
1. Other active metals or oxides should be tested for the possible constituents.
There are a great number of literatures that investigated other active metals for glycerol
hydrogenolysis. Ruthenium and platinum were studied by Maris et al.15
with carbon as
support. Wang et al.16
studied Cu-ZnO catalyst for glycerol hydrogenolysis. Mane et al.17
tried copper and aluminum for this process. Other candidates include iron, chromium,
magnesium oxide, and palladium.63-66
2. Surface structure and treatment is correlated to catalyst performance and explore alternative
reaction pathway and catalysis mechanism.
A great deal of efforts in this research was made to understand mass transport limit and
interaction between catalyst particle surface and reactants by calculating Weisz-Prater
numbers, for instance. On the other hand, catalyst surface structure and how to treat the
surface and modify the structure often has a significant impact on the catalyst activity and

109
potentially change reaction mechanism and route. This structure-performance correlation has
been a popular topic for catalysis research in recent years with advanced characterization
instruments widely available.67-69
It gives the direct information about the interaction
between catalyst active size, reactants, and intermediates, and therefore makes it possible or
easier to elucidate the catalysis mechanism and pathway. It also helps evaluate a specific
support material.
3. Better understanding partial wetting and its effect on the reaction by conducting reactions in
a trickle bed reactor with reactants recycled. At present, the trickle bed used in our research
facility does not recycle the reactants. In order to improve system efficiency, exiting liquid
phase should be redirected to the top of trickle bed for a better conversion. Given the
phenomenon we have observed thus far that unwetted fraction of catalyst surface contributes
more to the overall reaction rate, feed flow rate or feed pumping speed needs to be
thoroughly investigated along with bed holdup and resident time.

110
APPENDICES

111
Appendix A. Detailed Derivation of Kinetic Model
Our model of glycerol hydrogenolysis investigated steady state scenario when all data
were collected and where catalyst was partially wetted. The establishment of this model started
with reaction mechanism proposal. Based on the available literature regarding typical
hydrogenolysis process, the mechanism proposal here works as follows:
The reaction starts with glycerol dehydrogenolysis on catalyst surface. Intermediate GA·S
will then turn into intermediate I·S under basic environment, which is followed by
hydrogenolysis to product propylene glycol.
The rate expression for each step shown above can be written as following when reaction
system reaches equilibrium:
At steady state all three reaction rates equal and therefore
In order to development model in terms of glycerol, base, and hydrogen, terms involving
intermediates such as GA·S, I·S, and free catalyst surface S should be eliminated. To solve
1
1
2
2
3
2
2
k
k
k
k
k
GO S GA S H
GA S OH I S OH
I S H PG S
2
2
1 1 1
2 2 2
3 3
GO S GA S H
G A S I SOH OH
I S H
r k C C k C C
r k C C k C C
r k C C
1 2 3r r r

112
equation group with three unknown variables, three independent equations are needed. Steady
state provides two, and one boundary condition is required.
This boundary condition depicts free catalyst surface and surface occupied by
intermediates such as GA·S and I·S add up to the total catalyst surface.
With all three equations available, the relationship between variables can be determined:
3 22 1
2 1 3 2 12 23 2
2 2
2GO
GA S SH OH
H HOHH
OH
k C k C k CC C
k C k k C k k Ck C
k C k
Since GA·S and I·S concentration has been denoted in terms of Cs, Cs can be determined
as follows:
Total S GA S I SC C C C
3 2212
21 3 2 12 23 2
2 2
1 1GOS
H OH
H H OHH
OH
k C k Ck CC
k Ck k C k k Ck C
k C k
total S G A S I SC C C C
12
1 3 2 12 23 2
2 2
GO SI S
H HH
OH
k C CC
k k C k k Ck C
k C k

113
where Ctotal is known through chemisorption performed on Micromeritics ASAP 2010.
Therefore, reaction rate expression can be further written as:
3 3 2I S Hr r k C C
3 122
31 3 2 1 22 2 1 23 2 2
2 2 21 3 2 12 23 2
2 2
1 1
GO TotalH
HH H OHGOH
H HOH OHH
OH
k C k C C
k C k Ck k C k k C k Ck C
k C k k Ck k C k k Ck C
k C k
After rearrangement, reaction rate expression becomes
Simplify this reaction rate expression by dismissing two cross terms in denominator while
retaining dependencies on hydrogen and base:
Therefore, simplified reaction rate expression is
where
23 2 2 1( ) H OHk k k k C C
21 3 H GOk k C C
2
2
1 2
f H GO OH
GO H HOH
k C C Cr r
C C K C
( / )1 2 30
1 2 2 1
1 31 2 2 1
aE RTtotalf
H
k k k Ck k ek k k k
and
k kK k k k k
21
2 2 2
1 2 3
23 2 2 1 1 2 2 1 1 3 1 3( ) ( )
total H GO OH
H GO H H GOOH OH
k k k C C C Cr
k k k k C C k k k k C C k k C k k C C

114
Appendix B. Corrected Derivation of Kinetic Model
Our model of glycerol hydrogenolysis investigated steady state scenario when all data
were collected and where catalyst was partially wetted. The establishment of this model started
with reaction mechanism proposal. Based on the available literature regarding typical
hydrogenolysis process, the mechanism proposal here works as follows:
The reaction starts with glycerol dehydrogenolysis on catalyst surface. Intermediate GA·S
will then turn into intermediate I·S under basic environment, which is followed by
hydrogenolysis to product propylene glycol.
The rate expression for each step shown above can be written as following when reaction
system reaches equilibrium:
At steady state, all three reaction rates equal and therefore
In order to development model in terms of glycerol, base, and hydrogen, terms involving
intermediates such as GA·S, I·S, and free catalyst surface S should be eliminated. To solve
1
1
2
2
3
2
22
k
k
k
k
k
GO S GA S H
GA S OH I S OH
I S H PG S
2
2
1 1 1
2 2 2
23 3
GO S GA S H
G A S I SOH OH
I S H
r k C C k C C
r k C C k C C
r k C C
1 2 3r r r

115
equation group with three unknown variables, three independent equations are needed. Steady
state provides two, and one boundary condition is required.
This boundary condition depicts free catalyst surface and surface occupied by
intermediates such as GA·S and I·S add up to the total catalyst surface. With all three equations
available, the relationship between variables can be determined:
2 2 2
1 2
3 2 2 21 2 1 3 2 2 2 3 2 2
GO S OHI S
H H HOH OHOH OH
k k C C CC
k k C C k k C k k C k k C C k k C
2
2 2 2
21 2 3
3 2 21 2 1 3 2 2 2 3
( )GO S HOHG S
H H HOH OHOH
k C C k C k CC
k k C C k k C k k C k k C C
Given the boundary condition listed above, Cs can be solved with CI·S and CG·S
available
2 2
2 2
2 21 2 2 3 2 2
2 21 2 1 2 3 2 2 1 2
( )( )
( )( )
total H HOH OH OHS
H GO GOHOH OH OHOH
C k C k C k C k C k k CC
k C k C k C k C k C k k C k k C C
and r3.
2
2 2 2 2
21 2 3
3 2 2 31 2 2 3 1 3 1 3 1 2 2( )
total GO HOH
H GO GOH H HOH OH OH
k k k C C C Cr
k k C C k k C C k k C C k k C k k k C C
Simplify this reaction rate expression by dismissing three cross terms in denominator while
retaining dependencies on hydrogen and base:
total S G A S I SC C C C

116
21 2 H OH
k k C C ,
2
22 3 HOH
k k C C ,
and 2
21 3 GO Hk k C C .
Final simplified intrinsic rate expression is
2
2
2
3 3
f GO HOH
GO H HOH
k C C Cr
C C K C
where 2 32 2( )
totalf
k k Ck k k
and 1 31 2 2( )H
k kK k k k

117
Appendix C. Microsoft Excel Macro Program
Solutions to the cubic equation are found with macro program which was written to
perform solver functionality at each incremental distance throughout the trickle bed reactor.
In order to run this macro, you need to open the spreadsheet of interest and click
TOOLS>MACRO>MACROS. When a window pops up, copy and paste the following program
into the window:
**********************************************************************
Sub Macro1()
'
' Macro1 Macro
' Macro recorded 2/14/2007 by Stazy
'
currentrow = U
Do Until currentrow > V
SolverOk SetCell:="$X" & currentrow, MaxMinVal:=3, ValueOf:="0",
ByChange:="$Y" & currentrow
SolverSolve userFinish:=True
SolverFinish keepFinal:=1
currentrow = currentrow + 1
Loop
End Sub
************************************************************************

118
X and Y in the macro program stand for two columns in the spreadsheet. X is cubic
equation expression, and Y is the solution to it. U indicates the starting point for the iteration and
V for the end.
Despite of macro’s versatility, some adjustments to the solver in the individual
spreadsheet are needed given the fact that cubic equation has three solutions in theory. However,
not all the mathematical solutions make sense from chemical kinetic perspectives. Some
conditions are needed in order for solver to produce sensible solution which makes mass fluxes
across interfaces equal each other.

119
REFERENCES
120
REFERENCES
[1] Gunkel, D. (2006). Alternative energy sources. Detroit: Greenhaven Press.
[2] Sheahan, R. (1981). Alternative energy sources: a strategy planning guide. Rockville, Md: Aspen Systems Corp.
[3] Berinstein, P. (2001). Alternative energy: facts, statistics, and issues. Westport, CT: Oryx Press.
[4] Baumgartner, T. and Burns, T. (1984). Transitions to alternative energy systems: entrepreneurs, new technologies, and social change. Boulder: Westview Press.
[5] Maclean, H. (2004). Alternative transport fuels for the future. Int. J. Vehicle Des. 35 (1-2), 27-49.
[6] Scott, Elinor , Peter, F, et al. (2007). Biomass in the manufacture of industrial products - the use of proteins and amino acids. Appl. Microbiol. Biot. 75 (4), 751- 762.
[7] Huber, George W, Corma, Avelino. (2007). Synergies between bio- and oil refineries for the production of fuels from biomass. Angew. Chem. Int. Edit. 46 (38), 7184-7201.
[8] Wise, D. (1981). Fuel gas production from biomass. Boca Raton, Fla: CRC Press.
[9] Passero, B. (2006). Energy alternatives. Detroit: Greenhaven Press/Thomson Gale.
[10] Hall, C. (1981). Biomass as an alternative fuel. Rockville, Md: Government Institutes.

121
[11] Montharu, J., Le Guellec, S. and Kittel, B. et al. (2010). Evaluation of lung tolerance of ethanol, propylene glycol, and sorbitan monooleate as solvents in medical aerosols. J. Aerosol. Med. Pulm. D. 23 (1), 41-46.
[12] Herkenne, C., Naik, A., and Kalia, Y. et al. (2008). Effect of propylene glycol on ibuprofen absorption into human skin in vivo. J. Pharm. Sci. 97 (1), 185-197.
[13] Yang, K. et al. (2006). Dendrimers for pharmaceutical and biomedical applications. J. Biomat. Sci-Polym. E. 17 (1-2), 3-19.
[14] Alli, A, Hazer, B, Menceloglu, Y, et al. (2006). Synthesis, characterization and surface properties of amphiphilic polystyrene-b-polypropylene glycol block copolymers. Eur. Polym. J. 42 (4), 740-750.
[15] Maris, E., Davis R. (2007). Hydrogenolysis of glycerol over carbon-supported Ru and Pt catalysts. J. Catal. 249 (2), 328-337.
[16] Wang S., Liu, H. (2007). Selective hydrogenolysis of glycerol to propylene glycol on Cu-ZnO catalyst. Catal. Lett. 117 (1-2), 62-67.
[17] Mane, R., Hengne, A., Ghalwadkar, A. et al. (2010). Cu : Al nano catalyst for selective hydrogenolysis of glycerol to 1, 2-propanediol. Catal. Lett. 135 (1-2), 141- 147.
[18] Casale, B. and Gomez, A. (1994). Catalytic method of hydrogenating glycerol. US Patent 5,276,181.
[19] Schuster, L. and Eggersdorfer, M. (1997). Preparation of 1,2-propanediol. US Patent 5,616,817.
[20] Werpy, T., Fyre, J. and Zacher, A. et al. (2005). Hydrogenolysis of 6-Carbon Sugars and Other Organic Compounds. US Patent 6,841,085 B2.
[21] Hass, T., Neher, A., Arntz, D. et al. (1995). Process for the Simultaneous Production of 1,2- and 1,3- propanediol. US Patent 5,426,249.

122
[22] Miyazawa, T., Koso, S. et al. Glycerol hydrogenolysis to 1,2-propanediol catalyzed by a heat-resistant ion-exchange resin combined with Ru/C. Appl. Catal. A-Gen. 329, 30-35. [23] Suppes, G., Dasari, M., and Kiatsimkul, Pim-Pahn et al. (2005). Low-Pressure Hydrogenolysis of Glycerol to Propylene Glycol. App.Catal. A: Gen. 281, 225- 231.
[24] Shanks, B., and Lahr, D. (2003). Kinetic Analysis of the Hydrogenolysis of Lower Polyhydric Alcohols: Glycerol to Glycols. Ind. Eng. Chem. Res. 42, 5467-5472.
[25] Dudukovic, M., and Larachi, F. et al. (1999). Multiphase reactors-revisited. Chem. Eng. Sci. 54 (13-14), 1975-1995.
[26] Dudukovic, M. (1999). Trends in catalytic reaction engineering. Catal. Today. 48 (1- 4), 5-15.
[27] Biardi, G., Baldi, C. (1999). Three-phase catalytic reactors. Catal. today. 52, 223- 234.
[28] Wang, T., Wang, J., Jin, Y. (2007) Slurry Reactors for Gas-to-Liquid Processes: A Review. Ind. Eng. Chem. Res. 46 (18), 5824-5847.
[29] Chaudhari, R., Mills, P. Multiphase catalysis and reaction engineering for emerging pharmaceutical processes. Chem. Eng. Sci. 59 (22-23), 5337- 5344
[30] Dudukovic, M., Larachi, F., Mills, P. (2002). Multiphase catalytic reactors: a perspective on current knowledge and future trends. Catal. Rev. 44 (1), 123-246.
[31] Al-Dahhan, M. and Dudukovic, M. et al. (1996). Catalyst bed dilution for improving catalyst wetting in laboratory trickle-bed reactors. AICHE J. 42 (9), 2594-2606.
[32] Dianetto, A., Specchia, V. (1992). Trickle-bed reactors: state of art and prospectives. Chem. Eng. Sci. 47 , 3197-3213.
[33] Schubert, M., Bauer, T., and Lange, R. (2006). Unsteady-state operation for
123
enhancement of the performance of technical trickle-bed reactors. Chemie. Ingenieu. Technik. 78 (8),1023-1032.
[34] Larachi, F., Cassanello, M. et al. (1998). Gas-liquid interfacial mass transfer in trickle-bed reactors at Elevated Pressures. Ind. Eng. Chem. Res. 37, 718-733.
[35] Iliuta, I., Ortiz-Arroyo and Arturo et al. (1999). Hydrodynamics and mass transfer in trickle bed reactor: an overview. Chem. Eng. Scien. 54, 5329- 5337.
[36] Al-Dahhan, M., Larachi, F., Dudukovic, M., Laurent, A. (1997). High-pressure trickle-bed reactors : a review. Ind. Eng. Chem. Res. 36 (8), 3292-3314.
[37] Huang, X. and Varma, A. et al. (2004). Heat transfer characterization of gas- liquid flows in a trickle bed. Chem. Eng. Sci. 59 (15), 3767-3776.
[38] Al-Dahhan M. and Dudukovic, M. (1995). Catalyst Wetting Efficiency in trickle bed reactors at high pressure. Chem. Eng. Sci. 50, 2377-2389.
[39] Tronconi, E., Ferlazzo, N. et al. (1992). A mathematical model for the catalytic hydrogenolysis of carbohydrates. Chem. Eng. Sci., 47, 2451-2456.
[40] Linke, W. F. and Seidell, A. (1958). Solubilities, inorganic and metal organic
compounds; a compilation of solubility data from the periodical literature. Vol. I. 4th
Ed., Van Nostrand : Princeton, New Jersey.
[41] Smith, J.M. (1981). Chemical Engineering Kinetics, 3rd Ed., McGraw-Hill: New York.
[42] Goto, S. and Smith. J. (1975). Trickle-bed reactor performance. Part I. holdup and mass transfer effects. AICHE J. 21 (4), 706-713.
[43] Perry, R., Green, D., and Maloney, J. (1997). Perry’s Chemical Engineering

124
Handbooks. McGraw-Hill: New York.
[44] Mederos, F., Ancheyta, J., and Chen, J. (2009). Review on criteria to ensure ideal behaviors in trickle-bed reactors. Appl. Catal. A: Gen. 355, 1-19.
[45] Maiti, R. and Nigam, K. (2007). Gas-liquid distributors for trickle-bed reactors: a review. Ind. Eng. Chem. Res. 46, 6164-6182.
[46] Bhaskar, M., Valavarasu, G., Sairam, B. and Balaraman, K. (2006). Performance evaluation of certain commercial hydrotreating catalysts in a pilot plant reactor. 24 (2), 217-234.
[47] Chen, J., Wang, N., Mederos, F. and Ancheyta, J. (2009). Vapor-liquid equilibrium study in trickle-bed reactor. Ind. Eng. Chem. Res. 48, 1096-1106.
[48] Mogalicherla, A., Sharma, G., and Kunzru, D. (2009). Estimation of wetting efficiency in trickle-bed reactors for nonlinear kinetics. 48, 1443-1450.
[49] Metaxas, K. and Papayannakos, N. (2006). Kinetics and mass transfer of benzene hydrogenolysis in a trickle-bed reactor. Ind. Eng. Chem. Res. 45, 7110-7119.
[50] Eftaxias, A., Font, J., Fortuny, A., Fabregat, A., and Stuber, F. (2005). Kinetics of phenol oxidation in a trickle bed reactor over active carbon catalyst. J. Chem. Technol. Biot. 80, 677-687.
[51] Popken, T., Geisler, R. and Gotze, L. et al. (1999). Reaction kinetics and reactive distillation – on the transfer of kinetic data from a batch reactor to a trickle-bed reactor. Chem. Eng. Technol. 21(5), 401-404.
[52] Hickman, D., Weidenbach, M. and Friedhoff D. (2004). A comparison of a batch recycle reactor and an integral reactor with fines for scale-up of an industrial trickle bed reactor from laboratory data. Chem. Eng. Sci. 59, 5425-5430.
[53] Kulkarni, R., Natividad, R., Wood, J., Stitt, E., and Winterbottom, J. (2005). A comparative study of residence time distribution and selectivity in a monolith CDC reactor and a trickle bed reactor”, Catal. Today, 105, 455-463.

125
[54] Manole, C., Julcour-Lebigue, C., Wilhelm, A., and Delmas, H. (2007). Catalytic oxidation of 4-hydroxybenzoic acid on activated carbon in batch autoclave and fixed-bed reactors. Ind. Eng. Chem. Res. 46, 8388-8396.
[55] Guettel, R. and Turek, T. (2009). Comparison of different reactor types for low temperature Fischer-Tropsch systhesis: a simulation study. Chem. Eng. Sci. 64, 955- 964.
[56] Zhang, Z., Jackson, J., and Miller, D. (2008). Effect of biogenic fermentation impurities on lactic acid hydrogenolysis to propylene glycol. Bioresource Technol. 99, 5873-5880.
[57] Chen, Y., Miller, D., and Jackson, J. (2007). Kinetics of aqueous-phase hydrogenolysis of organic acids and their mixtures over carbon supported ruthenium catalyst. Ind. Eng. Chem. Res. 46, 3334-3340.
[58] Cortright, R., Sanchez-Castillo, M. and Dumesic J. (2002). Conversion of biomass to 1,2- propanediol by selective catalytic hydrogenolysis of lactic acid over silica- supported copper. Appl. Catal. B: Environ. 39, 353-359.
[59] Zhang, Z., Jackson, J. and Miller, D. (2002). Kinetics of aqueous-phase hydrogenation of lactic acid to propylene glycol. Ind. Eng. Chem. Res. 41(4), 691- 696.
[60] Tsamatsoulis, D., Al-Dahhan, M., Larachi, F. and Papayannakos, N. (2001). The effect of particle dilution on wetting efficiency and liquid film thickness in small trickle beds. Chem. Eng. Commu. 185, 67-77.
[61] Lee, H. (1985). Heterogeneous reactor design. Boston: Butterworth Publishers.
[62] El-Hisnawi, A.A.; Dudukovic, M.P.; Miller, P.L. (1982). Trickle bed reactors: dynamic tracer test, reaction studies, and modeling of reactor performance. ACS Symposium Series, 196, 431.
[63] Anand, K.A., Anisia, K.S., Agarwal, A.K., et al.(2010). Hydrogenolysis of glycerol
126
with FeCo macrocyclic complex bonded to Raney Nickel support under mild reaction conditions. Can. J. Chem. Eng. 88 (2), 208-216.
[64] Kim, N.D., Oh, S., Joo, J.B., et al. (2010). Effect of preparation method on structure and catalytic activity of Cr-promoted Cu catalyst in glycerol hydrogenolysis. Korean J. Chem. Eng. 27 (2), 431-434. [65] Guo, X.H., Li, Y., Shi, R. J., et al. (2009). Co/MgO catalysts for hydrogenolysis of glycerol to 1, 2-propanediol. Appl. Catal. A-Gen. 371 (1-2), 108-113.
[66] Musolino, M.G., Scarpino, L.A., Mauriello, F., et al. (2009). Selective transfer hydrogenolysis of glycerol promoted by palladium catalysts in absence of hydrogen. Green Chem. 11(10), 1511-1513.
[67] Huang, Z.W., Cui, F., Kang, H.X., et al. (2008). Highly dispersed silica-supported copper nanoparticles prepared by precipitation-gel method: A simple but efficient and stable catalyst for glycerol hydrogenolysis. Chem. Mater. 20(15), 5090-5099.
[68] Shinmi, Y., Koso, S., Kubota, T., et al. (2010). Modification of Rh/SiO2 catalyst for the hydrogenolysis of glycerol in water. Appl. Catal. B-Environ. 94(3-4), 318-326.
[69] Tanksale A, Beltramini JN, Dumesic JA, et al.(2008). Effect of Pt and Pd promoter on Ni supported catalysts - A TPR/TPO/TPD and microcalorimetry study. J. Catal. 258(2), 366-377.