Catalytic activity of cytochromes c and c1 in mitochondria and submitochondrial particles
16
Biochimica et Biophysica Acta, 430 (1976) 30-45 ~) Elsevier Scientific Publishing Company, Amsterdam - Printed in The Netherlands BBA 47070 CATALYTIC ACTIVITY OF CYTOCHROMES c AND cl IN MITOCHONDRIA AND SUBMITOCHONDRIAL PARTICLES PETER NICHOLLS* Institute of Biochem&try, Odense University, Niels Bohrs Alld, DK 5000 Odense (Denmark) (Received September 8th, 1975) SUMMARY 1. Beef heart mitochondria have a cytochrome c I : c : aa a ratio of 0.65 : 1.0 : 1.0 as isolated; Keilin-Hartree submitochondrial particles have a ratio of 0.65 : 0.4 : 1.0. More than 50 ~ of the submitochondrial particle membrane is in the 'in- verted' configuration, shielding the catalytically active cytochrome c. The 'endoge- nous' cytochrome c of particles turns over at a maximal rate between 450 and 550 s- t during the oxidation of succinate or ascorbate plus TMPD; the maximal turn- over rate for cytochrome c in mitochondria is 300-400 s-1, at 28°-30°C, pH 7.4. 2. Ascorbate plus N,N,N',N'-tetramethyl-p-phenylene diamine added to anti- mycin-treated particles induces anomalous absorption increases between 555 and 565 nm during the aerobic steady state, which disappear upon anaerobiosis; succinate addition abolishes this cycle and permits the partial resolution of cytochrome cl and cytochrome c steady states at 552.5-547 nm and 550-556.5 nm, respectively. 3. Cytochrome c~ is rather more reduced than cytochrome c during the oxida- tion of succinate and of ascorbate+N,N,N',N'-tetramethyl-p-phenylene diamine in both mitochondria and submitochondrial particles; a near equilibrium condition exists between cytochromes c I and c in the aerobic steady state, with a rate constant for the c~ ~ c reduction step greater than 103 s -1. 4. The greater apparent response of the c/aa3 electron transfer step to salts, the hyperbolic inhibition of succinate oxidation by azide and cyanide, and the kinetic behaviour of the succinate-cytochrome c reductase system, are all explicable in terms of a near-equilibrium condition prevailing at the cl/c step. Endogenous cyto- chrome c of mitochondria and submitochondrial particles is apparently largely bound to cytochrome aa3 units in situ. Cytochrome cl can either reduce the cyto- chrome e-cytochrome aa3 complex directly, or requires only a small extra amount of cytochrome c to carry the full electron transfer flux. Abbreviations: TMPD, N,N,N',N" tetramethyl-p-phenylene diamine; FCCP, trifluoromethoxy° carbonylcyanide phenyl hydrazone. EGTA, ethyleneglycol-bis (fl-amino ethyl ether) N,N" tetra- acetic acid. ~r Present Address: Department of Biological Sciences, Brock University, St. Catharines, Ontario, L2S 3AI, Canada.
-
Upload
peter-nicholls -
Category
Documents
-
view
212 -
download
0
Transcript of Catalytic activity of cytochromes c and c1 in mitochondria and submitochondrial particles

Biochimica et Biophysica Acta, 430 (1976) 30-45 ~) Elsevier Scientific Publishing Company, Amsterdam - Printed in The Netherlands
BBA 47070
CATALYTIC ACTIVITY OF CYTOCHROMES c A N D cl IN M I T O C H O N D R I A
A N D S U B M I T O C H O N D R I A L PARTICLES
PETER NICHOLLS*
Institute of Biochem&try, Odense University, Niels Bohrs Alld, D K 5000 Odense (Denmark)
(Received September 8th, 1975)
SUMMARY
1. Beef heart mitochondria have a cytochrome c I : c : aa a ratio of 0.65 : 1.0 : 1.0 as isolated; Keilin-Hartree submitochondrial particles have a ratio of 0.65 : 0.4 : 1.0. More than 50 ~ of the submitochondrial particle membrane is in the 'in- verted' configuration, shielding the catalytically active cytochrome c. The 'endoge- nous' cytochrome c of particles turns over at a maximal rate between 450 and 550 s - t during the oxidation of succinate or ascorbate plus TMPD; the maximal turn- over rate for cytochrome c in mitochondria is 300-400 s-1, at 28°-30°C, pH 7.4.
2. Ascorbate plus N,N,N',N'-tetramethyl-p-phenylene diamine added to anti- mycin-treated particles induces anomalous absorption increases between 555 and 565 nm during the aerobic steady state, which disappear upon anaerobiosis; succinate addition abolishes this cycle and permits the partial resolution of cytochrome cl and cytochrome c steady states at 552.5-547 nm and 550-556.5 nm, respectively.
3. Cytochrome c~ is rather more reduced than cytochrome c during the oxida- tion of succinate and of ascorbate+N,N,N',N'-tetramethyl-p-phenylene diamine in both mitochondria and submitochondrial particles; a near equilibrium condition exists between cytochromes c I and c in the aerobic steady state, with a rate constant for the c~ ~ c reduction step greater than 10 3 s -1.
4. The greater apparent response of the c/aa3 electron transfer step to salts, the hyperbolic inhibition of succinate oxidation by azide and cyanide, and the kinetic behaviour of the succinate-cytochrome c reductase system, are all explicable in terms of a near-equilibrium condition prevailing at the cl/c step. Endogenous cyto- chrome c of mitochondria and submitochondrial particles is apparently largely bound to cytochrome aa3 units in situ. Cytochrome cl can either reduce the cyto- chrome e-cytochrome aa3 complex directly, or requires only a small extra amount of cytochrome c to carry the full electron transfer flux.
Abbreviations: TMPD, N,N,N',N" tetramethyl-p-phenylene diamine; FCCP, trifluoromethoxy° carbonylcyanide phenyl hydrazone. EGTA, ethyleneglycol-bis (fl-amino ethyl ether) N,N" tetra- acetic acid.
~r Present Address: Department of Biological Sciences, Brock University, St. Catharines, Ontario, L2S 3AI, Canada.

31
INTRODUCTION
The membrane location, and the quantitative catalytic activity, ofcytochrome c in mitochondria and endogenous cytochrome c in submitochondrial particles, are not precisely known. I have suggested (see ref. 1) that mitochondrial cytochrome c is largely bound to cytochrome aa3 and that the reaction between cytochromes el and c is rather rapid, perhaps involving a direct oxidation of cl by the c-an3 complex, as originally proposed by Orii et al. [2]. Alternative models have been put forward [3, 4] in which the oxidation of cytochrome c by the aa3 system does not involve a defined complex, and in which the oxidation of c by a is faster than the oxidation of c a by c.
The creation of the cytochrome oxidase vesicle, or proteoliposome [5, 6], both with external cytochrome c and internal cytochrome c as cofactor [7], a prac- tical consequence of the theoretical advances made by Mitchell [8] and Bangham [9], demands a reexamination of the behaviour of cytochrome c, and the membrane com- ponents with which it interacts, in both mitochondria and submitochondrial par- ticles. Is the catalytic action of cytochrome c in the proteoliposome kinetically simi- lar to that in its natural membrane milieu?
In the mitochondrial membrane the response of cytochrome c to ascorbate plus NNN'N ' - tetramethyl-p-phenylene diamine (TMPD) can be compared with the response to a substrate such as succinate. The kinetics and spectroscopy of the TMPD-c interaction have been outlined by Mustafa and his coworkers [10, 11], and reexamined with the soluble oxidase by Kimelberg and Nicholls [12]. To obtain tentative values for the kinetic constants involved, the present experiments extend these studies and attempt (a) to allow for, or eliminate, the kinetic and spectroscopic anomalies that sometimes occur in the presence of TMPD [13 ], and (b) to distinguish the behaviour of cytochromes cl and c by appropriate spectroscopic criteria (cf. ref. 14, 15).
A preliminary version of this paper was communicated at the International Symposium on Electron Transfer Chains and Oxidative Phosphorylation, Fasano (Bari, 1975) [16].
MATERIALS AND METHODS
Keilin-Hartree type submitochondrial particles from beef heart were prepared as described previously [17]. Cytochrome c-reconstituted preparations were prepared by incubating normal particles (10mg. m1-1) with high concentrations (0.5-1.0 mM) of horse heart cytochrome e at a low ionic strength (10 mM phosphate or Tris, pH 7.3-7.6), followed by a brief (12 × 5 s bursts) sonication, setting 1.0 (Branson Probe sonifier B-12). Uncombined (exogenous) cytochrome c was then removed by dilution five-fold with 0.1 M phosphate pH 7.4, centrifugation at l0 s ×9 for 30 rain followed by two washings with 0.1 M phosphate. Particles treated in a similar way without sonication accumulated almost as much extra cytochrome c, but retention was erratic.
Rat liver mitochondria were prepared according to Myers and Slater [18], with some media according to Chappell and Hansford [19]. Cytochrome c-deficient rat liver mitochondria were made using the method of Jacobs and Sanadi [20]. Rat

32
heart and beef heart mitochondria were made according to Chappell and Hansford [19] or to Tyler and Gonze [21]. Digitonin particles were prepared from beef heart mitochondria by the procedure of Elliott and Haas [22].
Cytochrome aa3 was isolated from beef heart following the modified deoxy- cholate method of van Buuren [23]. Cytochrome c was Sigma Type VI horse heart, used without further treatment.
Deoxycholate particles were obtained by treating Keilin-Hartree particles (approx. 10 rag" m1-1 protein) with l ~ deoxycholate solutions [24] immediately before use. Such deoxycholate particles were diluted out for oxygen electrode assay at least 80-fold, giving a residual deoxycholate concentration ~ 0.0125 ~.
Potassium ascorbate solutions (1 M) were prepared by neutralization of L- ascorbic acid (Merck, G. F. R.) and stored frozen. TMPD solutions were made from N,N,N' ,N ' - te tramethyl -p-phenylenediamine dihydrochloride (BDH Chemicals) immediately before use. Potassium succinate solutions (1 M) were prepared by neutralization of succinic acid (Merck, G. F. R.). Rotenone was from BDI-I Chemi- cals, antimycin solutions were made up in ethanol from Sigma Co. antimycin. Tri- fluoromethoxycarbonylcyanide phenyl hydrazone (FCCP) was the gift of Dr. P. G. Heytler, Du Pont Co. Cholic acid (sodium salt) and deoxycholic acid (sodium salt) were from Merck, EDTA and ethyleneglycol-bis(fl-amino ethyl ether) N,N'-tetra-acetic acid (EGTA) from Sigma, Tween-80 from Bie and Berntsen A/S, Copenhagen.
Spectrophotometry was carried out (standard 1 cm, 3 ml cells) with Perkin- Elmer Hitachi 356 (dual wavelength) or Cary 118C (split beam-scanned spectra) instruments at temperatures from 27-32 °C. Oxygen electrode measurements used a Radiometer Clark type electrode with teflon membrane coupled to a Keighley amplifier and Servoscribe recorder. The total reaction volume was 3.8 ml in a 10 ml beaker held at 30 °C.
Cytochrome aa 3 concentration is determined by A E m M (red-ox) 605-630 n m = 27; cytochromes c + c l by AEmM (red-ox), 551-540 nm = 20; and cytochromes c and c~ separately (see caveats in text) by AEmM (red-ox), 550--556.5 nm = 19.7 and 552.5-547 nm----15.6, respectively. Protein concentrations were obtained ac- cording to Gornall et al. [25].
RES ULTS
Table I lists the calculated cytochrome c and c 1 concentrations in the four beef heart preparations obtained as given above. The only significant variation is in measured cytochrome c concentration. In agreement with Vanneste [15], intact beef heart mitochondria have a c : aa 3 ratio (where 1 aa3 = 2 haem a) close to 1.0. Digitonin particles, which have a membrane orientation similar to that in intact mitochondria [26, 27], show a cytochrome c content not much less than the parent mitochondria. Keilin-Hartree particles, with a partially inverted configuration [24], retain about 0.4 equivalents of cytochrome c per mole cytochrome an3. This cyto- chrome c cannot be removed by salt washing, and may be associated with 'inacces- sible' (inward-facing) cytochrome oxidase units. Thus maximal turnover of intact particles with ascorbate and added cytochrome c is 180 s-1 (electrons/s per aa 3), 40 of the value (450 s -a) for deoxycholate-treated particles. Succinate oxidase activity without added cytochrome c is about 60 ~ of that with exogenous cytochrome c

33
TABLE I
CONCENTRATIONS OF CYTOCHROMES c AND cl RELATIVE TO CYTOCHROME aaa 1N PREPARATIONS OF MITOCHONDRIA AND SUBM[TOCHONDRIAL PARTICLES
Preparation Concentration (pmol/Hmol aa3)***
C CI. C~C I
1. Beef heart mitochondria* 1.05 0.6 1.6 2. Beef heart digitonin particles* 0.65-0.80 0.6 1.25 3. Beef heart 0.3 -0.4 0.65 1.1
(Keilin-Hartree) particles* 4. Beef heart 0.6 -1.5 0.65 1.2-2.2
(cytochrome c-repleted) particles* 5. Rat heart mitochondria* 0.85 0.45(?) 1.30 6. Rat liver mitochondria** 0.85-1.5 0.65-1.0 ~ 2.0
* Approx. 0.5 pmol cytochrome aaa/g protein. ** Approx. 0.2 pmol cytochrome aa3/g protein.
*** By measurements at 550-556.5 nm (cytochrome c), 552.5-547 nm (cytochrome cl) and 551- 540 nm (cytochromes c+cl) - see text and methods.
present. Evidently about 40 % of the electron transfer chains have the mitochondrial configuration and 60 % the inverted configuration. The latter have 2/3 of a full complement of cytochrome c (sufficient for full succinate oxidase activity).
Reconstitution by sonication with excess cytochrome c (Methods) can give particles with c : aa 3 ratios between 1.5 and 2.0, as found in other mitochondria, including rat liver [14] and yeast [28] preparations. Calculation based upon the spec- tra of isolated cytochromes c [29] and cl [30] shows that in mixtures, cytochrome cl may be measured at 552.5-547 nm where there is little contribution f rom cyto- chrome c, while the latter may be measured at 550-556.5 nm, where there is little contribution f rom cytochrome cl. The extinction coefficients cited (Methods) give the same total concentration of cytochromes c plus c~ as is obtained using the con- ventional A E m u of 20 at 551-540 nm. Additions of cytochrome c give no changes at 552.5-547 nm but proportionate changes at 550-556.5 nm.
When cytochrome b is reduced, estimates of cytochrome c concentration using the 550-556.5 nm pair become more difficult. Approximately 1/3 of the 562-575 nm absorbance must be added to the 550-556.5 nm value to obtain the true cytochrome c contribution. In succinate steady state experiments, only the 551-540 and 552.5- 547 nm values are therefore used.
Fig. 1 compares the responses of submitochondrial particles on the addition of succinate or ascorbate plus T M P D as substrate. As previously observed by King [13], the T M P D response (Fig. IA), even in the presence of antimycin, does not represent a simple aerobic/anaerobic transition like the succinate response (Fig. 1C). But if succinate is added after antimycin, the ascorbate-TMPD system behaves in an 'or thodox' manner (Fig. 1B). The spectroscopic responses at a number of wavelengths (Fig. 1, D and E) show that in the presence of antimycin but absence of succinate a broad absorption peak centred at about 563 nm develops during the steady state (Fig. 1D, (a)) and disappears slowly at anaerobiosis (cf. (b) and (c)). When nearly all the cytochrome b is reduced with succinate (Fig. 1E, (d)), these anomalous effects

34
551-54Onm ire
0 5#mol TMPD f
\ T
O01A 30#mol ascorbate .!L
l .__., (b) (a) ~ ~-20s~
B
~dith,tO n~'~t e 551-540nm /
0 5#mol ~
TMPD IT
1##C~ °01 a t e ~ J 0TO1A I ~O,mo, t ascorbate
1 ~ 20S"'~
55f-540nm
50pmol I T
(c) I- 20s--,-I
D
¢ ' . . I /J' 1;. -V.; " ' - . .
~ " ~" " ri-~lr-" ........ ,,(b)-(a) A I , I , I. , I .. ,
540 550 560 570
54'0 ' 5 ~ o ' ,~o ' 5 % ' 5~o nm
I 580 nm
Fig. 1. Reduction of cytochromes c and cl by ascorbate plus TMPD and by succinate. (A) Steady state changes induced by 10 naM ascorbate, 0.2 naM TMPD in the presence of 2/~g/nal antimycin. Subnaitochondrial particles (2.4 #M aa3 or 5 mg protein/nal) in 225 raM naannitol, 75 mM sucrose, 10 mM potassium naorpholinopropane sulphonate, 1 mM EDTA, pH 7.4, 27 °C. (B) Steady state changes as in (A), but with preaddition of 5.7 mM succinate. (C) Steady state changes with 11 mM succinate alone. Subnaitochondrial particles (1.5 #M aa3 or 3 nag protein/nal) in 225 mM naannitol, 75 naM sucrose, 4 mM Tris • CI, pH 7.4, 27 °C. (D) Difference spectra of conaponents reduced in (A), in the absence of succinate: (a) final steady state spectrum; (b) initial spectrum on anaerobiosis; (c) final anaerobic spectrum. (E) Difference spectra of components reduced in (B), in the presence of succinate: (d) species reduced by succinate; (e) steady state induced by ascorbate and TMPD; (f) anaerobic spectrum (less succinate-induced reduction). Dual wavelength measurements.
35
~ , ° recln . TNmax,-, 375 s-' J
A ) ~ 4 I " " . . . . . . . . . . . . . . . . . . . . . . . . . . . ~x
% 70, 100 v redn ~ TNma x ~550s ' T
50. " ' ' . . . . -m-~x) 40- ~ t 60 3J 40
B)20 i ~ c-deficient SMP
0 0"1 0!2 0!3 0"4 6.5 66 0~7 (J8 mM NaN 3
Theoretical %
redn ",,,, egl ~ v oc_ L~--Z~
,o . . . . - - . . . . . . 1 °0 30T-/~t 150_~ 1Q2.0. r 450 ~ . . . . --~ . . . . . . -I 40
C 2o~" t - - c _ , ~ _ , . . . . j
% 70 redn *,o 6 0
5 0
40
D
3 0
2 0
0
~,, TNmax,~ 515 s-1 ~ "I 100
j . . . . . . ,, -1 ,o I I I I
1.0 2.0 3.0 4.0 mM NaN 3
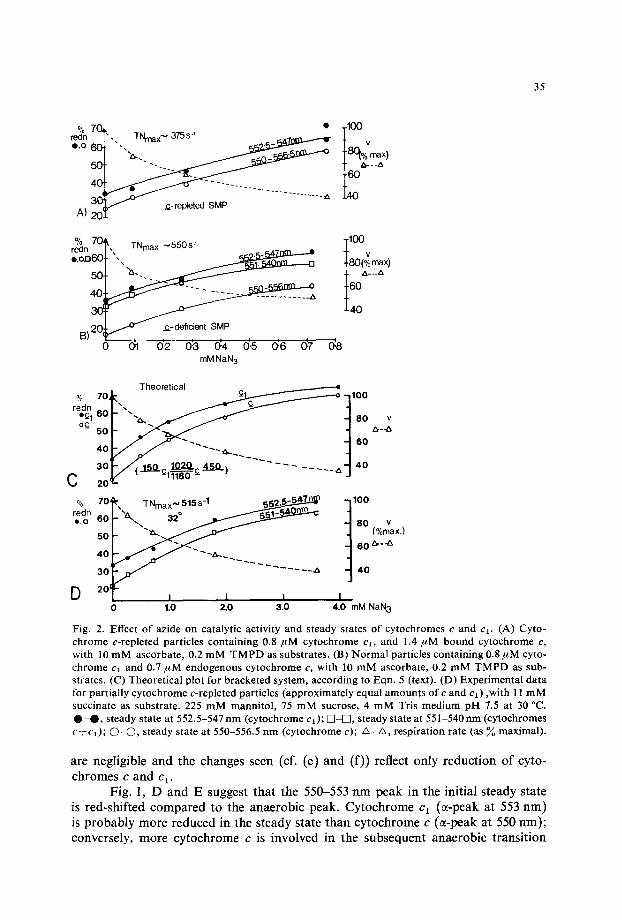
Fig. 2. Effect of azide on catalytic activity and steady states of cytochromes c and cl. (A) Cyto- chrome c-repleted particles containing 0.8 FM cytochrome cl, and 1.4 #M bound cytochrome c, with 10 mM ascorbate, 0.2 mM TMPD as substrates. (B) Normal particles containing 0.8/~M cyto- chrome cl and 0.7/~M endogenous cytochrome c, with 10 mM ascorbate, 0.2 mM TMPD as sub- strates. (C) Theoretical plot for bracketed system, according to Eqn. 5 (text). (D) Experimental data for partially cytochrome c-repleted particles (approximately equal amounts of c and cl) ,with 11 mM succinate as substrate. 225 mM mannitol, 75 mM sucrose, 4 mM Tris medium pH 7.5 at 30 °C. • - • , steady state at 552.5-547 nm (cytochrome cl); []-IS], steady state at 551-540 nm (cytochromes c÷cD; 0 - 0 , steady state at 550-556.5 nm (cytochrome c); A_a , respiration rate (as ~o maximal).
are negligible and the changes seen (cf. (e) and (f)) reflect only reduct ion of cyto- chromes c and c 1.
Fig. 1, D and E suggest that the 550-553 n m peak in the initial steady state is red-shifted compared to the anaerobic peak. Cytochrome cl (s -peak at 553 rim) is probably more reduced in the steady state than cytochrome c (or-peak at 550 rim); conversely, more cytochrome c is involved in the subsequent anaerobic t ransi t ion

36
TABLE II
STEADY STATE REDUCTIONS AND MAXIMUM TURNOVER NUMBERS FOR CYTO- CHROME c 1N MITOCHONDRIA AND SUBMITOCHONDRIAL PARTICLES
System Steady state TN (s- l)b TNmax (s- I )~ % reduction"
ascorbate succinate * ascorbate succinate ascorbate succinate -=TMPD a +TMPD +TMPD
1. Beef heart 21 (15y 48 53 230 350 mitochondria
2. Beef heart 26 (l 8) 101 75 390 415 particles
3. Rat heart (24) (8) 60 14 250 175 mitochondria
4. Rat liver (l 8) (l 5) 51 44 285 295 mitochondria
a Cytochrome c reduction measured at 550-556.5 nm or (bracketed figures) estimated from cyto- chrome c~ reduction at 552.5-547 nm and total (C+Cl) reduction at 551-540 nm (see text). b /*equivalent electrons • s • l, mol cytochrome c. c TN × 100/(% reduction of cytochrome c), see text.
10 mM ascorbate+0.2 mM TMPD or 11 mM succinate. 27 °C, 0.225 M mannitol, 0.075 M sucrose and 4 mM Tris medium, pI-I 7.4.5 mM phosphate, 0.6#M FCCP and 0.4pM rotenone added in expts. 1, 3 and 4. Mitochondrial concentration approx. 2 mg • ml- ~ protein.
(Fig. 1D, (b)-(a), and E (f)-(e)). The reduct ion levels are a funct ion of the relative rates of oxidation and reduction. I f the oxidat ion rate is progressively slowed by addi- t ion of the terminal inhibi tor azide the steady states can be plotted as a funct ion of inhibi tor concentra t ion (Fig. 2). Both with normal particles (2B), and with cyto- chrome c-repleted systems (2A) the steady state reduct ion of cytochrome ct is higher than that of cytochrome c. A n intermediate response is observed at 551-540 n m (Fig. 2B).
For a physiological substrate such as succinate, all the electrons passing to oxygen must traverse the ct /c couple. Fig. 2C shows the calculated flux and steady state changes for a system involving a dissociation constant (pH 7.6) for azide and cytochrome c oxidase of 0.5 m M and the indicated velocity constants for cytochrome ct reduction, cytochrome c oxidation, and cytochrome cl /cytochrome c interaction. The resulting curves are of the same general form as those obtained experimentally (2D).
How are turnover numbers , such as those used to construct Fig. 2C, deter- mined? Table II lists the maximal turnover observed for cytochrome c oxidation dur ing the a s c o r b a t e + T M P D or succinate-induced steady states, according to the equat ion:
TNmax = 4v/[c2+]~t~ady state ( l ) {s-l)
where v is in tool 02 • 1-1 • s -1 and [c 2+ ] steady state ( mo l . l - t ) equals total [cytochrome c ] . 100/(% steady state reduction). The higher values seen are close to the maximal activity of cytochrome aa3 in submitochondr ia l particles treated
37
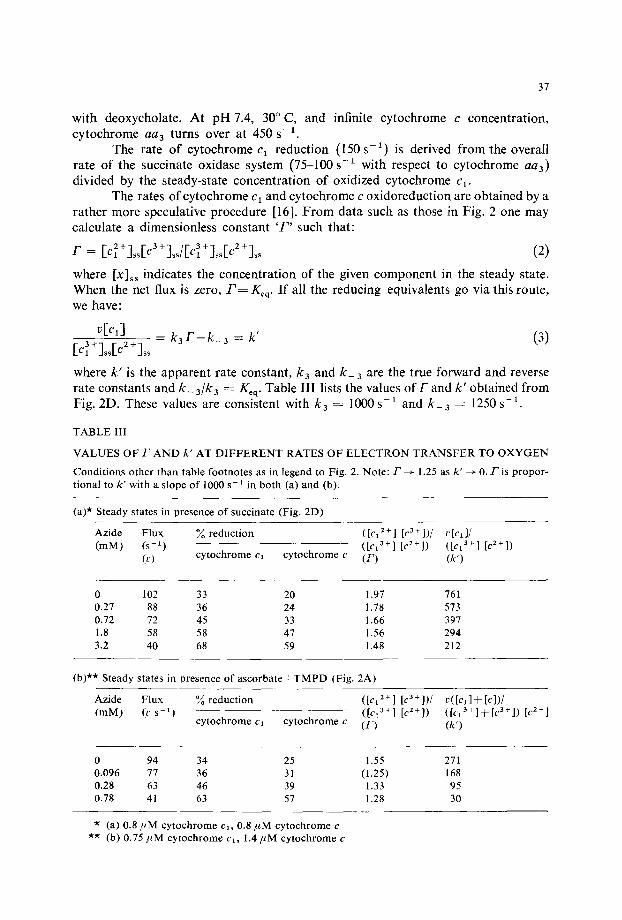
w i t h deoxycho l a t e . A t p H 7.4, 30 ° C, and infini te c y t o c h r o m e c c o n c e n t r a t i o n ,
c y t o c h r o m e aa 3 t u rns o v e r a t 450 s -1 . T h e ra te o f c y t o c h r o m e c 1 r e d u c t i o n (150s - 1 ) is de r ived f r o m the overa l l
r a t e o f the succ ina te ox idase sys tem (75-100 s - 1 wi th respec t to c y t o c h r o m e aa3)
d i v i d e d by the s teady-s ta te c o n c e n t r a t i o n o f ox id i zed c y t o c h r o m e c~.
The ra tes o f c y t o c h r o m e c1 and c y t o c h r o m e c o x i d o r e d u c t i o n are o b t a i n e d by a
r a t h e r m o r e specula t ive p r o c e d u r e [16]. F r o m d a t a such as those in F ig . 2 one m a y
ca l cu la t e a d imens ion less cons t an t '_P' such tha t :
F = 2+ 3+ 3+ 2+ [c, LEa L/[c, ]s [c (2) where [ x ] ~ indica tes the c o n c e n t r a t i o n o f the g iven c o m p o n e n t in the s teady state.
W h e n the ne t flux is zero , F = Keq. I f all the r educ ing equ iva len t s go v ia this rou te ,
we have :
vEc,] - k s r - k _ 3 = k ' (3) [,:3 + ]ss[C"
where k ' is the a p p a r e n t ra te cons tan t , k 3 and k_ 3 are the t rue f o r w a r d and reverse
ra te cons t an t s and k _ 3/k3 ~- geq. Tab l e I I I lists the values o f F and k ' ob t a ined f r o m
Fig. 2D. These va lues are cons i s ten t wi th k 3 - - 1000 s -~ and k_ 3 ~ 1250 s -~.
TABLE Il i
VALUES OF F AND k' AT DIFFERENT RATES OF ELECTRON TRANSFER TO OXYGEN
Conditions other than table footnotes as in legend to Fig. 2. Note: F - ~ 1.25 as k" ---> 0. F is propor- tional to k' with a slope of 1000 s- ~ in both (a) and (b).
(a)* Steady states in presence of succinate (Fig. 2D)
Azide Flux % reduction (mM) (s -1)
09 cytochrome cl cytochrome c
([c, z+] [c3+])/ ~,[c,]/ ([c~ ~+] [c~+]) ( [c~+l [c2+]) (F) (k')
0 102 33 20 1.97 761 0.27 88 36 24 1.78 573 0.72 72 45 33 1.66 397 1.8 58 58 47 1.56 294 3.2 40 68 59 1.48 212
(b)** Steady states in presence of ascorbate+TMPD (Fig. 2A)
Azide Flux % reduction (raM) (c s -1)
cytochrome c~ cytochrome c
([cl 2+ ] [c3+])/ ([c, 3+] [c2+l) (F)
v([el]+[cl)/ ( [c~+]+[c3+]) [c2+l (k')
0 94 34 25 1.55 0.096 77 36 31 (1.25) 0.28 63 46 39 1.33 0.78 41 63 57 1.28
271 168 95 30
'~ (a) 0.8/tM cytochrome ca, 0.8/zM cytochrome c *~' (b) 0.75/~M cytochrome c~, 1.4/zM cytochrome c

38
When ascorbate+TMPD is the electron donor sys tem, / ' would always equal Keq if TMPD reduced only endogenous cytochrome c. The figures given in Table III show that this assumption is probably false. A slightly less simplified model assumes that TMPD reduces both cytochromes c I and c at similar rates. We then have [16] Eqn. 4 in place of Eqn, 3:
v([c]+[c,]) = k c £ - k _ ~ = k ' (4)
Table | I I also lists the values of /1 and k' for the ascorbate-TMPD system. Eqn. 4 gives similar values for k¢ and k_¢ to those given by Eqn 3 in the case of the succinate data from Fig. 2A. Much higher £ values derived from Fig. 2B seem to reflect the existence of reduced cytochrome cl species not equilibrating rapidly with cytochrome c, and hence more reduced than the remainder. Perhaps the inward-facing e l units equilibrate with endogenous c but the outward-facing units require added cyto- chrome c before they cart behave in the same way.
Fig. 3 shows similar steady state observations with intact but uncoupled beef heart mitochondria. In such mitochondria the spectral "anomalies" (Fig. 1) are not seen, and steady states with ascorbate and TMPD can be obtained both in pres- ence (a, b) and absence (c, d) of antimycin. Cytochrome ct is more reduced during the steady state (a, c) and cytochrome c is the predominant component reduced upon anaerobiosis (b-a, d-c). As with particles, turnover can also be determined according to Eqn. l in the aerobic succinate-reduced steady state. Although the
• I I I , i
,545 550 55.5 560
: / , ° \
'e"
545 550 555 560 nm
C
100%- --~ 551-540nm ~ 15nmol
O.~IA FCCP .
25 ' 20~mol / s ugSgal te phosphate /
0.5nmol I l ~ o ~ ' rotenone / ~
16% 18% ~- 60s,.- 0% -
i (C N )6 3-
Fig. 3. Steady state changes in intact beef heart mitochondria. (A) Spectra of cytochromes reduced by ascorbate plus TMPD irt presence of 0.6/tg • ml- ~ antimyciu. Beef heart mitochondria (1.2 ttM cytochrome aa3, 1.0 pM cytochrome c, 0.8 #M cytochrome ct) plus 0.12 ftM FCCP, oxidizing 11 mM ascorbate + 185 pM TMPD, in 225 mM mannitol, 75 mM sucrose, 10 mM morpholinopropane sul- phonate, lmM EDTA pH 7.4, 27 °C. (B) As in A without antimycin addition. (a), (c) Q - O steady state spectrum; (b), (d) © - Q anaerobic spectrum; I1-11, r~ -~ components reduced on transition to anaerobiosis. (C) Steady state reduction of cytochromes c and c~ during succinate oxidation. Beef heart mitochondria (1.5 #M cytochrome aaa, 1.4 #M cytochrome c, 0.95/~M cytochrome ct), as in A. Measurements made at 551-540 nm following addition of 0.19 ~M rotenone, 9 mM succinate, 7 mM phosphate, and 0.6/*M FCCP. Full reduction by dithionite, full oxidation by ferricyanide.

39
A
TN max (sec o,u e , o S M P
-,, u mitochondria
\ .o
r . . , -3o 1 . . . i / o 0 "20
-10
' 0 / i OI 1 ' O2 ' O3 El:Ynosphate~ (M)
o o
551 - 540 nm o, i i
TN max (sec'~)6oo
500-
400-
300.
200.
succinate (endogenous c_ only)
lOO. ) ° (Pi-Tween) o
i i o o!1 0'2
+ succinate
TN max "D
I d3 [phosphate] (M)
% reduction 551- 54o nm
60
5o
.4o
.30
.20
-io
Fig. 4. Cytochrome c + c i steady states and estimated turnovers during respiration of rat liver mito- chondria and of beef heart particles as a function of phosphate concentration. (A) Oxidation of ascorbate plus TMPD. O - O , maximal turnover of submitochondrial particles (rate of respiration/ [cytochrome c 2÷ ], Eq. 1 in text); rq-c1, maximal turnover of mitochondria; O - O , % reduction at 551-540 nm (particles); I - L % reduction at 551-540 nm (mitochondria). Phosphate buffer con- centrations as indicated, with isotonicity maintained at 308 mosm up to 0.1 M phosphate level by appropriate additions of 225 mM mannitol, 75 mM sucrose, 4 mM Tris, 1 mM EGTA medium, pH 7.35, 28 °C. Submitochondrial particle data in presence of 7 mM succinate, 11 mM ascorbate, 0.18 mM TMPD, 7/~g/ml antimycin. Mitochondrial data in presence of 0.36/~M rotenone and 0.6 MM FCCP. N.B. Mitochondria in the higher phosphate concentrations are probably swollen but here we are measuring uncoupled rates only. (B) Oxidation of succinate (beef heart submitochondrial particles). O, i , II, % Reduction at 551-540 rim; O, A, F3, maximal turnover (as in A). Phosphate concentrations at pH 7.2-7.4, 26 °C, as indicated, varying tonicity. 11 mM succinate, 0.8-1.5 ,uM cytochrome aa3 (0.15-1.3 #M cytochrome c). Differently shaped symbols identify different experi- ments.

40
measurements are facilitated by the higher level of cytochrome c (Table 1), Fig. 3C shows that accurate steady state values are more difficult to determine. Very different uncoupled steady state estimates are obtained using the rotenone-inhibited state and the ferricyanide-oxidized state as reference levels. Values in Table 1I are based on the latter.
The maximal turnover of isolated cytochrome an3, or of deoxycholate-treated particles, is a function of ionic strength [31 ]. The optimal phosphate buffer concen- tration is between 0.05 M and 0.1 M at pH 7.3, 30 °C. As shown by Keilin and Hartree [32], low activities in the 0 to 0.05 M range may be due to poor particle dispersion, overcome by high (non-specific) protein concentrations. However, in- hibitory effects of high ionic strength seem to be truly 'molecular' in origin, and are seen in both cytochrome oxidase [31, 33] and succinate oxidase activities [32, 34]. Fig. 4A compares the effects of increasing ionic strength (with osmolarity kept con- stant at 310 mosm up to 0.1 M phosphate) on ascorbateTTMPD oxidase activity of beef heart particles and rat liver mitochondria. As ionic strength rises, the steady state reduction level at 551-540 nm increases, and the calculated turnover (Eqn. I) declines sharply. Similar changes are observed at lower protein concentrations using
% 50 reduction ~ 55 40 1-540nrn
20 ~ 2 5 m M Pi
10 [ ]
o A
(TeNc-1) ~endogenous 3 0 0 ~ cyt. c__
III J v[C]tof;~l -
III/ ~ 80mM Pi l O 0 ~
0 10 20 30 B ljMC (total)
Fig. 5. Cytochrome c+c l steady states and calculated turnovers as a function of cytochrome c con- centration. Succinate oxidation by bbef heart submitochondrial particles (1.3 ffM cytochrome aa3), in 80 mM phosphate pH 7.4 (closed symbols) or 25 mM phosphate pH 7.2 (open symbols). 11 mM succinate as substrate. (A) % reduction at 551-540 nm: O - O , 80 mM phosphate; [5]-71, 25 mM phosphate. (B) estimated turnovers (see text): • and ©, 80 mM phosphate; • and 71, 25 mM phos- phate. Cytochrome c concentration equals total of added (exogenous) and endogenous. Reaction medium contained 0.11 M sucrose, 12.5 mM borate and 2 mM EDTA, plus indicated levels of sodium/ potassium phosphate at 27 C.

4l
the oxygen electrode technique; under such conditions the activating effect of low phosphate levels [32] is seen as well. Fig. 4A indicates that mitochondria (taken to slightly hyperosmotic phosphate concentration levels) show a similar, albeit less marked trend.
Succinate-induced steady states and turnovers are also modified by increasing phosphate concentration, as shown in Fig. 4B. Because the steady state reduction level rises as turnover falls, the decline in maximal turnover is a steeper function of ionic strength than is the overall activity [34]. The maximal turnover in 'non-ionic' media is identical with the turnover of cytochrome aa 3 (400-500 s-1), but at 0.1 M phosphate and above the turnover is less than the activity of isolated oxidase under the same conditions. Addition of exogenous cytochrome c completely restores the 'missing' activity, both when measured polarographically and spectrophotometri- cally. Fig. 5 illustrates the effect of increasing added cytochrome c concentration at high and low phosphate concentrations on (i) the steady state reduction level, (ii) the turnover calculated according to v~ [c 2 + ] (Eqn. 1), and (iii) the turnover calculated in terms of the product of v~ [c 2 + ] and the ratio of total [c] to total [aaa ] present. The latter 'turnover' at high cytochrome c concentrations rises to a value similar to that given by Eqn. 1 at the lowest (endogenous) cytochrome c concentrations. At the same time the cytochrome c steady state reduction falls from the endogenous (40 7O- 50 ~o) value to the characteristic exogenous (7-15 7O) value, along a curve (Fig. 5A) whose shape is controlled by the K~, for cytochrome c ( ~ 2.5 pM in 25 mM phos- phate, 16/~M at 80 mM phosphate). Freshly prepared particles, at low concentrations ( ~ 0.05/~M an3) in 67 mM phosphate buffer with excess cytochrome c (>/ 30/iM), show succinate oxidation rates between 60 and 100 electrons • s- ~ (cytochrome aa3)- ~ and steady state reduction levels between 7 and 10 ~o. The corresponding values of v[c]/[c2+][aa3] lie between 600 and 1000s -1, in excess of the maximal oxidase turnover. Under these conditions endogenous cytochrome c is probably more reduced than exogenous cytochrome c (unlike the possible situation illustrated in Fig. 5B). If 40 ~o of the chains are outward-facing and 60 ~ inward-facing, then a turnover of 100 s -~ at 10 7o(exogenous) reduction will mean that 18 7O (0.4" 450.0.1) of the flux is carried externally and 82 ~ (0.6. 450 • 0.3) internally. The suggested greater endogenous (30 ~o) than exogenous (10 7o) cytochrome c reduction may reflect a lack of equality in the proportionate ~scrambling' of the reductase and oxidase parts of the membrane (see Discussion).
DISCUSSION
Truly cytochrome c-deficient submitochondrial particles, prepared according to Tsou [35], require only a small amount of added cytochrome c to develop full succinate oxidase activity [1, 36]. Although the particles described here are only partially c-deficient, they show a characteristic response to added cytochrome c. This could imply the presence of a mixed population of vesicles, some fully deficient, and others fully active. However, the homogeneous response of all the cytochromes on the transition to anaerobiosis [37] indicates that deficient and cytochrome c- containing regions can communicate with each other at a rapid (but catalytically incompetent) rate. The relative sizes of the immediately accessible and deoxycholate- released cytochrome c oxidase activities suggest that the cytochrome c containing

42
regions are those with an inverted configuration, and the cytochrome c deficient regions those which retain the original mitochondrial configuration, and hence lose cytochrome c in ionic media. Single vesicles containing regions of both types could arise as a result of fusion processes during preparation.
The absorption increases in the region of the cytochrome b a-peak in anti- mycin-inhibited submitochondrial particles during the ascorbate plus TMPD-induced steady state, which disappear following anaerobiosis, may be related to the aerobic cytochrome bT reduction seen by Erecifiska et al. [38] in intact mitochondria, and analysed by Berden and Wikstr6m [39] in terms of a coenzyme Q-semiquinone dependent cytochrome b reduction. Alternatively a membrane-bound or trapped form of Wurster's blue (TMPD radical), accessible to the succinate dehydrogenase system but not to ascorbate, may be involved. The absence of a similar effect in intact mitochondria (Fig. 3) suggests that either (a) cytochrome b accessibility or redox potential may differ, or (b) a different membrane orientation may prevent radical trapping or binding.
The estimated value of K~q = 1.25 for the cytochrome cl-cequilibrium (Table III) indicates a redox potential for endogenous cytochrome c about 5 mV more negative than that of c~; this result simply confirms the titration data which show no signif- icant difference between the potentials of cl and bound c [40, 41 J. The rate of succinate oxidation via the cl/c system obeys the (rather restrictive) triple equation [5]:
V k4[c 3+3 2+ 3+ 3+ 2+ = = k3[Cl 3[c 3[c ] = k & 2 + 3 [ a a 3 3 (5)
(cf. Figs. 2C and 2D), where k 3 and k_ 3 must both exceed l03 s -1. The assumption that TMPD reduces cytochromes c and e~ at similar rates (Table I |I) also gives a reasonable fit for the ascorbate-TMPD data. The rate constant k 5 in Eqn. 6,
v = k5[TMPD]([c 3 +] + [¢3 +]) (6)
has a calculated value of 4.5 • 105 M -a s -1 at pH 7.4, 30 °C, while the reduction of cytochrome c in solution under the same conditions occurs with a rate constant not greater than 5- 104M - I s -1 [12].
Near-equilibration between cytochromes c~ and c can explain a number of kinetic features in electron transport. For example, although both the oxidase step [33, 42] and the e~ ~ c step [43] are ionic strength dependent [1 ], when the complete succinate oxidase system is examined, an increase in buffer concentration is associated with a marked increase in cytochrome c steady state reduction [44]; if the edc step is not rate-limiting, ions affect k 2 (Eqn. 5)more than k,. Secondly, if succinate oxidase flux is plotted against azide concentration, a normal hyperbolic inhibition curve is obtained, although the K i is tenfold greater than for the cytochrome c oxidase reac- tion itself [45]. The predicted inhibition curve for a multienzyme system of this kind acting by essentially non-equilibrium steps would be steeper than the hyperbolic form characteristic of a single enzyme unless the component preceding the penulti- mate component (cytochrome c) were largely reduced in the steady state (the 'cush- ioning' effect). But cytoehrome c~ is not largely reduced in the steady state. The ob- served hyperbolic inhibition curve must therefore be due to equilibration between c~ and c, and effectively complete reduction of the component lying below cytochrome c~. Thirdly, equilibration accounts for the cytochrome c reductase kinetics [46].
Smith et al. [46] have shown that succinate-cytochrome c reductase activity

43
is characterized by: (a) a very low Km value for total cytochrome c, (b) a zero order phase followed by a first order phase in the time course, and (c) a transition between the two phases dependent only upon the redox state of cytochrome c, and not on the total amount of cytochrome c present. For the catalytic system of Eqn. 7, the steady state Eqn. 8 applies at cytochrome c concentrations above the (proven) low K m value.
k4 k3 AH 2 > c z ~ ~ c (7)
k-3
-'+] 1 v k3 k,[c 3 "3 + --k, (8)
If the reciprocal of turnover is plotted against the [c z + ]/[c 3 + ] ratio, then the inter- cept on the [cl ]/v axis will represent the rate constant k4 for reduction of cl, and the intercept on the [c2+]/[c3+]axis will be k3 /k_ 3, the equilibrium constant for the cl/c equilibrium. Such plots (cf. [46]) give values between 4 and 6 for k3 /k_ 3 with externally added c and cytochrome c depleted mitochondria, indicating a redox potential for cytochrome c in solution 35 to 45 mV more positive than that of cyto- chrome c 1. The difference between the apparent potentials of free and bound cyto- chrome c [40] has been discussed previously [1].
The maximal turnover of cytochrome c (Eqn. 1) in a number of preparations (Table II) approaches that for isolated cytochrome aa 3 acting on excess cytochrome c. Even in rat liver mitochondria, where there is more cytochrome c than cytochrome aa3, rates of up to 300 s- 1 are found. Chance [47] determined directly a rate of 380 s- 1 for cytochrome c oxidation in such mitochondria at 32 °C. I conclude that at least 80 ~o of mitochondrial cytochrome c is bound to cytochrome aa3whenever [c] <~ [aa3] , and that cytochrome c I may reduce the c-aa 3 complex directly, as TMPD is capable of doing [12]. If this is true, it predicts considerable movement of complex III in the membrane.
Alternatively, very rapid exchange of cytochrome c may be possible across the surface of the membrane. Wohlrab [48] found rapid equilibration between chains at the cytochrome c level. If cytochrome c forms complexes alternately with cytochrome aa 3 and with cytochrome c~ [49] no more than 20 ~o of the cytochrome c in beef heart systems can be associated with cytochrome c~ at arty time. The electron transfer rate within the cx-c complex will then be at least 5000 s-1, similar to the oxidation rate of cytochrome c by yeast peroxidase [50]. The rate of dissociation of either ferric or ferrous cytochrome c from its complex with cytochrome aa3 is in excess of 2000 s- i [1, 31 ] and is unlikely to be rate limiting.
The decrease in apparent catalytic activity of endogenous cytochrome c at high ionic strengths, accompanied by increasing steady state reduction (Fig. 4) indi- cates that membrane-linked cytochrome aa3 in the inverted configuration may have an unusual ionic sensitivity, or that endogenous c does indeed dissociate from aa3 at higher ionic strengths, not into solution (the concentration would rapidly become very high) but to non-specific binding sites of lower salt sensitivity. Even more dra- matic effects are seen with cytochrome oxidase-containing liposomes with trapped cytochrome c (Wrigglesworth and Nicholls, unpublished), for which the estimated ratio of internal/external activity rises sharply with decreasing buffer concentration.
44
I conclude that previously measured rate constants for the cl ~ c electron transfer step obtained at 555-540 nm [3] were too low, probably due to large contri- butions from b-type cytochromes at this pair of wavelengths. The electron transfer sequence from succinate to oxygen [51] is best fitted by the steps and rate constants given in Eqn. 9:
1 5 0 s - ~ 1 0 0 0 s - 1 4 5 0 s - 1 l 0 s
s u c c i n a t e • c 1 v,, - - - - - ~ c ~" a a 3 • 0 2 (9) (k4) 1 2 5 0 s - I (k2) M - 1 " s - I
(k3 and k - 3) ( k l )
Of these constants, k 2 may represent the true rate of intramolecular electron transfer within the c - a a 3 complex, but k a and k_ 3 are probably much smaller than the in- tramolecular electron transfer rates for complexes between cytochromes c and c~.
ACKNOWLEDGEMENTS
Mitochondria and submitochondrial particles were prepared by Jack P. Pedersen. 1 should also thank my coworkers Finn B. Hansen, Mette Miller, Lars Chr. Petersen and John M. Wrigglesworth for discussions about these problems.
REFERENCES
1 Nicholls, P. (1974) Biochim. Biophys. Acta 346, 261-310 2 0 r i i , Y., Sekuzu, I. and Okunuki, K. (1962) J. Biochem. 51,204-215 3 Chance, B., DeVault, D., Legallais, V., Mela, L., and Yonetani, T. (1967) Nobel Symposium V,
Fast Reactions and Primary Processes in Chemical Kinetics (S. Claesson, ed.), pp. 437-468, lnterscience, New York
4 Wagner, M., Erecifiska, M. and Pring, M. (1971) Arch. Biochem. Biophys. 147, 675-682 5 Hinkle, P. C., Kim, J. J. and Racker, E. (1972) J. Biol. Chem. 247, 1338-1339 6 Jasaitis, A. A., Nemecek, 1. B,, Severina, I. 1., Skulachev, V. P., and Smirnova, S. M. (1972)
Biochim. Biophys. Acta 275, 485-496 7 Racker, E. (1972) The Molecular Basis of Electron Transport (J. Schultz and B. F. Cameron,
eds.), pp. 45-64, Academic Press, London 8 Mitchell, P. (1966)Chemiosmotic Coupling in Oxidative and Photosynthetic Phosphorylation,
Glynn Research, Bodmin, U.K. 9 Bangham, A. D. (1968) Membrane Models with Phospholipids, Prog. Biophys. Mol. Biol.
(J. A. V. Butler & D. Noble, eds.), Vol. 18, pp. 29-95, Pergamon Press, London 10 Packer, L. and Mustafa, M. G. (1966) Biochim. Biophys. Acta 113, 1-12 11 Mustafa, M. G. and King, T. E. (1967) Arch. Biochem. Biophys. 122, 501-508 12 Kimelberg, H. K. and Nicholls, P. (1969) Arch. Biochem. Biophys. 133, 327-335 13 King, T. E. (1965) O×idases and Related Redox Systems (T. E. King, H. S. Mason and M.
Morrison, eds), Vol. 1I, p. 977, Wiley, New York 14 Williams, Jr., J. N., (1964) Arch. Biochem. Biophys. 107, 537-543 15 Vanneste, W. H. (1966)Biochim. Biophys. Acta 113, 175-178 16 Nicholls, P. (1975) Electron Transfer Chains and Oxidative Phosphorylation (E. Quagliarello,
S. Papa, F. Palmieri, E. C. Slatcr and N. Siliprandi, eds.), pp. 227-232, North Holland Publishing Co., Amsterdam
17 Brodie, J. D. and Nicholls, P. (1970) Biochim. Biophys. Acta 198,423-437 18 Myers, D. K. and Slater, E. C. (1957) Biochem. J. 67, 558-572 19 Chappell, J. B. and Hansford, R. G. (1972) Subcellular Components, Preparation and Fractio-
nation (G. D. Birnie, ed.), pp. 77-91, Butterworths and Univ. Park Press, London 20 Jacobs, E. E. and Sanadi, D. R. (1960) J. Biol. Chem. 235, 531-534 21 Tyler, D. D. and Gonze, J. (1967) Methods in Enzymology (R. W. Estabrook and M. E. Pullman,
eds), pp. 75-77, Academic Press

45
22 Elliott, W. B. and Haas, D. W. (1967) Methods in Enzymology (R. W. Estabrook and M. E. Pullman, eds), ¥ol . X, pp. 179-181, Academic Press, London
23 van Buuren, K. J. H. (1972) Ph .D . thesis, University of Amsterdam, Gerja, Waarland 24 Smith, L. and Camerino, P. W. (1963) Biochemistry 2, 1432-1439 25 Gornall, A. G., Bardawill, C. J. and David, J. B. (1949) J. Biol. Chem. 171,751-766 26 Malviya, A. N., Parsa, B., Yodaiken, R. E. and Elliott, W. B. (1968) Biochim. Biophys. Acta 162,
195-209 27 Malviya, A. N., Elliott, W. B., Nicholls, P. and Kimelberg, H. K. (1971) Ind. J. Biochem. Biophys.
8, 121-129 28 Ohnishi, T., Kr0ger, A., Heldt, H. W., Pfaff, E., and Klingenberg, M. (1967) Eur. J. Biochem. 1,
301-31 I 29 Butt, W. D. and Keilin, D. (1962) Proc. Roy. Soc. B 156, 429-458 30 Yu, C. A., Yu, L. and King, T. E. (1972) J. Biol. Chem. 247, 1012-1019 31 Nicholls, P. and Chance, B. (1974) Molecular Mechanisms of Oxygen Activation (O. Hayaishi,
ed), pp. 479-534, Academic Press, London 32 Keilin, D. and Hartree, E. F. (1949) Biochem. J. 44, 205-218 33 Slater, E. C. (1949) Biochem. J. 44, 305-318 34 Slater, E. C. (1949) Biochem. J. 45, 8-13 35 Tsou, C. L. (1952) Biochem. J. 50, 493-499 36 Nicholls, P. (1965) Oxidases and Related Redox Systems (King, T. E., Mason, H. S., and
Morrison, M., eds.), pp. 764-783, John Wiley, New York 37 V~.zquez-Col6n, L. and King, T. E. (1967) Arch. Biochem. Biopttys. 122, 190-195 38 Erecifiska, M., Chance, B., Wilson, D. F. and Dutton, P. L. (1972) Proc. Natl. Acad. Sci. U.S.,
69, 50-54 39 WikstrOm, M. K. F. and Berden, J. A. (1972) Biochim. Biophys. Acta 283,403-420 40 Dutton, P. L., Wilson, D. F. and Lee, C. P. (1970) Biochemistry 9, 5077-5082 4l Dutton, P. L. and Wilson, D. F. (1974) Biochim. Biophys. Acta 346, 165-212 42 Davies, H. C., Smith, L. and Wasserman, A. R. (1964) Biochim. Biophys. Acta 85, 238-246 43 Yu, C. A., Yu, L. and King, T. E. (1973) J. Biol. Chem. 248, 528-533 44 Estabrook, R. W. (1961) Haematin Enzymes (Falk, J. E., Lemberg, R., and Morton, R. K., eds.),
pp. 276-278, Pergamon Press, London 45 Nicholls, P. and Kimelberg, H. K. (1968) Biochim. Biophys. Acta 162, 11-21 46 Smith, L., Davies, H. C. and Nava, M. (1974) J. Biol. Chem. 249, 2904-2910 47 Chance, B. (1967) Biochem. J. 103, 1-18 48 Wohlrab, H. (1970) Biochemistry 9, 474-479 49 Kaminsky, L. S., Chiang, Y.-L., Yu, C.-A. and King, T. E. (1974) Biochem. Biophys. Res.
Commun. 59, 688-692 50 Yonetani, T. and Ray, G. S. (1966) J. Biol. Chem. 241,700-706 51 Petersen, L. C., Nicholls, P. and Degn, H. (1976) Biochem. J., submitted