Case study of con rod(1)
31
CASE STUDY - An Analysis of the Relationship between Surface Roughness and distribution of diameter measurements of the large cylindrical feature of an Automobile Connecting Rod. Abstract The automobile industry currently operates in a highly competitive environment where innovation and performance are critical to enhanced market share and competitiveness. Thus system design and optimal performance of the automobile parts are crucial elements that enable a particular automobile brand to achieve sustainable competitive advantage. This research examines performance parameters for the connecting rods of automobiles. Here the surface roughness in relation to the diameter of the large cylindrical feature of the connecting rod is examined. It is desirable that for optimum performance and low fuel consumption, the surface roughness is as low as possible. This research also examines how Faro Arm and Vernier callipers may be used to measure the diameter of the connecting rod and the methods for evaluating surface roughness as well. Keywords: Surface roughness; Surface texture; Surface roughness tolerance. Introduction The Connecting Rod is a very important part of internal combustion engines that propel automobiles. The connecting rod is fixed to the crankshaft of the automobile by a crank pin and the other end of the rod gets connected to the piston through a piston pin. As the piston within the internal combustion engine moves up and down, it is the connecting rod that transmits the power thrusts so generated to the crank pin which in turn is transferred to the piston shaft in the form of rotary motion (Walishaw, 2011). It is this motion that turns the wheels of the vehicle generating movement. It may be inferred here that the efficiency of the engine is dependent on how effectively or completely the connecting rod converts reciprocating motion into rotary motion.
-
Upload
deepak-chiripal -
Category
Business
-
view
49 -
download
0
Transcript of Case study of con rod(1)
CASE STUDY - An Analysis of the Relationship between Surface
Roughness and distribution of diameter measurements of the large
cylindrical feature of an Automobile Connecting Rod.
Abstract The automobile industry currently operates in a highly competitive environment where
innovation and performance are critical to enhanced market share and competitiveness. Thus
system design and optimal performance of the automobile parts are crucial elements that
enable a particular automobile brand to achieve sustainable competitive advantage. This
research examines performance parameters for the connecting rods of automobiles. Here the
surface roughness in relation to the diameter of the large cylindrical feature of the connecting
rod is examined. It is desirable that for optimum performance and low fuel consumption, the
surface roughness is as low as possible. This research also examines how Faro Arm and Vernier
callipers may be used to measure the diameter of the connecting rod and the methods for
evaluating surface roughness as well.
Keywords: Surface roughness; Surface texture; Surface roughness tolerance.
Introduction The Connecting Rod is a very important part of internal combustion engines that propel
automobiles. The connecting rod is fixed to the crankshaft of the automobile by a crank pin and
the other end of the rod gets connected to the piston through a piston pin. As the piston within
the internal combustion engine moves up and down, it is the connecting rod that transmits the
power thrusts so generated to the crank pin which in turn is transferred to the piston shaft in
the form of rotary motion (Walishaw, 2011). It is this motion that turns the wheels of the
vehicle generating movement. It may be inferred here that the efficiency of the engine is
dependent on how effectively or completely the connecting rod converts reciprocating motion
into rotary motion.
According to (Tlusty, Smith, & Winfough, 2013), it is very important that the connecting rod be
dimensionally correct in terms of weight and size so that no energy is lost due to vibrations in
the connecting rod. This specification assumes great significance given that the connecting rod
is invariably the most stressed out part of internal combustion engines (Smith, Winfough, &
Halley, 2012). These stresses are generated by the pressures exerted on the piston on the
crankshaft and can lead to failure of the connecting rod. In addition, the reciprocating load
generates its own set of pressures leading to alternate stretching and compression which can
lead to connecting rod failure called “throwing the rod” (Davies, Dutterer, & Pratt, 2014). (Pai,
2013) says that this failure is often catastrophic and irreparable. In recognition of this reality
much research has been conducted on how to design and manufacture connecting rods that
are light yet strong.
However an area that has been overlooked is the relationship between surface roughness of
the connecting rod and its dimensions. Surface roughness is a most important parameter that
impacts the productivity of machine parts such as connecting rods. This i s because low levels of
surface roughness ensures optimal tribological properties, increases resistance to fatigue and
possible failure, creates corrosion resistance surfaces and increases the aesthetic appeal of the
end product (Jeppsson, 2013). Surface roughness impacts precision of fits, the strength of
fastenings and friction between connecting rods and the crankshaft pins (Smith, S; Tlusty, J,
2013). Various parameters impact surface roughness including the speed of cutting and
machining, the feed rates of cutting spindles, the density of the metal in the work piece and the
rigidity of the machine tools (Serag, Sevien, Sheha, & El-Beshtawi, 2014). However it may be
noted here that these are processes that impact surface roughness at the end stage – which is
machining. What is also important is the beginning or the design stage to understand those
optimal dimensional measurements that impact surface roughness. One of these dimensional
measurements is the diameter of the small end of the connecting rod that interfaces with the
piston and the other is the diameter of the big end that connects with the crankshaft. However,
the study of relationship between the dimensional distribution and surface roughness is carried
out on the large cylindrical feature of the connecting rod.

This study is important because of the competitive business environment in which the
automobile industry operates today where the demand is for light weight, fuel efficient and
long lasting vehicles. This puts great pressure on research and development to develop critical
components – such as connecting rods – that function efficiently. On the basis of the
aforementioned introduction the following research questions and aims & objectives may be
formulated.
Research Question
What is the relationship between distribution of large cylindrical diameter measurements and
the corresponding surface roughness of an automobile connecting rod?
Aims & Objectives
To conduct an experiment using both Vernier scales and Faro Gage to measure diameter
of the large cylinder feature of automotive connecting rods and their corresponding
surface roughness.
To analyse the correlation of the surface roughness versus the diameter measurements
using statistical methods for each sample.
To understand whether the surface roughness characteristics have direct impact on the
distribution of measurement result for the cylinder diameter measurement.
To draw conclusions explaining issues related to feature dimensions and surface
characteristics at design, manufacturing and service stages .
Working Methodology
The method employed to analyse impact of dimensional measurement distribution on surface
roughness of connecting rods is shown below. This included the Define, Measurement,
Analysis, Understanding the correlations and results and conclusions.

Figure 1.Flow Chart of Methodology followed to Evaluate Surface Roughness Parameters and Dimensional Measurements.
Define This stage defines the nature of the experiment performed. The experiment is conducted on
five different connecting rods of varying geometry and surface roughness. These include low
carbon steel, aluminum silicate alloy (AlS) and MV 9 alloy. These represent the standard
materials used in the automobile industry for connecting rod manufacture. The below figure
shows the connecting rods used to conduct the experiment arranged in the order (a) Low
carbon steel connecting rod (b) MV9 alloy connecting rod (c) Aluminium silicate connecting rod
(d) Low carbon steel connecting rod and (e) MV9 alloy connecting rod.

i. Surface Roughness Parameter Measurement
Many surface roughness parameters can be used to define and analyze the surface of a
mechanically manufactured object which includes Average surface roughness (Ra), Maximum
height of the profile (Rt), Root mean square (Rq) etc. Out of this, the most common roughness
parameter employed to define a surface in many of the manufacturing industries is the average
surface roughness or Ra.
The average surface roughness is given by,
Where,
‘n’ is the number of evaluated points.
‘Yi’ is the absolute deviation of the profile line from the mean line.
The Ra value is measured using Taylor Hobson Surtonic-25 instrument.
ii. Dimensional Measurement
The dimensional measurement used in the experiment is the diameter of the large cylindrical
feature of the automobile connecting rod. The dimension measurement is initially observed
using a Mitutuyo Vernier Caliper and then measured using a FARO articulated arm CMM. The
later readings were observed with the aid of CAM2 Measure 10.2 software platform in a
computer system.
Measurement This stage explains the experimental procedure employed to measure the required surface
roughness parameter and the dimensional measurement of the connecting rod.
i. Surface Roughness Measurement
Prior taking the diameter dimensional measurements of the large cylindrical feature of the
connecting rods marked (a), (b) and (c), the Taylor Hobson Surtonic-25 equipment is calibrated
against a specimen of known surface roughness value of 6µm. On calibration an error of
0.02µm is found. Also, prior taking the diameter measurements of the large cylindrical feature

of the connecting rods marked (c) and (d), the Taylor Hobson equipment is calibrated against
the same specimen but an error of 0.26 µm is shown.
For the experiment all the connecting rods are individually held firmly on a working bench using
a mechanical G-clamp so that error due to vibration or misalignment of the connecting rod
while measuring can be avoided. The surface roughness values were taken at random points
from the periphery of the large cylindrical feature of the connecting rods marked (a), (b) and (c)
whereas in case of connecting rods marked (c) and (d), the roughness values of fixed marked
points were recorded. The observed surface roughness readings are as follows:
Marked Connecting
Rods
Observed Surface Roughness
value (µm)
Calibration
Error (µm)
Actual Surface
Roughness (µm)
a 0.38 0.26 0.38
b 0.66 0.26 0.66
c 1 0.26 1.26
d 0.16 0.02 0.18
e 0.28 0.02 0.30
The surface roughness value of connecting rod marked (c) could not be measured using Taylor
Hobson Surtonic-25 as its roughness value is beyond the measuring range of the instrument.
Due to the non-availability of other surface measuring instrument in the metrology laboratory a
roughness value above 1µm based on visual experience is assumed for the connecting rod (c).
ii. Dimensional Measurement
The dimensional measurement of the large cylindrical feature of the connecting rods marked
(a), (b), (c), (d) and (e) were initially measured using a Mitutuyo Vernier caliper. Before making
the diameter readings all the connecting rods were individually clamped to a work bench using
a mechanical G-clamp to avoid misalignment of the rod while measuring. The diameter
readings of the connecting rods marked (a), (b) and (c) are observed from random points on the
periphery of the large cylindrical part where as in case of connecting rods marked (d) and (e),
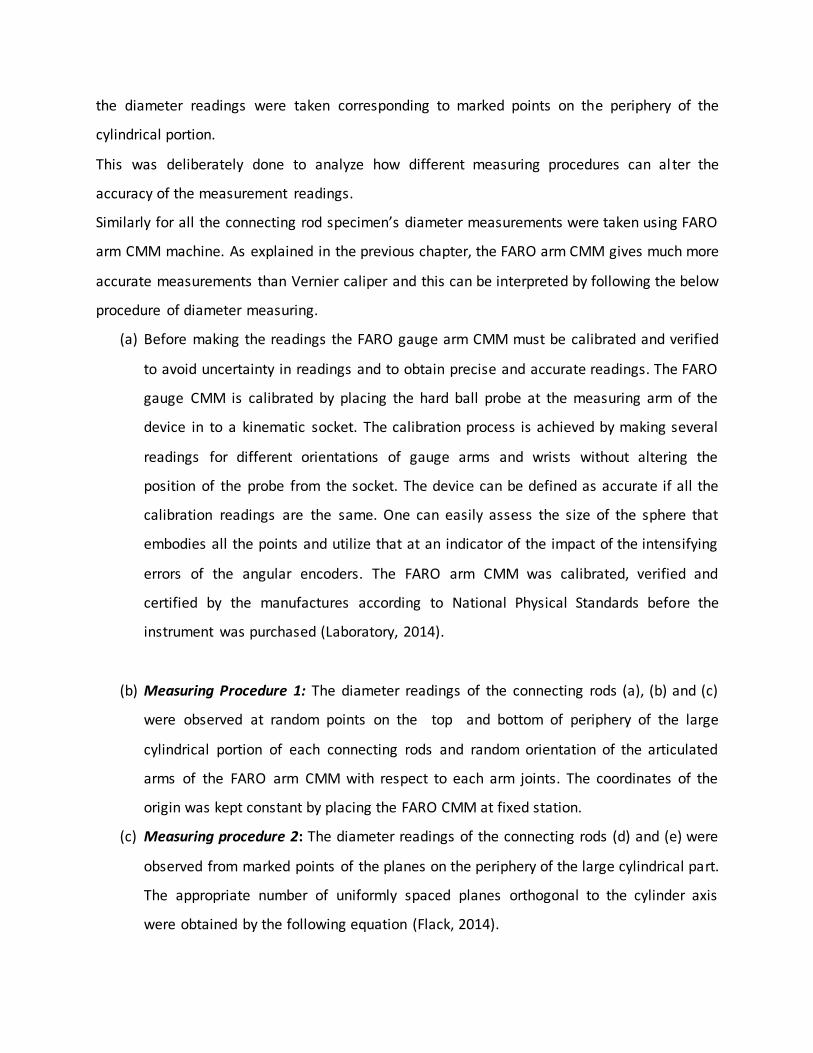
the diameter readings were taken corresponding to marked points on the periphery of the
cylindrical portion.
This was deliberately done to analyze how different measuring procedures can al ter the
accuracy of the measurement readings.
Similarly for all the connecting rod specimen’s diameter measurements were taken using FARO
arm CMM machine. As explained in the previous chapter, the FARO arm CMM gives much more
accurate measurements than Vernier caliper and this can be interpreted by following the below
procedure of diameter measuring.
(a) Before making the readings the FARO gauge arm CMM must be calibrated and verified
to avoid uncertainty in readings and to obtain precise and accurate readings. The FARO
gauge CMM is calibrated by placing the hard ball probe at the measuring arm of the
device in to a kinematic socket. The calibration process is achieved by making several
readings for different orientations of gauge arms and wrists without altering the
position of the probe from the socket. The device can be defined as accurate if all the
calibration readings are the same. One can easily assess the size of the sphere that
embodies all the points and utilize that at an indicator of the impact of the intensifying
errors of the angular encoders. The FARO arm CMM was calibrated, verified and
certified by the manufactures according to National Physical Standards before the
instrument was purchased (Laboratory, 2014).
(b) Measuring Procedure 1: The diameter readings of the connecting rods (a), (b) and (c)
were observed at random points on the top and bottom of periphery of the large
cylindrical portion of each connecting rods and random orientation of the articulated
arms of the FARO arm CMM with respect to each arm joints. The coordinates of the
origin was kept constant by placing the FARO CMM at fixed station.
(c) Measuring procedure 2: The diameter readings of the connecting rods (d) and (e) were
observed from marked points of the planes on the periphery of the large cylindrical part.
The appropriate number of uniformly spaced planes orthogonal to the cylinder axis
were obtained by the following equation (Flack, 2014).
Where,
‘n’c is the appropriate number of planes orthogonal to the cylinder axis.
‘N’ is the number of observations.
‘h’ is the height of the cylindrical feature.
‘r’ is the radius of the cylindrical feature.
The appropriate number of points to be marked on the planes is obtained by,
(Flack, 2014).
Where,
‘n’c is the appropriate number of planes orthogonal to the cylinder axis.
‘N’ is the number of observations.
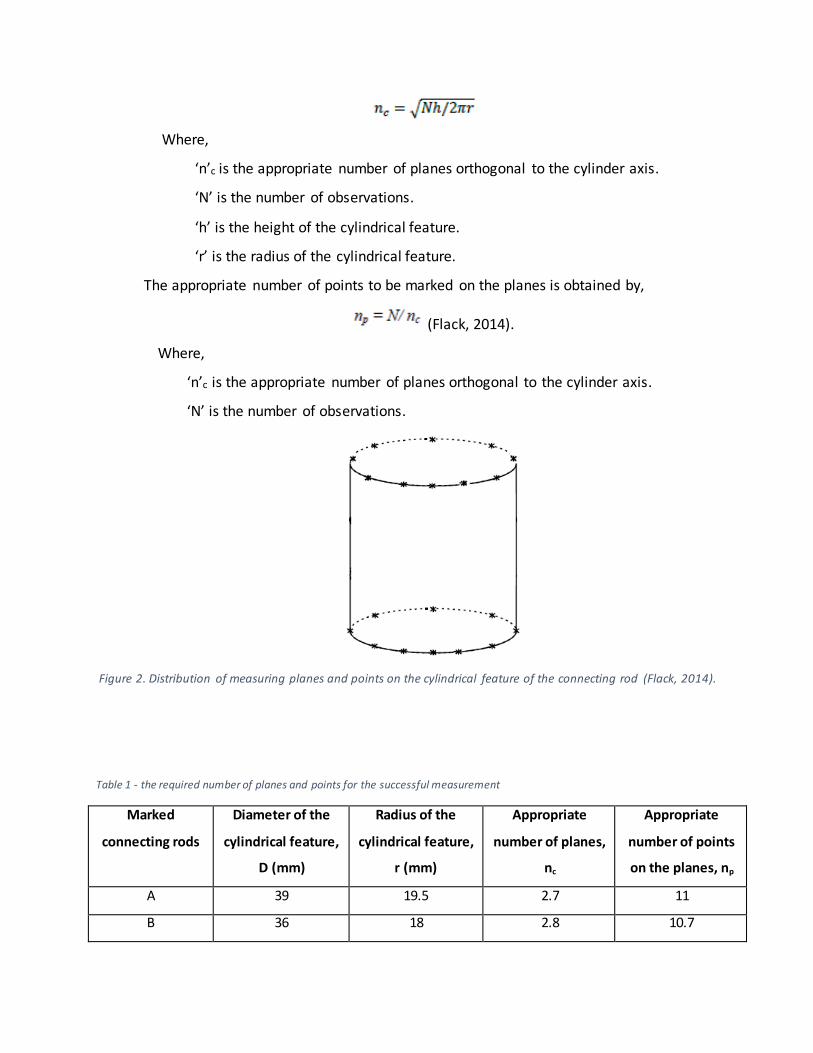
Figure 2. Distribution of measuring planes and points on the cylindrical feature of the connecting rod (Flack, 2014).
Table 1 - the required number of planes and points for the successful measurement
Marked
connecting rods
Diameter of the
cylindrical feature,
D (mm)
Radius of the
cylindrical feature,
r (mm)
Appropriate
number of planes,
nc
Appropriate
number of points
on the planes, np
A 39 19.5 2.7 11
B 36 18 2.8 10.7
C 41 20.5 2.6 11.3
D 48 24 2.4 12.2
E 18 18 2.8 10.7
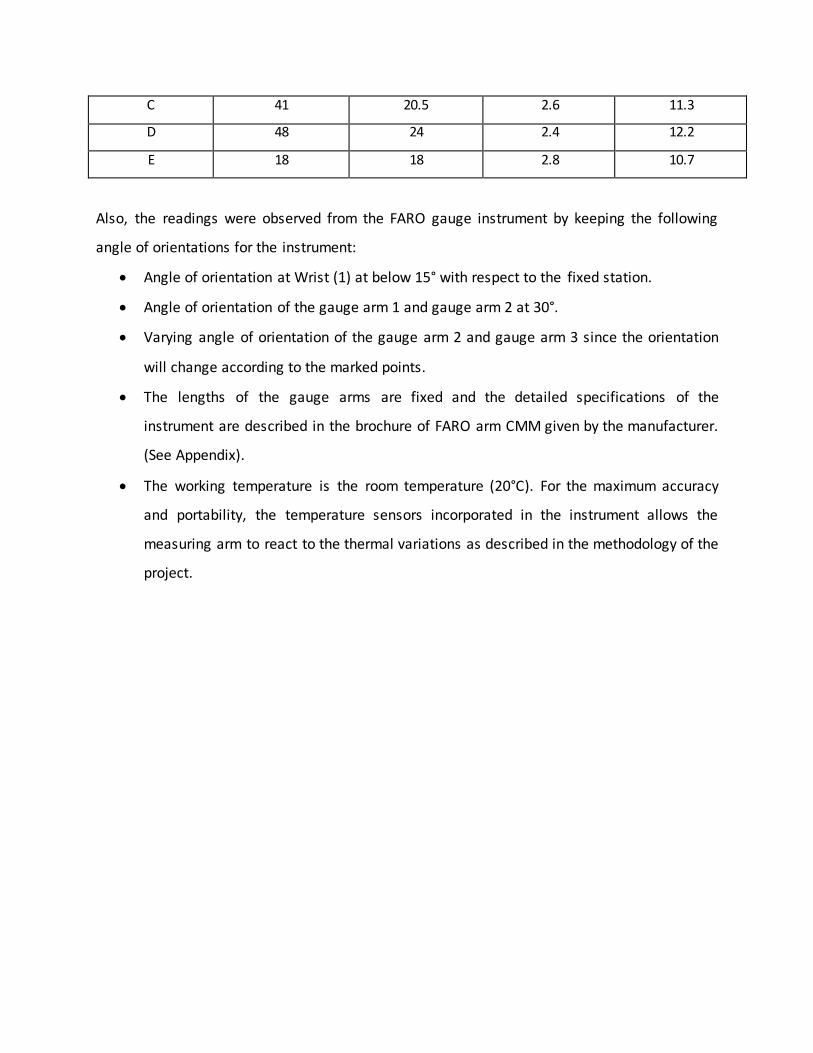
Also, the readings were observed from the FARO gauge instrument by keeping the following
angle of orientations for the instrument:
Angle of orientation at Wrist (1) at below 15° with respect to the fixed station.
Angle of orientation of the gauge arm 1 and gauge arm 2 at 30°.
Varying angle of orientation of the gauge arm 2 and gauge arm 3 since the orientation
will change according to the marked points.
The lengths of the gauge arms are fixed and the detailed specifications of the
instrument are described in the brochure of FARO arm CMM given by the manufacturer.
(See Appendix).
The working temperature is the room temperature (20°C). For the maximum accuracy
and portability, the temperature sensors incorporated in the instrument allows the
measuring arm to react to the thermal variations as described in the methodology of the
project.
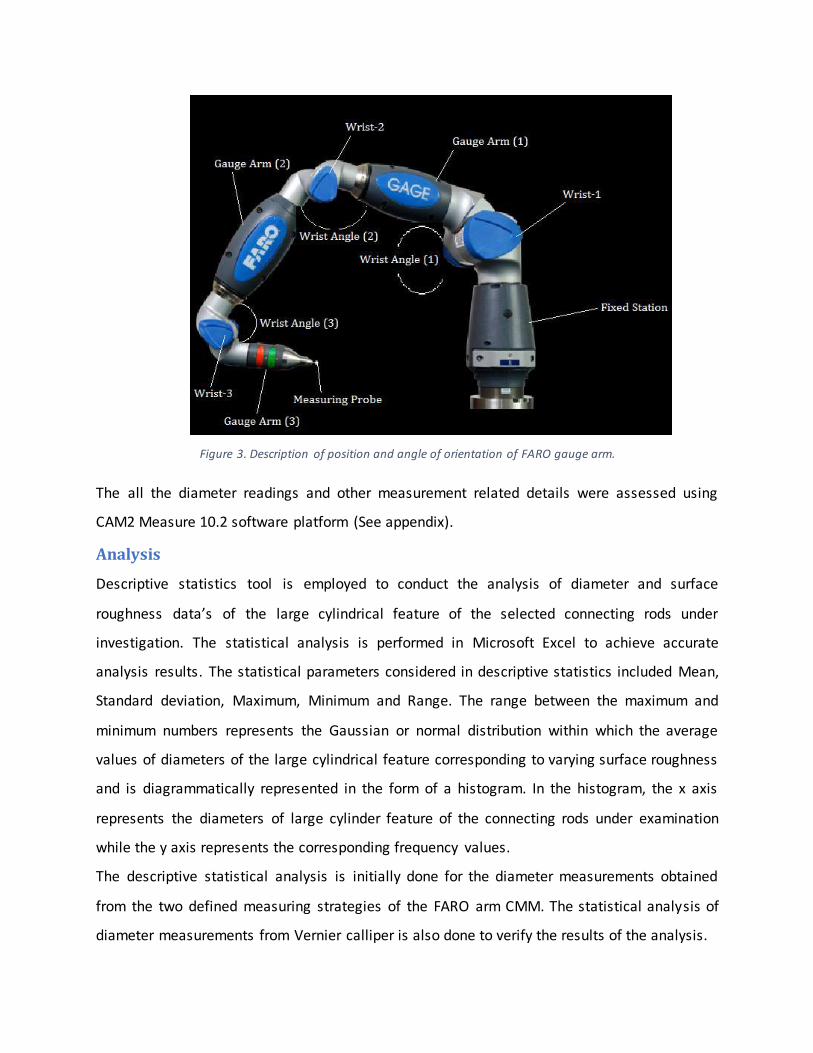
Figure 3. Description of position and angle of orientation of FARO gauge arm.
The all the diameter readings and other measurement related details were assessed using
CAM2 Measure 10.2 software platform (See appendix).
Analysis
Descriptive statistics tool is employed to conduct the analysis of diameter and surface
roughness data’s of the large cylindrical feature of the selected connecting rods under
investigation. The statistical analysis is performed in Microsoft Excel to achieve accurate
analysis results. The statistical parameters considered in descriptive statistics included Mean,
Standard deviation, Maximum, Minimum and Range. The range between the maximum and
minimum numbers represents the Gaussian or normal distribution within which the average
values of diameters of the large cylindrical feature corresponding to varying surface roughness
and is diagrammatically represented in the form of a histogram. In the histogram, the x axis
represents the diameters of large cylinder feature of the connecting rods under examination
while the y axis represents the corresponding frequency values.
The descriptive statistical analysis is initially done for the diameter measurements obtained
from the two defined measuring strategies of the FARO arm CMM. The statistical analysis of
diameter measurements from Vernier calliper is also done to verify the results of the analysis.

Statistical Analysis of FARO arm measurements.
For each of the analysis, the band width of the bin of the histogram is theoretically calculated
for the optimum bin size and is given by the formula (Jenkinson, 2014),
ℎ = 3.5𝜎
𝑛1/3
Where,
‘h’ is the band width of the bin.
‘σ’ is the standard deviation.
‘n’ is the number of readings.
(a) Low Carbon Steel Connecting Rod
The table shows the descriptive statistical values for 30 sets of diameter readings of the large
cylindrical feature of the connecting rod made of low carbon steel and the surface roughness
value, Ra=0.38µm.
Mean 39.0084
Standard Error 0.005129271
Median 38.999
Mode 38.989
Standard Deviation 0.028094177
Sample Variance 0.000789283
Kurtosis -0.020582247
Skewness 0.800724163
Range 0.11
Minimum 38.974
Maximum 39.084
Sum 1170.252
Count 30
Table 2. Descriptive statistical analysis of diameter readings of the low carbon steel connecting rod.

From the descriptive statistical analysis, the maximum and minimum diameter reading of the
observation is 39.084mm and 38.974mm respectively. The difference between the maximum
and the minimum value is the range and is observed as 0.11mm. The mean diameter values is
approximately 39 and the standard deviation across the range from the mean value is 0.028.
The histogram depicting the frequency of occurrence of the diameter with in each range of
standard deviation is shown
Graph 1. Histogram of diameter readings of the low carbon steel connecting rod.
The greatest range of diameter reading occurrence is between the values 38.974mm and
39.005mm followed by 39.005mm and 39.036mm. By employing the statistical equations,
𝑈𝑝𝑝𝑒𝑟 𝑣𝑎𝑙𝑢𝑒 = 𝑀𝑒𝑎𝑛 + (𝑆𝑡𝑎𝑛𝑑𝑎𝑟𝑑 𝑒𝑟𝑟𝑜𝑟 ∗ 𝑍) , and
𝐿𝑜𝑤𝑒𝑟 𝑣𝑎𝑙𝑢𝑒 = 𝑀𝑒𝑎𝑛 − (𝑆𝑡𝑎𝑛𝑑𝑎𝑟𝑑 𝑒𝑟𝑟𝑜𝑟 ∗ 𝑍)
We can predict that 68% of observed diameter readings lies between the range 39.0033mm
and 39.0135mm, 95% of the diameter readings lies between the range 38.9982mm and
39.0186mm and 99.7% of the diameter readings lies between the range 38.9931mm and
39.0237mm.
(b) MV9 Alloy Connecting Rod

The table shows the descriptive statistical values for 30 sets of diameter readings of the large
cylindrical feature of the connecting rod made of MV9 alloy and the surface roughness value,
Ra=0.66µm.
Mean 36.07006667
Standard Error 0.004645585
Median 36.063
Mode 36.059
Standard Deviation 0.025444915
Sample Variance 0.000647444
Kurtosis -0.168587878
Skewness 0.60776998
Range 0.103
Minimum 36.029
Maximum 36.132
Sum 1082.102
Count 30
Table 3. Descriptive statistical analysis of diameter readings of the MV9 alloy connecting rod.
From the descriptive statistical analysis, the diameter readings fluctuates between 36.029mm
and 36.132mm with in a range of 0.103mm. The mean diameter values is 36.07 and the
standard deviation across the range from the mean value is 0.025.
The histogram depicting the frequency of occurrence of the diameter with in each range of
standard deviation is shown

Graph 2.Histogram of diameter readings of the MV9 alloy connecting rod.
From the Histogram, most of the observed diameter readings falls between 36.057mm and
36.085mm. The statistical analysis reveals that 68% of the observed diameter readings of the
connecting rod lies in the range 36.0649mm and 36.0751mm while 99.7% of the diameter
readings lies in the range 36.0547mm and 36.0853mm.
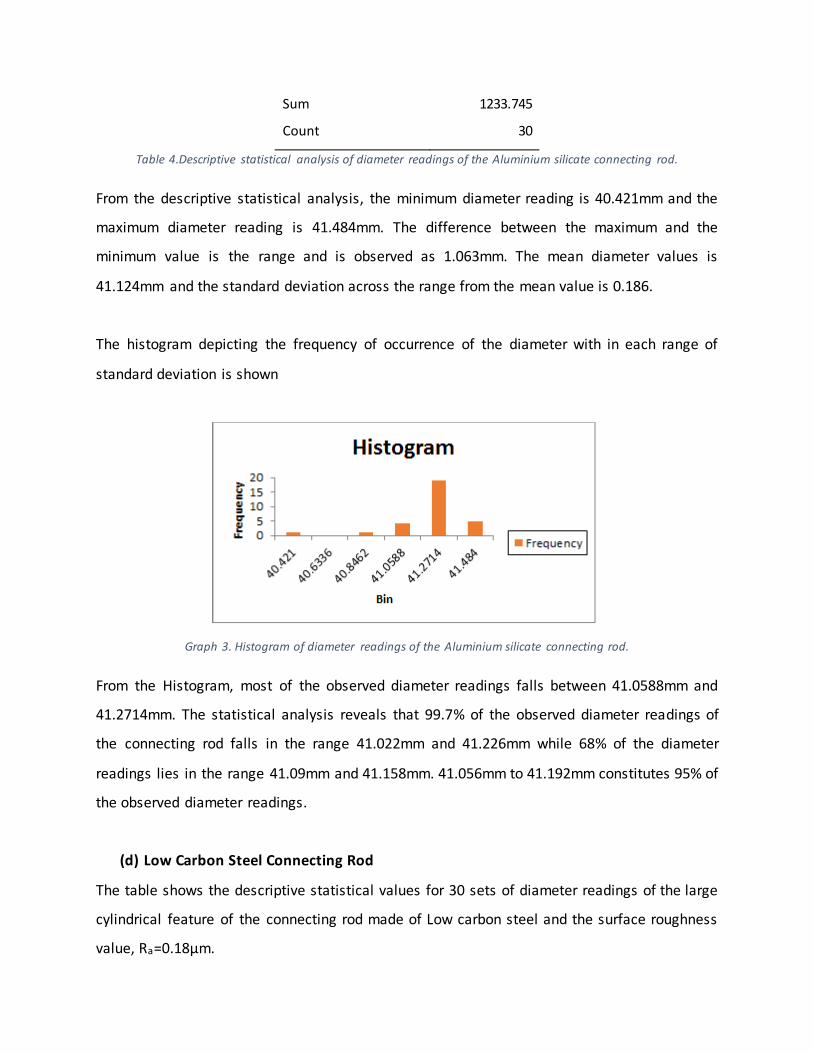
(c) Aluminium Silicate Connecting Rod
The table shows the descriptive statistical values for 30 sets of diameter readings of the large
cylindrical feature of the connecting rod made of Aluminium Sil icate and the surface roughness
value, Ra=1.26µm.
Mean 41.12483333
Standard Error 0.034008115
Median 41.1315
Mode 41.146
Standard Deviation 0.18627012
Sample Variance 0.034696557
Kurtosis 6.583775212
Skewness -1.82601957
Range 1.063
Minimum 40.421
Maximum 41.484
Sum 1233.745
Count 30
Table 4.Descriptive statistical analysis of diameter readings of the Aluminium silicate connecting rod.
From the descriptive statistical analysis, the minimum diameter reading is 40.421mm and the
maximum diameter reading is 41.484mm. The difference between the maximum and the
minimum value is the range and is observed as 1.063mm. The mean diameter values is
41.124mm and the standard deviation across the range from the mean value is 0.186.
The histogram depicting the frequency of occurrence of the diameter with in each range of
standard deviation is shown
Graph 3. Histogram of diameter readings of the Aluminium silicate connecting rod.
From the Histogram, most of the observed diameter readings falls between 41.0588mm and
41.2714mm. The statistical analysis reveals that 99.7% of the observed diameter readings of
the connecting rod falls in the range 41.022mm and 41.226mm while 68% of the diameter
readings lies in the range 41.09mm and 41.158mm. 41.056mm to 41.192mm constitutes 95% of
the observed diameter readings.
(d) Low Carbon Steel Connecting Rod
The table shows the descriptive statistical values for 30 sets of diameter readings of the large
cylindrical feature of the connecting rod made of Low carbon steel and the surface roughness
value, Ra=0.18µm.

Mean 48.1828
Standard Error 0.002472562
Median 48.1845
Mode 48.187
Standard Deviation 0.01354278
Sample Variance 0.000183407
Kurtosis 0.547812479
Skewness -0.96958511
Range 0.05
Minimum 48.15
Maximum 48.2
Sum 1445.484
Count 30
Table 5. Descriptive statistical analysis of diameter readings of the Low carbon steel connecting rod.
From the descriptive statistical analysis, the minimum diameter reading and the maximum
diameter reading achieved is 48.15mm and 48.2mm respectively. The difference between the
maximum and the minimum value is the range and is observed as 0.05mm. The mean diameter
values is 48.1828mm and the standard deviation across the range from the mean value is
0.0135.
The histogram depicting the frequency of occurrence of the diameter with in each range of
standard deviation is shown

Graph 4.Histogram of diameter readings of the low carbon steel connecting rod.
From the Histogram, the highest frequency range of number of observations is 15 and it
corresponds to the range of diameter readings between 48.182mm and 48.198mm. The
statistical analysis reveals that 68% of the observed diameter readings of the connecting rod
falls in the range 48.1804mm and 48.1852mm while 99.7% of the diameter readings lies in the
range 48.1756mm and 48.1876mm. 95% of the diameter readings of the corresponding
connecting rod were observed between the range 48.178mm and 48.1876mm.
(e) MV9 Alloy Connecting Rod
The table shows the descriptive statistical values for 30 sets of diameter readings of the large
cylindrical feature of the connecting rod made of MV9 alloy and the surface roughness value,
Ra=0.30µm.
Mean 36.01546667
Standard Error 0.002961334
Median 36.0115
Mode 36.008
Standard Deviation 0.016219897
Sample Variance 0.000263085
Kurtosis 14.81463113
Skewness 3.417769412
Range 0.088
Minimum 36.001
Maximum 36.089
Sum 1080.464
Count 30
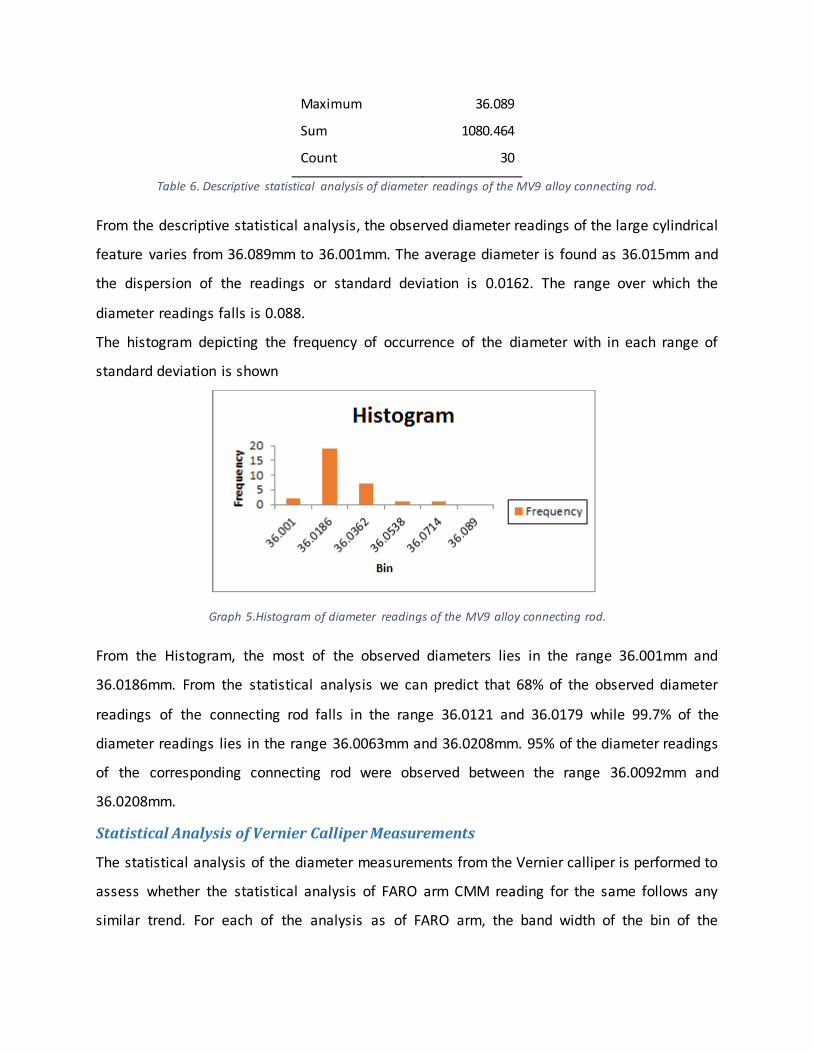
Table 6. Descriptive statistical analysis of diameter readings of the MV9 alloy connecting rod.
From the descriptive statistical analysis, the observed diameter readings of the large cylindrical
feature varies from 36.089mm to 36.001mm. The average diameter is found as 36.015mm and
the dispersion of the readings or standard deviation is 0.0162. The range over which the
diameter readings falls is 0.088.
The histogram depicting the frequency of occurrence of the diameter with in each range of
standard deviation is shown
Graph 5.Histogram of diameter readings of the MV9 alloy connecting rod.
From the Histogram, the most of the observed diameters lies in the range 36.001mm and
36.0186mm. From the statistical analysis we can predict that 68% of the observed diameter
readings of the connecting rod falls in the range 36.0121 and 36.0179 while 99.7% of the
diameter readings lies in the range 36.0063mm and 36.0208mm. 95% of the diameter readings
of the corresponding connecting rod were observed between the range 36.0092mm and
36.0208mm.
Statistical Analysis of Vernier Calliper Measurements
The statistical analysis of the diameter measurements from the Vernier calliper is performed to
assess whether the statistical analysis of FARO arm CMM reading for the same follows any
similar trend. For each of the analysis as of FARO arm, the band width of the bin of the
histogram is theoretically calculated for the optimum bin size and is given by the formula
(Jenkinson, 2014),
ℎ = 3.5𝜎
𝑛1/3
Where,
‘h’ is the band width of the bin.
‘σ’ is the standard deviation.
‘n’ is the number of readings.
(a) Low Carbon Steel Connecting Rod
The table establish the descriptive statistical analysis of the 30 sets of diameter readings of the
large cylindrical feature of the low carbon steel connecting rod with surface roughness, R a as
0.38µm.
Mean 38.83333333
Standard Error 0.031114669
Median 38.92
Mode 38.97
Standard Deviation 0.170422059
Sample Variance 0.029043678
Kurtosis -0.679136819
Skewness -0.879469425
Range 0.52
Minimum 38.48
Maximum 39
Sum 1165
Count 30
Table 7. Descriptive statistical analysis of diameter readings of the low carbon steel connecting rod.

The descriptive analysis reveals that observed diameter readings falls in the range from
38.48mm to 39mm. The mean readings about which a standard deviation of 0.1704 occurs is
38.83mm. The range over which the 30 counts of readings fall is 0.52mm.
The histogram depicting the frequency of occurrence of the diameter with in each range of
standard deviation is shown
Graph 6. Histogram of diameter readings of the low carbon steel connecting rod
From the histogram we can anticipate that 68% of the observed diameter readings lies between
38.79 and 38.86 while 99.7% of the observed readings falls between 38.73 and 38.92. The
maximum frequency value is in the range 38.86mm and 39.05mm. From the shape of the
histogram it can be inferred that the diameter readings does not follow normal distribution like
FARO arm readings for the same connecting rod.
(b) MV9 Alloy Connecting Rod
The table establish the descriptive statistical analysis of the 30 sets of diameter rea dings of the
large cylindrical feature of the MV9 alloy connecting rod with surface roughness, R a as 0.66µm.
Mean 35.78433333
Standard Error 0.033701473
Median 35.81
Mode 35.53
Standard Deviation 0.184590569
Sample Variance 0.034073678
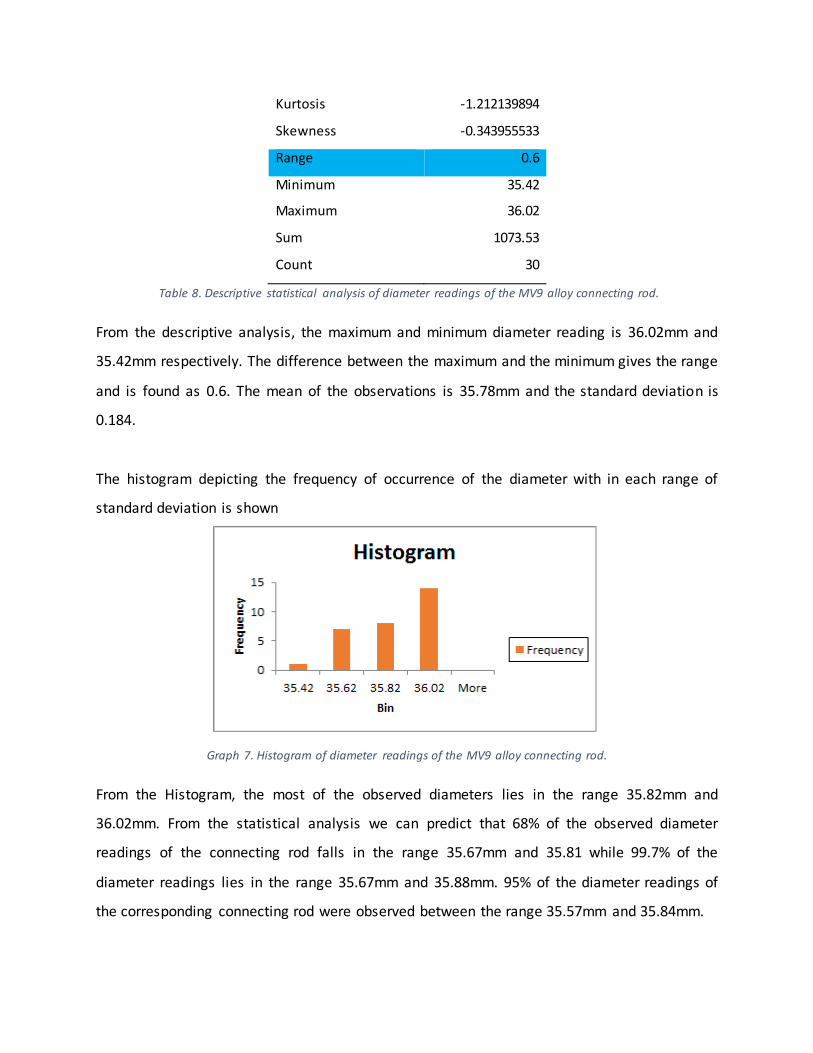
Kurtosis -1.212139894
Skewness -0.343955533
Range 0.6
Minimum 35.42
Maximum 36.02
Sum 1073.53
Count 30
Table 8. Descriptive statistical analysis of diameter readings of the MV9 alloy connecting rod.
From the descriptive analysis, the maximum and minimum diameter reading is 36.02mm and
35.42mm respectively. The difference between the maximum and the minimum gives the range
and is found as 0.6. The mean of the observations is 35.78mm and the standard deviation is
0.184.
The histogram depicting the frequency of occurrence of the diameter with in each range of
standard deviation is shown
Graph 7. Histogram of diameter readings of the MV9 alloy connecting rod.
From the Histogram, the most of the observed diameters lies in the range 35.82mm and
36.02mm. From the statistical analysis we can predict that 68% of the observed diameter
readings of the connecting rod falls in the range 35.67mm and 35.81 while 99.7% of the
diameter readings lies in the range 35.67mm and 35.88mm. 95% of the diameter readings of
the corresponding connecting rod were observed between the range 35.57mm and 35.84mm.
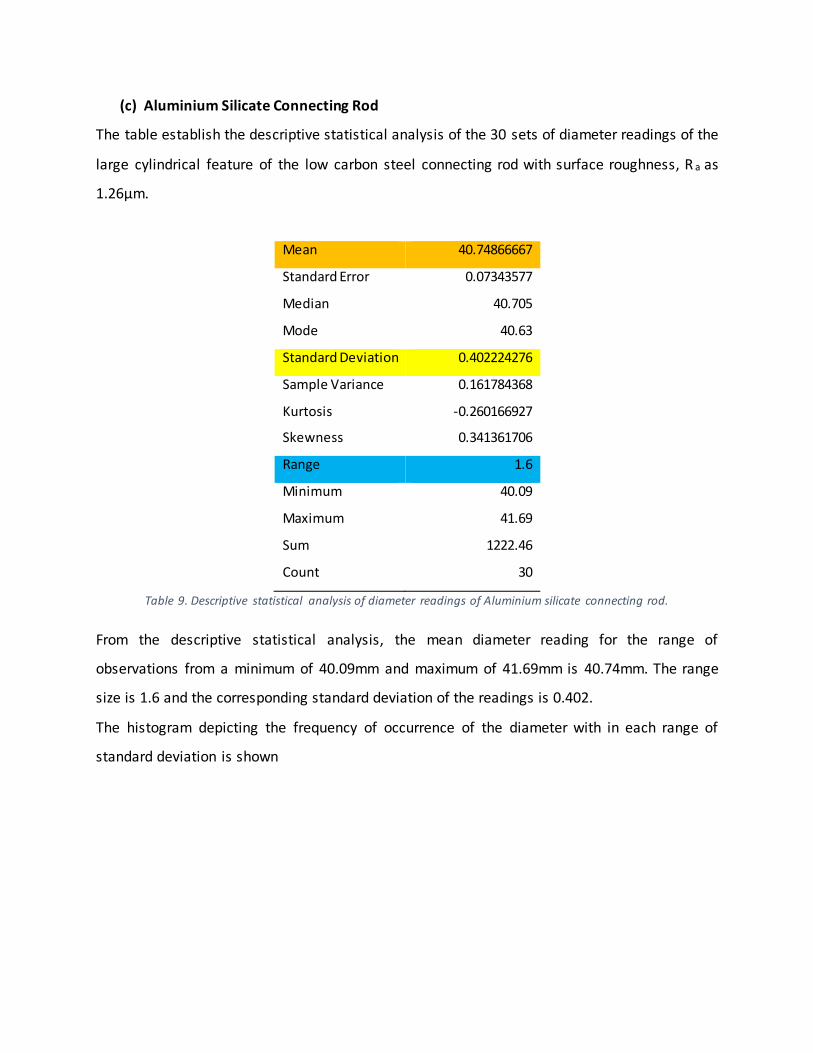
(c) Aluminium Silicate Connecting Rod
The table establish the descriptive statistical analysis of the 30 sets of diameter readings of the
large cylindrical feature of the low carbon steel connecting rod with surface roughness, R a as
1.26µm.
Mean 40.74866667
Standard Error 0.07343577
Median 40.705
Mode 40.63
Standard Deviation 0.402224276
Sample Variance 0.161784368
Kurtosis -0.260166927
Skewness 0.341361706
Range 1.6
Minimum 40.09
Maximum 41.69
Sum 1222.46
Count 30
Table 9. Descriptive statistical analysis of diameter readings of Aluminium silicate connecting rod.
From the descriptive statistical analysis, the mean diameter reading for the range of
observations from a minimum of 40.09mm and maximum of 41.69mm is 40.74mm. The range
size is 1.6 and the corresponding standard deviation of the readings is 0.402.
The histogram depicting the frequency of occurrence of the diameter with in each range of
standard deviation is shown
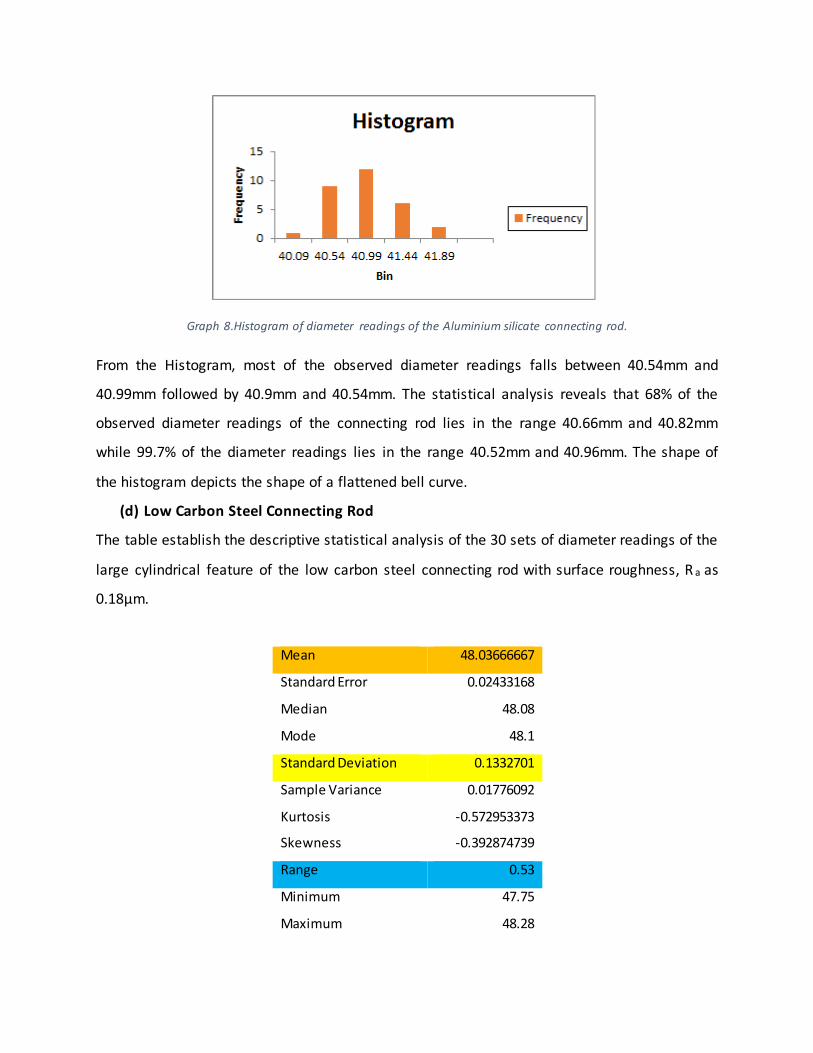
Graph 8.Histogram of diameter readings of the Aluminium silicate connecting rod.
From the Histogram, most of the observed diameter readings falls between 40.54mm and
40.99mm followed by 40.9mm and 40.54mm. The statistical analysis reveals that 68% of the
observed diameter readings of the connecting rod lies in the range 40.66mm and 40.82mm
while 99.7% of the diameter readings lies in the range 40.52mm and 40.96mm. The shape of
the histogram depicts the shape of a flattened bell curve.
(d) Low Carbon Steel Connecting Rod
The table establish the descriptive statistical analysis of the 30 sets of diameter readings of the
large cylindrical feature of the low carbon steel connecting rod with surface roughness, R a as
0.18µm.
Mean 48.03666667
Standard Error 0.02433168
Median 48.08
Mode 48.1
Standard Deviation 0.1332701
Sample Variance 0.01776092
Kurtosis -0.572953373
Skewness -0.392874739
Range 0.53
Minimum 47.75
Maximum 48.28

Sum 1441.1
Count 30
Table 10.Descriptive statistical analysis of diameter readings of low carbon steel connecting rod.
From the descriptive analysis, the maximum and minimum diameter of the observations is
48.28mm and 47.75mm with mean value of 48.036mm. The difference between the maximum
and the minimum values gives the range of the diameter distribution and is observed as
0.53mm and the corresponding standard deviation is found as 0.133.
The histogram depicting the frequency of occurrence of the diameter with in each range of
standard deviation is shown
Graph 9. Histogram of diameter readings of the low carbon steel connecting rod.
From the Histogram, the most of the observed diameters lies in the range 48.03mm and
48.17mm. From the statistical analysis we can predict that 68% of the observed diameter
readings of the connecting rod falls in the range 47.78mm and 48.27mm while 99.7% of the
diameter readings lies in the range 47.30mm and 48.75mm. 95% of the diameter readings of
the corresponding connecting rod were observed between the range 47.54mm and 48.52mm.
The shape of the histogram reveals a uniform probability distribution of diameter readings.
(e) MV9 Alloy Connecting Rod
The table establish the descriptive statistical analysis of the 30 sets of diameter readings of the
large cylindrical feature of the low carbon steel connecting rod with surface roughness, R a as
0.30µm.
Mean 36.052
Standard Error 0.025508169
Median 36.08
Mode 36.08
Standard Deviation 0.139713994
Sample Variance 0.01952
Kurtosis
-
0.791917666
Skewness -0.13323168
Range 0.5
Minimum 35.8
Maximum 36.3
Sum 1081.56
Count 30
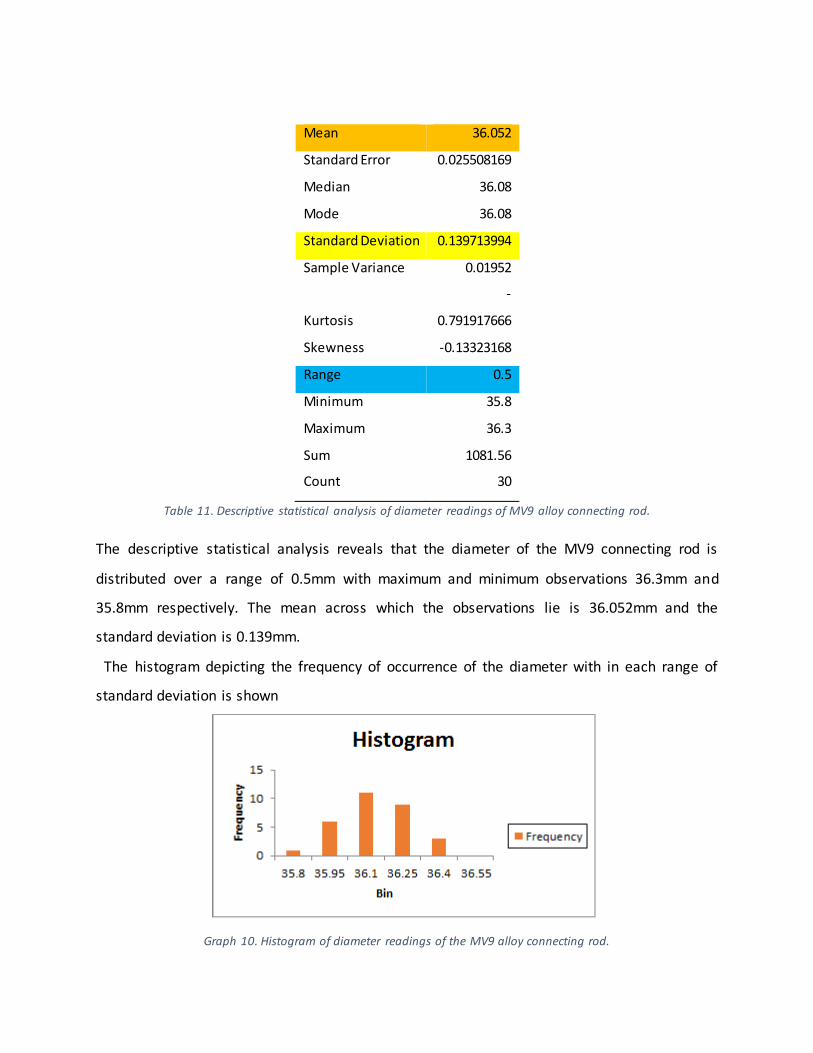
Table 11. Descriptive statistical analysis of diameter readings of MV9 alloy connecting rod.
The descriptive statistical analysis reveals that the diameter of the MV9 connecting rod is
distributed over a range of 0.5mm with maximum and minimum observations 36.3mm and
35.8mm respectively. The mean across which the observations lie is 36.052mm and the
standard deviation is 0.139mm.
The histogram depicting the frequency of occurrence of the diameter with in each range of
standard deviation is shown
Graph 10. Histogram of diameter readings of the MV9 alloy connecting rod.

From the Histogram, most of the observed diameter readings falls between 35.95mm and
36.1mm. The statistical analysis reveals that 68% of the observed diameter readings of the
connecting rod lies in the range 36.02mm and 36.07 while 99.7% of the diameter readings lies
in the range 35.98mm and 36.13mm. The shape of the histogram depicts a perfect bell curve
graph.
Results and Discussions
The major objective of the investigation was to analyse the correlation of distribution of
dimensional measurements and surface roughness parameters. The descriptive statistical
analysis is the most suitable tool to quantitavely define the important features of collection of
information’s. Therefore, for the investigation the measurements of five different automobile
connecting rods of varying surface textures were statistically examined.
Results of correlation of the surface roughness and the dimensional
measurements
The correlation signifies how a particular quantity is depended on other parameters. With a
perfect relationship between two quantities helps to define one quantity in terms of the other.
From the analysis it is clear that surface roughness characteristics has an impact on the
distribution of measurement result for the large cylindrical feature diameter measurement of
the automobile connecting rod. This correlation can be revealed by plotting a graph of surface
roughness of the different connecting rod under investigation and the corresponding standard
deviation of the diameter measurements.
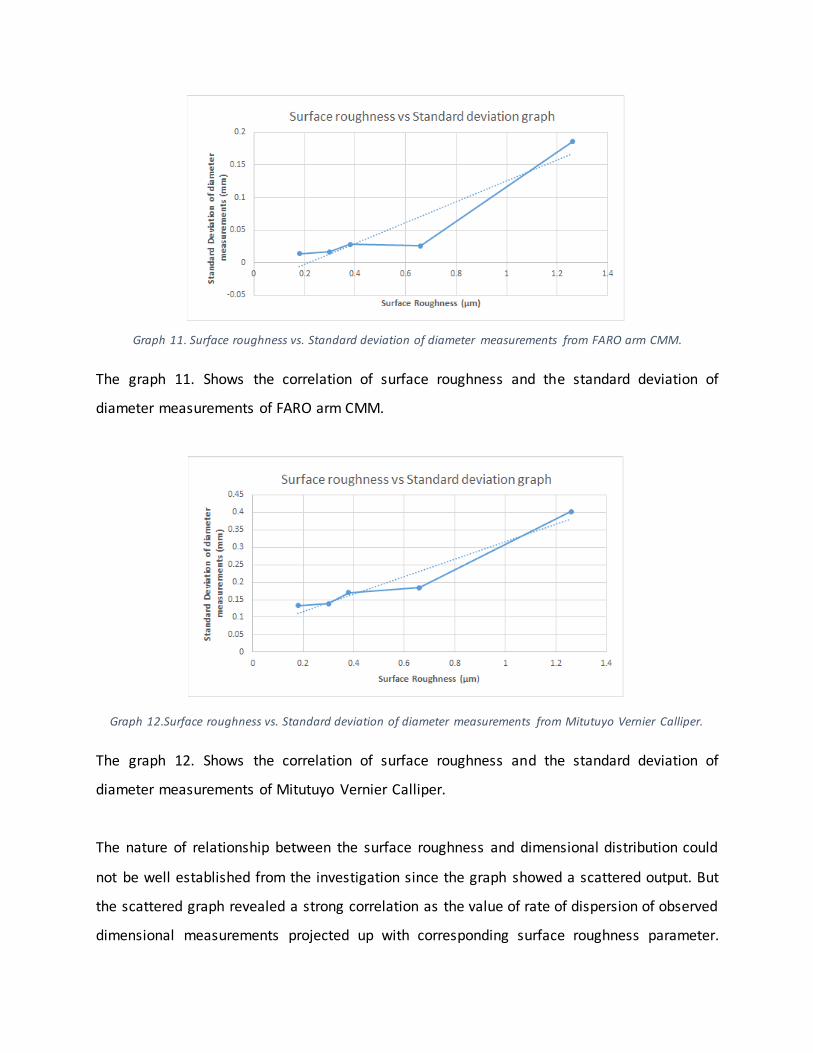
Graph 11. Surface roughness vs. Standard deviation of diameter measurements from FARO arm CMM.
The graph 11. Shows the correlation of surface roughness and the standard deviation of
diameter measurements of FARO arm CMM.
Graph 12.Surface roughness vs. Standard deviation of diameter measurements from Mitutuyo Vernier Calliper.
The graph 12. Shows the correlation of surface roughness and the standard deviation of
diameter measurements of Mitutuyo Vernier Calliper.
The nature of relationship between the surface roughness and dimensional distribution could
not be well established from the investigation since the graph showed a scattered output. But
the scattered graph revealed a strong correlation as the value of rate of dispersion of observed
dimensional measurements projected up with corresponding surface roughness parameter.
Plotting an imaginary line through the maximum points as shown in figure 11 and figure 12
would help to identify an improved correlation. The line obtained showed a direct relationship
between the variables for both the graphs. Hence, the investigation shows a linear relationship
of distribution of dimensional measurement and the surface roughness parameter. An
improved correlation data could be produced if more similar components were examined.
Also, the defined experimental methodology showed following results:
1. The Mitutuyo Vernier calliper observations showed a wide range of dispersion of
diameter readings of the large cylindrical feature of the automobile connecting rod
compared to FARO arm CMM. Also, the observations made from FARO gauge arm
produced a Gaussian bell curve which reveals that all the readings were uniformly
distributed across the mean reading. This may be due to high precision and accuracy of
FARO gauge instrument as defined in the methodology.
2. The methodology defined two different procedures for the dimensional measurement
of the connecting rods. This was deliberately done to verify the accuracy and
uncertainties in following different measuring procedures. Out of the two experimental
procedures, the experimental procedure followed to measure the diameter of the large
cylindrical feature of the connecting rods marked (c) and (d) as suggested by the
National Physical Laboratory- good practise guideline for CMM measurements gave an
healthy output for the analysis of the investigation.
3. A fluctuating histogram shape was noted during the analysis of dimensional
measurements. This may be due to varying profile of the surface roughness of the
examined cylindrical feature.
Conclusions
The paper looks at the relationship between distribution of large cylindrical diameter
measurements and the corresponding surface roughness of an automobile connecting rod. An
experiment was conducted experiment using both Vernier scales and Faro Gage to measure
diameter of the large cylinder feature of automotive connecting rods and their corresponding
surface roughness. We have analysed the correlation of the surface roughness versus the
diameter measurements using statistical methods for each sample and attempted to
understand whether the surface roughness characteristics have direct impact on the
distribution of measurement result for the cylinder diameter measurement.
We find that the relationship means how a specific quantity is relied on upon different
parameters. With an impeccable relationship between two quantities, it serves to characterize
one quantity regarding the other. From the investigation it is clear that surface roughness
qualities has an effect on the appropriation of estimation result for the large cylindrical feature
diameter width estimation of the auto associating pole. This connection can be uncovered by
plotting a chart of surface roughness of the distinctive interfacing bar under scrutiny and the
relating standard deviation of the measurement estimations.
The way of relationship between the surface roughness and dimensional dissemination couldn't
be settled from the examination since the chart demonstrated a scattered yield. However the
scattered diagram uncovered a solid connection as the estimation of rate of scattering of
watched dimensional estimations anticipated up with relating surface roughness parameter.
Plotting a graph through the greatest focuses as demonstrated in figure 11 and figure 12 would
help to recognize an enhanced connection. The line acquired demonstrated an immediate
relationship between the variables for both the diagrams. Henceforth, the examination
demonstrates a straight relationship of circulation of dimensional estimation and the surface
roughness parameter. Enhanced relationship information could be delivered if more
comparable parts were inspected. Additionally, the characterized exploratory strategy indicated
after results The Mitutuyo Vernier caliper perceptions demonstrated an extensive variety of

scattering of distance across readings of the huge tube shaped gimmick of the vehicles
associating bar contrasted with FARO arm CMM. Likewise, the perceptions produced using
FARO gage arm created a Gaussian chime bend which uncovers that all the readings were
consistently appropriated over the mean perusing. This may be because of high exactness and
precision of FARO gage instrument as characterized in the philosophy. The approach
characterized two separate methodologies for the dimensional estimation of the uniting bars.
This was deliberately done to confirm the exactness and instabilities in after diverse measuring
systems. Out of the two test methodology, the exploratory method took after to gauge the
width of the vast tube shaped diameter of the interfacing bars checked (c) and (d) as proposed
by the National Physical Laboratory- great practice rule for CMM estimations gave a sound yield
for the investigation of the examination. A fluctuating histogram shape was noted amid the
investigation of dimensional estimations. This may be because of fluctuating profile of the
surface roughness of the analyzed cylindrical diameter.
Recommendations
References