Carpenter, 1987. Regulation of Lake Primary Productivity by Food Web Structure.
15
Regulation of Lake Primary Productivity by Food Web Structure Author(s): S. R. Carpenter, J. F. Kitchell, J. R. Hodgson, P. A. Cochran, J. J. Elser, M. M. Elser, D. M. Lodge, D. Kretchmer, X. He, C. N. von Ende Source: Ecology, Vol. 68, No. 6 (Dec., 1987), pp. 1863-1876 Published by: Ecological Society of America Stable URL: http://www.jstor.org/stable/1939878 . Accessed: 16/04/2011 14:52 Your use of the JSTOR archive indicates your acceptance of JSTOR's Terms and Conditions of Use, available at . http://www.jstor.org/page/info/about/policies/terms.jsp. JSTOR's Terms and Conditions of Use provides, in part, that unless you have obtained prior permission, you may not download an entire issue of a journal or multiple copies of articles, and you may use content in the JSTOR archive only for your personal, non-commercial use. Please contact the publisher regarding any further use of this work. Publisher contact information may be obtained at . http://www.jstor.org/action/showPublisher?publisherCode=esa. . Each copy of any part of a JSTOR transmission must contain the same copyright notice that appears on the screen or printed page of such transmission. JSTOR is a not-for-profit service that helps scholars, researchers, and students discover, use, and build upon a wide range of content in a trusted digital archive. We use information technology and tools to increase productivity and facilitate new forms of scholarship. For more information about JSTOR, please contact [email protected]. Ecological Society of America is collaborating with JSTOR to digitize, preserve and extend access to Ecology. http://www.jstor.org
-
Upload
juan-carlos-reyes-hagemann -
Category
Documents
-
view
13 -
download
0
Transcript of Carpenter, 1987. Regulation of Lake Primary Productivity by Food Web Structure.
Regulation of Lake Primary Productivity by Food Web StructureAuthor(s): S. R. Carpenter, J. F. Kitchell, J. R. Hodgson, P. A. Cochran, J. J. Elser, M. M.Elser, D. M. Lodge, D. Kretchmer, X. He, C. N. von EndeSource: Ecology, Vol. 68, No. 6 (Dec., 1987), pp. 1863-1876Published by: Ecological Society of AmericaStable URL: http://www.jstor.org/stable/1939878 .Accessed: 16/04/2011 14:52
Your use of the JSTOR archive indicates your acceptance of JSTOR's Terms and Conditions of Use, available at .http://www.jstor.org/page/info/about/policies/terms.jsp. JSTOR's Terms and Conditions of Use provides, in part, that unlessyou have obtained prior permission, you may not download an entire issue of a journal or multiple copies of articles, and youmay use content in the JSTOR archive only for your personal, non-commercial use.
Please contact the publisher regarding any further use of this work. Publisher contact information may be obtained at .http://www.jstor.org/action/showPublisher?publisherCode=esa. .
Each copy of any part of a JSTOR transmission must contain the same copyright notice that appears on the screen or printedpage of such transmission.
JSTOR is a not-for-profit service that helps scholars, researchers, and students discover, use, and build upon a wide range ofcontent in a trusted digital archive. We use information technology and tools to increase productivity and facilitate new formsof scholarship. For more information about JSTOR, please contact [email protected].
Ecological Society of America is collaborating with JSTOR to digitize, preserve and extend access to Ecology.
http://www.jstor.org
Ecology, 68(6), 1987, pp. 1863-1876 ? 1987 by the Ecological Society of America
REGULATION OF LAKE PRIMARY PRODUCTIVITY BY FOOD WEB STRUCTURE'
S. R. CARPENTER Department of Biological Sciences, University of Notre Dame, Notre Dame, Indiana 46556 USA
J. F. KITCHELL Center for Limnology, University of Wisconsin, Madison, Wisconsin 53706 USA
J. R. HODGSON AND P. A. COCHRAN Division of Natural Sciences, St. Norbert College, De Pere, Wisconsin 54115 USA
J. J. ELSER AND M. M. ELSER Department of Biological Sciences, University of Notre Dame, Notre Dame, Indiana 46556 USA
D. M. LODGE,2 D. KRETCHMER, AND X. HE Center for Limnology, University of Wisconsin, Madison, Wisconsin 53706 USA
AND
C. N. VON ENDE Department of Biological Sciences, Northern Illinois University, DeKalb, Illinois 60115 USA
Abstract. We performed whole-lake manipulations of fish populations to test the hy- pothesis that higher trophic levels regulate zooplankton and phytoplankton community structure, biomass, and primary productivity. The study involved three lakes and spanned 2 yr. Results demonstrated hierarchical control of primary production by abiotic factors and a trophic cascade involving fish predation.
In Paul Lake, the reference lake, productivity varied from year to year, illustrating the effects of climatic factors and the natural dynamics of unmanipulated food web interactions. In Tuesday Lake, piscivore addition and planktivore reduction caused an increase in zooplankton biomass, a compositional shift from a copepod/rotifer assemblage to a cla- doceran assemblage, a reduction in algal biomass, and a continuous reduction in primary productivity. In Peter Lake, piscivore reduction and planktivore addition decreased zoo- planktivory, because potential planktivores remained in littoral refugia to escape from remaining piscivores. Both zooplankton biomass and the dominance of large cladocerans increased. Algal biomass and primary production increased because of increased concen- trations of gelatinous colonial green algae.
Food web effects and abiotic factors were equally potent regulators of primary production in these experiments. Some of the unexplained variance in primary productivity of the world's lakes may be attributed to variability in fish populations and its effects on lower trophic levels.
Key words: fish; food web; herbivory; lakes; largemouth bass; piscivory; planktivory; primary pro- duction; zooplankton.
INTRODUCTION
The relative importance of biotic and abiotic factors in the regulation of ecological systems has been debated throughout this century (McIntosh 1985). The as- sumptions that density-dependent factors regulate populations and that communities are near equilibri- um have dominated recent ecological thought, but are presently challenged by evidence that density-indepen- dent factors are important, nonequilibrium popula-
I Manuscript received 2 October 1986; revised 14 January 1987; accepted 18 January 1987.
2 Present address: Department of Biological Sciences, Uni- versity of Notre Dame, Notre Dame, Indiana 46556 USA.
tions are common, and long-term community stability is rare (Caswell 1983, Connell and Sousa 1983). Long- standing tradition in limnology attributes control of ecosystem processes to abiotic factors (Wetzel 1983), while the effects of biotic factors have been recognized principally at the community level (Sih et al. 1985, Kerfoot and Sih 1987). However, many studies have noted the influence of predator-mediated changes in plankton community structure on ecosystem processes (Hrbacek et al. 1961, Brooks and Dodson 1965, Sha- piro 1980, DiBernardi 1981, Carpenter and Kitchell 1984, McQueen et al. 1986).
Lake ecosystem productivity depends on the supply of nutrients, especially phosphorus (Wetzel 1983).
1864 S. R. CARPENTER ET AL. Ecology, Vol. 68, No. 6
However, even in phosphorus-limited lakes, < 50% of the variance in productivity can be explained by phos- phorus loading (Schindler 1978). The cascading trophic interactions hypothesis explains differences in produc- tivity among lakes with similar nutrient supplies but contrasting food webs (Carpenter et al. 1985). In sim- plified form, the cascade hypothesis states that a rise in piscivore biomass brings decreased planktivore bio- mass, increased herbivore biomass, and decreased phy- toplankton biomass (Hrbacek et al. 1961, Shapiro 1980). Specific growth rates at each successive trophic level show opposite responses to biomass. Productivity of each trophic level is maximized at an intermediate biomass of its predators.
According to the cascade hypothesis, lake ecosystem productivity is regulated hierarchically through both biotic and abiotic mechanisms (Carpenter et al. 1985). Abiotic factors such as mixing and nutrient supply es- tablish the potential productivity. Actual productivity is determined by food web structure, which depends largely on the strength of interspecific interactions (Paine 1980).
We tested the cascade hypothesis by performing whole-lake manipulations of fish populations and ex- amining the effects of these manipulations on plankton community structure and primary production. Prior to manipulation, the food web of Tuesday Lake had es- sentially three trophic levels (primary producer, her- bivore, planktivore), while the food webs of Paul and Peter lakes had a fourth trophic level, piscivores. Fol- lowing a year of baseline studies, a reciprocal exchange of fish was carried out between Peter and Tuesday lakes, while Paul Lake remained unmanipulated as a reference ecosystem. Thus, we could determine effects on the plankton of interannual variation in climate and food web structure (Paul Lake) and effects of substan- tial changes in fish community structure (Peter and Tuesday lakes). We expected that exchange of fishes between Peter and Tuesday lakes would make the food webs more similar and thereby increase the functional similarity of these ecosystems. In Tuesday Lake, pis- civore addition and planktivore removal caused major changes in the plankton and primary production that conformed with our hypothesis. In Peter Lake, how- ever, piscivore removal and planktivore addition had surprising consequences that resulted from unexpected behavioral responses of the fish and enhancement by grazers of the growth of certain gelatinous algae.
STUDY LAKEs
Paul, Peter, and Tuesday lakes have long histories of use in experimental limnology (Hasler 1964), and early research on them initiated the experimental ap- proach to ecosystem studies (Likens 1985a). These pri- vate lakes with unexploited fish populations are mor- phometrically similar and lie within 1 km of one another in watersheds owned by the University of Notre Dame.
Recent limnological descriptions of the lakes are given by Carpenter et al. (1986), J. Elser et al. (1986), and M. Elser et al. (1986).
Prior to initial manipulation in 1951, bass were the predominant fish in Paul and Peter lakes (Johnson 1954). Between 1951 and 1976, the lakes were sub- jected to a series of limings (Peter Lake only) and fish manipulations (both lakes), including rotenone treat- ment and stocking of trout (Hasler 1964, M. Elser et al. 1986). Trout populations dwindled by 1970 and a cyprinid-Umbra assemblage (Tonn and Magnuson 1982; hereafter, simply "minnow assemblage") be- came dominant. Largemouth bass (Micropterus sal- moides) were re-introduced to Peter Lake in 1975 and Paul Lake in 1978. By 1980 the minnow assemblage had collapsed and bass dominated the food webs of both lakes (Kitchell and Kitchell 1980). When we be- gan our study in 1984, largemouth bass was the only fish species in the lakes, and the plankton closely re- sembled that found in the lakes prior to initial manip- ulation in 1951 (M. Elser et al. 1986).
Tuesday Lake becomes anoxic each winter, but sup- ports an abundant minnow assemblage of redbelly dace (Phoxinus eos), finescale dace (P. neogaeus), and cen- tral mudminnows (Umbra limit . These planktivores flourish in lakes that winterkill and lack piscivores (Tonn and Magnuson 1982). Tuesday Lake was arti- ficially circulated using compressed air and then stocked with trout in the summer of 1956 (Schmitz 1958). Win- terkill subsequently removed the trout and restored the original minnow assemblage.
METHODS
Experimental design
Fish manipulations in 1985 followed baseline stud- ies in 1984. In 1985, reciprocal fish exchanges were carried out between Peter and Tuesday lakes, while Paul Lake remained undisturbed as a reference eco- system. Approximately 90% of the adult bass biomass in Peter Lake was transplanted to Tuesday Lake, and -90% of the minnow biomass in Tuesday Lake was
moved to Peter Lake. Specifically, 375 bass, weighing 45.7 kg, were moved from Peter Lake to Tuesday Lake during 23-31 May 1985, followed by 91 bass (10.1 kg) on 27 July 1985. Adult bass were spawning during the manipulation in May, and continued to do so after the manipulation in all three lakes. By 27 July 1985, bass remaining in Peter Lake had eliminated the minnow population and were feeding on young-of-the-year (YOY) bass (see Results and Discussion). The addi- tional 91 adult and juvenile bass were moved on 27 July to reduce predation on the large cohort of YOY bass recruited in Peter Lake in 1985. During 23-31 May 1985, 44 901 minnows (39 654 P. eos, 2692 P. neogaeus, and 2655 U. limi), weighing 56.4 kg, were moved from Tuesday Lake to Peter Lake. Fishes were held in live cages or net enclosures for up to 7 d after
December 1987 LAKE PRODUCTIVITY AND FOOD WEB STRUCTURE 1865
capture and before release into Peter and Tuesday lakes. Mortality during holding was <3% for all fish species. Periodic searches following release detected few dead fish.
During summer stratification in 1984 and 1985, fish populations and diets, plankton community structure, and primary production were monitored. We focused our study on summer stratification because metabolic rates are greatest and lakes are least subject to variable mixing regimes during that period.
Fish populations and diets
Bass populations were estimated by mark-recapture using both hook-and-line and electrofishing methods (Bagenal 1978). All adult bass (>195 mm) captured were marked with intramuscular tags. All adult bass in Tuesday Lake, and 50-60% of those in Paul and Peter lakes, were tagged. Double-tag studies showed that tag loss was negligible. Juvenile bass (< 195 mm) were marked by fin clipping. Here we report population estimates made during 14-22 August 1984 and 20-26 August 1985. Since most mortality occurred over win- ters, and young-of-the-year (YOY) bass were difficult to catch in June and July, August studies provided the most satisfactory annual index of bass populations, and intensive sampling efforts were made during these pe- riods. Between 10.8 and 54.3% of marked fish were recaptured in each of these studies.
Methods for analyzing fish diets were described in detail by Hodgson and Kitchell (1987) and will be re- counted briefly here. Diets of juvenile and adult bass were determined by flushing the stomachs of at least 20 bass per lake approximately every other week (Sea- burg 1957). Data presented here are based on a total of 1128 bass stomach samples. Occasional dissections of sacrificed animals indicated that flushing completely removed stomach contents. The index of relative im- portance (IRI), which averages percentages of num- bers, wet mass, and frequency of occurrence contrib- uted by each food type, was used to summarize diets (George and Hadley 1979). The minimum IRI is zero, for items that are not eaten. The maximum IRI is 100%, for a food type that is the sole component of the diet.
Populations of minnows and YOY bass were esti- mated every 2 wk by overnight sets of 36-58 minnow traps per lake, 24 deployed around the perimeter and 12-34 in a midlake transect. YOY bass populations in all three lakes were estimated by mark-recapture using a series of electrofishing samples during 24-30 August 1985. In Tuesday Lake, minnow populations were ana- lyzed by the depletion method (DeLury estimate: Bag- enal 1978) during 23-31 May 1985. When it was pos- sible to catch YOY bass and minnows, their diets were determined by microscopic examination of stomach contents dissected from 5-30 animals per lake on each sampling date.
Limnological methods Limnological methods used in these lakes have been
described in detail previously (Carpenter et al. 1986, J. Elser et al. 1986, M. Elser et al. 1986), and will be summarized briefly here. All limnological variables were measured weekly at a fixed central station in each lake, except where otherwise noted. Profiles were taken of temperature, dissolved oxygen, and light penetration. Water samples were taken with an opaque Van Dom bottle at depths of 100, 50, 25, 10, and 1% of surface irradiance in 1984, and at those depths plus 5% of surface irradiance in 1985. Phytoplankton samples were pooled from the upper three samples, all of which were taken from the mixed layer. Zooplankton were col- lected by vertical hauls of a 75-gm mesh Nitex net (30 cm diameter). Single hauls were made in 1984 and duplicate hauls were pooled in 1985. Throughout this paper, "zooplankton" refers to crustaceans and roti- fers, and does not include Chaoborus. Separate samples for Chaoborus were collected at night by vertical hauls of a 202-gm mesh net. Three to six replicate Chaoborus samples were pooled every 2 wk or at monthly intervals from each lake. The filtering efficiencies of the nets for Chaoborus and for each zooplankton taxon in each lake were calculated from duplicate profiles taken at seven equally spaced depths with a Schindler-Patalas trap.
Chlorophyll a, corrected for pheopigments, was de- termined fluorometrically (Parsons et al. 1984), and the data were employed in the productivity calcula- tions (see below). Samples were collected on Whatman GF/F filters, frozen, sonicated and homogenized in methanol (Marker et al. 1980), centrifuged, and ana- lyzed.
Carbon fixation was determined by the 14C method at the depths listed above. Details of our procedure and the method for calculating daily depth-integrated productivity were given by Carpenter et al. (1986).
Phytoplankton preserved with Lugol's iodine were settled and then identified, measured, and enumerated under an inverted microscope following procedures de- scribed by J. Elser et al. (1986). Both algal unit volume and biovolume (i.e., biologically active volume, con- taining protoplasm and exclusive of gelatinous sheaths, loricae, etc.) were determined (J. Elser et al. 1986). Phytoplankton data were presented in two size classes: <30-gm greatest axial linear dimension (GALD) and > 30-gim GALD. Bag experiments in these lakes showed contrasting responses of these size classes to changes in zooplankton biomass and community composition (Bergquist 1985, Bergquist et al. 1985, Bergquist and Carpenter 1986).
Zooplankton were identified, counted, and measured under a dissecting microscope. Conochilus colonies, which could not be preserved, were counted and mea- sured in fresh samples within an hour of sampling. Dry biomasses were computed as described by Carpenter et al. (1986). Biomass was divided into contributions
1866 S. R. CARPENTER ET AL. Ecology, Vol. 68, No. 6
0.20 PAUL 1985
0.15 -
0.10 _
0.05 -
PERIMETER
ir 0 T o~ I
0 ' 0.20 TUESDAY 1985
a.
It 0.15 - \
,T_ 2: /\
1-0.10 / < 0.10 v'PERIMETER
W~~~~~~~~ 0 0.05 _ z
< / OPEN WATER Z : O _ _ ex
0.20 PETER 1985
0.15 _ \ PERIMETER
/\ v~ AT\ ,--
0.10- /I
0.05 OPEN WATER
JULY AUG SEP OCT
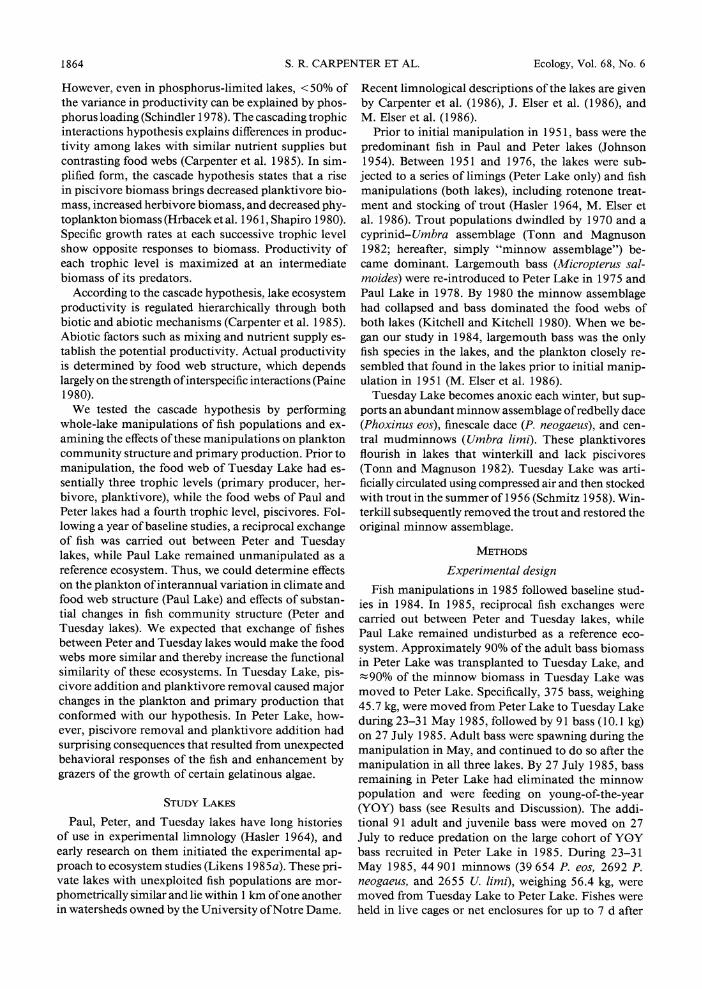
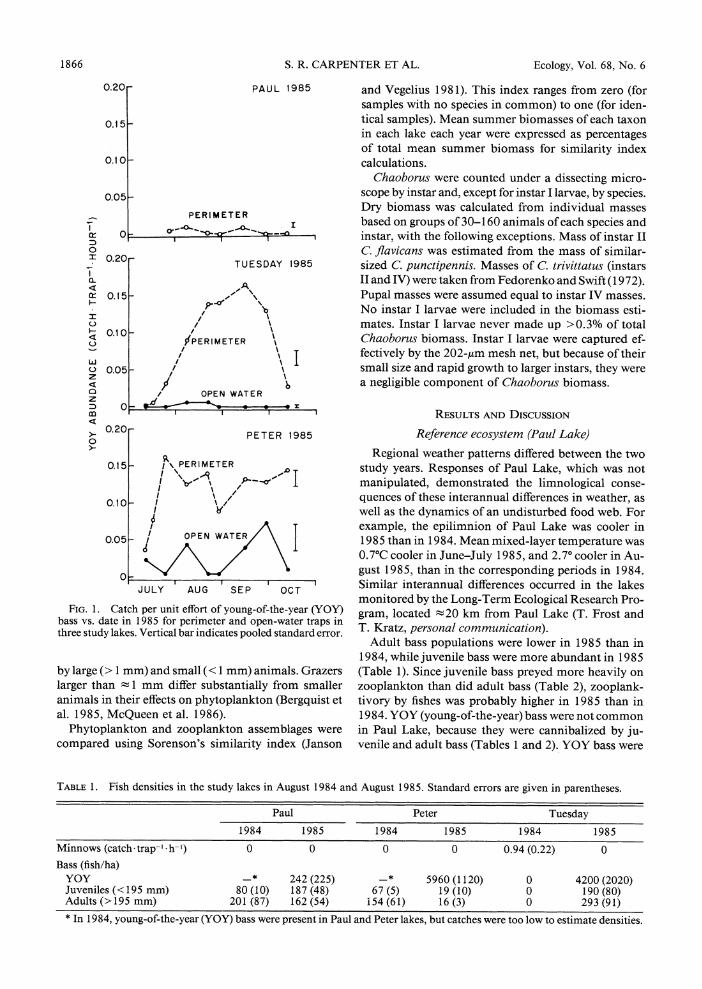
FIG. 1. Catch per unit effort of young-of-the-year (YOY) bass vs. date in 1985 for perimeter and open-water traps in three study lakes. Vertical bar indicates pooled standard error.
by large (> 1 mm) and small (< 1 mm) animals. Grazers larger than 1 mm differ substantially from smaller animals in their effects on phytoplankton (Bergquist et al. 1985, McQueen et al. 1986).
Phytoplankton and zooplankton assemblages were compared using Sorenson's similarity index (Janson
and Vegelius 1981). This index ranges from zero (for samples with no species in common) to one (for iden- tical samples). Mean summer biomasses of each taxon in each lake each year were expressed as percentages of total mean summer biomass for similarity index calculations.
Chaoborus were counted under a dissecting micro- scope by instar and, except for instar I larvae, by species. Dry biomass was- calculated from individual masses based on groups of 30-160 animals of each species and instar, with the following exceptions. Mass of instar II C. flavicans was estimated from the mass of similar- sized C. punctipennis. Masses of C. trivittatus (instars II and IV) were taken from Fedorenko and Swift (1972). Pupal masses were assumed equal to instar IV masses. No instar I larvae were included in the biomass esti- mates. Instar I larvae never made up >0.3% of total Chaoborus biomass. Instar I larvae were captured ef- fectively by the 202-,gm mesh net, but because of their small size and rapid growth to larger instars, they were a negligible component of Chaoborus biomass.
RESULTS AND DISCUSSION
Reference ecosystem (Paul Lake)
Regional weather patterns differed between the two study years. Responses of Paul Lake, which was not manipulated, demonstrated the limnological conse- quences of these interannual differences in weather, as well as the dynamics of an undisturbed food web. For example, the epilimnion of Paul Lake was cooler in 1985 than in 1984. Mean mixed-layer temperature was 0.70C cooler in June-July 1985, and 2.70 cooler in Au- gust 1985, than in the corresponding periods in 1984. Similar interannual differences occurred in the lakes monitored by the Long-Term Ecological Research Pro- gram, located -20 km from Paul Lake (T. Frost and T. Kratz, personal communication).
Adult bass populations were lower in 1985 than in 1984, while juvenile bass were more abundant in 1985 (Table 1). Since juvenile bass preyed more heavily on zooplankton than did adult bass (Table 2), zooplank- tivory by fishes was probably higher in 1985 than in 1984. YOY (young-of-the-year) bass were not common in Paul Lake, because they were cannibalized by ju- venile and adult bass (Tables 1 and 2). YOY bass were
TABLE 1. Fish densities in the study lakes in August 1984 and August 1985. Standard errors are given in parentheses.
Paul Peter Tuesday
1984 1985 1984 1985 1984 1985
Minnows (catch trap-l h-1) 0 0 0 0 0.94 (0.22) 0 Bass (fish/ha)
YOY * 242 (225) -* 5960 (1120) 0 4200 (2020) Juveniles (<195 mm) 80 (10) 187(48) 6-7 (5) 19 (10) 0 190(80) Adults(>195 mm) 201(87) 162(54) i54(61) 16(3) 0 293(91) * In 1984, young-of-the-year (YOY) bass were present in Paul and Peter lakes, but catches were too low to estimate densities.
December 1987 LAKE PRODUCTIVITY AND FOOD WEB STRUCTURE 1867
TABLE 2. Index of relative importance (IRI, %) for selected diet items of juvenile and adult bass in the study lakes in 1984 and 1985.*
1984 1985
Juve- Juve- Lake Food item niles Adults niles Adults
Paul zooplankton 23 7 27 13 Chaoborus 7 19 11 13 fishes 4 4 4 6
Peter zooplankton 21 8 30 27 Chaoborus 7 11 10 11 fishes 4 12 23 17
Tuesday zooplankton -t - 5 7 Chaoborus - - 33 26 fishes - - 31 22
* In all cases the standard error is < 1% (n > 100 in each lake each year).
t Bass were not present in Tuesday Lake in 1984.
concentrated in littoral refugia, and were never caught in open-water traps (Fig. 1).
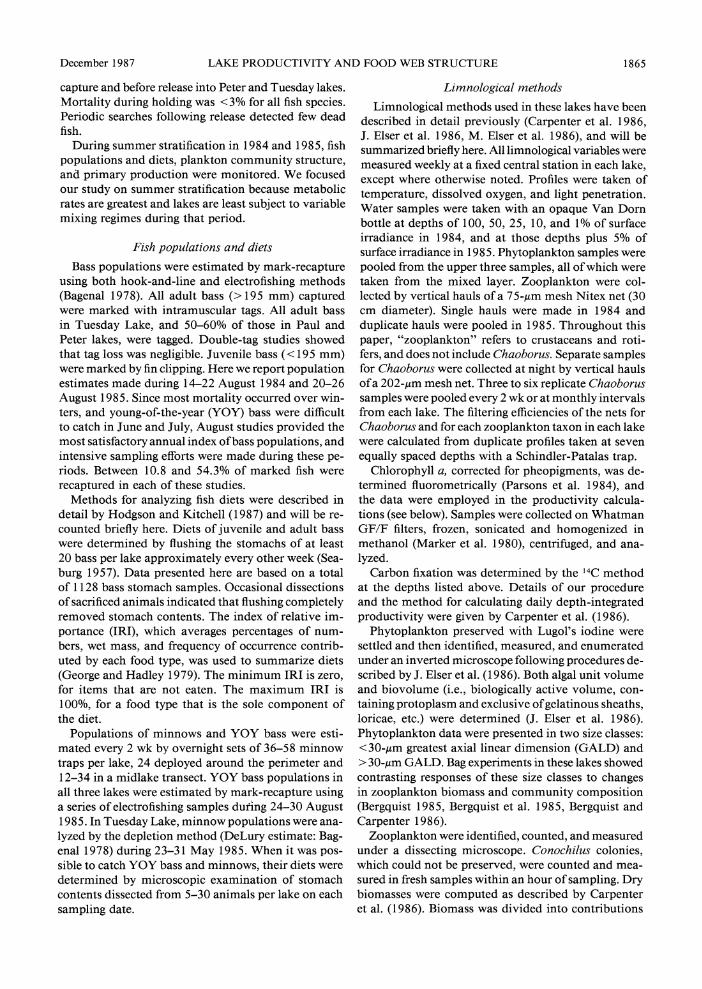
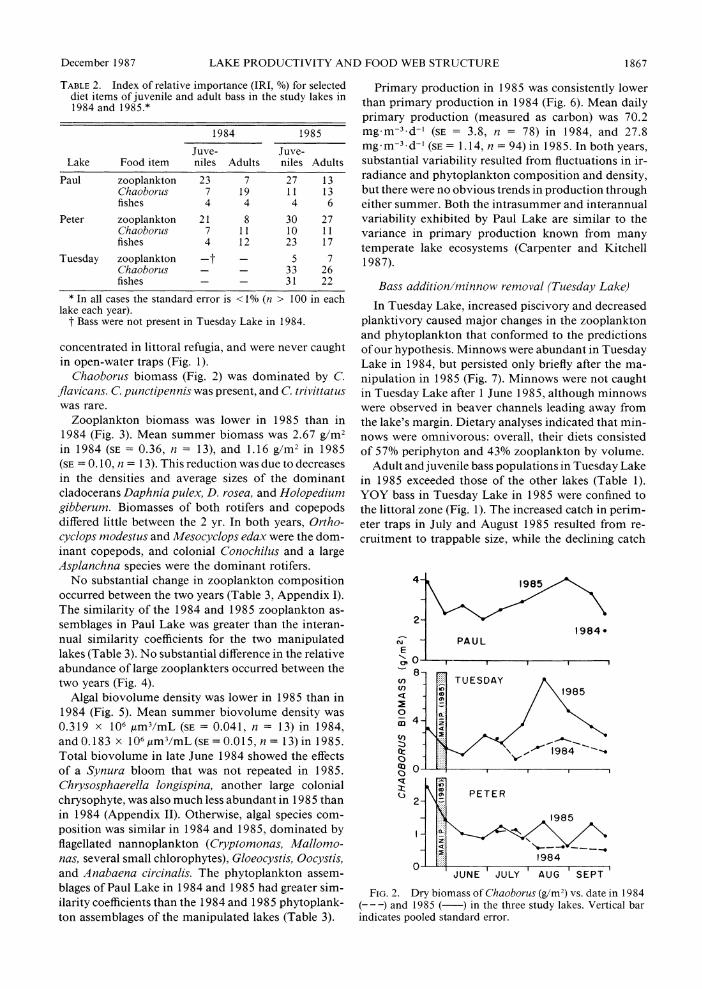
Chaoborus biomass (Fig. 2) was dominated by C. flavicans. C. punctipennis was present, and C. trivittatus was rare.
Zooplankton biomass was lower in 1985 than in 1984 (Fig. 3). Mean summer biomass was 2.67 g/m2 in 1984 (SE =0.36, n = 13), and 1.16 g/m2 in 1985 (SE = 0. 10, n = 13). This reduction was due to decreases in the densities and average sizes of the dominant cladocerans Daphnia pulex, D. rosea, and Holopedium gibberum. Biomasses of both rotifers and copepods differed little between the 2 yr. In both years, Ortho- cyclops modestus and Mesocyclops edax were the dom- inant copepods, and colonial Conochilus and a large Asplanchna species were the dominant rotifers.
No substantial change in zooplankton composition occurred between the two years (Table 3, Appendix I). The similarity of the 1984 and 1985 zooplankton as- semblages in Paul Lake was greater than the interan- nual similarity coefficients for the two manipulated lakes (Table 3). No substantial difference in the relative abundance of large zooplankters occurred between the two years (Fig. 4).
Algal biovolume density was lower in 1985 than in 1984 (Fig. 5). Mean summer biovolume density was 0.319 x 10⁶ AMm3/mL (SE = 0.041, n = 13) in 1984, and0.183 x 106%tm3/mL (SE = 0.015, n = 13) in 1985. Total biovolume in late June 1984 showed the effects of a Synura bloom that was not repeated in 1985. Chrysosphaerella longispina, another large colonial chrysophyte, was also much less abundant in 1985 than in 1984 (Appendix II). Otherwise, algal species com- position was similar in 1984 and 1985, dominated by flagellated nannoplankton (Cryptomonas, Mallomo- nas, several small chlorophytes), Gloeocystis, Oocystis, and Anabaena circinalis. The phytoplankton assem- blages of Paul Lake in 1984 and 1985 had greater sim- ilarity coefficients than the 1984 and 1985 phytoplank- ton assemblages of the manipulated lakes (Table 3).
Primary production in 1985 was consistently lower than primary production in 1984 (Fig. 6). Mean daily primary production (measured as carbon) was 70.2 mg.m-3-d-' (SE = 3.8, n = 78) in 1984, and 27.8 mg.m-3 d-l (SE = 1.14, n = 94) in 1985. In both years, substantial variability resulted from fluctuations in ir- radiance and phytoplankton composition and density, but there were no obvious trends in production through either summer. Both the intrasummer and interannual variability exhibited by Paul Lake are similar to the variance in primary production known from many temperate lake ecosystems (Carpenter and Kitchell 1987).
Bass addition/minnow removal (Tuesday Lake)
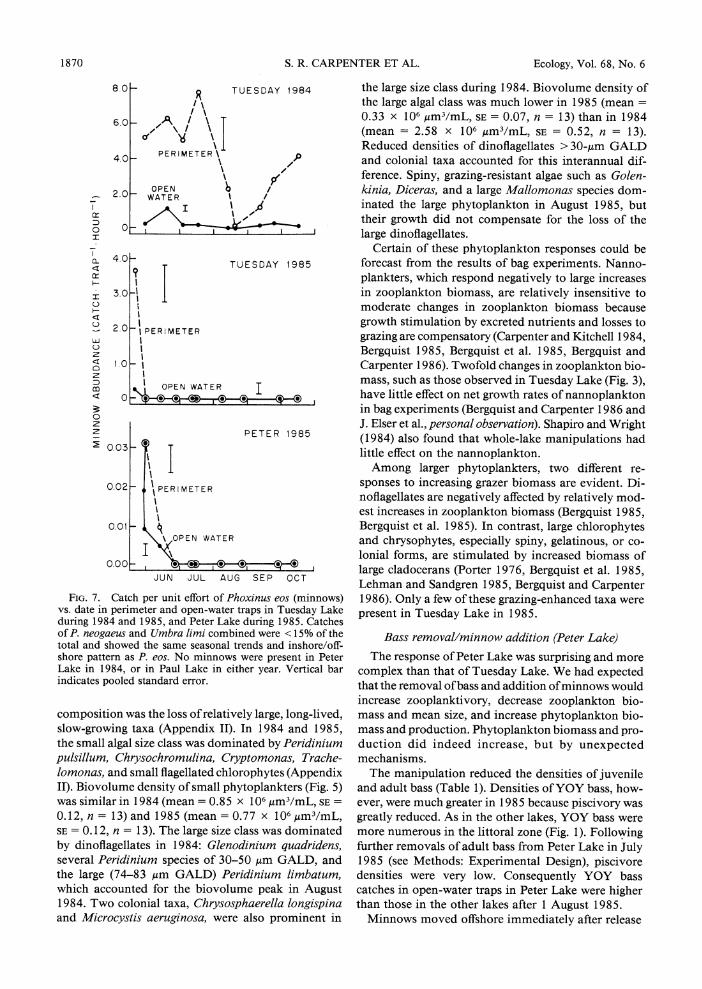
In Tuesday Lake, increased piscivory and decreased planktivory caused major changes in the zooplankton and phytoplankton that conformed to the predictions of our hypothesis. Minnows were abundant in Tuesday Lake in 1984, but persisted only briefly after the ma- nipulation in 1985 (Fig. 7). Minnows were not caught in Tuesday Lake after 1 June 1985, although minnows were observed in beaver channels leading away from the lake's margin. Dietary analyses indicated that min- nows were omnivorous: overall, their diets consisted of 57% periphyton and 43% zooplankton by volume.
Adult and juvenile bass populations in Tuesday Lake in 1985 exceeded those of the other lakes (Table 1). YOY bass in Tuesday Lake in 1985 were confined to the littoral zone (Fig. 1). The increased catch in perim- eter traps in July and August 1985 resulted from re- cruitment to trappable size, while the declining catch
4- 1985 ,
1 984 N - PAUL
E
8- TUESDAY
0- \ E PETER 1985
o
co) ......
ZZ) -t o co
2 PETER
- ~~~~~1985
1984 0
JUNE JULY AUG SEPT
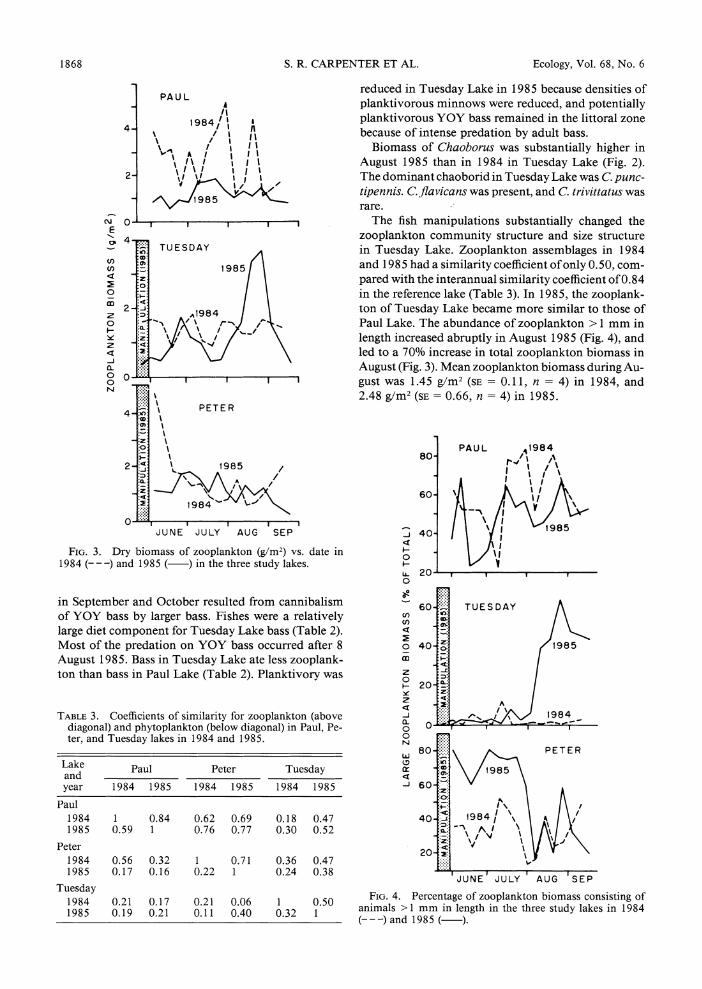
FIG. 2. Dry biomass of Chaoborus (g/m2) vs. date in 1984 ---) and 1985 ( ) in the three study lakes. Vertical bar
indicates pooled standard error.
1868 S. R. CARPENTER ET AL. Ecology, Vol. 68, No. 6
PAUL A
1984/
4-
A A I I
2-'
1985
E 40
<mZo
\ II \.. ,/
1198 /
August~ ~ 184 195sasi-uedyLk"t ls opak
0
FIG.E 3.Dr bofiomasts of similariktoforg/mop)avs.odatebin 1984onal) and 1985 ( ) itn thelthre stdyaonl)iPakes. Pe
iSetembern aneda Octoer reule from cannibalis
Large diet copoenef r Tuesday Lk as(al )
yaugust 4 1985. Bass in8 Tuesda Lae1t9ls8zolak toPtanu asilalLk Tbl ) lntvr a
te,9n8 Tesa lakes in 1984 and7 198 .30 05
LaetPuePtr Tusa
year 019 19 1984 1 1984 198
195 0.9 1 0.6 0.7 030 05
Tuesday 1984 0.21 0.17 0.21 0.06 1 0.50 1985 0.19 0.21 0.11 0.40 0.32 1
reduced in Tuesday Lake in 1985 because densities of planktivorous minnows were reduced, and potentially planktivorous YOY bass remained in the littoral zone because of intense predation by adult bass.
Biomass of Chaoborus was substantially higher in August 1985 than in 1984 in Tuesday Lake (Fig. 2). The dominant chaoborid in Tuesday Lake was C. punc- tipennis. C. flavicans was present, and C. trivittatus was rare.
The fish manipulations substantially changed the zooplankton community structure and size structure in Tuesday Lake. Zooplankton assemblages in 1984 and 1985 had a similarity coefficient of only 0.50, com- pared with the interannual similarity coefficient of 0.84 in the reference lake (Table 3). In 1985, the zooplank- ton of Tuesday Lake became more similar to those of Paul Lake. The abundance of zooplankton > 1 mm in length increased abruptly in August 1985 (Fig. 4), and led to a 70% increase in total zooplankton biomass in August (Fig. 3). Mean zooplankton biomass during Au- gust was 1.45 g/m2 (SE = 0.11, n = 4) in 1984, and 2.48 g/m2 (SE = 0.66, n = 4) in 1985.
PAUL 41984 80 A
<400 j E- 20
0
60-.. TUESDAY l
O40t~~~: V '
0 40 ~ I 985
to 'I
u 0 C ,
20
<t60-X 2 TUSA 1985
0
80 PETE 0
-J 60
20
FIG.4. ercetag ofzolnnbomsIossigo
40-- ) and 1985/ \)/
December 1987 LAKE PRODUCTIVITY AND FOOD WEB STRUCTURE 1869
1984 1985 0.6
PAUL PAUL
0.4-
E "I
ro 0.2 E (0
H TUESDAY
C) 6 E
' TUESDAY
O - _Z...........21S
D
-J 2 0
I L 0
m O ~~~~~~~~~~~~~~2.1
1.2- Z ~ ~ ~ ~~~z PETER
o 0.8- PETER
2: z~~~~~~ 0.4-
0- J J A S J J A S
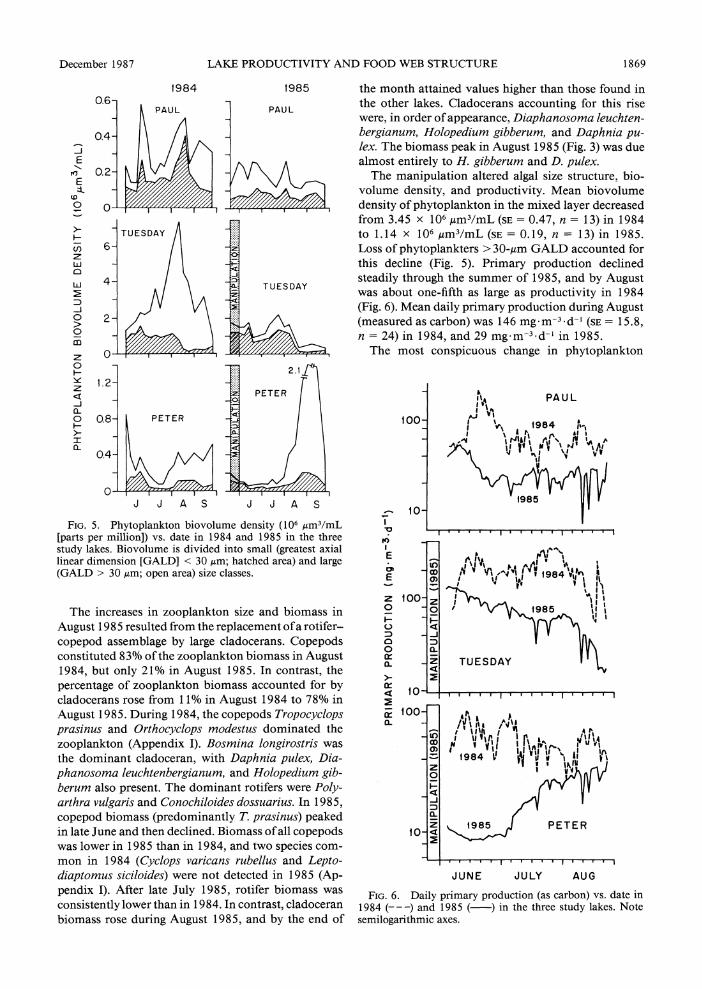
FIG. 5. Phytoplankton biovolume density (106 ,um3/mL [parts per million]) vs. date in 1984 and 1985 in the three study lakes. Biovolume is divided into small (greatest axial linear dimension [GALD] < 30 tim; hatched area) and large (GALD > 30 ,4m; open area) size classes.
The increases in zooplankton size and biomass in August 1985 resulted from the replacement of a rotifer- copepod assemblage by large cladocerans. Copepods constituted 83% of the zooplankton biomass in August 1984, but only 21% in August 1985. In contrast, the percentage of zooplankton biomass accounted for by cladocerans rose from 11% in August 1984 to 78% in August 1985. During 1984, the copepods Tropocyclops prasinus and Orthocyclops modestus dominated the zooplankton (Appendix I). Bosmina longirostris was the dominant cladoceran, with Daphnia pulex, Dia- phanosoma leuchtenbergianum, and Holopedium gib- berum also present. The dominant rotifers were Poly- arthra vulgaris and Conochiloides dossuarius. In 1985, copepod biomass (predominantly T. prasinus) peaked in late June and then declined. Biomass of all copepods was lower in 1985 than in 1984, and two species com- mon in 1984 (Cyclops varicans rubellus and Lepto- diaptomus siciloides) were not detected in 1985 (Ap- pendix I). After late July 1985, rotifer biomass was consistently lower than in 1984. In contrast, cladoceran biomass rose during August 1985, and by the end of
the month attained values higher than those found in the other lakes. Cladocerans accounting for this rise were, in order of appearance, Diaphanosoma leuchten- bergianum, Holopedium gibberum, and Daphnia pu- lex. The biomass peak in August 1985 (Fig. 3) was due almost entirely to H. gibberum and D. pulex.
The manipulation altered algal size structure, bio- volume density, and productivity. Mean biovolume density of phytoplankton in the mixed layer decreased from 3.45 x 10⁶ Am3/mL (SE = 0.47, n = 13) in 1984 to 1.14 x 10⁶ ,um3/mL (SE = 0.19, n = 13) in 1985. Loss of phytoplankters > 30-,jm GALD accounted for this decline (Fig. 5). Primary production declined steadily through the summer of 1985, and by August was about one-fifth as large as productivity in 1984 (Fig. 6). Mean daily primary production during August (measured as carbon) was 146 mgm-3 d-1 (SE = 15.8, n = 24) in 1984, and 29 mg.m-3 d-1 in 1985.
The most conspicuous change in phytoplankton
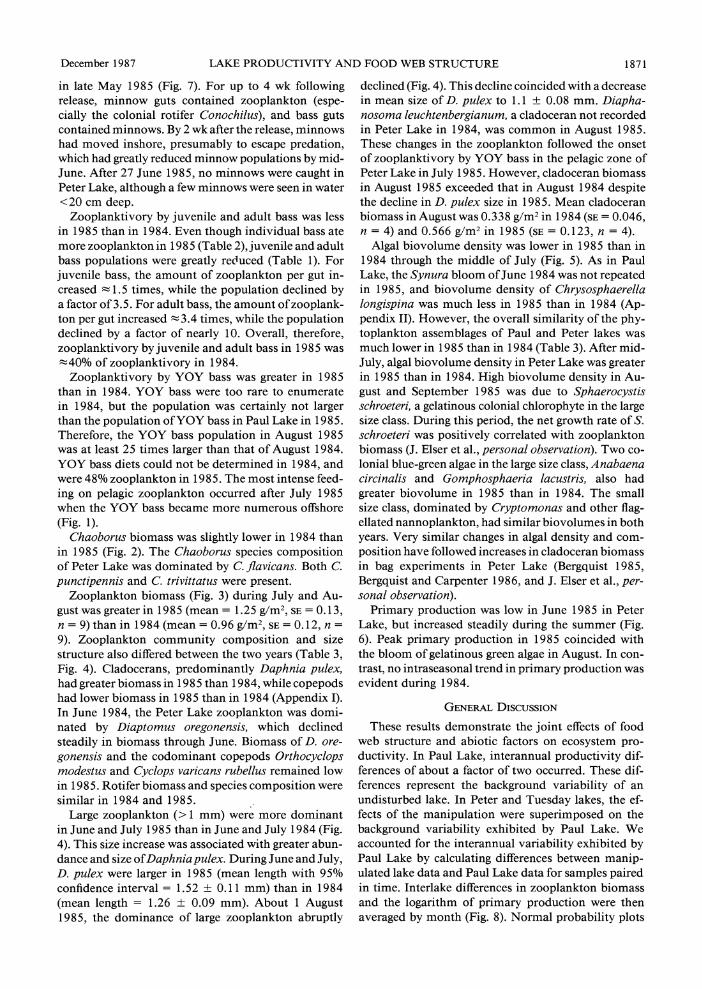
_ 1.4 PAUL I 'lb
100- # zr 1984 .
10- , 10
EA4
o 14
JUNE~~ JUL AU
1984~~O 1984n 98 - )i hetresuy ae.Nt
eo lo o a. Cr Z TUESDAY
i0
10 4
JUNE JULY AUG FI. O.Dal pImar prdutina cabn Vs.dtei
1984 (---) and 1985 ( ) inAh he td ae.Nt semilgarihmi 1axes
1870 S. R. CARPENTER ET AL. Ecology, Vol. 68, No. 6
8.0- TUESDAY 1984
6.0 -8}\/\
60 ,A / ~~\ T 4.0 - APERIMETER\ p
3.0 - OPEN 20 WATER/
D l
o 10 -II
T.
I
cl 4.0 TUESDAY 1985
1\
+ 3.0~ j <
2.0 - I PERIMETER LU
0
2
10
2 1.0 i
\ OPEN WATER
0 2 Z PETER 1985
0.03-
0.02 - PERIMETER
0.01 OPEN WATER
I 0.00 , by ,
JUN JUL AUG SEP OCT
FIG. 7. Catch per unit effort of Phoxinus eos (minnows) vs. date in perimeter and open-water traps in Tuesday Lake during 1984 and 1985, and Peter Lake during 1985. Catches of P. neogaeus and Umbra limi combined were < 15% of the total and showed the same seasonal trends and inshore/off- shore pattern as P. eos. No minnows were present in Peter Lake in 1984, or in Paul Lake in either year. Vertical bar indicates pooled standard error.
composition was the loss of relatively large, long-lived, slow-growing taxa (Appendix II). In 1984 and 1985, the small algal size class was dominated by Peridinium pulsillum, Chrysochromulina, Cryptomonas, Trache- lomonas, and small flagellated chlorophytes (Appendix II). Biovolume density of small phytoplankters (Fig. 5) was similar in 1984 (mean = 0.85 x 10⁶ ,um3/mL, SE =
0.12, n = 13) and 1985 (mean = 0.77 x 10⁶ ,m3/mL, SE = 0.12, n = 13). The large size class was dominated by dinoflagellates in 1984: Glenodinium quadridens, several Peridinium species of 30-50 Aum GALD, and the large (74-83 Aum GALD) Peridinium limbatum, which accounted for the biovolume peak in August 1984. Two colonial taxa, Chrysosphaerella longispina and Microcystis aeruginosa, were also prominent in
the large size class during 1984. Biovolume density of the large algal class was much lower in 1985 (mean = 0.33 x 10⁶ ,m3/mL, SE = 0.07, n = 13) than in 1984 (mean = 2.58 x 10⁶, m3/mL, SE = 0.52, n = 13). Reduced densities of dinoflagellates > 30-,um GALD and colonial taxa accounted for this interannual dif- ference. Spiny, grazing-resistant algae such as Golen- kinia, Diceras, and a large Mallomonas species dom- inated the large phytoplankton in August 1985, but their growth did not compensate for the loss of the large dinoflagellates.
Certain of these phytoplankton responses could be forecast from the results of bag experiments. Nanno- plankters, which respond negatively to large increases in zooplankton biomass, are relatively insensitive to moderate changes in zooplankton biomass because growth stimulation by excreted nutrients and losses to grazing are compensatory (Carpenter and Kitchell 1984, Bergquist 1985, Bergquist et al. 1985, Bergquist and Carpenter 1986). Twofold changes in zooplankton bio- mass, such as those observed in Tuesday Lake (Fig. 3), have little effect on net growth rates of nannoplankton in bag experiments (Bergquist and Carpenter 1986 and J. Elser et al., personal observation). Shapiro and Wright (1984) also found that whole-lake manipulations had little effect on the nannoplankton.
Among larger phytoplankters, two different re- sponses to increasing grazer biomass are evident. Di- noflagellates are negatively affected by relatively mod- est increases in zooplankton biomass (Bergquist 1985, Bergquist et al. 1985). In contrast, large chlorophytes and chrysophytes, especially spiny, gelatinous, or co- lonial forms, are stimulated by increased biomass of large cladocerans (Porter 1976, Bergquist et al. 1985, Lehman and Sandgren 1985, Bergquist and Carpenter 1986). Only a few of these grazing-enhanced taxa were present in Tuesday Lake in 1985.
Bass removal/minnow addition (Peter Lake)
The response of Peter Lake was surprising and more complex than that of Tuesday Lake. We had expected that the removal of bass and addition of minnows would increase zooplanktivory, decrease zooplankton bio- mass and mean size, and increase phytoplankton bio- mass and production. Phytoplankton biomass and pro- duction did indeed increase, but by unexpected mechanisms.
The manipulation reduced the densities of juvenile and adult bass (Table 1). Densities of YOY bass, how- ever, were much greater in 1985 because piscivory was greatly reduced. As in the other lakes, YOY bass were more numerous in the littoral zone (Fig. 1). Following further removals of adult bass from Peter Lake in July 1985 (see Methods: Experimental Design), piscivore densities were very low. Consequently YOY bass catches in open-water traps in Peter Lake were higher than those in the other lakes after 1 August 1985.
Minnows moved offshore immediately after release
December 1987 LAKE PRODUCTIVITY AND FOOD WEB STRUCTURE 1871
in late May 1985 (Fig. 7). For up to 4 wk following release, minnow guts contained zooplankton (espe- cially the colonial rotifer Conochilus), and bass guts contained minnows. By 2 wk after the release, minnows had moved inshore, presumably to escape predation, which had greatly reduced minnow populations by mid- June. After 27 June 1985, no minnows were caught in Peter Lake, although a few minnows were seen in water <20 cm deep.
Zooplanktivory by juvenile and adult bass was less in 1985 than in 1984. Even though individual bass ate more zooplankton in 1985 (Table 2), juvenile and adult bass populations were greatly reduced (Table 1). For juvenile bass, the amount of zooplankton per gut in- creased 1.5 times, while the population declined by a factor of 3.5. For adult bass, the amount of zooplank- ton per gut increased t 3.4 times, while the population declined by a factor of nearly 10. Overall, therefore, zooplanktivory by juvenile and adult bass in 1985 was -40% of zooplanktivory in 1984.
Zooplanktivory by YOY bass was greater in 1985 than in 1984. YOY bass were too rare to enumerate in 1984, but the population was certainly not larger than the population of YOY bass in Paul Lake in 1985. Therefore, the YOY bass population in August 1985 was at least 25 times larger than that of August 1984. YOY bass diets could not be determined in 1984, and were 48% zooplankton in 1985. The most intense feed- ing on pelagic zooplankton occurred after July 1985 when the YOY bass became more numerous offshore (Fig. 1).
Chaoborus biomass was slightly lower in 1984 than in 1985 (Fig. 2). The Chaoborus species composition of Peter Lake was dominated by C. flavicans. Both C. punctipennis and C. trivittatus were present.
Zooplankton biomass (Fig. 3) during July and Au- gust was greater in 1985 (mean = 1.25 g/m2, SE = 0.13, n = 9) than in 1984 (mean = 0.96 g/m2, SE = 0.12, n = 9). Zooplankton community composition and size structure also differed between the two years (Table 3, Fig. 4). Cladocerans, predominantly Daphnia pulex, had greater biomass in 1985 than 1984, while copepods had lower biomass in 1985 than in 1984 (Appendix I). In June 1984, the Peter Lake zooplankton was domi- nated by Diaptomus oregonensis, which declined steadily in biomass through June. Biomass of D. ore- gonensis and the codominant copepods Orthocyclops modestus and Cyclops varicans rubellus remained low in 1985. Rotifer biomass and species composition were similar in 1984 and 1985.
Large zooplankton (> 1 mm) were more dominant in June and July 1985 than in June and July 1984 (Fig. 4). This size increase was associated with greater abun- dance and size ofDaphnia pulex. During June and July, D. pulex were larger in 1985 (mean length with 95% confidence interval = 1.52 ? 0.11 mm) than in 1984 (mean length = 1.26 ? 0.09 mm). About 1 August 1985, the dominance of large zooplankton abruptly
declined (Fig. 4). This decline coincided with a decrease in mean size of D. pulex to 1.1 ? 0.08 mm. Diapha- nosoma leuchtenbergianum, a cladoceran not recorded in Peter Lake in 1984, was common in August 1985. These changes in the zooplankton followed the onset of zooplanktivory by YOY bass in the pelagic zone of Peter Lake in July 1985. However, cladoceran biomass in August 1985 exceeded that in August 1984 despite the decline in D. pulex size in 1985. Mean cladoceran biomass in August was 0.338 g/m2 in 1984 (SE = 0.046, n = 4) and 0.566 g/m2 in 1985 (SE = 0.123, n = 4).
Algal biovolume density was lower in 1985 than in 1984 through the middle of July (Fig. 5). As in Paul Lake, the Synura bloom of June 1984 was not repeated in 1985, and biovolume density of Chrysosphaerella longispina was much less in 1985 than in 1984 (Ap- pendix II). However, the overall similarity of the phy- toplankton assemblages of Paul and Peter lakes was much lower in 1985 than in 1984 (Table 3). After mid- July, algal biovolume density in Peter Lake was greater in 1985 than in 1984. High biovolume density in Au- gust and September 1985 was due to Sphaerocystis schroeteri, a gelatinous colonial chlorophyte in the large size class. During this period, the net growth rate of S. schroeteri was positively correlated with zooplankton biomass (J. Elser et al., personal observation). Two co- lonial blue-green algae in the large size class, Anabaena circinalis and Gomphosphaeria lacustris, also had greater biovolume in 1985 than in 1984. The small size class, dominated by Cryptomonas and other flag- ellated nannoplankton, had similar biovolumes in both years. Very similar changes in algal density and com- position have followed increases in cladoceran biomass in bag experiments in Peter Lake (Bergquist 1985, Bergquist and Carpenter 1986, and J. Elser et al., per- sonal observation).
Primary production was low in June 1985 in Peter Lake, but increased steadily during the summer (Fig. 6). Peak primary production in 1985 coincided with the bloom of gelatinous green algae in August. In con- trast, no intraseasonal trend in primary production was evident during 1984.
GENERAL DISCUSSION
These results demonstrate the joint effects of food web structure and abiotic factors on ecosystem pro- ductivity. In Paul Lake, interannual productivity dif- ferences of about a factor of two occurred. These dif- ferences represent the background variability of an undisturbed lake. In Peter and Tuesday lakes, the ef- fects of the manipulation were superimposed on the background variability exhibited by Paul Lake. We accounted for the interannual variability exhibited by Paul Lake by calculating differences between manip- ulated lake data and Paul Lake data for samples paired in time. Interlake differences in zooplankton biomass and the logarithm of primary production were then averaged by month (Fig. 8). Normal probability plots
1872 S. R. CARPENTER ET AL. Ecology, Vol. 68, No. 6
INTERLAKE DIFFERENCES
PETER-PAUL TUESDAY- PAUL
2- Q 1984
o E 15
e 0.8 o 048 0
) -0.4-
< -Q 84 _ __ _ __ _ _
I I I JUNE JULY AUG JUNE JULY AUG
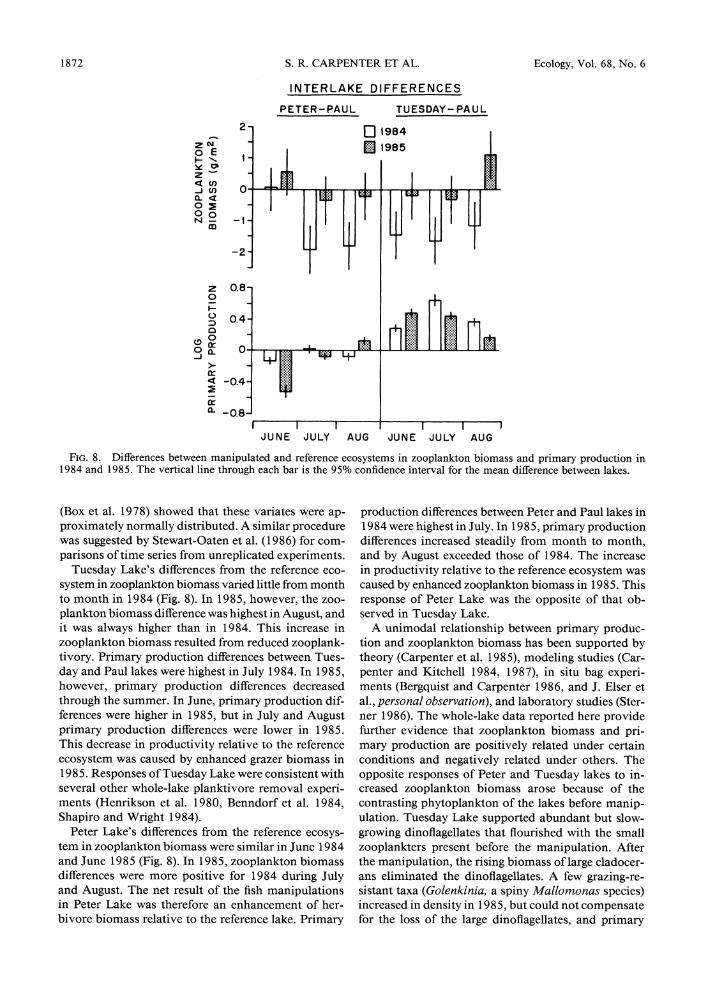
FIG. 8. Differences between manipulated and reference ecosystems in zooplankton biomass and primary production in 1984 and 1985. The vertical line through each bar is the 95% confidence interval for the mean difference between lakes.
(Box et al. 1978) showed that these variates were ap- proximately normally distributed. A similar procedure was suggested by Stewart-Oaten et al. (1986) for com- parisons of time series from unreplicated experiments.
Tuesday Lake's differences from the reference eco- system in zooplankton biomass varied little from month to month in 1984 (Fig. 8). In 1985, however, the zoo- plankton biomass difference was highest in August, and it was always higher than in 1984. This increase in zooplankton biomass resulted from reduced zooplank- tivory. Primary production differences between Tues- day and Paul lakes were highest in July 1984. In 1985, however, primary production differences decreased through the summer. In June, primary production dif- ferences were higher in 1985, but in July and August primary production differences were lower in 1985. This decrease in productivity relative to the reference ecosystem was caused by enhanced grazer biomass in 1985. Responses of Tuesday Lake were consistent with several other whole-lake planktivore removal experi- ments (Henrikson et al. 1980, Benndorf et al. 1984, Shapiro and Wright 1984).
Peter Lake's differences from the reference ecosys- tem in zooplankton biomass were similar in June 1984 and June 1985 (Fig. 8). In 1985, zooplankton biomass differences were more positive for 1984 during July and August. The net result of the fish manipulations in Peter Lake was therefore an enhancement of her- bivore biomass relative to the reference lake. Primary
production differences between Peter and Paul lakes in 1984 were highest in July. In 1985, primary production differences increased steadily from month to month, and by August exceeded those of 1984. The increase in productivity relative to the reference ecosystem was caused by enhanced zooplankton biomass in 1985. This response of Peter Lake was the opposite of that ob- served in Tuesday Lake.
A unimodal relationship between primary produc- tion and zooplankton biomass has been supported by theory (Carpenter et al. 1985), modeling studies (Car- penter and Kitchell 1984, 1987), in situ bag experi- ments (Bergquist and Carpenter 1986, and J. Elser et al., personal observation), and laboratory studies (Ster- ner 1986). The whole-lake data reported here provide further evidence that zooplankton biomass and pri- mary production are positively related under certain conditions and negatively related under others. The opposite responses of Peter and Tuesday lakes to in- creased zooplankton biomass arose because of the contrasting phytoplankton of the lakes before manip- ulation. Tuesday Lake supported abundant but slow- growing dinoflagellates that flourished with the small zooplankters present before the manipulation. After the manipulation, the rising biomass of large cladocer- ans eliminated the dinoflagellates. A few grazing-re- sistant taxa (Golenkinia, a spiny Mallomonas species) increased in density in 1985, but could not compensate for the loss of the large dinoflagellates, and primary
December 1987 LAKE PRODUCTIVITY AND FOOD WEB STRUCTURE 1873
production declined. Peter Lake, in contrast, had many grazer-adapted phytoplankters that coexisted with large cladocerans before the manipulation (M. Elser et al. 1986). In bag experiments performed in 1984, 9 of 16 algal taxa responded positively or unimodally to in- creased zooplankton biomass because of nutrient re- generation by the herbivores (Bergquist and Carpenter 1986). The increased zooplankton biomass in Peter Lake in 1985 stimulated the growth of certain grazer- adapted algae that were already established in the lake, causing productivity to increase.
These studies demonstrate the importance of large- scale, long-term manipulations in the analysis of cas- cading trophic interactions. Strong predator avoidance behaviors have clear adaptive value (Werner and Gil- liam 1984) and can have dramatic consequences for community structure. For example, Power and Mat- thews (1983) showed that periphyton densities in stream pools were determined by presence or absence of pis- civorous fishes and the avoidance behaviors evoked in herbivorous minnows. The behavioral responses of fishes that led to increased zooplankton biomass in Peter Lake could not have been predicted from bag experiments, because they occurred at a lakewide scale. The plankton responses of both lakes took a full season to develop. Future changes, such as increased concen- trations of grazing-resistant algae in Tuesday Lake, cannot be ruled out. The stability of ecosystems altered by fish manipulations remains an open question, but paleolimnological data (Kitchell and Kitchell 1980, Kitchell and Carpenter 1987), the few long-term rec- ords available (Mills et al. 1987, Scavia et al. 1986), models (Carpenter and Kitchell 1987), and time lags induced by ontogenic changes in fishes' diets (Werner and Gilliam 1984, Carpenter et al. 1985) all suggest that fluctuations spanning many years are likely.
Fish population fluctuations are commonly caused by variable recruitment, catastrophic mortality, and/ or exploitation (Pitcher and Hart 1982, Peterson and Wroblewski 1984, Steele and Henderson 1984, Mills et al. 1987). These fluctuations may occur on a much longer time scale than the short-term effects of meteo- rologic variability on phytoplankton (Harris 1980, Carpenter and Kitchell 1987). Therefore, the effects of food web structure and abiotic factors on phytoplank- ton may be essentially independent, and together ac- count for most of the observed variation in lake eco- system productivity. Although fisheries biology and limnology have evolved as largely separate disciplines, they must coalesce as we establish a holistic view of factors and interactions that regulate lake ecosystem functioning.
ACKNOWLEDGMENTS
We extend special thanks to Professor Arthur D. Hasler, whose foresight established both the ideas and the institu- tional commitments that make long-term experimental stud- ies of these lakes possible. Our work was supported by NSF
grants BSR-83-08918 to J. F. Kitchell, S. R. Carpenter, and J. R. Hodgson; BSR-86-04996 to J. F. Kitchell; BSR-86-0627 1 to S. R. Carpenter; and BSR-83-73662 to C. N. von Ende. This paper is a contribution from the University of Notre Dame Environmental Research Center. We thank C. Hughes for the drafting.
LITERATURE CITED
Bagenal, T. B. 1978. Methods for assessment of fish pro- duction in fresh waters. Blackwell, Oxford, England.
Benndorf, J., H. Kneschke, K. Kossatz, and E. Penz. 1984. Manipulation of the pelagic food web by stocking with pre- dacious fishes. Internationale Revue der Gesamten Hydro- biologie 69:407-428.
Bergquist, A. M. 1985. Effects of herbivory on phytoplank- ton community composition, size structure, and primary production. Dissertation. University of Notre Dame, Notre Dame, Indiana, USA.
Bergquist, A. M., and S. R. Carpenter. 1986. Limnetic her- bivory: effects on phytoplankton populations and primary production. Ecology 67:1351-1360.
Bergquist, A. M., S. R. Carpenter, and J. C. Latino. 1985. Shifts in phytoplankton size structure and community com- position during grazing by contrasting zooplankton assem- blages. Limnology and Oceanography 30:1037-1045.
Box, G. E. P., W. G. Hunter, and J. S. Hunter. 1978. Sta- tistics for experimenters. John Wiley and Sons, New York, New York, USA.
Brooks, J. L., and S. I. Dodson. 1965. Predation, body size, and composition of plankton. Science 150:28-35.
Carpenter, S. R., M. M. Elser, and J. J. Elser. 1986. Chlo- rophyll production, degradation, and sedimentation: im- plications for paleolimnology. Limnology and Oceanogra- phy 31:112-124.
Carpenter, S. R., and J. F. Kitchell. 1984. Plankton com- munity structure and limnetic primary production. Amer- ican Naturalist 124:159-172.
Carpenter, S. R., and J. F. Kitchell. 1987. The temporal scale of limnetic primary production. American Naturalist 129:417-433.
Carpenter, S. R., J. F. Kitchell, and J. R. Hodgson. 1985. Cascading trophic interactions and lake productivity. BioScience 35:634-639.
Caswell, H. 1983. Life history theory and the equilibrium status of populations. American Naturalist 120:317-339.
Connell, J. H., and W. P. Sousa. 1983. On the evidence needed to judge ecological stability or persistence. Ameri- can Naturalist 121:789-824.
DiBernardi, R. 1981. Biotic interactions in freshwater and effects on community structure. Bollettino di Zoologia 48: 353-371.
Elser, J. J., M. M. Elser, and S. R. Carpenter. 1986. Size fractionation of algal chlorophyll, carbon fixation, and phosphatase activity: relationship with species-specific size distributions and zooplankton community structure. Jour- nal of Plankton Research 8:365-383.
Elser, M. M., J. J. Elser, and S. R. Carpenter. 1986. Paul and Peter lakes: a liming experiment revisited. American Midland Naturalist 116:282-295.
Fedorenko, A. Y., and M. C. Swift. 1972. Comparative biology of Chaoborus americanus and Chaoborus trivittatus in Eunice Lake, British Columbia. Limnology and Ocean- ography 17:721-730.
George, E. L., and W. F. Hadley. 1979. Food and habitat partitioning between rock bass (Ambloplites rupestris) and smallmouth bass (Micropterus dolomieui) young of the year. Transactions of the American Fisheries Society 108:253- 261.
Harris, G. P. 1980. Temporal and spatial scales in phyto- plankton ecology: mechanisms, methods, models, and
1874 S. R. CARPENTER ET AL. Ecology, Vol. 68, No. 6
management. Canadian Journal of Fisheries and Aquatic Sciences 37:877-900.
Hasler, A. D. 1964. Experimental limnology. BioScience 14: 36-38.
Henrikson, L., H. Nyman, H. Oscarson, and J. Stenson. 1980. Trophic changes, without changes in the external nutrient loading. Hydrobiologia 68:257-263.
Hodgson, J. R., and J. F. Kitchell. 1987. Opportunistic for- aging in largemouth bass (Micropterus salmoides). Ameri- can Midland Naturalist, in press.
Hrbacek, J., M. Dvorakova, V. Korinek, and L. Prochazkova. 1961. Demonstration of the effect of the fish stock on the species composition of zooplankton and the intensity of metabolism of the whole plankton assemblage. Interna- tionale Vereinigung fur theoretische und angewandte Lim- nologie, Verhandlungen 18:162-170.
Janson, S., and J. Vegelius. 1981. Measures of ecological association. Oecologia (Berlin) 49:371-376.
Johnson, W. E. 1954. Dynamics of fish production and carrying capacity of some northern softwater lakes. Dis- sertation. University of Wisconsin-Madison, Madison, Wisconsin, USA.
Kerfoot, W. C., and A. Sih, editors. 1987. Predation: direct and indirect impacts on aquatic communities. University Press of New England, Hanover, New Hampshire, USA.
Kitchell, J. A., and J. F. Kitchell. 1980. Size-selective pre- dation, light transmission, and oxygen stratification: evi- dence from the recent sediments of manipulated lakes. Lim- nology and Oceanography 25:389-402.
Kitchell, J. F., and S. R. Carpenter. 1987. Piscivores, plank- tivores, fossils, and phorbins. Pages 132-146 in W. C. Ker- foot and A. Sih, editors. Predation: direct and indirect im- pacts on aquatic communities. University Press of New England, Hanover, New Hampshire, USA.
Lehman, J. T., and C. D. Sandgren. 1985. Species-specific rates of growth and grazing loss among freshwater algae. Limnology and Oceanography 30:34-46.
Likens, G. E. 1985a. An experimental approach for the study of ecosystems. Journal of Ecology 73:381-396.
Marker, A. F., C. A. Crowther, and R. J. M. Gunn. 1980. Methanol and acetone as solvents for estimating chloro- phyll a and phaeopigments by spectrophotometry. Ergeb- nisse der Limnologie 14:52-69.
McIntosh, R. P. 1985. The background of ecology. Cam- bridge University Press, New York, New York, USA.
McQueen, D. J., J. R. Post, and E. L. Mills. 1986. Trophic relationships in freshwater pelagic ecosystems. Canadian Journal of Fisheries and Aquatic Sciences 43:1571-1581.
Mills, E., J. Forney, and K. Wagner. 1987. Fish predation and its cascading effect on the Oneida Lake food chain. Pages 118-131 in W. C. Kerfoot and A. Sih, editors. Pre- dation: direct and indirect impacts on aquatic communities. University Press of New England, Hanover, New Hamp- shire, USA.
Paine, R. T. 1980. Food webs, linkage interaction strength,
and community infrastructure. Journal of Animal Ecology 49:667-685.
Parsons, T. R., Y. Maita, and C. M. Lalli. 1984. A manual of chemical and biological methods for seawater analysis. Pergamon, New York, New York, USA.
Peterson, I., and S. Wroblewski. 1984. Mortality rate of fishes in the pelagic ecosystem. Canadian Journal of Fish- eries and Aquatic Sciences 41:1117-1120.
Pitcher, T. J., and P. J. B. Hart. 1982. Fisheries ecology. Groom Helm, Beckenham, Kent, England.
Porter, K. G. 1976. Enhancement of algal growth and pro- ductivity by grazing zooplankton. Science 192:1332-1334.
Power, M. E., and W. J. Matthews. 1983. Algae-grazing minnows (Campostoma anomalum), piscivorous bass (Mi- cropterus spp.), and the distribution of attached algae in a small prairie-margin stream. Oecologia (Berlin) 60:328-332.
Scavia, D., G. L. Fahnenstiehl, M. S. Evans, D. Jude, and J. T. Lehman. 1986. Influence of salmonid predation and weather on long-term water quality trends in Lake Michi- gan. Canadian Journal of Fisheries and Aquatic Sciences 43:435-443.
Schindler, D. W. 1978. Factors regulating phytoplankton production and standing crop in the world's lakes. Lim- nology and Oceanography 23:478-486.
Schmitz, W. R. 1958. Artificially induced circulation in thermally stratified lakes. Dissertation. University of Wis- consin-Madison, Madison, Wisconsin, USA.
Seaburg, K. G. 1957. A stomach sampler for live fish. Pro- gressive Fish Culturist 19:137-139.
Shapiro, J. 1980. The importance of trophic-level interac- tions to the abundance and species composition of algae in lakes. Pages 105-115 in J. Barica and L. Mur, editors. Hy- pertrophic systems. Dr. W. Junk, The Hague, The Neth- erlands.
Shapiro, J., and D. I. Wright. 1984. Lake restoration by biomanipulation. Freshwater Biology 14:371-383.
Sih, A., P. Crowley, M. McPeek, J. Petranka, and K. Stroh- meier. 1985. Predation, competition, and prey commu- nities: a review of field experiments. Annual Review of Ecology and Systematics 16:269-312.
Steele, J. H., and E. W. Henderson. 1984. Modeling long- term fluctuations in fish stocks. Science 224:985-987.
Sterner, R. W. 1986. Herbivores' direct and indirect effects on algal populations. Science 231:605-607.
Stewart-Oaten, A., W. W. Murdoch, and K. R. Parker. 1986. Environmental impact assessment: "pseudoreplication" in time? Ecology 67:929-940.
Tonn, W. M., and J. J. Magnuson. 1982. Patterns in the species composition and richness of fish assemblages in northern Wisconsin lakes. Ecology 63:1149-1166.
Werner, E. E., and J. Gilliam. 1984. The ontogenetic niche and species interactions in size-structured populations. An- nual Review of Ecology and Systematics 15:393-425.
Wetzel, R. G. 1983. Limnology. Saunders, Philadelphia, Pennsylvania, USA.
December 1987 LAKE PRODUCTIVITY AND FOOD WEB STRUCTURE 1875
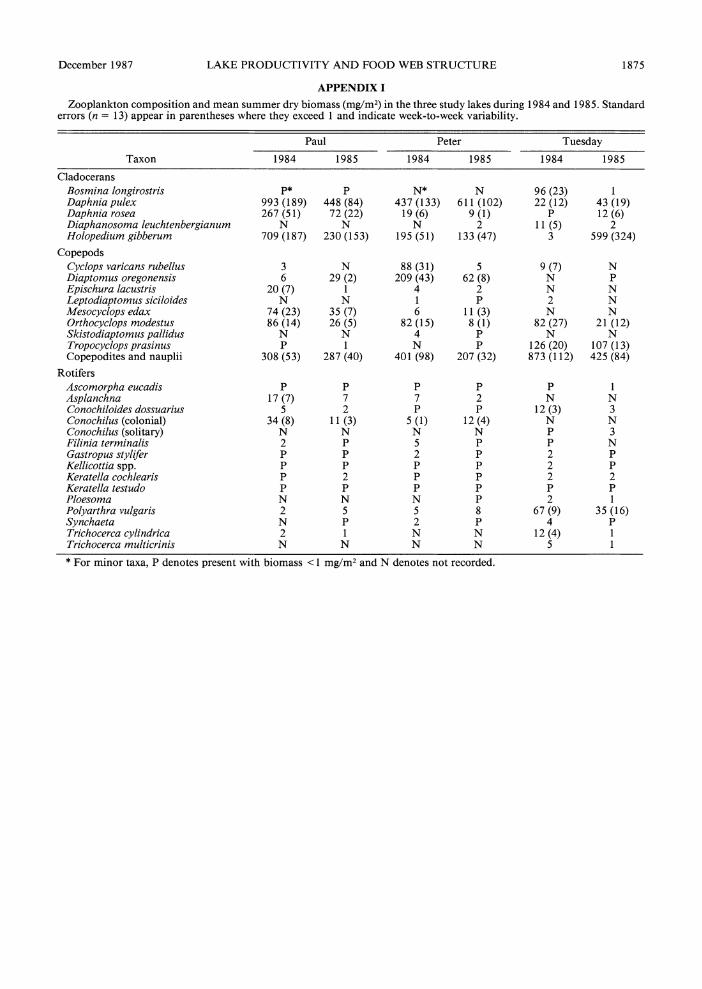
APPENDIX I
Zooplankton composition and mean summer dry biomass (mg/M2) in the three study lakes during 1984 and 1985. Standard errors (n = 13) appear in parentheses where they exceed 1 and indicate week-to-week variability.
Paul Peter Tuesday
Taxon 1984 1985 1984 1985 1984 1985
Cladocerans Bosmina longirostris P* P N* N 96 (23) 1 Daphnia pulex 993 (189) 448 (84) 437 (133) 611 (102) 22 (12) 43 (19) Daphnia rosea 267 (51) 72 (22) 19 (6) 9 (1) P 12 (6) Diaphanosoma leuchtenbergianum N N N 2 11 (5) 2 Holopedium gibberum 709 (187) 230 (153) 195 (51) 133 (47) 3 599 (324)
Copepods Cyclops varicans rubellus 3 N 88 (31) 5 9 (7) N Diaptomus oregonensis 6 29 (2) 209 (43) 62 (8) N P Epischura lacustris 20 (7) 1 4 2 N N Leptodiaptomus siciloides N N 1 P 2 N Mesocyclops edax 74 (23) 35 (7) 6 11 (3) N N Orthocyclops modestus 86 (14) 26 (5) 82 (15) 8 (1) 82 (27) 21 (12) Skistodiaptomus pallidus N N 4 P N N Tropocyclops prasinus P 1 N P 126 (20) 107 (13) Copepodites and nauplii 308 (53) 287 (40) 401 (98) 207 (32) 873 (112) 425 (84)
Rotifers Ascomorpha eucadis P P P P P 1 Asplanchna 17 (7) 7 7 2 N N Conochiloides dossuarius 5 2 P P 12 (3) 3 Conochilus (colonial) 34 (8) 11 (3) 5 (1) 12 (4) N N Conochilus (solitary) N N N N P 3 Filinia terminals 2 P 5 P P N Gastropus stylifer P P 2 P 2 P Kellicottia spp. P P P P 2 P Keratella cochlearis P 2 P P 2 2 Keratella testudo P P P P P P Ploesoma N N N P 2 1 Polyarthra vulgaris 2 5 5 8 67 (9) 35 (16) Synchaeta N P 2 P 4 P Trichocerca cylindrica 2 1 N N 12 (4) 1 Trichocerca multicrinis N N N N 5 1
* For minor taxa, P denotes present with biomass < 1 mg/M2 and N denotes not recorded.
1876 S. R. CARPENTER ET AL. Ecology, Vol. 68, No. 6
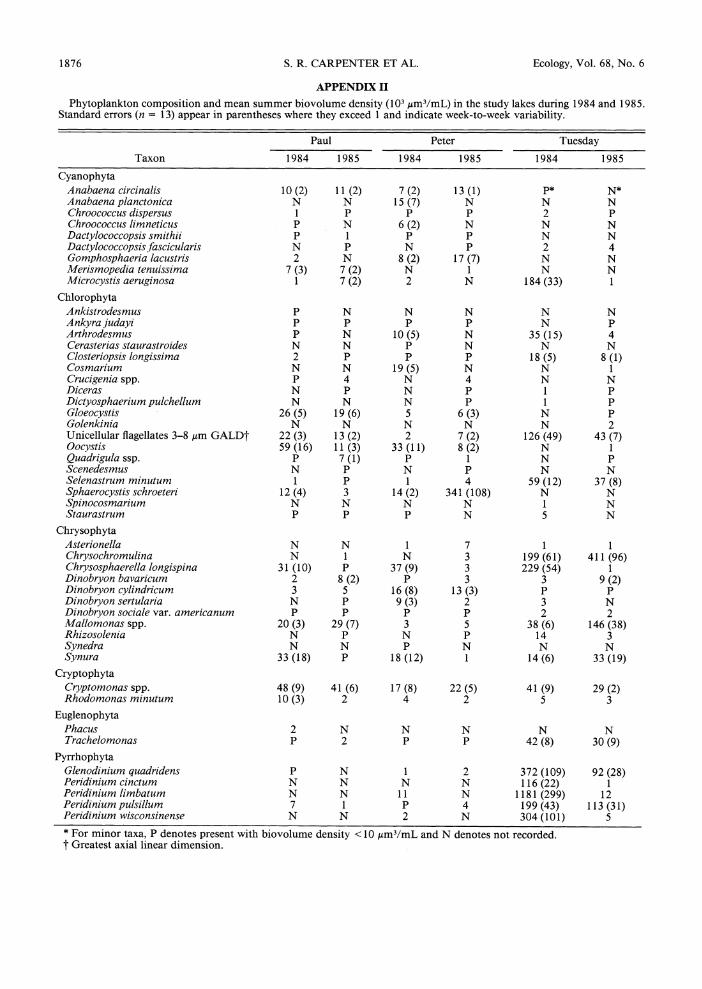
APPENDIX II
Phytoplankton composition and mean summer biovolume density (103, m3/mL) in the study lakes during 1984 and 1985. Standard errors (n = 13) appear in parentheses where they exceed 1 and indicate week-to-week variability.
Paul Peter Tuesday
Taxon 1984 1985 1984 1985 1984 1985
Cyanophyta Anabaena circinalis 10 (2) 11 (2) 7 (2) 13 (1) P* N* Anabaena planctonica N N 15 (7) N N N Chroococcus dispersus 1 P P P 2 P Chroococcus limneticus P N 6 (2) N N N Dactylococcopsis smithii P 1 P P N N Dactylococcopsisfascicularis N P N P 2 4 Gomphosphaeria lacustris 2 N 8 (2) 17 (7) N N Merismopedia tenuissima 7 (3) 7 (2) N 1 N N Microcystis aeruginosa 1 7 (2) 2 N 184 (33) 1
Chlorophyta Ankistrodesmus P N N N N N Ankyra judayi P P P P N P Arthrodesmus P N 10 (5) N 35 (15) 4 Cerasterias staurastroides N N P N N N Closteriopsis longissima 2 P P P 18 (5) 8 (1) Cosmarium N N 19 (5) N N 1 Crucigenia spp. P 4 N 4 N N Diceras N P N P 1 P Dictyosphaerium pulchellum N N N P 1 P Gloeocystis 26 (5) 19 (6) 5 6 (3) N P Golenkinia N N N N N 2 Unicellular flagellates 3-8 Am GALDt 22 (3) 13 (2) 2 7 (2) 126 (49) 43 (7) Qocystis 59 (16) 11 (3) 33 (11) 8 (2) N 1 Quadrigula ssp. P 7 (1) P 1 N P Scenedesmus N P N P N N Selenastrum minutum 1 P 1 4 59 (12) 37 (8) Sphaerocystis schroeteri 12 (4) 3 14 (2) 341 (108) N N Spinocosmarium N N N N 1 N Staurastrum P P P N 5 N
Chrysophyta Asterionella N N 1 7 1 1 Chrysochromulina N 1 N 3 199(61) 411 (96) Chrysosphaerella longispina 31 (10) P 37 (9) 3 229 (54) 1 Dinobryon bavaricum 2 8 (2) P 3 3 9 (2) Dinobryon cylindricum 3 5 16 (8) 13 (3) P P Dinobryon sertularia N P 9 (3) 2 3 N Dinobryon sociale var. americanum P P P P 2 2 Mallomonas spp. 20 (3) 29 (7) 3 5 38 (6) 146 (38) Rhizosolenia N P N P 14 3 Synedra N N P N N N Synura 33 (18) P 18 (12) 1 14 (6) 33 (19)
Cryptophyta Cryptomonas spp. 48 (9) 41 (6) 17 (8) 22 (5) 41 (9) 29 (2) Rhodomonas minutum 10 (3) 2 4 2 5 3
Euglenophyta Phacus 2 N N N N N Trachelomonas P 2 P P 42 (8) 30 (9)
Pyrrhophyta Glenodinium quadridens P N 1 2 372 (109) 92 (28) Peridinium cincturm N N N N 116 (22) 1 Peridinium limbatum N N 11 N 1181 (299) 12 Peridinium pulsillum 7 1 P 4 199 (43) 113 (31) Peridinium wisconsinense N N 2 N 304 (101) 5 * For minor taxa, P denotes present with biovolume density <10 ,um3/mL and N denotes not recorded. t Greatest axial linear dimension.