Estimation and Analysis of Multifactor Productivity in ... · 2 ESTIMATION AND ANALYSIS OF...
48
Estimation and Analysis of Multifactor Productivity in Truck Transportation: 1987-2003 ANTHONY D. APOSTOLIDES, Ph.D. February 2009 U.S. Department of Transportation Research and Innovative Technology Administration Bureau of Transportation Statistics Office of Advanced Studies [email protected] ABSTRACT The analysis has three objectives: 1) to estimate multifac- tor productivity (MFP) in truck transportation during 1987-2003; 2) to examine changes in multifactor pro- ductivity in U.S. truck transportation, over time, and to compare these changes to MFP of the U.S. business sector and other transportation subsectors; and 3) to assess the factors that affected changes of MFP in truck transportation over the period of analysis. With respect to the calculation framework, the analy- sis estimates annual MFP in truck transportation in the United States over the 1987-2003 period. The data used for the estimations are based on the North American In- dustrial Classification System (NAICS). The basic data series were obtained from the Bureau of Economic Analy- sis. The labor data under NAICS were extrapolated from 1998 back to 1987. Data on the land input were estimated using the method of the Bureau of Labor Statistics, with some modifications. In future work, other methods will be used to estimate the land input. With respect to methodology, use is made of the basic growth-accounting methodology and the methodology using the Tornqvist index number approach. MFP was estimated in three different scenarios. In the first one, the basic growth-accounting methodology was used, without a measurement for land. In the second one, MFP was cal- culated with the Tornqvist index and without a measure- ment for land. In the third scenario, MFP was calculated with the Tornqvist method and with a measurement for land.
Transcript of Estimation and Analysis of Multifactor Productivity in ... · 2 ESTIMATION AND ANALYSIS OF...

Estimation and Analysis of Multifactor Productivity in Truck
Transportation: 1987-2003
ANTHONY D. APOSTOLIDES, Ph.D.February 2009
U.S. Department of TransportationResearch and Innovative Technology AdministrationBureau of Transportation StatisticsOffi ce of Advanced [email protected]
ABSTRACT
The analysis has three objectives: 1) to estimate multifac-tor productivity (MFP) in truck transportation during 1987-2003; 2) to examine changes in multifactor pro-ductivity in U.S. truck transportation, over time, and to compare these changes to MFP of the U.S. business sector and other transportation subsectors; and 3) to assess the factors that affected changes of MFP in truck transportation over the period of analysis.
With respect to the calculation framework, the analy-sis estimates annual MFP in truck transportation in the United States over the 1987-2003 period. The data used for the estimations are based on the North American In-dustrial Classifi cation System (NAICS). The basic data series were obtained from the Bureau of Economic Analy-sis. The labor data under NAICS were extrapolated from 1998 back to 1987. Data on the land input were estimated using the method of the Bureau of Labor Statistics, with some modifi cations. In future work, other methods will be used to estimate the land input.
With respect to methodology, use is made of the basic growth-accounting methodology and the methodology using the Tornqvist index number approach. MFP was estimated in three different scenarios. In the fi rst one, the basic growth-accounting methodology was used, without a measurement for land. In the second one, MFP was cal-culated with the Tornqvist index and without a measure-ment for land. In the third scenario, MFP was calculated with the Tornqvist method and with a measurement for land.

2 ESTIMATION AND ANALYSIS OF MULTIFACTOR PRODUCTIVITY IN TRUCK TRANSPORTATION: 1987-2003
With respect to MFP results, the calculations indi-cate a mixed record of multifactor productivity in truck transportation over the period of analysis. Truck MFP increased during the fi rst subperiod—from 1987 to 1995—and decreased during the second subperiod—1995 to 2001. In the last three years of analysis—2001 to 2003—truck MFP again increased.
The outcomes of the calculations indicate that both methodologies (the basic growth-accounting methodology and the one using the Tornqvist in-dex) provide very similar results on multifactor productivity in truck transportation. That implies that either method can be used to provide appro-priate estimates of MFP.
A comparison of truck MFP with other trans-portation industries and the U.S. economy is pos-sible for years in which MPF data are available for the various transportation industries and the economy. These data show that truck MFP over the 1987-2000 period increased faster, at 1.1% per annum, than that of the U.S. private business sector, which grew at 0.9% per annum. Thus, the trucking subsector contributed positively to the growth of multifactor productivity in the U.S. economy over this time period. During 1987-2001, MPF growth in trucking was the same as in the U.S. economy, at 0.8% per annum. After 2001, MFP in trucking grew at a lower rate than in the U.S. private economy. In addition, during 1987-1995, MFP in trucking increased at a faster rate, of 2.0% per annum, than MFP in air trans-portation, which grew at 1.2% annually.
With respect to factors that affected changes in truck multifactor productivity over the period of analysis, the assessment considers three subperi-ods of MFP outcomes: 1987-1995, 1995-2001, and 2001-2003. Factors that affected the increases in MFP during the fi rst subperiod (1987-1995) include: 1) the improvement in the capital input—indicated by increases in capital per worker, and the rapid increases in the use of computer hard-ware and software (information technologies); 2) an improvement in the fuel effi ciency of trucks; 3) an increase in the average length of haul; 4)
an increasing use of containers; and 5) positive ef-fects on industry effi ciency from interstate deregu-lation taking place over time. Factors that affected decreases in MFP during the second subperiod (1995-2001) include: 1) a declining effi ciency in utilizing intermediate inputs; 2) a lower growth rate of capital per worker; 3) a lower growth rate of utilizing containers; 4) the decrease in indus-try output in 2001, as a result of the economic recession that year and the catastrophic events of 9/11/2001; and 5) intrastate deregulation of trucking in 1995; this was followed by a period of adjustments (entry and exit of fi rms) and un-certainty which appear to have had a negative impact on truck MFP. Factors that affected MFP increases during the third subperiod (2001-2003) include: 1) increasing effi ciency in the utilization of intermediate inputs; 2) increases in the use of computers; 3) increases in the use of containers; and 4) the adjustment of the industry after intra-state deregulation in 1995, which completed and made comprehensive the deregulation of truck transportation.
SECTION I—INTRODUCTION
In this study, there is an estimation of multifac-tor productivity and an assessment of changes in multifactor productivity (MFP) in the U.S. truck transportation sub-sector during the 1987-2003 period. The analysis is composed of four sections besides the Introduction (Section I). Section II con-tains a description of the structure and evolution of the trucking industry, in the U.S., over the pe-riod of analysis. In Section III, there is estimation of multifactor productivity in truck transportation during 1987-2003. This estimation is carried out by two approaches: the basic growth-accounting method and the Tornqvist index. In Section IV, there is a comparison of MFP in trucking with MFP in other transportation subsectors and the U.S. business sector. Section V presents an analy-sis of the factors that affected changes of MFP in truck transportation over the period of analysis. Finally, the Conclusions (Section VI) present the salient points of the estimation and analysis of MFP in truck transportation.

APOSTOLIDES 3
SECTION II—TRUCKING INDUSTRY BACK-
GROUND AND STRUCTURE
Industry Description and Characteristics
Firms in the truck transportation industry provide a link between manufacturers and consumers. Businesses, and occasionally individuals, contract with trucking companies to pick up and deliver a variety of goods. The trucking industry has two parts: the “for-hire” segment and the “in-house trucking” segment. Within the “for-hire” seg-ment, freight movement is characterized by broad service markets of truckload (TL), less-than-truckload (LTL), and small package delivery. The trucking industry can also be classifi ed into two segments, according to the nature of the freight being transported: general freight trucking and specialized freight trucking. These parts of the trucking industry are described below.
Truckload (TL) carriers specialize in hauling large shipments for long distances. TL shipments are usually defi ned as those weighing 10,000 pounds or more. In this segment, a driver em-ployed by a TL fi rm, or a truck owner-operator, will pick up a load from a shipper and carry the load directly to the consignee, without transfer-ring the freight from one trailer to another. Thus, TL carriers do not need a network of terminals. This segment of the industry involves substantial competition and labor is typically not unionized.
Less than truckload (LTL) carriers consolidate, in one truck, several shipments that are going to the same general geographic area. LTL shipments are usually defi ned as those shipped in amounts that weigh less than 10,000 pounds. The consolidation of freight requires a network of freight terminals. Consequently, LTL carriers are characterized by networks of consolidation centers and satellite ter-minals. In this framework, a pickup-and-delivery truck typically transports an LTL shipment from the shipper’s dock to the trucking fi rm’s local ter-minal. There, dock workers unload and recombine the shipments with other shipments that are going to similar destinations, typically a destination ter-minal in another city. This transportation may be
accomplished by large trucks or by another trans-portation mode—e.g., rail or ship—depending on price and service considerations. When the ship-ment arrives at its destination terminal, the load is processed, moved to a pickup-and-delivery truck, and then transported to the consignee. There are national LTL fi rms and regional LTL fi rms.
Besides the TL and LTL service markets, the trucking industry can also be classifi ed into two segments, according to the nature of the freight being transported: general freight trucking and specialized freight trucking. These segments are described below. General freight trucking provides transportation of general commodities; this freight is not specialized. This segment of the industry is further subdivided into local trucking and long-distance trucking. Local trucking establishments carry goods within a single metropolitan area and its adjacent non-urban areas. Local trucking trans-ports a range of items such as produce to differ-ent grocery stores, lumber from the lumber yard to construction sites, and debris. Long-distance trucking establishments transport goods between distant areas—e.g., from city to city—and some-times between the United States and Canada or Mexico. The fi rms in this segment handle a wide variety of commodities.
Specialized freight trucking provides trans-portation of freight, which requires specialized equipment because of freight characteristics relat-ing to size, weight, shape, etc. Specialized freight includes petroleum products, refrigerated goods, forest products, and dangerous/hazardous materi-als. The specialized equipment includes fl atbeds, tankers, or refrigerated trailers. This segment also includes the furniture-moving industry, which transports used household, institutional, and commercial furniture. Like general freight truck-ing, specialized freight trucking is subdivided into local and long-distance.
Deregulation of Trucking and Evolution of the
Industry
Legislation affected the trucking industry in the 1980s and in the 1990s. The Motor Carrier Act
4 ESTIMATION AND ANALYSIS OF MULTIFACTOR PRODUCTIVITY IN TRUCK TRANSPORTATION: 1987-2003
(MCA) of 1980 deregulated the interstate por-tion of the “for-hire” trucking industry. The Act initiated signifi cant changes at the interstate level by allowing easier entry of trucking fi rms, provid-ing greater pricing fl exibility to fi rms, eliminating restrictions on how many customers a contract carrier could serve, and reducing restrictions on private fl eets.
A number of years after the deregulation of in-terstate operations, intrastate operations were also deregulated in 1995. Until that year, most States controlled the routes, rates, and services of motor carriers within their borders. One of the outcomes of regulation was empty truck trailers on return trips; this contributed to industry ineffi ciency. In 1995, the Trucking Industry Regulatory Reform Act (TIRRA) prohibited all states from regulating carriers’ routes, rates, or services. However, states were still allowed to regulate such areas as safety, hazardous material movement, and vehicle size and weight.
Thus, the primary deregulation of the trucking industry took place at the interstate level in 1980, while the intrastate deregulation of the industry, in 1995, completed the deregulation of the truck-ing industry and made it comprehensive. This deregulation resulted in an increase in the entry of new fi rms and more fl exible carrier rates. Conse-quently, the industry experienced more competi-tion and a signifi cant restructuring.
Following deregulation, adjustments to the industry took place and they included mergers, acquisitions, and bankruptcies. Acquisitions in the industry involved horizontal or vertical com-binations of fi rms. Horizontal mergers involve the combination of two fi rms that are engaged in the same industry. These mergers decrease the number of competitors in the industry and increase their size. Vertical mergers involve mergers of transpor-tation fi rms that provide complementary services.
Another signifi cant development took place in truck transportation from 1980, with interstate deregulation, and which apparently continued after the intrastate deregulation in 1995. This in-volved a change in the structure of the industry,
resulting in a decrease in the relative importance of less-than-truckload (LTL) trucking and a cor-responding increase in the relative importance of truckload trucking (TL).
There are important implications of this change for the structure and performance of the truck-ing industry. LTL operations were more capital-intensive and labor-intensive than TL operations. They were also more heavily unionized. On the other hand, the TL segment has been character-ized by a higher degree of competition and by non-unionized labor. Consequently, the cost of transport (per unit of freight) by LTL operations was higher than for TL operations. The change toward more TL operations indicates a decrease in the capital-intensity and labor-intensity of the trucking industry over the period of analysis. Moreover, this change would lead to a lowering in the cost of truck transport.
SECTION III—ESTIMATING MULTIFACTOR
PRODUCTIVITY IN TRUCK TRANSPORTA-
TION, 1987-2003
Introduction
This analysis utilizes two versions of the growth-accounting methodology to calculate multifactor productivity (MFP) in the trucking industry in the United States. The initial methodology used is the basic growth-accounting of sources of economic growth—which includes weighted growth rates of production inputs, with the weights being the share of the input in total industry costs/output. This methodology was initially used in macroeco-nomic analyses of sources of growth, by analysts such as E. Denison1 and J.W. Kendrick2 who also used it to analyze productivity at the sectoral and industry levels. The more recent version of the methodology has been used—in a somewhat different and, what might be called, an enhanced form—by government agencies, such as the Bu-reau of Labor Statistics (BLS), to estimate mul-tifactor productivity at the sectoral and industry
1 Denison, 1974 and 1967.2 Kendrick, 1973.

APOSTOLIDES 5
levels.3 This version utilizes the Tornqvist formula in the calculations. The basic growth-accounting methodology is presented in Appendix A, while the enhanced methodology using the Tornqvist index is presented in Appendix B.
The section which follows defi nes productiv-ity (labor and MFP) and describes its benefi ts (increases). The subsequent section describes the data used and their characteristics, the calcula-tions, and the results of the calculations by using the two methodological approaches—the basic growth-accounting methodology and the en-hanced methodology.
Defi ning Productivity
Labor productivity is defi ned as output per unit of labor, and is calculated by dividing output by a measure of the labor input (number of employees or labor hours). Increases in labor productivity refl ect the effect of two basic factors: 1) increased use of capital in production—which increases the amount of capital per worker, and 2) technological progress, which can include a number of factors, and is discussed at a later point under multifactor productivity.
Multifactor productivity (MFP) refers to the pro-ductivity of all the inputs used in the production process. Multifactor productivity is a more com-prehensive measure of productivity than labor productivity, or other single-factor productivity measures. It indicates the overall production ef-fi ciency of an industry; it relates to increases in industry output that are not accounted for by in-creases in the inputs.
For estimating MFP at the industry level, the output measure used is total output (rather than value added). The inputs used for analysis are: labor, capital, and intermediate inputs. The labor input is measured in terms of numbers of workers or labor hours; while the capital input includes structures, equipment, inventories, and land (in a broad defi nition of capital). Intermediate inputs include purchased electricity, fuels, materials, and
3 Bureau of Labor Statistics, 1983; Duke et al., 1992.
services. The weights used to estimate the contri-bution of each input to output are their shares in the total costs of the industry.
With regard to the capital input, one notes that reproducible tangible capital and land are two distinct factors of production. There are differ-ences between reproducible capital (structures and equipment) and land. For one, structures and equipment are man-made. They are an output of a production process. Land, on the other hand, is not man-made; it is a natural resource. Moreover, structures and equipment depreciate over time as they are used in production; land does not depre-ciate over time (at least for practical purposes).
Benefi ts of Productivity Increases
Productivity, or productivity changes, can affect a company in an industry and a number of compa-nies in the same industry. Thusly, a change in the productivity of the truck transportation industry would affect the productivity of the transporta-tion sector. A change in the productivity of a sector—such as transportation—would, in turn, affect productivity of the U.S. economy.
The initial and basic result of a productivity in-crease, at the fi rm or industry level, is a reduction in costs and an increase in profi ts (total revenues minus total costs). Thus, the productivity increase benefi ts directly the affected industry. Subsequent-ly, the increase in profi ts can be followed by lower prices of the industry—particularly when there is competition among the producers of the industry. Competition is affected by the number of produc-ers in the industry, among other things. The higher the number of producers in the industry, the more the expected competition in the industry. Another impact of productivity increases (increase in prof-its) could be an increase in the labor compensation (wages and fringe benefi ts) of the workers work-ing for the affected fi rm/industry, if the company/industry shares part of the productivity gain with the workers.
All three of these impacts of a productivity in-crease result in higher incomes in the economy. In the case of the business enterprise, there is a direct
6 ESTIMATION AND ANALYSIS OF MULTIFACTOR PRODUCTIVITY IN TRUCK TRANSPORTATION: 1987-2003
increase in its profi t/income. If part of that profi t goes to the stockholders of the fi rm, in the form of higher dividends, their incomes would increase. Moreover, a portion of the higher profi t can be kept by the company in the form of retained earnings—with which to fi nance future investment that can lead to higher levels of productivity. In the case of labor, there could be an increase in the income of workers (labor compensation). In the case of the consumers/users of the services of the industry, if prices of that service decrease, there is an increase in the real incomes of the consumers. These are the basic benefi ts of productivity increases, and the reasons why productivity increases are desir-able from the perspective of the company, industry, and the economy. A recent study has assessed the impact of productivity increases in air transporta-tion.4
There can also be second-round effects as when labor uses its higher income to increase its con-sumption of various goods and services in the economy. This increased consumption stimulates sales of various products/services and subsequent production of other industries, with possible in-creases in employment and incomes there. Thus, the benefi ts of an initial productivity increase can have a ripple effect in the industry and affect posi-tively other industries and the economy.
Data
The data used for the analysis were obtained primarily from the Bureau of Economic Analy-sis (BEA), U.S. Department of Commerce. This source provides most data series needed for the estimation of trucking MFP. The industry ana-lyzed is the Truck Transportation industry, repre-sented by NAICS 484 (North American Industry Classifi cation System). This industry consists of: NAICS 4841—General Freight Trucking and NA-ICS 4842—Specialized Freight Trucking. In turn, NAICS 4841 includes: 48411 (Local), and 48412 (Long Distance). NAICS 4842 includes: 48421 (Used Household and Offi ce Goods Moving); 48422 (Local); and 48423 (Long-Distance).
4 Apostolides, 2006.
The data used for the trucking industry refer to “for-hire” trucking, whereby businesses, or households, hire trucking fi rms to provide trans-portation of goods. These data do not include “in-house” trucking, whereby a business, such as a grocery chain, engages its own trucks and truck drivers to transport its goods. Presently, suffi cient data for in-house trucking are not available to in-clude this segment in the estimation of MFP.5
The analysis is initially carried out for the pe-riod 1998-2003. The choice of the initial period was affected by data availability. The primary data series, obtained from BEA, include data on gross output, labor, capital, and intermediate in-puts. Data on output, capital, and intermediate inputs are available, under NAICS, from 1987. However, labor data under NAICS are available only from 1998. Consequently, estimates of MFP are initially calculated for the 1998-2003 period. Subsequently, labor data under NAICS are extrap-olated back to 1987, allowing for calculations on trucking MFP to be carried out for the 1987-2003 period.
In the fi rst phase of calculations, estimates are developed for MFP in truck transportation without land. The second phase of calculations includes a measurement of the land input and its incorporated in the estimation of MFP.
Output
Gross output in trucking is measured in terms of receipts of the industry. Output includes short-haul and long-haul trucking. Data on gross output are available in current prices and in chain-type quantity indexes.
Labor Input
The main data for the labor input are in terms of full-time-equivalent workers (FTE). Part-time workers are converted (by BEA) into full-time equivalents. The labor data do not make a distinc-tion for different types of labor. In this regard, it
5 BTS has been doing work in estimating the output of in-house trucking. However, other data needed for the estimation of MFP are not available.

APOSTOLIDES 7
is noted that BLS, in its work on productivity (la-bor and MFP), also considers labor to be homo-geneous and additive, with no distinction made between hours of different groups of employees.6 There are also data available on labor compen-sation of FTE employees in truck transportation. Thus, the MFP estimates are based on labor data of full-time equivalent employees. In truck trans-portation, there are also self-employed truckers; these are not included in full-time equivalent em-ployees. The services of self-employed truckers would be included in intermediate inputs, which include purchased services. The services of self-employed truckers are obtained by trucking fi rms through contractual arrangements.
Capital
Capital stock data refer to structures and equip-ment (including software). They are available in current prices and in Chain-Type Quantity Index-es for Net Stock. Net capital stock excludes the depreciation of capital from gross capital stock. Capital stock data of BEA do not include land (or inventories of unsold goods).
Intermediate Inputs
Intermediate inputs include purchases of electrici-ty and other energy inputs, purchases of materials, and purchases of services. The latter would in-clude the services of self-employed truckers. Data for intermediate inputs are available, from BEA, in the “GDP-by-Industry” accounts and in the Input-Output accounts. In the “GDP by Industry accounts,” intermediate inputs are obtained as the difference between independent estimates of gross output and value added (value of sales minus value of purchases of inputs). In the Input-Output accounts, intermediate inputs are obtained from a combination of source data for industry pur-chases and indirect techniques, and value added is the residual.7 The value added of a fi rm/industry is the value of its sales revenue minus the value of its purchases of intermediate inputs. This analy-sis uses data from the GDP-by-Industry accounts
6 Bureau of Labor Statistics, 1983.7 Yuskavage, 2001, p. 7.
since that database presents a comprehensive and consistent set of data for variables used in the cal-culations. A tabulation in Appendix Table C indi-cates that data on intermediate inputs and gross output, from the two sources, since 1998 are the same for truck transportation. This is consistent with the objective of BEA to create integrated an-nual I-O and GDP-by-Industry accounts. These integrated accounts are only available starting in 1998. Prior to 1998, there were substantial differ-ences in the measure for intermediate inputs from the two BEA sources (Yuskavage, 2001).
Weights of Inputs
The labor weight was obtained by relating labor compensation (wages and fringe benefi ts) to indus-try gross output, in current prices (labor compen-sation/output). The weight for intermediate inputs was obtained in a similar manner: by relating the cost of these inputs to industry gross output. The weight of the capital input was obtained as a re-sidual, for the fi rst phase of calculations, by sub-tracting the combined percentage shares of labor and intermediates inputs from one (representing total industry costs).
The annual weights for the inputs used for the calculations with the basic growth-accounting ap-proach are presented in Appendix D.
Land
Land is one of the primary inputs of industry output. Land is non-reproducible capital while structures and equipment are reproducible capital. Data on land are not available from BEA. BEA’s estimates of structures (values) are based on data collected by the U.S. Census Bureau. These data pertain to new structures and include the cost of construction and of site preparation for construc-tion projects. “Construction” data for Census exclude land acquisition. Consequently, BEA data on fi xed assets include the cost of new structures with site preparation, but do not include the cost of the land on which the structures are built.
The initial sets of estimates of trucking MFP are calculated without a measurement for land. The land input is estimated and incorporated in the

8 ESTIMATION AND ANALYSIS OF MULTIFACTOR PRODUCTIVITY IN TRUCK TRANSPORTATION: 1987-2003
MFP calculations in the second set of estimates. Its magnitude is estimated by the approach used by BLS in their estimation of industry MFP (Duke, et. al., 1992). The methodology and data for mea-suring the land input are discussed in a later sec-tion (“MFP Calculations with Land”).
Calculations: Basic Growth-Accounting
Methodology
Calculations: 1998-2003
Estimates of MFP in trucking, from 1998 to 2003, are shown in Table 1. These estimates are based on the basic growth-accounting methodology, using annual growth rates of inputs, weighted by their share in total industry cost/output. The inputs are labor, capital, and intermediate inputs. Land is not included.8
The estimates indicate that for the fi rst three years of the period of analysis, multifactor pro-ductivity in truck transportation declined (nega-tive rates), while it grew at positive rates during the last two years.
8 The weight of land would be included in the weight of capital since the weight of capital is derived as a residual (from 1.00) after accounting for the weight of labor and intermediate inputs.
With regard to changes in output and factor inputs, the data show that over the 1998-2003 period, output in trucking grew at positive rates for the fi rst two years; however, those rates be-came negative in the last three years of analysis. Changes in employment in trucking were similar to changes in output, with initially positive rates of growth followed by negative ones. Similar pat-terns can also be observed for capital and inter-mediate inputs. Changes in the factor inputs over time resulted in a positive combined weighted growth rate during the fi rst two years of the pe-riod of analysis; the growth rate turned negative during the last three years of analysis.
Inputs in the trucking industry decreased over the period of analysis and this was accompanied by decreasing output. However, in the last two years of analysis, MFP increased while trucking output continued to decline. This increase of MFP, which accompanied declining output, indicates increasing effi ciency in the utilization of industry resources.
Calculations: 1987-2003
It was mentioned previously that data under NA-ICS are available for the 1987-2003 period for gross output, and for the inputs of capital and
TABLE 1 Growth of Output, Inputs, and Multifactor Productivity in Trucking Percentage rates of change
Basic growth accounting methodology, without land input
Year
Growth of gross output - quantity
index Growth of
laborGrowth of
capital
Growth of intermediate
inputs
Growth of combined
weighted inputs
Growth of multifactor
productivity
‘(1) ‘(2) ‘(3) ‘(4) ‘(5) ‘(6)
1998 7.3 5.0 10.7
1999 5.3 3.9 3.3 9.0 6.6 -1.3
2000 2.5 2.1 2.4 3.8 3.1 -0.6
2001 -6.2 1.4 -2.2 -6.9 -3.7 -2.5
2002 -1.7 -3.3 -2.7 -3.2 -3.1 1.4
2003 -6.0 -1.1 -1.6 -11.3 -6.4 0.4
Sources: Bureau of Economic Analysis internet site. For data on gross output, intermediate inputs, and labor: Annual Industry Accounts: http://www.bea.doc.gov/bea/dn2/gdpbyind_data.htm
For data on fi xed assets: National\Fixed Assets\All Fixed Asset Tables\Section 3 - Private Fixed Assets by Industry: table 3.2ES and table
3.1ES. http://www.bea.doc/bea/dn/FA2004/SelectTable.asp
Note: Growth rates are computed for variable values between two years. Thus, the growth rate of output shown for 1999 is between the output numbers for 1998 and 1999.
APOSTOLIDES 9
intermediate purchases. However, labor data for trucking, under NAICS, are available only for 1998-2003. This factor defi ned the time frame for calculations presented in the previous section.
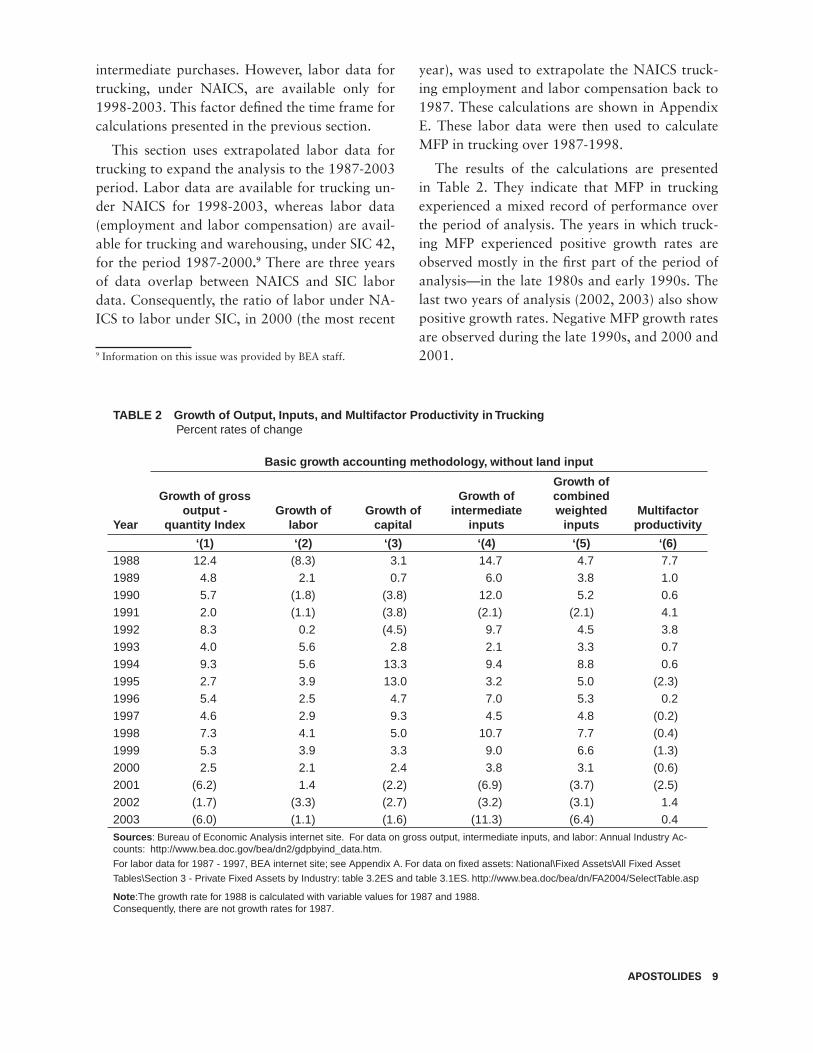
This section uses extrapolated labor data for trucking to expand the analysis to the 1987-2003 period. Labor data are available for trucking un-der NAICS for 1998-2003, whereas labor data (employment and labor compensation) are avail-able for trucking and warehousing, under SIC 42, for the period 1987-2000.9 There are three years of data overlap between NAICS and SIC labor data. Consequently, the ratio of labor under NA-ICS to labor under SIC, in 2000 (the most recent
9 Information on this issue was provided by BEA staff.
year), was used to extrapolate the NAICS truck-ing employment and labor compensation back to 1987. These calculations are shown in Appendix E. These labor data were then used to calculate MFP in trucking over 1987-1998.
The results of the calculations are presented in Table 2. They indicate that MFP in trucking experienced a mixed record of performance over the period of analysis. The years in which truck-ing MFP experienced positive growth rates are observed mostly in the fi rst part of the period of analysis—in the late 1980s and early 1990s. The last two years of analysis (2002, 2003) also show positive growth rates. Negative MFP growth rates are observed during the late 1990s, and 2000 and 2001.
TABLE 2 Growth of Output, Inputs, and Multifactor Productivity in Trucking Percent rates of change
Basic growth accounting methodology, without land input
Year
Growth of gross output -
quantity IndexGrowth of
laborGrowth of
capital
Growth of intermediate
inputs
Growth of combined weighted
inputsMultifactor
productivity
‘(1) ‘(2) ‘(3) ‘(4) ‘(5) ‘(6)1988 12.4 (8.3) 3.1 14.7 4.7 7.7 1989 4.8 2.1 0.7 6.0 3.8 1.0 1990 5.7 (1.8) (3.8) 12.0 5.2 0.6 1991 2.0 (1.1) (3.8) (2.1) (2.1) 4.1 1992 8.3 0.2 (4.5) 9.7 4.5 3.8 1993 4.0 5.6 2.8 2.1 3.3 0.7 1994 9.3 5.6 13.3 9.4 8.8 0.6 1995 2.7 3.9 13.0 3.2 5.0 (2.3)1996 5.4 2.5 4.7 7.0 5.3 0.2 1997 4.6 2.9 9.3 4.5 4.8 (0.2)1998 7.3 4.1 5.0 10.7 7.7 (0.4)1999 5.3 3.9 3.3 9.0 6.6 (1.3)2000 2.5 2.1 2.4 3.8 3.1 (0.6)2001 (6.2) 1.4 (2.2) (6.9) (3.7) (2.5)2002 (1.7) (3.3) (2.7) (3.2) (3.1) 1.4 2003 (6.0) (1.1) (1.6) (11.3) (6.4) 0.4 Sources: Bureau of Economic Analysis internet site. For data on gross output, intermediate inputs, and labor: Annual Industry Ac-counts: http://www.bea.doc.gov/bea/dn2/gdpbyind_data.htm.
For labor data for 1987 - 1997, BEA internet site; see Appendix A. For data on fi xed assets: National\Fixed Assets\All Fixed Asset
Tables\Section 3 - Private Fixed Assets by Industry: table 3.2ES and table 3.1ES. http://www.bea.doc/bea/dn/FA2004/SelectTable.asp
Note:The growth rate for 1988 is calculated with variable values for 1987 and 1988.Consequently, there are not growth rates for 1987.
10 ESTIMATION AND ANALYSIS OF MULTIFACTOR PRODUCTIVITY IN TRUCK TRANSPORTATION: 1987-2003
With regard to individual components of the trucking MFP framework, one observes (Table 2) that gross output grew at positive rates during the period of analysis—with the exception of the last three years (2001-2003). Labor also increased at positive rates for most years over time, while dur-ing the last two years (2002, 2003), it experienced negative growth rates.
Capital data do not indicate a consistent trend over time: years of positive growth rates are fol-lowed by negative growth rates. Years in which capital in the industry had negative growth rates include the last three years of analysis. The inter-mediate inputs also do not show a consistent trend over time. In most of the years, these purchases experienced a positive growth rate, while in the last three years, they had negative growth rates.
In summary, the data and calculations indicate that the trucking industry was increasing in activ-ity/output and inputs in the fi rst half of the pe-riod of analysis—the late 1980s and early 1990s. Multifactor productivity also increased over this period. This situation changed signifi cantly during the late 1990s and in 2000 and 2001. During this period, trucking experienced decreases in output, factor inputs, and multifactor productivity. How-ever, during the last two years of analysis—2002 and 2003—MFP in trucking increased. During the same period, output and factor inputs decreased. This implies increasing effi ciency in the utilization of the available inputs in the industry.
Calculations with the Tornqvist Index
Calculations: 1987-2003
Calculations are also carried out by the use of the Tornqvist index methodological framework. In this case, the inputs of labor, capital, and intermediates purchases are aggregated into a chained Tornqvist index (See Appendix B). Data on gross output are available in terms of a chain-type quantity index. Estimates of trucking MFP levels are obtained by relating the combined input index to the quantity output index. Growth rates of MFP are calculated starting with 1989. The results of the calculations are presented in Table 3.
The index numbers in column 3 of the table indicate increases and decreases of trucking MFP levels over time. One does not observe a persis-tent trend. The growth rates (column 4) provide a picture that is clearer to interpret. These growth rates again indicate that MFP in trucking grew at positive rates during the late 1980s and the fi rst half of the 1990s. This changed in the second half of the 1990s and the fi rst two years of the 2000s, when one observes negative growth rates of MFP. In the last two years of analysis, 2002 and 2003, trucking MFP is again observed to grow at posi-tive rates.
One also observes that these growth rates of trucking MFP are quite similar to those obtained by using the annually-weighted growth rates of inputs (basic growth-accounting methodol-ogy), presented in Table 2. The two sets of MFP growth rates are compared in Appendix Table F. For some years, the two sets of growth rates are the same; while for other years, the growth rates differ somewhat. Therefore, the calculations indicate only small differences in the results from the two versions of the estimating methodology. Consequently, it appears that these two methods are relatively good substitutes for each other.
MFP Calculations with Land
This section presents estimates of the quantity and cost share for land used in truck transportation, and includes that factor input in calculating MFP for the industry. The data for output, capital, and intermediate inputs have been described previ-ously. The data for the labor input used refer to FTE employees; and the data for labor compensa-tion were obtained from the BEA’s Input-Output accounts. The data on FTEs are compatible with the Input-Output data on labor compensation (for the labor cost share).
The land used by the trucking industry for this study relates to privately owned land; this includes land used for terminals, maintenance facilities, of-fi ce buildings, parking lots, etc. It does not include land used for public capital, such as highways. This is similar to the measurement of land by BLS

APOSTOLIDES 11
for industry studies of multifactor productivity. The land used for public capital, such as highways, in trucking MFP will be assessed in an upcoming study.
This study estimates a land stocks index by us-ing an approach similar to that of BLS, with some modifi cation. In estimating the land input for MFP calculations, that agency uses a result from a study by Manvel (1968). According to that study, the value of industrial land in 1966 accounted for 24% of the total value of industrial land and structures in 1966. Consequently, in BLS industry studies of MFP, an industry’s wealth stock of structures in 1966 is multiplied by the ratio 0.24/0.76 (land/structures) to estimate the value of land for the in-dustry in 1966. This estimate is then extrapolated backward and forward, in correspondence with changes in the gross value of structures stocks in
constant dollars (of the industry). The gross struc-tures stocks are the capital stocks without deduc-tions for depreciation. In this regard, the position is taken that land does not depreciate, since its service life is (for practical purposes) infi nite and its ability to provide services over time does not decline. The resulting land estimate is in constant dollars since the calculation uses the constant dol-lar value of structures as the extrapolator.10 One notes that a measurement in constant dollars im-plies a measurement in quantity terms, since the effect of price changes is taken out.
This study uses the quantity index of the net structures stocks of the trucking industry for ex-trapolation, instead of the gross structures stocks.
10 Communications with BLS staff, Offi ce of Productivity and Technology.
TABLE 3 Multifactor Productivity in Trucking (Tornqvist methodology, without land input)
Indexes (2000=100) Growth
Year
Gross output - chain-type quan-
tity index Combined inputs
index
Multifactor productivity
index
MFP growth (percentage rate of
change) ‘(1) ‘(2) ‘(3) ‘(4)
1987 48.704 56.623 86.01 1988 54.737 58.610 93.39 8.61989 57.379 60.812 94.35 1.01990 60.676 63.663 95.31 1.01991 61.887 62.338 99.28 4.21992 67.012 64.977 103.13 3.91993 69.712 67.113 103.87 0.71994 76.230 73.040 104.37 0.51995 78.289 76.714 102.05 -2.21996 82.536 80.714 102.26 0.21997 86.318 84.544 102.10 -0.21998 92.626 91.045 101.74 -0.41999 97.515 97.002 100.53 -1.22000 100.000 100.000 100.00 -0.52001 93.829 96.172 97.56 -2.42002 92.202 93.159 98.97 1.42003 86.711 86.993 99.68 0.7Sources: Bureau of Economic Analysis internet site. For data on gross output, intermediate inputs, and labor: Annual Industry Accounts: http://www.bea.doc.gov/bea/dn2/gdpbyind_data.htm
For labor data for 1987 - 1997, BEA internet site; see Appendix A.
For data on fi xed assets: National\Fixed Assets\All Fixed Asset Tables\Section 3- Private Fixed Assets by Industry: table 3.2ES and table 3.1ES. http://www.bea.doc/bea/dn/FA2004/SelectTable.asp
12 ESTIMATION AND ANALYSIS OF MULTIFACTOR PRODUCTIVITY IN TRUCK TRANSPORTATION: 1987-2003
This has been affected by two considerations. First, BEA has stopped producing estimates of gross capital stocks; consequently, a NAICS-based gross structure stock index for the trucking industry is not available from that source. In addition, the Manvel estimates of the 1966 values for land and structure were based on data of locally-assessed taxable real estate. Since property assessments are expected to refl ect the physical and economic conditions of the properties assessed, the land-to-structures ratio can be interpreted as the relation-ship between the values of land and depreciated structures. Therefore, the net stock of structures would seem to be appropriate for the estimation of land stock.
A complication in measuring land stocks is that the BLS procedure requires the structures (wealth stock) of the trucking industry, in constant prices, to be available for 1966; however, the BEA struc-ture series (quantity index), under NAICS, is available only from 1987 to 2003. SIC data (value and quantity), however, are available from BEA that go back to 1966.11 Consequently, this study extrapolates NAICS data for structures by using SIC data for structures for the SIC industry Truck-ing and Warehousing. Moreover, there are data on structures available for overlapping years between the SIC and NAICS series. Consequently, the ratio between the two series (in current prices) for 1987 and 1988 (the earliest overlapping years) was used to extrapolate the NAIC series backward to 1966. This results in an estimate of the land value, in current prices, used in 1966 by truck transporta-tion. This value is the same as the value of land in 1966 dollars (i.e., constant prices). This value in constant dollars is subsequently extrapolated for-ward by the movement of the NAICS Structures stock (quantity) for truck transportation.
The estimated land input is then combined with the structures and equipment stock index, by Tornqvist aggregation, and this results in a capital input index of reproducible and non-reproducible capital. The capital input index is approximated by the capital stock index. The results of the cal-
11 The data were kindly provided to BTS by BEA staff, Fixed Asset Accounts.
culations on the land input (land index) are shown in Appendix G.
Weights of Inputs
The weights of the inputs used in the estimation of industry MFP are the cost of each input (labor, capital, land, and intermediate inputs) in the total costs of the industry. The total costs of the indus-try are the combined cost of each factor input.
Data on costs for labor and intermediate in-puts are available in the BEA “GDP-by-Industry” accounts. Labor compensation is the labor cost, including wages and fringe benefi ts. The value of total intermediate inputs is the total intermediate input cost. Total industry costs are measured as gross industry output, in terms of revenues, minus indirect business taxes (sales taxes).
The weights for structures, equipment, and land are estimated in this study. These three types of capital assets comprise the capital input of the industry. This study measure total capital costs (of the capital assets) in the trucking industry by the industry’s gross operating surplus. The gross operating surplus consists of pre-tax income and depreciation of fi xed capital assets.
To provide a simple description of the con-cepts:
Profi t or Income before (corporate income) taxes = 1. Total revenues—Total costs;
Depreciation = amount deducted from income for 2. “wear” of fi xed capital assets
Gross operating surplus = Income (before tax) + De-3. preciation.
This “gross operating surplus” is taken as the cost of industry capital. This would be the cost of capital for the use of structures, equipment, and land—that is, the total costs of the industry and it would be the overall weight for the industry capital input.
The calculations take structures and equipment as one segment of industry capital (reproducible capital) and land as another segment (non-repro-ducible capital). Structures-equipment and land are eventually combined into a capital index; con-sequently, one needs the cost of these asset classes, to be used as weights in the aggregation. In this re-

APOSTOLIDES 13
gard, total capital costs (gross operating surplus) of truck transportation are allocated between structures-equipment (costs) and land (costs).
This allocation is based on two assumptions, needed for the calculations of land costs: The source data (BEA) provide data on values; how-ever, one needs data on costs to calculate land costs. The two assumptions are:
The share of structures value in the total value 1. of structures and equipment (available BEA data) is the same as the share of structures cost to total costs of structures and equipment.
The ratio of the land cost to the cost of struc-2. tures (net of depreciation) is the same as the ratio of the land value to the structures value.
With the above assumptions, the estimation of the land cost is estimated by obtaining values for the relevant variables in the relationships shown above. Initially, the cost of structures is separated from total capital costs (gross operating surplus). The cost of structures is net of depreciation; the structures cost is used to estimate the land cost, and land does not depreciate. The land cost is as-sumed to be equal to 0.24/0.76 times the cost of structures (net of depreciation). The steps in the estimation of land cost are described in Appendix H. The weights used for the inputs in the calcula-tions that include land are shown in Appendix I.
Results of MFP in Truck Transportation
The estimated levels and growth rates of MFP for truck transportation, with a measurement for land, are calculated for the period of analysis and various subperiods. The results are presented in Table 4. The annual growth rates show that MFP in trucking grew at positive rates during 1988 to 1994, and in 1996. It grew at negative rates in 1995, and during 1997 to 2000. In the last 3 years of analysis, 2001 to 2003, truck MFP again grew at positive rates.
The growth rates for longer periods summarize changes in truck MFP over time. Over the entire period of analysis, truck MFP increased at an annual rate of 0.8%. The period of analysis can be subdivided into three subperiods: 1987-1995, 1995-2001, and 2001-2003. The calculation results indicate that during the fi rst subperiod (1987-1995), truck MFP increased at an average rate of 2.0% per annum. In contrast, during the second subperiod, of 1995-2001, MFP decreased at an annual rate of -0.8%. During the last subpe-riod (2001–2003), truck MFP again increased, at an annual rate of 1.1%.
In addition, it is possible to compare the MFP results shown in Table 4 with those of a recent study by Triplett and Bosworth (2004). They es-timated MFP for the SIC industry Trucking and Warehousing, for a shorter period than of our analysis. Growth rates of those calculations are presented in Table 5 along with BTS-estimated growth rates of the NAICS Truck Transportation industry—for the two periods shown. In compar-ing the two sets of MFP results, one notes a general consistency between the BTS results and those of Triplett-Bosworth even though there is, at least, a difference in industry coverage. According to both sets of results, the trucking industry shows posi-tive growth rates of MFP during 1987 to 1995; they become negative growth rates during 1995 to 2001.
From another perspective of assessing the MFP results, one also notes that the MFP estimates in Table 3 are quite similar to the results shown in Table 4. The estimates in the former table do not
a) Structures value (BEA)
Structures & Equipment value (BEA)
b) Structures cost
Structures & Equipment cost
=
c) Land value (Manvel)
Structures value (Manvel)
d) Land cost
Structures cost (net)
=

14 ESTIMATION AND ANALYSIS OF MULTIFACTOR PRODUCTIVITY IN TRUCK TRANSPORTATION: 1987-2003
TABLE 4 Multifactor Productivity in Trucking (Tornqvist methodology with land input)
Indexes (2000=100) Growth
Year Output indexCombined input
indexMultifactor
productivityMFP growth (percentage) Time period
Growth of MFP (annual
percentage)
1987 48.70 55.8 87.29
1988 54.74 58.2 94.00 7.69
1989 57.38 60.4 94.96 1.02
1990 60.68 63.3 95.83 0.92
1991 61.89 62.0 99.81 4.15
1992 67.01 64.7 103.63 3.83
1993 69.71 66.8 104.41 0.76
1994 76.23 72.7 104.86 0.43
1995 78.29 76.4 102.48 -2.27 1987-1995 2.0
1996 82.54 80.4 102.62 0.13
1997 86.32 84.3 102.37 -0.24
1998 92.63 90.9 101.91 -0.45
1999 97.52 96.9 100.60 -1.29
2000 100.00 100.0 100.00 -0.59
2001 93.83 96.2 97.50 -2.50 1995-2001 -0.8
2002 92.20 93.3 98.86 1.39 1995-2003 -0.4
2003 86.71 87.1 99.57 0.72 2001-2003 1.1
1987-2003 0.8
Sources: Data for output, labor, and intermediate inputs were obtained from BEA Industry Accounts at:http://www.bea.gov/bea/dn2/gdpbyind_data.htm. Data for fi xed assets, from Fixed AssetsAccounts at: http://www.bea.gov/bea/dn/FA2004/Details/Index.html The BTS calculations are described in the text.
TABLE 5 Comparison of Annual Growth Rates of Truck MFP
BTS Triplett and Bosworth
Periods 1987 to 1995 1995 to 2001 1987 to 1995 1995 to 2001
MFP 2.03 -0.83 0.5 to 1.3 -0.2 to -0.5
Industry NAICS Trucking SIC Trucking and Warehousing
Data BEA BEA, BLS, Census
Source: BTS calculations; and Triplett and Bosworth (2004).
APOSTOLIDES 15
include a measure for the land input while the re-sults of the latter table do. Thus, it would appear that the inclusion of the land input does not make a noteworthy difference to the MFP results. This, however, would seem to be related to the method-ology used in this study for the measurement of land. The approach used essentially tied the land measurement to the magnitude, and change, in the stock of structures. That is, changes in land fol-lowed changes in the structures. This eliminated the effect of actual changes in the land input that might have been substantially different—in some years—from changes in the structures. In future work, it is planned for the measurement of land to be carried out by a different approach.
Two Points
There are two points to note with respect to the estimated MFP for truck transportation. First, as pointed out, the offi cial statistics of trucking output include the output of fi rms whose primary output is trucking. They do not include data for in-house trucking. Therefore, such data are not available for this analysis.
Second, there is the matter of contracted ser-vices. Trucking services are sometimes contracted out by truck carriers to single owner-operators of trucks. That activity would be an intermediate purchase by the trucking fi rm. Consequently, the activity would be counted in the gross output of truck transportation. On the input side, the ac-tivity would be counted as an intermediate input. This measurement would not affect the estimation of MFP, since the activity is measured in both the output and input sides.
SECTION IV—COMPARISONS OF
MULTIFACTOR PRODUCTIVITY
Data are available that make it possible to carry out comparisons between MFP in trucking and MFP of other transportation industries as well as of the U.S. private business sector. Such a compar-ison provides a broader perspective into the truck MFP estimates. Relevant data are shown in Table 6 on levels and growth of MFP. MFP estimates
for truck transportation are obtained from Table 4 of this study, and they relate to NAICS data. The other MFP estimates were obtained from BLS calculations. The air transportation MFP relates to NAICS data while rail MFP relates to SIC data. Rail MFP data are available up to 1999 while the other three MFP series go beyond that year.
Estimates of MFP for the three transportation industries and the U.S. business sector end at different years; so, it is not possible to compare trucking with the other three series for the entire 1987-2003 period. However, all series do go up to 1999; so, MFP growth rates can be compared for the 1987-1999 period. Over that period, truck and air MFP increased at similar annual rates, of 1.2% and 1.3% respectively; while rail MFP increased at the highest annual rate of 3.3%. All three trans-portation industries experienced growth rates of MFP that were higher than that of the U.S. busi-ness sector of 0.9% per annum.
In addition, during 1987-1995, truck MFP in-creased at a faster rate, of 2.0% per annum, than MFP in air transportation, which grew at 1.2% annually. During this time period, also, the three transportation industries experienced annual MFP growth which was at substantially higher rates than that of the U.S. economy (of 0.6%).
When one compares truck MFP with the MFP of the U.S. business sector beyond the 1987-1999 period, the data in Table 6 indicate that over 1987-2000, truck MFP increased faster per year (1.1%) than the business sector (0.9%). Consequently, during this time period, truck MFP contributed positively to increases in MFP in the U.S. econo-my. During 1987-2001, the growth rates of truck MFP and U.S. economy MFP were the same (at 8.0%). During the 1987-2003 period, truck MFP grew at 0.8% per annum, compared to the U.S. private economy of 1.0% per year. After 2001, MFP in trucking grew at a lower rate than in the U.S. private economy.
The decrease in truck MFP during 1995-2001 was affected by a decrease in truck output—ob-served in Table 4 for the year 2001. This decrease in output was affected by two events in that year:

16 ESTIMATION AND ANALYSIS OF MULTIFACTOR PRODUCTIVITY IN TRUCK TRANSPORTATION: 1987-2003
TABLE 6 Multifactor Productivity of Rail, Air, Trucking, and the U.S. Private Business Sector
Indexes (1987=100) Growth rates (percentage)
YearRail MFP
Air MFP
Truck MFP
U.S. private
business sector
Time period
Rail MFP
Air MFP
Truck MFP
U.S. private
business sector
‘(1) ‘(2) ‘(3) ‘(4) ‘(5) ‘(6) ‘(7) ‘(8) ‘(9)1987 100.0 100.0 100.0 100.01988 105.8 100.2 107.7 100.81989 109.8 98.2 108.8 101.11990 113.7 99.0 109.8 101.7 1987-1990 4.4 -0.3 3.2 0.71991 117.5 98.8 114.3 101.01992 125.0 102.4 118.7 103.61993 129.0 99.3 119.6 103.91994 131.8 105.8 120.1 104.81995 139.6 110.0 117.4 104.5 1987-1995 4.3 1.2 2.0 0.61996 144.8 114.2 117.6 106.31997 144.9 115.5 117.3 107.31998 143.4 114.3 116.7 108.91999 147.9 116.4 115.2 110.3 1995-1999 1.5 1.4 -0.5 1.32000 119.9 114.6 111.82001 114.9 111.7 111.9 1995-2001 0.7 -0.8 1.12002 113.3 113.82003 114.1 117.0 1987-1999 3.3 1.3 1.2 0.9
1987-2000 1.1 0.91987-2001 0.8 0.81987-2002 0.8 0.91987-2003 0.8 1.0
2001-2003 1.1 2.3Sources: Truck MFP from Table 4. MFP for rail, air, and the private business sector, from the BLS internet site:Productivity\Multifactor Productivity. Rail: ftp://ftp.bls.gov/pub/special,request/opt/dipts/indmfp.txt.Air: http://www.bls.gov/mfp/mprnaics.htm Private business sector: http://www.bls.gov/news.release/prod3.t01.htmThe MFP numbers for truck, air, and the private business sector were converted to 1987=100.
FIGURE 1 MFP in Transportation Industries and U.S. Private Business Sector (1987=100)
1987
1988
1989
1990
1991
1992
1993
1994
1995
1996
1997
1998
1999
2000
2001
2002
2003
90
100
110
120
130
140
150
160Multifactor Productivity
Rail
Truck Air
U.S. business
SOURCE: The data on which this chart is based were obtained from Table 6.
APOSTOLIDES 17
1) an economic recession, and 2) the catastrophic events of 9/11/01. Subsequently, industry output dropped in 2001 while the inputs decreased but by less.
The MFP levels of Table 6 were then converted into a graphical presentation, as shown in Figure 1. There, it can be observed that truck MFP was at a higher level than that of the U.S. business sector for most of the period of analysis. However, in 2001 to 2003, it fell below that of the U.S. busi-ness.
One also observes that truck MFP reached higher levels than air MFP, for most years of the period of analysis. In 1999, however, this situa-tion was reversed and maintained until 2001. It is not possible to make comparisons for 2002 and 2003, during which years truck MFP increased, because of unavailability of air MFP data. Finally, while truck MFP briefl y exceeded the level of rail MFP in 1988, the latter increased at faster rates during the rest of the period of analysis.
SECTION V—FACTORS AFFECTING MULTI-
FACTOR PRODUCTIVITY IN TRUCKING
Introduction
Technology and Advances in Technology
Technology is the recipe, the “know-how,” that is used by producers in different industries in order to produce a product or deliver a service. The technology utilized should be the best avail-able technology, in order to produce a product or service at the greatest possible level (and quality), given the available inputs (resources). The produc-tion of a product or service at the maximum level (given resources) also implies that it is produced at the lowest possible cost (cost per unit).
The technology of production refers to the mix-ture, or factor proportions, of the inputs used in production, and the ways (or techniques) by which the inputs are combined—in order to maximize output. For services (as well as for products), the main inputs in production are: labor, capital, land, and intermediate inputs. In practice, there are vari-ous types of these main inputs. For example, the
capital input includes various type of equipment and structures. The intermediate inputs include purchased materials, services, and energy inputs such as petroleum and electricity.
At a point in time, a fi rm, or an industry or economy, can maximize its output of a service (or product) by meeting two conditions: 1) full utili-zation of available resources (labor, capital, land, and intermediate inputs); and 2) by using the best technology that is available for the delivery of a service (or the production of a product). In the case of truck transportation, full utilization of re-sources means that trucks are full with freight at all times, on originating and return trips. It also means that trucks use roads that minimize any loss of time due to road congestion, construction, or accidents. Full utilization of trucks also implies the minimizing of the out-of-service time of trucks due to maintenance problems. With respect to the second requirement, the use of the best avail-able technology includes the utilization of capital goods (e.g., equipment, machines) that incorpo-rate in them the latest technological advances. This would lead to the highest possible level of output and, consequently, productivity. Capital goods can include equipment such as computers, and software.
When, and if, the level of maximum output is attained, it can only increase further with addi-tional increases in resources (labor, capital, land, and intermediate inputs) and improvements in technology. Either of these two factors require the passage of time. Over time, labor can increase through population growth, which can lead to higher numbers of labor force in the economy. Moreover, man-made capital, such as machines and structures, requires time to be created. In ad-dition, improvements to the technology used in production can entail improvements in the qual-ity of the inputs or by the discovery of new ways of combining the inputs used in the production process. Improvements such as these are typically the result of research and development activity, which requires time as well as expenditures. That activity may take place outside the industry that may eventually be affected. For example, im-

18 ESTIMATION AND ANALYSIS OF MULTIFACTOR PRODUCTIVITY IN TRUCK TRANSPORTATION: 1987-2003
provements in computers and software can take place in the computer industry; and, subsequently, these improved capital inputs can be used in truck transportation and lead to production increases.
The above effects can be illustrated with a pro-duction possibilities frontier, shown in Figure 2. The discussion will use an economy for illustra-tive purposes; one could substitute an industry or a fi rm, and the outcomes shown would still apply. Let us assume that an economy uses its resources and makes two outputs: bread and shirts (i.e., food and clothes). The potential levels of these two out-puts are shown on the two axes of the diagram.
In that case, the production relationship can be stated as:
Output = depends on (Labor, Capital, Land, Inter-mediate Inputs), Technology. The meaning of this relationship is that the level of output depends on the amounts of the inputs used in production—i.e., labor, etc.—and the technology used. “Tech-nology” is outside the parenthesis; it is not a physical input like labor and capital, and it can infl uence the productivity of the physical inputs. Its effects are generally incorporated in the MFP or residual.
The production possibilities frontier (Figure 2) represents the various combinations of the two outputs that would result in the maximum level
of (total) output. Point B on the curve shows the maximum output, which is possible when the economy is using its resources fully and utilizing the best available technology. Point A, which is below B, indicates an output level lower than the maximum. That level would be attained if the economy’s resources were not fully utilized. That could be the result if there was unemployed labor or capital in the economy due to an economic recession. That point would also be reached if fi rms in the economy did not use the best avail-able technology and thus did not maximize their output. That level would also be attained if there were monopolies in the economy that restricted output in maximizing their profi ts.
In order for the economy to move to a higher production possibilities frontier—i.e., at a higher level of output, indicated by point C—there would be need for time to pass. During this passage of time, it would be possible for resources of the economy to increase. This would include popula-tion growth and hence growth in labor. Over time, there could also be an increase in capital—build-ings and equipment—and land. Technology could also improve over time through the discovery of new ways of producing raw materials, intermedi-ate inputs or fi nal products/services.
The above discussion can be applied to the trucking industry. In that case, the trucking indus-try could be thought of as making two types of output—e.g., the delivery of bread and shirts. The analysis would follow the same lines as for the economy. The main point is that for the trucking industry to deliver the greatest level of transporta-tion services, there is need to: 1) employ fully the needed inputs, and 2) use the best available tech-nology. Also, for the level of output of the truck-ing industry to increase, over time, there would be need to employ more resources and/or improved technology (including a more effi cient industry structure).
Factors Affecting Changes in MFP of Truck
Transportation
A number of factors can affect changes in mul-tifactor productivity at the industry level. In the
FIGURE 2 Production Possibilities Frontier
Shirts
A
C
B
Bread
SOURCE: The production possibilities frontier is a widely known and used tool in economic courses. For example, see Dolan G. Edwin, 1983.
APOSTOLIDES 19
case of truck transportation, there were increases and decreases in MFP over the period of analy-sis, and these changes can be divided into three subperiods for assessment: 1) the subperiod of 1987-1995, during which truck MFP increased by an average annual rate of 2.0%; 2) the subperiod of 1995-2001, during which truck MFP declined at an average annual rate of –0.8%; and 3) the most recent subperiod of 2001-2003, during which truck MFP increased at an annual rate of 1.1%. Thus, the analysis has the challenging task of evaluating the factors that resulted in such a changing pattern of truck MFP.
The factors which have affected changes in truck MFP—in a positive or negative manner—include: 1) Improvements in the quality of capital: computers, software, trucks (information technol-ogies); 2) The effi ciency of utilizing intermediate inputs; this includes the fuel effi ciency/ineffi ciency of trucks; 3) Average length of haul; 4) Contain-erization; and 5) Changes in the structure of the industry—particularly following truck deregula-tion at the interstate and intrastate levels. The text below examines the effect of these factors over the period of analysis.12
1) Improvements in the Quality of Capital
There were improvements, over time, in the qual-ity of capital used in truck transportation. Capital includes buildings, equipment—such as trucks and computers—and software. In truck transportation, there were increases in the capital input over time; and newer capital is typically more effi cient than older capital, as it incorporates in it improvements in technology (embodied technical progress).
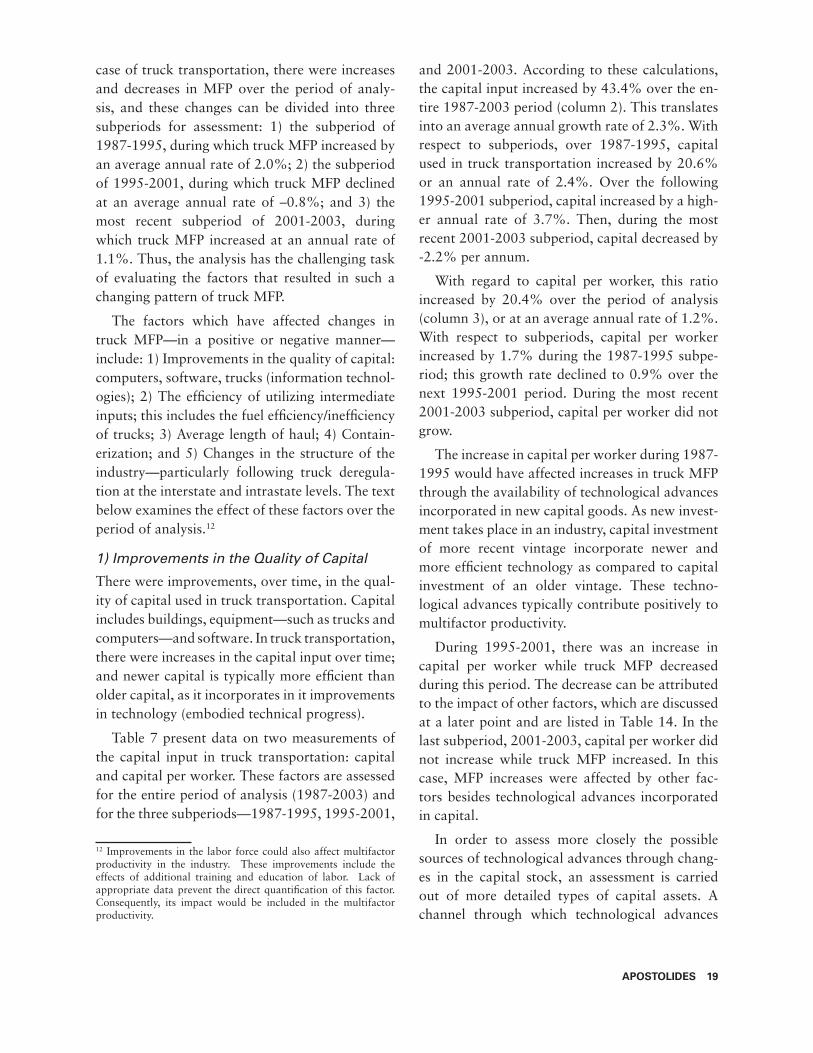
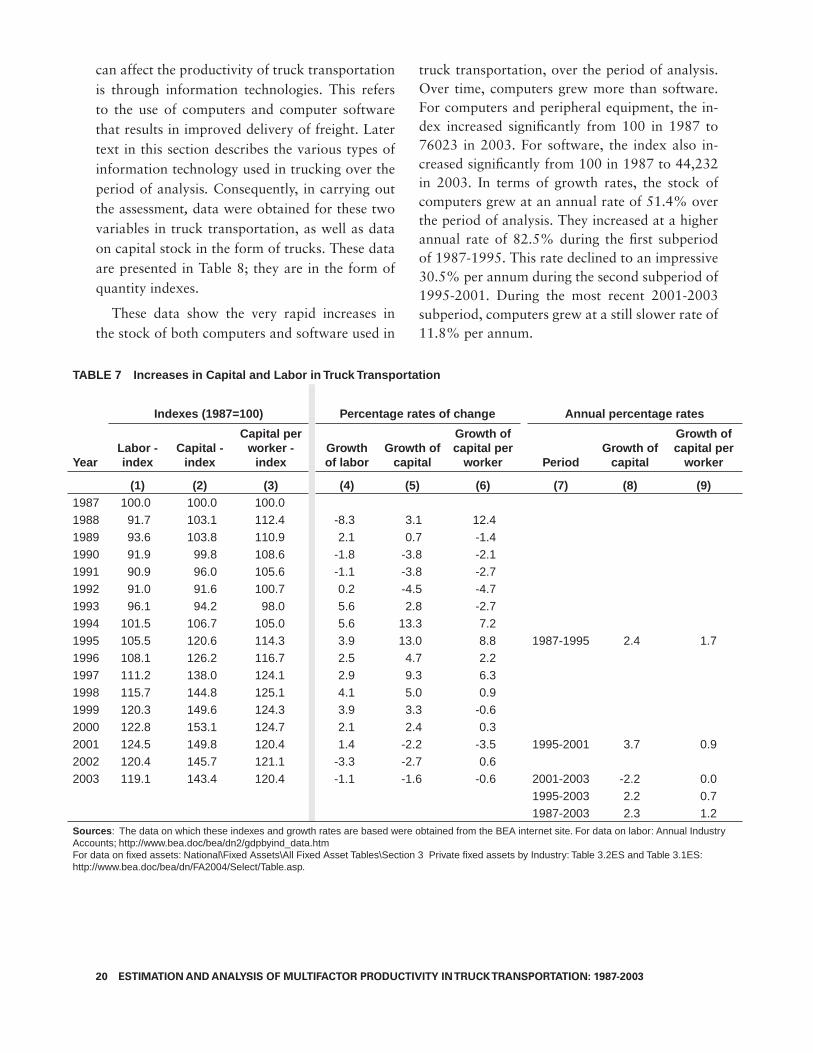
Table 7 present data on two measurements of the capital input in truck transportation: capital and capital per worker. These factors are assessed for the entire period of analysis (1987-2003) and for the three subperiods—1987-1995, 1995-2001,
12 Improvements in the labor force could also affect multifactor productivity in the industry. These improvements include the effects of additional training and education of labor. Lack of appropriate data prevent the direct quantifi cation of this factor. Consequently, its impact would be included in the multifactor productivity.
and 2001-2003. According to these calculations, the capital input increased by 43.4% over the en-tire 1987-2003 period (column 2). This translates into an average annual growth rate of 2.3%. With respect to subperiods, over 1987-1995, capital used in truck transportation increased by 20.6% or an annual rate of 2.4%. Over the following 1995-2001 subperiod, capital increased by a high-er annual rate of 3.7%. Then, during the most recent 2001-2003 subperiod, capital decreased by -2.2% per annum.
With regard to capital per worker, this ratio increased by 20.4% over the period of analysis (column 3), or at an average annual rate of 1.2%. With respect to subperiods, capital per worker increased by 1.7% during the 1987-1995 subpe-riod; this growth rate declined to 0.9% over the next 1995-2001 period. During the most recent 2001-2003 subperiod, capital per worker did not grow.
The increase in capital per worker during 1987-1995 would have affected increases in truck MFP through the availability of technological advances incorporated in new capital goods. As new invest-ment takes place in an industry, capital investment of more recent vintage incorporate newer and more effi cient technology as compared to capital investment of an older vintage. These techno-logical advances typically contribute positively to multifactor productivity.
During 1995-2001, there was an increase in capital per worker while truck MFP decreased during this period. The decrease can be attributed to the impact of other factors, which are discussed at a later point and are listed in Table 14. In the last subperiod, 2001-2003, capital per worker did not increase while truck MFP increased. In this case, MFP increases were affected by other fac-tors besides technological advances incorporated in capital.
In order to assess more closely the possible sources of technological advances through chang-es in the capital stock, an assessment is carried out of more detailed types of capital assets. A channel through which technological advances
20 ESTIMATION AND ANALYSIS OF MULTIFACTOR PRODUCTIVITY IN TRUCK TRANSPORTATION: 1987-2003
can affect the productivity of truck transportation is through information technologies. This refers to the use of computers and computer software that results in improved delivery of freight. Later text in this section describes the various types of information technology used in trucking over the period of analysis. Consequently, in carrying out the assessment, data were obtained for these two variables in truck transportation, as well as data on capital stock in the form of trucks. These data are presented in Table 8; they are in the form of quantity indexes.
These data show the very rapid increases in the stock of both computers and software used in
truck transportation, over the period of analysis. Over time, computers grew more than software. For computers and peripheral equipment, the in-dex increased signifi cantly from 100 in 1987 to 76023 in 2003. For software, the index also in-creased signifi cantly from 100 in 1987 to 44,232 in 2003. In terms of growth rates, the stock of computers grew at an annual rate of 51.4% over the period of analysis. They increased at a higher annual rate of 82.5% during the fi rst subperiod of 1987-1995. This rate declined to an impressive 30.5% per annum during the second subperiod of 1995-2001. During the most recent 2001-2003 subperiod, computers grew at a still slower rate of 11.8% per annum.
TABLE 7 Increases in Capital and Labor in Truck Transportation
Indexes (1987=100) Percentage rates of change Annual percentage rates
YearLabor - index
Capital - index
Capital per worker -
indexGrowth of labor
Growth of capital
Growth of capital per
worker PeriodGrowth of
capital
Growth of capital per
worker
(1) (2) (3) (4) (5) (6) (7) (8) (9)1987 100.0 100.0 100.01988 91.7 103.1 112.4 -8.3 3.1 12.41989 93.6 103.8 110.9 2.1 0.7 -1.41990 91.9 99.8 108.6 -1.8 -3.8 -2.11991 90.9 96.0 105.6 -1.1 -3.8 -2.71992 91.0 91.6 100.7 0.2 -4.5 -4.71993 96.1 94.2 98.0 5.6 2.8 -2.71994 101.5 106.7 105.0 5.6 13.3 7.21995 105.5 120.6 114.3 3.9 13.0 8.8 1987-1995 2.4 1.71996 108.1 126.2 116.7 2.5 4.7 2.21997 111.2 138.0 124.1 2.9 9.3 6.31998 115.7 144.8 125.1 4.1 5.0 0.91999 120.3 149.6 124.3 3.9 3.3 -0.62000 122.8 153.1 124.7 2.1 2.4 0.32001 124.5 149.8 120.4 1.4 -2.2 -3.5 1995-2001 3.7 0.92002 120.4 145.7 121.1 -3.3 -2.7 0.62003 119.1 143.4 120.4 -1.1 -1.6 -0.6 2001-2003 -2.2 0.0
1995-2003 2.2 0.71987-2003 2.3 1.2
Sources: The data on which these indexes and growth rates are based were obtained from the BEA internet site. For data on labor: Annual Industry Accounts; http://www.bea.doc/bea/dn2/gdpbyind_data.htmFor data on fi xed assets: National\Fixed Assets\All Fixed Asset Tables\Section 3 Private fi xed assets by Industry: Table 3.2ES and Table 3.1ES: http://www.bea.doc/bea/dn/FA2004/Select/Table.asp.

APOSTOLIDES 21
TAB
LE
8
Ch
ain
-Typ
e Q
uan
tity
Ind
exes
for
Net
Cap
ital
Sto
ck o
f S
elec
ted
Pri
vate
No
nre
sid
enti
al F
ixed
Ass
ets
Ind
ex n
um
ber
s, 1
987=
100
Gro
wth
rat
es (
ann
ual
per
cen
tag
e ra
tes)
Gro
wth
rat
es fo
r p
erio
ds
(an
nu
al)
Year
Co
mp
ute
rs
and
p
erip
her
al
equ
ipm
ent
So
ftw
are
Lig
ht
tru
cks
(in
clu
din
g
uti
lity
veh
icle
s)
Oth
er
tru
cks,
bu
ses
and
tr
uck
tr
aile
rs
Co
mp
ute
rs
and
p
erip
her
al
equ
ipm
ent
So
ftw
are
Lig
ht
tru
cks
(in
clu
din
g
uti
lity
veh
icle
s)
Oth
er
tru
cks,
bu
ses
and
tr
uck
tr
aile
rsT
ime
per
iod
Co
mp
ute
rs
and
p
erip
her
al
equ
ipm
ent
So
ftw
are
Lig
ht
tru
cks
(in
clu
din
g
uti
lity
veh
icle
s)
Oth
er
tru
cks,
bu
ses
and
tr
uck
tr
aile
rs
‘(1)
‘(2)
‘(3)
‘(4)
‘(5)
‘(6)
‘(7)
‘(8)
‘(9)
‘(10
)‘(
11)
‘(12
)‘(
13)
1987
100.
010
0.0
100.
010
0.0
1988
209.
630
5.6
104.
410
1.6
109.
620
5.6
4.4
1.6
1989
395.
567
6.2
101.
910
1.2
88.7
121.
3-2
.5-0
.4
1990
552.
511
04.7
94.7
94.9
39.7
63.4
-7.1
-6.3
1991
724.
316
21.0
87.5
88.7
31.1
46.7
-7.6
-6.6
1992
1322
.028
66.4
76.0
82.7
82.5
76.8
-13.
2-6
.7
1993
3047
.564
84.6
71.1
84.0
130.
512
6.2
-6.5
1.6
1994
6987
.614
271.
079
.392
.912
9.3
120.
111
.610
.7
1995
1232
6.0
1971
1.2
91.5
103.
076
.438
.115
.410
.819
87-1
995
82.5
93.6
-1.1
0.4
1996
1753
0.5
2208
0.8
101.
410
3.1
42.2
12.0
10.8
0.1
1997
3071
9.2
3020
9.3
123.
810
5.1
75.2
36.8
22.1
2.0
1998
3849
8.3
3593
0.4
130.
810
5.9
25.3
18.9
5.6
0.8
1999
4545
1.4
4022
2.4
133.
510
5.3
18.1
11.9
2.1
-0.6
2000
5649
7.2
4672
9.0
133.
110
2.5
24.3
16.2
-0.3
-2.6
2001
6087
5.1
4620
7.5
126.
594
.27.
7-1
.1-5
.0-8
.119
95-2
001
30.5
15.3
5.5
-1.5
2002
6533
9.5
4470
0.5
120.
487
.77.
3-3
.3-4
.8-6
.9
2003
7602
2.6
4423
2.7
117.
882
.716
.4-1
.0-2
.2-5
.820
01-2
003
11.8
-2.2
-3.5
-6.3
1987
-200
351
.446
.31.
0-1
.2
So
urc
es: F
or d
ata
on fi
xed
asse
ts: N
atio
nal\F
ixed
Ass
ets\
All
Fix
ed A
sset
Tab
les\
Sec
tion
3 -
Priv
ate
fi xed
ass
ets
by In
dust
ry: T
able
3.2
ES
and
Tab
le 3
.1E
S: h
ttp://
ww
w.b
ea.d
oc/b
ea/d
n/FA
2004
/Sel
ect/T
able
.asp
.
22 ESTIMATION AND ANALYSIS OF MULTIFACTOR PRODUCTIVITY IN TRUCK TRANSPORTATION: 1987-2003
With regard to software, their stock increased steadily and signifi cantly over time, up to 2000; it subsequently declined, but was still maintained at high levels. The pattern for software stock over time is similar to that of computers. During the fi rst subperiod, of 1987-1995, the software stock increased at an annual rate of 93.6%. This was even higher than the rate of increase for comput-ers. However, during the second subperiod, 1995-2001, software grew at a substantially slower, although still impressive, rate of 15.3%. This rate declined further to –2.2% during 2001-2003.
A very different picture is obtained for the stock of trucks. Light trucks (column 3) increased much slower over the period of analysis than comput-ers or software; they increased by 17.8% over the entire 1987-2003 period. In fact, during the fi rst subperiod (1987-1995), they experienced a decrease—from 100.0 to 91.5, or about -8.5%. In terms of growth rates, light trucks increased at an annual rate of 1.0% over 1987-2003. During the fi rst subperiod (1987-1995), they actually declined by –1.1% per annum; during the next 1995-2003 subperiod, they increased at 5.5% per year, while during the most recent 2001-2003 subperiod, they decreased at –3.5% per year.
The capital stock of “Other trucks, buses, and truck trailers” experienced a decline over the en-tire 1987-2003 period (from 100.0 to 82.7). In terms of growth rates, during the entire period of analysis, the capital stock of “Other trucks, etc.” decreased at an annual rate of -1.2%. During the fi rst subperiod (1987-1995), their stock increased by 0.4% per annum. However, this changed to an annual decline of –1.5% during the 1995-2001 subperiod; the decline continued at the higher rate of –6.3% during the most recent 2001-2003 sub-period.
In summary, these data indicate the rapid growth, over the period of analysis, of the two IT-related capital assets—computers and software. By contrast, the capital stock of trucks either in-creased very little or declined over the same period. Consequently, changes in technology in computers and software would have been instrumental in af-
fecting increases in truck MFP during 1987-1995. Increases in computers during the most recent 2001-2003 subperiod are also consistent with an increasing truck MFP during that subperiod. Since computers and software were increasing during 1995-2001 while MFP declined, it would appear that other factors contributed to the decreases in truck MFP during the 1995-2001 subperiod. Such factors are examined in other parts of this study.
2) Information Technologies: Hardware, Software, and Communications
Technological advances used in truck transpor-tation include information technologies. These technologies include the use of computers and software as well as various channels of commu-nication such as satellite communications and the internet. These technologies have affected all aspects of truck transportation services, including the operation of the truck, the selection of routes, truck maintenance, and the marketing of truck services. These technologies can be used by them-selves or in combination with other IT technolo-gies; the latter framework seems more typical.
The various information technologies that affected motor carrier operations include the following: a) On-board computers (OBC); b) Electronic data interchange (EDI); c) Automatic vehicle location (AVL); d). Satellite communica-tions (SATCOM): e) Computer-aided dispatching (CAD), and Computer aided routing (CAR); f) Truck maintenance; and g) Transactions of truck services (marketing, operations). These technolo-gies and their impact on trucking productivity are discussed below.
On-Board Computers (OBCs)
On-board computers are truck-based or hand-held computers, used to obtain information on truck performance. These computers collect and process data received from sensors, and other devices, located on trucks. They keep records of readings and provide the fl eet operator with performance information on the trucks and driv-ers. OBCs can be used as trip recorders and to monitor drivers’ hours of service and vehicle

APOSTOLIDES 23
performance measures, such as speed and fuel consumption. OBCs are also used in conjunction with computer-aided routing and dispatching sys-tems and with maintenance-scheduling software. On-board computers also become involved in the Automatic Vehicle Location system, described below.
On-board computers can contribute to increased productivity in the following ways:
Business Transactions. The computer on the truck registers delivery times of freight and cus-tomer signatures for proof-of-delivery. This has reduced paperwork and thus labor time to do such paperwork.
Driver Log. With OBC, drivers can input re-cords of hours of service and fuel consumption. Such data make possible an assessment of fuel utilization, leading to truck speeds that minimize the use of fuel. Increased effi ciency in the use of fuel, an intermediate input, would increase MFP. A reduction of total intermediate inputs, in rela-tion to output, is not observed in trucking over the period of analysis—except for the last 2 to 3 years. It will be shown that the fuel effi ciency in trucking decreased over the period of analysis.
Data Collection on Vehicle Performance. On-board-computers provide information on various parts of truck performance. These include: engine idling, braking, and patterns of shifting and ac-celeration. The computer also provides data, from diagnostic systems, on ancillary equipment on the truck such as refrigeration units. Consequently, OBCs allow for remote diagnostics prior to a malfunction of the truck; this can be followed by preventive maintenance. Prompt preventive main-tenance and repair improve the performance of trucks and reduce their out-of-service time. This results in higher levels of output and MFP.
Electronic Data Interchange (EDI)
Electronic Data Interchange (EDI) systems include computers and software that are used to send and receive electronic messages and data transmission between computers of two parties. The transmis-sion can occur between trucking companies and
shippers (or between any two trading partners). This technology enables the transmission of infor-mation, including electronic transactions, between companies in an easier, more accurate, and timely manner. EDI allows for effi cient billing and receipt of freight-delivery acknowledgement.
The use of computers for fi nancial transactions reduces paperwork and related labor costs, and thus reduces costs of business transactions. This increase multifactor productivity.
Automatic Vehicle Location (AVL) and Satellite Communications (SATCOM)
Automatic vehicle location (AVL) refers to a broad category of ground-based or satellite technologies, with which it is possible to track the location of trucks. Dispatchers, drivers, shippers, and receiv-ers can track a truck from pickup to delivery of freight; coordinate inter-modal shipments; and perform just-in-time deliveries. In addition to vehicle tracking, SATCOM technologies provide communication between the dispatchers and the truck drivers; this allows for real time coordina-tion of fl eet routing and dispatching activities. With an on-board computer, two-way text or voice communications can allow for routing and dispatching of trucks in current time/real time, as well as the (real-time) monitoring of vehicle op-erating parameters such as speed, etc. With this system, the motor carrier can also locate a truck in case of a breakdown. This results in less out-of-service time, and thus higher levels of output (freight delivered) and MFP.
Computer-Aided Routing (CAR) and Dispatching (CAD)
These technologies involve computer hardware and specifi c software that are used for dispatching, routing, and decision support for route selection of trucks. Good route selection can contribute to minimizing the time and cost of moving freight. These systems are used to schedule drivers and trucks subject to parameters, such as allowable driving hours, size of load, and origin and destina-tion. The basic systems allow for the planning and scheduling of truck activities prior to the dispatch

24 ESTIMATION AND ANALYSIS OF MULTIFACTOR PRODUCTIVITY IN TRUCK TRANSPORTATION: 1987-2003
of a truck. In addition, more sophisticated systems allow for routing and dispatch decisions based on real-time truck locations; estimate delivery times and distances; help improve cost estimates; and generate route maps.
The technologies of computer-aided dispatch-ing (CAD) and computer-aided routing (CAR) lead to improved fl eet routing and dispatching. This results in an increased utilization of trucks. This includes a reduction in the number, and ex-tent, of empty trucks, particularly on back hauls. This increases trucking output and, consequently, raises truck productivity and MFP.
Computer-aided dispatching and routing pro-vide for improved dispatcher productivity. This technology results in less time needed for truck carriers’ staff to complete routing procedures as compared to previous manual systems. These technologies also improve communication effi -ciency. With a computerized system, information to drivers can be relayed instantaneously. Conse-quently, information on a pick-up of freight can be transacted by the truck carrier and the infor-mation relayed quickly to an appropriate truck driver, who is close to the freight. This results in increased output (load) for that particular truck, and greater output for the trucking fi rm—and for the trucking industry.
Truck Maintenance
Technological advances have affected positively truck maintenance through the increased use of maintenance-tracking software (MTS). These soft-ware improve the maintenance of trucks by track-ing and reordering parts for the repair department of a truck fl eet. These software also carry out real-time diagnostics of trucks. As information becomes promptly available on the performance of trucks, maintenance tracking software is used to schedule preventive and emergency repairs, as needed, in the most cost-effective manner. Preven-tive maintenance reduces maintenance costs as po-tential problems are repaired before they become bigger and more expensive jobs. This also reduces the out-of-service time of trucks.
Marketing of Truck Services
There has been an increase in the use of computer-ized systems for the buying and selling of truck transportation services. These include hardware, software, the internet, and satellite communica-tions. The result is higher delivered freight output for the quantity of labor and capital used; this increases production effi ciency/MFP.
In summary, information technology contrib-uted to productivity in truck transportation in a number of ways:
On the operations side, computers have been used for communications between the truck car-rier and the truck drivers. These communications helped carriers increase vehicle utilization through increased monitoring and reducing unnecessary out-of-route miles by drivers. Information avail-ability on road work or the closing of roads (as a result of accidents) enables the driver to avoid the affected roads and choose other routes. These computers have also been used to schedule trips by trucks, including which freight to deliver and which roads to take. Information technologies would also contribute to lower fuel costs through improved routing. Improved routing would entail the choice of the quickest (and lower cost) route between two points.
On the maintenance side, computers have been used to schedule regular maintenance checks for trucks. Computers have also been used to check for problems developing in trucks. This can pre-vent a breakdown of a truck on the road with the accompanying negative effects of the truck being out-of-service.
On the administrative side, the use of comput-ers would include personnel transactions and re-cords. Personnel information would relate to the keeping of records for full-time truck drivers and those on a contractual basis. Since the trucking in-dustry has had substantial turnover of drivers, the keeping of correct and updated personnel records would be of particular importance. On the sales side, computers have been used to obtain receipts when the freight is delivered. This entailed elec-
APOSTOLIDES 25
tronic transactions and the electronic dissemina-tion of such information. Administrative costs fell as new technologies were adopted that involved paperless transactions.
Finally, it is noted that the data on comput-ers and software would not include information technology equipment utilized on the trucks them-selves. The latter would be part of the truck and they would have been included in the measure-ment of the capital stock for trucks.
3) Intermediate Inputs
An industry’s MFP can also be affected by its effi ciency in utilizing intermediate inputs. In ex-amining this point, the ratio was calculated of intermediate inputs to gross output of the truck-ing industry, and the results are shown in Table 9. These results indicate that in terms of current prices, intermediate inputs accounted for about 50% of gross output over the period of analysis (column 3). Moreover, over time, there was an in-crease in the ratio of intermediate inputs to gross output. Intermediate inputs were 47% of gross in-dustry output in 1987; in subsequent years, the ra-tio increased and reached a high of 56% in 2000. However, from 2001 to 2003, the ratio declined (from 55% to 51%).
Since the ratio in current prices could be affect-ed by increases in the relative price of intermediate inputs (including fuel), tabulations were also car-ried out in quantity terms. These tabulations are in terms of growth rates, and are shown in Table 9, particularly columns 7 and 8. They support the results of calculations in current price.
The growth rates in quantity terms indicate that over the period of analysis, the quantity of intermediate inputs increased faster than output of the trucking industry. This is also observed for the two subperiods of 1987-1995 and 1995-2001. However, this trend was reversed in 2001, and over the most recent 2001-2003 period, both the quantity of output and intermediate inputs decreases. During that period, intermediate inputs decreased at a substantially faster rate annual rate (-7.3%) than output (-3.9%).
Thus, these numbers, in current dollars and in quantity terms, indicate that there was a decline in the effi ciency with which intermediate inputs were utilized in trucking, over 1987-1995 and 1995-2001. However, there was an increase in the effi ciency of utilizing intermediate inputs over the most recent period 2001-2003. The decrease in the effi ciency of utilizing intermediate inputs, dur-ing 1995-2001, was a contributory factor to the declining truck MFP during that period. Also, the effi ciency of utilizing intermediate inputs in truck transportation was increasing over the last three years of the period of analysis. This would have contributed to the increasing MFP during those years.
In attempting to explain the decrease in effi -ciency of utilizing intermediate inputs over most years of the period of analysis, one notes that a major intermediate input in truck transportation is fuel. Therefore, an examination is carried out of fuel effi ciency in trucking.
One would expect that improvements in the capital input of truck transportation would in-clude the use of newer trucks that incorporate in them the results of new technologies. These new technologies would include truck engines that are more fuel-effi cient than older engines. Improve-ments in fuel effi ciency are expected to result in reduced use of fuels and consequently of interme-diate inputs. This would contribute to increased effi ciency of the industry in using intermediate inputs, which would have contributed positively to truck MFP.
In evaluating such a possibility, data on fuel ef-fi ciency are presented in Tables 10 and 11. Data in Table 10 are for heavy single-unit trucks; they indicate that there was a rather steady increase in the fuel effi ciency of these trucks over the 1987-2002 period. Their fuel effi ciency increased over time from 6.4 miles per gallon (mpg) in 1987 to 7.5 in 2001; it declined slightly to 7.4 mpg in 2002. Calculations with growth rates (in the same table) show a similar development. Fuel effi ciency of these trucks increased at an annual rate of 0.8% during 1987-1995; it increased rather substan-

26 ESTIMATION AND ANALYSIS OF MULTIFACTOR PRODUCTIVITY IN TRUCK TRANSPORTATION: 1987-2003
tially at 1.6% per annum during the 1995-2001 subperiod.
Table 11 presents data on the fuel effi ciency of combination trucks. These trucks use one or more trailers. Consequently, they would carry greater and heavier freight than single unit trucks. The data presented indicate, for one, that these trucks had lower fuel effi ciency than single unit trucks. In 1987, the combination trucks obtained 5.7 miles per gallon compared to 6.4 miles per gallon for the single unit trucks. Moreover, the fuel effi ciency of the combination trucks decreased over the pe-riod of analysis, from 5.7 mpg in 1987 to 5.2 mpg in 2002. That implies a decline of –0.6% per year. Consequently in 2002, these trucks were even less fuel-effi cient (at 5.2 mpg) than in 1987 (5.7 mpg); they were also considerably less fuel-effi cient than the single-unit trucks which obtained 7.4 mpg in
2002.
With respect to subperiods, the fuel effi ciency of combination trucks increased by 0.2% an-nually, during 1987-1995. However, during the subsequent subperiod of 1995-2001, their fuel-effi ciency declined signifi cantly at an annual rate of -1.2%. This decline in fuel effi ciency would have contributed to the decline in the effi ciency of utilizing intermediate inputs during 1995-2001 (shown in Table 9); it would also have been a con-tributory factor in the declining truck MFP during 1995-2001.
Moreover, the number of miles traveled by the less fuel-effi cient combination trucks have been greater than those traveled by the single-unit trucks, by rather substantial magnitudes (column 2 of Tables 10 and 11). Consequently, the fuel effi ciency of the truck transportation industry, in
TABLE 9 Intermediate Inputs to Output in Truck Transportation
Current prices Quantity indexes Growth rates (percentage)
Year
Gross output
(current $ billions)
Intermediate inputs
(current $ billions)
Interm. inputs
to gross output [(2)/(1)]
Output index
(2000=100)
Interm. input index (2000=100)
Time period Output
Intermediate inputs
‘(1) ‘(2) ‘(3) ‘(4) ‘(5) ‘(6) ‘(7) ‘(8)
1987 $82.5 $38.6 0.47 48.70 42.3981988 $92.9 $45.0 0.48 54.74 48.6131989 $101.0 $49.9 0.49 57.38 51.5531990 $111.6 $59.0 0.53 60.68 57.752 1987-1990 7.6 10.91991 $111.9 $57.8 0.52 61.89 56.0161992 $121.1 $64.0 0.53 67.01 62.0161993 $127.9 $66.2 0.52 69.71 63.2981994 $141.8 $73.4 0.52 76.23 69.2181995 $148.0 $77.9 0.53 78.29 71.421 1987-1995 6.1 6.71996 $157.0 $85.0 0.54 82.54 76.4091997 $168.2 $89.8 0.53 86.32 79.8231998 $184.1 $97.9 0.53 92.63 88.3371999 $198.7 $108.8 0.55 97.52 96.3262000 $213.2 $120.4 0.56 100.00 100.0002001 $205.7 $112.4 0.55 93.83 93.128 1995-2001 3.1 4.52002 $204.1 $108.7 0.53 92.20 90.166 1987-2001 4.8 5.82003 $196.8 $99.6 0.51 86.71 79.979 2001-2003 -3.9 -7.3
1987-2003 3.7 4.0Sources: BEA internet site. Annual Industry Accounts: http://www.bea.doc.gov/bea/dn2/gdpbyind_data.htm.
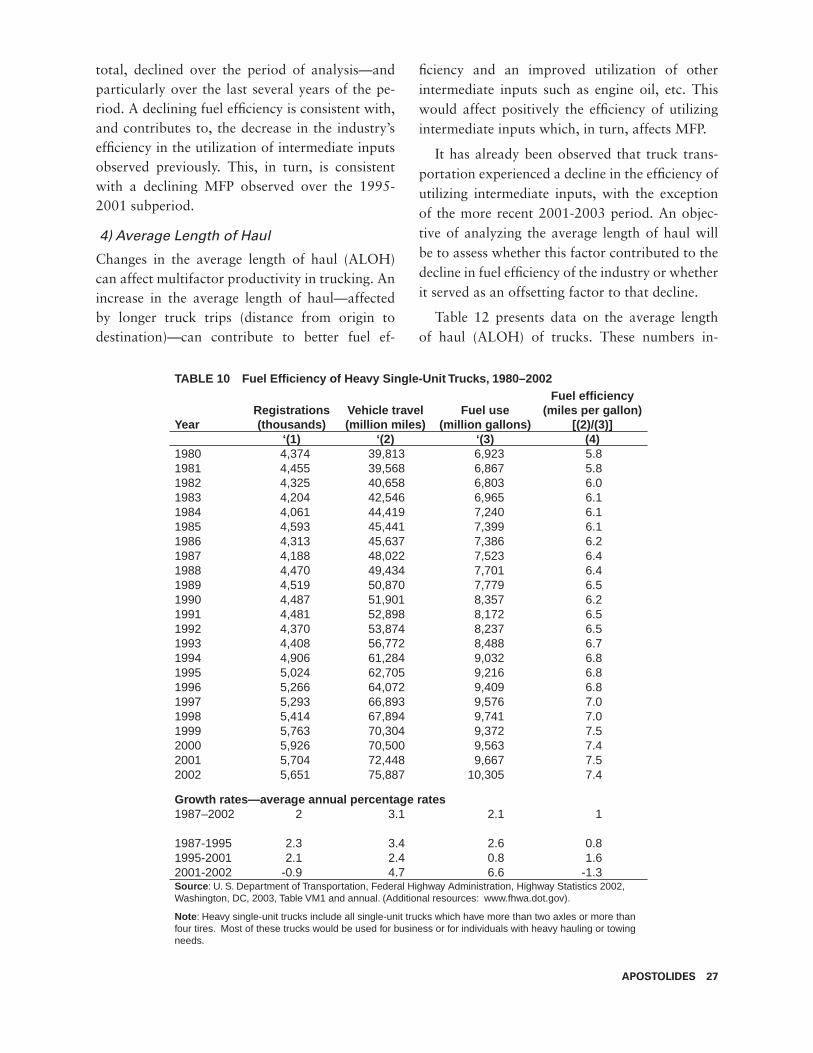
APOSTOLIDES 27
TABLE 10 Fuel Effi ciency of Heavy Single-Unit Trucks, 1980–2002
YearRegistrations (thousands)
Vehicle travel (million miles)
Fuel use (million gallons)
Fuel effi ciency (miles per gallon)
[(2)/(3)]‘(1) ‘(2) ‘(3) (4)
1980 4,374 39,813 6,923 5.81981 4,455 39,568 6,867 5.81982 4,325 40,658 6,803 6.01983 4,204 42,546 6,965 6.11984 4,061 44,419 7,240 6.11985 4,593 45,441 7,399 6.11986 4,313 45,637 7,386 6.21987 4,188 48,022 7,523 6.41988 4,470 49,434 7,701 6.41989 4,519 50,870 7,779 6.51990 4,487 51,901 8,357 6.21991 4,481 52,898 8,172 6.51992 4,370 53,874 8,237 6.51993 4,408 56,772 8,488 6.71994 4,906 61,284 9,032 6.81995 5,024 62,705 9,216 6.81996 5,266 64,072 9,409 6.81997 5,293 66,893 9,576 7.01998 5,414 67,894 9,741 7.01999 5,763 70,304 9,372 7.52000 5,926 70,500 9,563 7.42001 5,704 72,448 9,667 7.52002 5,651 75,887 10,305 7.4
Growth rates—average annual percentage rates1987–2002 2 3.1 2.1 1
1987-1995 2.3 3.4 2.6 0.81995-2001 2.1 2.4 0.8 1.62001-2002 -0.9 4.7 6.6 -1.3Source: U. S. Department of Transportation, Federal Highway Administration, Highway Statistics 2002, Washington, DC, 2003, Table VM1 and annual. (Additional resources: www.fhwa.dot.gov).
Note: Heavy single-unit trucks include all single-unit trucks which have more than two axles or more than four tires. Most of these trucks would be used for business or for individuals with heavy hauling or towing needs.
total, declined over the period of analysis—and particularly over the last several years of the pe-riod. A declining fuel effi ciency is consistent with, and contributes to, the decrease in the industry’s effi ciency in the utilization of intermediate inputs observed previously. This, in turn, is consistent with a declining MFP observed over the 1995-2001 subperiod.
4) Average Length of Haul
Changes in the average length of haul (ALOH) can affect multifactor productivity in trucking. An increase in the average length of haul—affected by longer truck trips (distance from origin to destination)—can contribute to better fuel ef-
fi ciency and an improved utilization of other intermediate inputs such as engine oil, etc. This would affect positively the effi ciency of utilizing intermediate inputs which, in turn, affects MFP.
It has already been observed that truck trans-portation experienced a decline in the effi ciency of utilizing intermediate inputs, with the exception of the more recent 2001-2003 period. An objec-tive of analyzing the average length of haul will be to assess whether this factor contributed to the decline in fuel effi ciency of the industry or whether it served as an offsetting factor to that decline.
Table 12 presents data on the average length of haul (ALOH) of trucks. These numbers in-
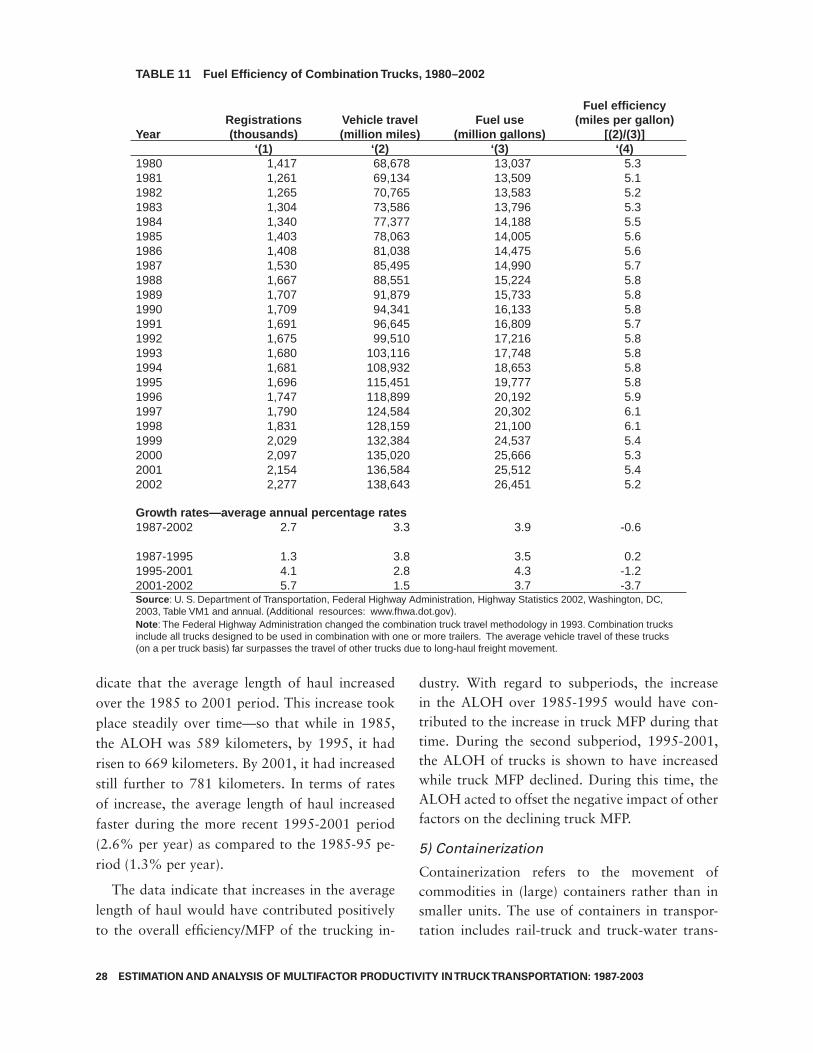
28 ESTIMATION AND ANALYSIS OF MULTIFACTOR PRODUCTIVITY IN TRUCK TRANSPORTATION: 1987-2003
dicate that the average length of haul increased over the 1985 to 2001 period. This increase took place steadily over time—so that while in 1985, the ALOH was 589 kilometers, by 1995, it had risen to 669 kilometers. By 2001, it had increased still further to 781 kilometers. In terms of rates of increase, the average length of haul increased faster during the more recent 1995-2001 period (2.6% per year) as compared to the 1985-95 pe-riod (1.3% per year).
The data indicate that increases in the average length of haul would have contributed positively to the overall effi ciency/MFP of the trucking in-
dustry. With regard to subperiods, the increase in the ALOH over 1985-1995 would have con-tributed to the increase in truck MFP during that time. During the second subperiod, 1995-2001, the ALOH of trucks is shown to have increased while truck MFP declined. During this time, the ALOH acted to offset the negative impact of other factors on the declining truck MFP.
5) Containerization
Containerization refers to the movement of commodities in (large) containers rather than in smaller units. The use of containers in transpor-tation includes rail-truck and truck-water trans-
TABLE 11 Fuel Effi ciency of Combination Trucks, 1980–2002
YearRegistrations (thousands)
Vehicle travel (million miles)
Fuel use (million gallons)
Fuel effi ciency (miles per gallon)
[(2)/(3)]‘(1) ‘(2) ‘(3) ‘(4)
1980 1,417 68,678 13,037 5.31981 1,261 69,134 13,509 5.11982 1,265 70,765 13,583 5.21983 1,304 73,586 13,796 5.31984 1,340 77,377 14,188 5.51985 1,403 78,063 14,005 5.61986 1,408 81,038 14,475 5.61987 1,530 85,495 14,990 5.71988 1,667 88,551 15,224 5.81989 1,707 91,879 15,733 5.81990 1,709 94,341 16,133 5.81991 1,691 96,645 16,809 5.71992 1,675 99,510 17,216 5.81993 1,680 103,116 17,748 5.81994 1,681 108,932 18,653 5.81995 1,696 115,451 19,777 5.81996 1,747 118,899 20,192 5.91997 1,790 124,584 20,302 6.11998 1,831 128,159 21,100 6.11999 2,029 132,384 24,537 5.42000 2,097 135,020 25,666 5.32001 2,154 136,584 25,512 5.42002 2,277 138,643 26,451 5.2
Growth rates—average annual percentage rates1987-2002 2.7 3.3 3.9 -0.6
1987-1995 1.3 3.8 3.5 0.21995-2001 4.1 2.8 4.3 -1.22001-2002 5.7 1.5 3.7 -3.7Source: U. S. Department of Transportation, Federal Highway Administration, Highway Statistics 2002, Washington, DC, 2003, Table VM1 and annual. (Additional resources: www.fhwa.dot.gov).Note: The Federal Highway Administration changed the combination truck travel methodology in 1993. Combination trucks include all trucks designed to be used in combination with one or more trailers. The average vehicle travel of these trucks (on a per truck basis) far surpasses the travel of other trucks due to long-haul freight movement.
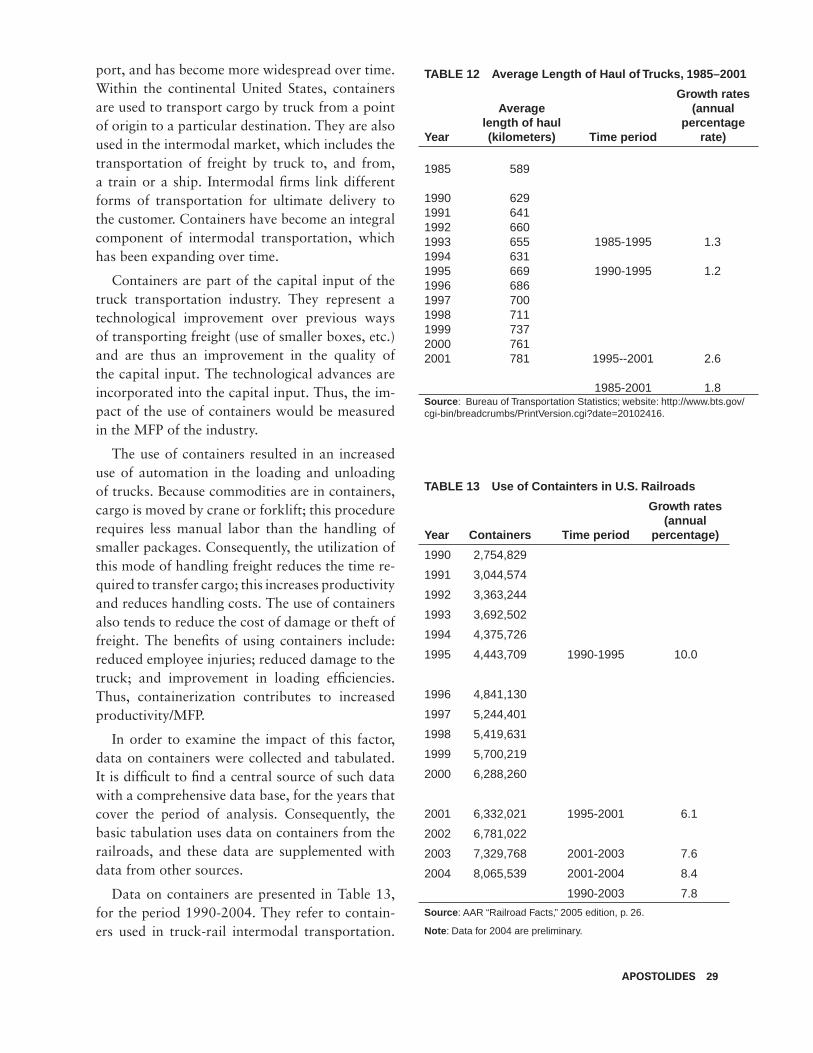
APOSTOLIDES 29
port, and has become more widespread over time. Within the continental United States, containers are used to transport cargo by truck from a point of origin to a particular destination. They are also used in the intermodal market, which includes the transportation of freight by truck to, and from, a train or a ship. Intermodal fi rms link different forms of transportation for ultimate delivery to the customer. Containers have become an integral component of intermodal transportation, which has been expanding over time.
Containers are part of the capital input of the truck transportation industry. They represent a technological improvement over previous ways of transporting freight (use of smaller boxes, etc.) and are thus an improvement in the quality of the capital input. The technological advances are incorporated into the capital input. Thus, the im-pact of the use of containers would be measured in the MFP of the industry.
The use of containers resulted in an increased use of automation in the loading and unloading of trucks. Because commodities are in containers, cargo is moved by crane or forklift; this procedure requires less manual labor than the handling of smaller packages. Consequently, the utilization of this mode of handling freight reduces the time re-quired to transfer cargo; this increases productivity and reduces handling costs. The use of containers also tends to reduce the cost of damage or theft of freight. The benefi ts of using containers include: reduced employee injuries; reduced damage to the truck; and improvement in loading effi ciencies. Thus, containerization contributes to increased productivity/MFP.
In order to examine the impact of this factor, data on containers were collected and tabulated. It is diffi cult to fi nd a central source of such data with a comprehensive data base, for the years that cover the period of analysis. Consequently, the basic tabulation uses data on containers from the railroads, and these data are supplemented with data from other sources.
Data on containers are presented in Table 13, for the period 1990-2004. They refer to contain-ers used in truck-rail intermodal transportation.
TABLE 12 Average Length of Haul of Trucks, 1985–2001
Year
Average length of haul (kilometers) Time period
Growth rates (annual
percentage rate)
1985 589
1990 6291991 6411992 6601993 655 1985-1995 1.31994 6311995 669 1990-1995 1.21996 6861997 7001998 7111999 7372000 7612001 781 1995--2001 2.6
1985-2001 1.8Source: Bureau of Transportation Statistics; website: http://www.bts.gov/cgi-bin/breadcrumbs/PrintVersion.cgi?date=20102416.
TABLE 13 Use of Containters in U.S. Railroads
Year Containers Time period
Growth rates (annual
percentage)
1990 2,754,829
1991 3,044,574
1992 3,363,244
1993 3,692,502
1994 4,375,726
1995 4,443,709 1990-1995 10.0
1996 4,841,130
1997 5,244,401
1998 5,419,631
1999 5,700,219
2000 6,288,260
2001 6,332,021 1995-2001 6.1
2002 6,781,022
2003 7,329,768 2001-2003 7.6
2004 8,065,539 2001-2004 8.4
1990-2003 7.8
Source: AAR “Railroad Facts,” 2005 edition, p. 26.
Note: Data for 2004 are preliminary.

30 ESTIMATION AND ANALYSIS OF MULTIFACTOR PRODUCTIVITY IN TRUCK TRANSPORTATION: 1987-2003
These data indicate that the number of contain-ers used increased by 7.8% per annum over the 1990-2003 period. Moreover, the fi rst subperiod, 1990-1995, has the highest annual growth rate, at 10.0%. This subperiod is similar to the initial sub-period for truck MFP (1987-1995). The follow-ing subperiod, of 1995-2001, has a substantially lower growth rate for containers, at 6.1% per an-num. The most recent subperiod, of 2001-2003, has a growth rate that is higher that the previous subperiod, at 7.6%.
The rates of increase in the number of containers used correspond well to the changes in truck MFP. Truck MFP was increasing during 1987-1995, while the number of containers used increased at the highest rate (over 1990-2003) during 1990-1995. Truck MFP decreased during the follow-ing subperiod, 1995-2001, and the numbers of container used increased at the lowest rate during that subperiod. Finally, truck MFP was increasing again during 2001-2003, and the use of contain-ers was also increasing during that subperiod.
Additional data on containers are presented in two appendix tables. These data are consistent with, and reinforce, the fi ndings based on data in Table 13. First, Appendix J presents data on con-tainers used in waterborne trade of the U.S. That is another segment of the container market and re-lates to truck-ship (or ship-truck) transportation. Although these data cover fewer years than the rail data, they show similar trends. They indicate that the increase of shipping containers during the most recent subperiod, of 2001-2003, was greater than during the previous subperiod of 1998-2001. One notes that truck MFP increased during 2001-2003, while it decreased during 1995-2001.
Finally, another set of data are presented in Ap-pendix K. These data refer to containers used in trucks that crossed the border of the United States for Canada or Mexico. These data indicate a rath-er steady increase in the use of containers over the 1996-2002 period (with a decline in 2003). They also show a pattern similar to that which has been observed. During the most recent 2001-2003 sub-period, the use of containers increased substan-tially more (at 16.4% annually) than during the
previous 1996-2001 subperiod (0.6%). And truck MFP also decreased during 1995-2001, while it increased during 2001-2003.
The data on containers indicate that the use of containers was a factor that affected effi ciency in truck delivery and truck MFP. The data indicate high growth of containers use during the 1990-1995 subperiod (or parts of that period) and during 2001-2003. By contrast, low increases of containers use are observed during the 1995-2001 subperiod. Changes in truck MFP corresponds quite well to changes in containers use: During the 1990 (1987) to 1995 period, and the 2001-2003 period, truck MFP increased; while during 1995-2001, truck MFP declined.
6) Changes in Industry Structure—Deregulation
The structure of an industry can change over time as a result of deregulation, mergers/acquisi-tions, and bankruptcies. Such changes can affect effi ciency (productivity) in an industry. With re-spect to mergers, the acquisition of one fi rm by another implies that the more effi cient fi rm ac-quires a less effi cient fi rm. In that case, the more effi cient fi rm has typically grown faster (sales), has gained signifi cant amounts of revenues and prof-its, and is able to secure fi nancial resources. All of these characteristics enable it to acquire another, less effi cient fi rm. Two types of mergers are rel-evant to the analysis: horizontal and vertical. A horizontal merger combines two fi rms in the same industry into one fi rm. Consequently, in the new post-merger fi rm, there is expected to be merging of certain functions of the two pre-merger fi rms; these would include fi nance, payroll, and advertis-ing. These developments result in the same output being produced but with fewer inputs such as labor, equipment, building space, and materials/services. This results in a reduction in inputs, and thus costs, and an increase in multifactor productivity. Vertical mergers involve mergers of transportation fi rms that provide complementary services. The provision of complementary services within the same trucking company can increase effi ciency.

APOSTOLIDES 31
The structure of the trucking industry changed considerably over the period of analysis—follow-ing deregulation at the interstate level in 1980, and at the intrastate level in 1995. The latter com-pleted deregulation in the trucking industry and made it comprehensive. The Motor Carrier Act of 1980 did not affect restrictions on intrastate com-merce; and as time passed, the cost of shipping across state borders widened signifi cantly from the cost of shipping within state borders. In 1994, 41 states still maintained some type of economic regulation over intrastate trucking, and intrastate rates were, on the average, 40 percent higher than rates for interstate freight delivery of the same distance.13 In 1995 the Interstate Commerce Com-mission Termination Act was passed and it lifted economic regulation from intrastate trucking.
Deregulation—interstate and intrastate—of the trucking industry resulted in signifi cant changes. There was a notable amount of entry in, as well as exit from, trucking. The entry side included the appearance of new truckload (TL) fi rms, the expansion of less-than-truckload (LTL) fi rms into new markets, and the emergence of third parties such as brokers. Truckload carriers were no longer restricted to predetermined routes and commodi-ties; some of them merged and consolidated with others to provide national coverage.
The change in truck transportation from in-terstate deregulation, and which apparently con-tinued after the intrastate deregulation in 1995, resulted in a decrease in the relative importance of less-than-truckload trucking and a corresponding increase in the relative importance of truckload trucking. Data on shipments, in Appendix L, show that in 1989 and early 1990s, the LTL segment of the trucking industry accounted for 39% of total shipments (LTL and TL). In 1998 and subsequent years up to 2003, the relative importance of the LTL segment decreased to 29% of total industry shipments.
While few carriers specializing solely in LTL trucking were formed since 1980, there was signif-
13 Federal Highway Administration. “Regulation: From Economic Deregulation to Safety Reregulation,” p. 5.
icant geographic expansion by existing LTL fi rms into each other’s territories, and entry by other carriers, including carriers from other modes (e.g. rail). These new entrants included newly formed subsidiaries of existing LTL fi rms, and the ex-panded operations of truckload, small package, package express, and air cargo carriers.14
A comparison of the status of the 100 largest motor carriers (of property) between 1979 and 1991 shows that15 : 1) Forty-nine carriers were operating, 37 of which were still among the 100 largest; and 2) Fifty carriers had ceased operations since 1979. At least 35 of these carriers were iden-tifi ed as having fi led for bankruptcy.
Structural changes in the trucking industry in-cluded trucking companies diversifying out of the traditional LTL market. For example, Roadway Services, Inc. was an LTL fi rm, and it created a subsidiary (Roberts Transportation Services) that performed almost no standard LTL business. The subsidiary was in the business of handling rush shipments, of rather high value. Much of its rev-enues came from shipments that were smaller than 10,000 lbs. (i.e., technically LTL), but these ship-ments were not routed through traditional LTL sort terminals. Rather, most of these shipments were picked up within 90 minutes of a customer request and were dispatched directly to their des-tination.16
During the period of analysis, the LTL segment experienced signifi cant decreases in the number of fi rms, accompanied by an increase in the size of the average fi rm. In 1975, this segment consisted of about 528 fi rms (generating $10.6 billion in revenues). By 1989, the segment had shrunk to 159 fi rms which had $13.4 billion in revenues; and by the end of 1993, there were only 108 fi rms, generating $16.7 billion in revenues.17 These data indicate that over the period 1976-1993, there was a substantial change in the structure of the LTL segment of the industry and, thus, in the en-tire trucking industry.
14 Interstate Commerce Commission, 1992, p. 38.15 Ibid., p. 52.16 Ibid., pp. 89-91.17 Feitler, Corsi, and Grimm, 1998, p. 5.
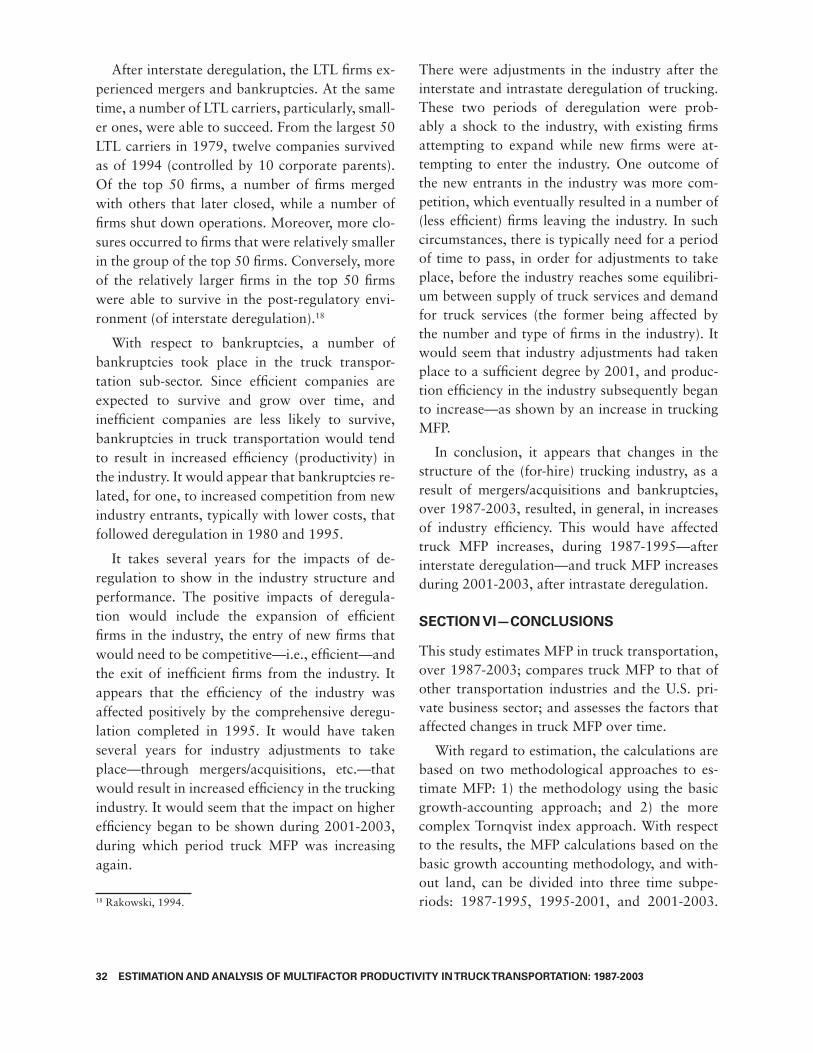
32 ESTIMATION AND ANALYSIS OF MULTIFACTOR PRODUCTIVITY IN TRUCK TRANSPORTATION: 1987-2003
After interstate deregulation, the LTL fi rms ex-perienced mergers and bankruptcies. At the same time, a number of LTL carriers, particularly, small-er ones, were able to succeed. From the largest 50 LTL carriers in 1979, twelve companies survived as of 1994 (controlled by 10 corporate parents). Of the top 50 fi rms, a number of fi rms merged with others that later closed, while a number of fi rms shut down operations. Moreover, more clo-sures occurred to fi rms that were relatively smaller in the group of the top 50 fi rms. Conversely, more of the relatively larger fi rms in the top 50 fi rms were able to survive in the post-regulatory envi-ronment (of interstate deregulation).18
With respect to bankruptcies, a number of bankruptcies took place in the truck transpor-tation sub-sector. Since effi cient companies are expected to survive and grow over time, and ineffi cient companies are less likely to survive, bankruptcies in truck transportation would tend to result in increased effi ciency (productivity) in the industry. It would appear that bankruptcies re-lated, for one, to increased competition from new industry entrants, typically with lower costs, that followed deregulation in 1980 and 1995.
It takes several years for the impacts of de-regulation to show in the industry structure and performance. The positive impacts of deregula-tion would include the expansion of effi cient fi rms in the industry, the entry of new fi rms that would need to be competitive—i.e., effi cient—and the exit of ineffi cient fi rms from the industry. It appears that the effi ciency of the industry was affected positively by the comprehensive deregu-lation completed in 1995. It would have taken several years for industry adjustments to take place—through mergers/acquisitions, etc.—that would result in increased effi ciency in the trucking industry. It would seem that the impact on higher effi ciency began to be shown during 2001-2003, during which period truck MFP was increasing again.
18 Rakowski, 1994.
There were adjustments in the industry after the interstate and intrastate deregulation of trucking. These two periods of deregulation were prob-ably a shock to the industry, with existing fi rms attempting to expand while new fi rms were at-tempting to enter the industry. One outcome of the new entrants in the industry was more com-petition, which eventually resulted in a number of (less effi cient) fi rms leaving the industry. In such circumstances, there is typically need for a period of time to pass, in order for adjustments to take place, before the industry reaches some equilibri-um between supply of truck services and demand for truck services (the former being affected by the number and type of fi rms in the industry). It would seem that industry adjustments had taken place to a suffi cient degree by 2001, and produc-tion effi ciency in the industry subsequently began to increase—as shown by an increase in trucking MFP.
In conclusion, it appears that changes in the structure of the (for-hire) trucking industry, as a result of mergers/acquisitions and bankruptcies, over 1987-2003, resulted, in general, in increases of industry effi ciency. This would have affected truck MFP increases, during 1987-1995—after interstate deregulation—and truck MFP increases during 2001-2003, after intrastate deregulation.
SECTION VI—CONCLUSIONS
This study estimates MFP in truck transportation, over 1987-2003; compares truck MFP to that of other transportation industries and the U.S. pri-vate business sector; and assesses the factors that affected changes in truck MFP over time.
With regard to estimation, the calculations are based on two methodological approaches to es-timate MFP: 1) the methodology using the basic growth-accounting approach; and 2) the more complex Tornqvist index approach. With respect to the results, the MFP calculations based on the basic growth accounting methodology, and with-out land, can be divided into three time subpe-riods: 1987-1995, 1995-2001, and 2001-2003.

APOSTOLIDES 33
During the fi rst subperiod (1987-1995), truck MFP increased; during the second subperiod, truck MFP decreased; and during the third subperiod, (2001-2003), truck MFP again increased. With respect to MFP calculations using the Tornqvist methodology, and without land, the MFP growth numbers are very similar to, and the trend is the same as, those of the basic growth accounting methodology. That implies that either method can be used to provide appropriate estimates of MFP.
When MFP calculations use the Tornqvist in-dex and include a measurement for the land in-put (similar to the method of BLS), the results of truck MFP are very similar to those noted above (obtained by either the basic growth-accounting methodology or the Tornqvist index). However, the measurement of land was not direct; it was related to changes of the stock of structures. In fu-ture work of BTS, land will be measured by other methods.
According to the MFP results, truck MFP in-creased at an annual rate of 0.8% over the whole period of analysis. With regard to the subperiods, truck MFP increased at an annual rate of 2.0% during 1987-1995; it decreased at –0.8% annually during 1995-2001; and it increased again during the most recent 2001-2003 period, at 1.1% per annum.
With regard to MFP comparisons, MFP in trucking is compared with that of the U.S. private business sector and the air transportation and train transportation subsectors. All series cover the period 1987 to 1999; so, MFP growth rates can be compared over that period. During that pe-riod, truck MFP and air MFP increased at similar annual rates each, of 1.2% and 1.3% respectively, while rail MFP increased at the highest annual rate of 3.3%. All three transportation industries experienced growth rates of MFP that were higher than those of the U.S. business sector of 0.9% per annum.
In addition, during 1987-1995, truck MFP in-creased at a faster rate, of 2.0% per annum, than air MFP, which grew at 1.2% annually. During
this time period, truck MFP also grew at a sub-stantially higher rate than that of the U.S. econ-omy (of 0.6%). Also, truck MFP reached higher levels than air MFP for most years of the period of analysis. In 1999, however, this situation was reversed and maintained until 2001.
Truck MFP was at a higher level than that of the U.S. business sector for virtually every year over the period of 1987-2002. Consequently, over this time period, truck MFP contributed positively to increases in multifactor productivity of the U.S. economy. Only during 2001 and 2002 did the level of truck MFP fall slightly below that of the U.S. business sector.
With regard to factors affecting truck MFP, the analysis of truck MFP was also segmented into three periods: 1987-1995, 1995-2001, and 2001-2003. During the fi rst period—1987 to 1995—truck MFP increased; during the second period—1995 to 2001—truck MFP decreased; and during the third period—2002 to 2003—truck MFP increased again.
Table 14 presents the various factors which affected truck MFP and indicates the directional impact of these factors on truck MFP, by a plus (+) or minus (-) sign. For example, a plus sign would mean that the factor impacts MFP in a positive way during that period, whereas, a minus sign impacts the MFP in a negative way.
The increase in truck MFP during 1987-1995 would seem to have been affected by the fol-lowing factors: 1) The relatively high increase in capital per worker, including a rapid increase in the use of computers and computer software; this would have contributed to improvements in the quality of capital; 2) An improvement in the fuel effi ciency of truck engines that was a result of im-provement in the quality of capital; 3) An increase in the average length of haul; 4) An increasing use of containers in truck transportation; and 5) The positive impacts on industry effi ciency as a result of interstate deregulation in 1980, including the increase in the TL segment of the industry.

34 ESTIMATION AND ANALYSIS OF MULTIFACTOR PRODUCTIVITY IN TRUCK TRANSPORTATION: 1987-2003
In the second subperiod, 1995-2001, there was a decrease in truck MFP. This would seem to have been affected by the following factors: 1) The de-clining effi ciency of utilizing intermediate inputs; 2) A lower growth rate of capital per worker; 3) A lower growth rate of utilizing containers; 4) The decrease in industry output in 2001, as a result of the economic recession that year, and the cata-strophic events of 9/11/2001; 5) State deregulation of trucking in 1995; this was followed by a period of adjustment and uncertainty, which appear to have had a negative impact on truck MFP.
The increasing MFP during the last subperiod (2001-2003) seems to have been affected by the following factors: 1) Increased use of computers; 2) Increases in the effi ciency of using intermediate
inputs; 3) Increases in the use of containers; and 4) The adjustment of the industry following intra-state deregulation in 1995, which completed and made comprehensive the deregulation of truck transportation.
With regard to the contribution of trucking to the economy’s multifactor productivity, data show that over 1978-2000, truck MFP increased at a higher annual rate than the U.S. business sector. Consequently, during this period of time, truck-ing MFP contributed positively and signifi cantly to economy MFP increases. Productivity increases in the U.S. economy over time have contributed signifi cantly to economic growth and to improve-ments in the standard of living in the country.
TABLE 14 Factors Affecting Truck MFP in Three Time Periods (Directional Impacts)
Time period1987-1995 1995-2001 2001-2003
MFP movement + _ +
Factors affecting MFP
1. Increase in capital per worker; improved quality of capital. + _ 0
2. Increased use of: a. computers + + + b. software + + _
3. Effi ciency of using intermediate inputs. _ _ +
4. Improved fuel effi ciency. a. Single-unit trucks + + _ b. Combinaton trucks + _ _
5. Average length of haul. + + NA
6. Containerization + _ +
7. Interstate deregulation + + +
8. Intrastate deregulation _ +
9. Mergers/acquisitions +
10. Recesssion\9-11-2001 _
SOURCE: The information is obtained from the analysis presented in the paper

APOSTOLIDES 35
REFERENCES
Apostolides, Anthony D. “Impacts of Productivity Changes in
Air Transportation on Profi ts, Prices, and Labor Compensa-
tion: 1990-2001”, Journal of Transportation and Statistics,
Volume 9, Number 1, 2006.
Brooks, Mary, R. and Pamela Ritchie. “Trucking Mergers and
Acquisitions in Canada and the U.S. Since NAFTA”, Trans-
portation Journal, Summer 2005.
Denison, E. F. Accounting for United States Economic Growth
1929-1969. Washington, D.C.: The Brookings Institution,
1974.
Denison, E. F., assisted by J. P. Poullier. Why Growth Rates
Differ. Washington, D.C.: The Brookings Institution, 1967.
Dolan, Edwin G. Basic Economics, Third Edition; New York:
The Dryden Press, 1983, p. 21.
Duke, J., D. Litz, and L. Usher. “Multifactor Productivity in
Railroad Transportation.” Monthly Labor Review, 1992, pp.
49-58.
Engel, Cynthia. “Competition drives the trucking industry”,
Monthly Labor Review, April 1998.
Federal Highway Administration (FHWA). “Regulation:
From Economic Deregulation to Safety Reregulation”, on the
internet: http://www.ops.fhwa.dot.gov/freight/theme_papers/
Final_Thm8_v4.htm
Feitler, J.N., T.M. Corsi, and C.M. Grimm. “Strategic Per-
formance Changes Among LTL Motor Carriers: 1976-1993”.
Transportation Journal, Summer 1998.
Fraumeni, Barbara. PRODUCTIVE CAPITAL STOCK
MEASURES. Battelle Memorial Institute—for the Federal
Highway Administration, U.S. Department of Transporta-
tion, 1999.
Interstate Commerce Commission. Offi ce of Economics.
“The U.S. Motor Carrier Industry Long After Deregulation.”
March 1992.
Katz, A. J., M. Glenn, and S. W. Herman. “Fixed Reproduc-
ible Tangible Wealth In The United States, 1925-94.” Bureau
of Economic Analysis, U.S. Department of Commerce, 1999,
www.bea.doc.gov/bea/anl.htm.
Katz, A. J., and S. H. Herman. “Improved Estimates of Fixed
Reproducible Tangible Wealth, 1929-95.” Survey of Current
Business. 1997.
Kendrick, J. W., (assisted by M R. Pech). Postwar Productivity
Trends in the United States, 1948-1969. New York: Columbia
University Press, 1973.
Kendrick, J. W., (assisted by M R. Pech). Productivity Trends
in the United States. New Jersey: Princeton University Press,
1961.
Lahiri, K., H. Stekler, W. Yao, and P. Young. “Monthly Out-
put Index for the U.S. Transportation Sector”, Journal of
Transportation and Statistics, January 2004.
Manvel, A. D. “Trends in the Value of Real Estate and Land,
1956-66.” Three Land Research Studies. National Commis-
sion on Urban Problems. Research Report No. 12. Washing-
ton D.C.: U.S. GPO, 1968.
Meyer, John R. and Jose A. Gomez-Ibanez. “Measurement
and Analysis of Productivity in Transportation Industries.” In
New Developments in Productivity Measurement and Analy-
sis, Vol. 44, NBER Studies in Income and Wealth, Edited by
John W. Kendrick and Beatrice N. Vaccara, 295-332. Univer-
sity of Chicago Press, 1980.
National Science Foundation. Chapter 9: “Signifi cance of
Information Technologies”—IT and the Economy. On the
NSF internet site: http://www.nsf.gov/sbe/srs
Offi ce of Management and Budget (1997), North American
Industry Classifi cation System, United States, 1997.
Rakowski, James P. “The Continuing Structural Transforma-
tion of the U.S. Less-Than-Truckload Motor Carrier Indus-
try”, Transportation Journal, Fall 1994.
Triplett, Jack E. and Barry P. Bosworth (2004). “Chapter
3. Output and Productivity in the Transportation Sector.”
In Productivity in the U.S. Services Sector—New Sources of
Economic Growth. Washington, D.C.: Brookings Institution
Press.
U.S. Bureau of the Census. 1997 Economic Census, Table
11.
U.S. Bureau of the Census, Defi nitions of Construction, www.
census.gov/constructionspending.
U.S. Department of Commerce, Bureau of Economic Analy-
sis (2003), Fixed Assets and Consumer Durable Goods in
the United States, 1925-97, at http://www.bea.gov/bea/dn/
Fixed_Assets_1925_97.pdf, as of June 15, 2005.
U.S. Department of Labor, Bureau of Labor Statistics, Hand-
book of Labor Statistics, Chapters 10 and 11: “Industry

36 ESTIMATION AND ANALYSIS OF MULTIFACTOR PRODUCTIVITY IN TRUCK TRANSPORTATION: 1987-2003
Productivity Measures”. Bureau of Labor Statistics (1997),
BLS Handbook of Methods, Chapters 10 and 11, available
at http://www.bls.gov/opub/hom/home.htm as of June 15,
2005.
U.S. Department of Labor, Bureau of Labor Statistics, Trends
in Multifactor Productivity, (Bulletin 2178). U.S. Government
Printing Offi ce, Washington, D.C. September 1983.
U.S. Department of Labor, Bureau of Labor Statistics, Career
Guide to Industries, 2004-05 Edition, “Truck Transportation
and Warehousing”; on the BLS internet site: http://stats.bls.
gov/oco/cg/cgs021.htm).
U.S. Department of Labor, BLS, “Revisions to Capital Inputs
for the BLS Multifactor Productivity Measures”; on the BLS
internet site: http://www.bls.gov/web/mprcaptl.htm.
U.S. Department of Transportation, Bureau of Transportation
Statistics, National Transportation Statistics, Washington,
D.C., various years.
U.S. Department of Transportation, Bureau of Transporta-
tion Statistics, Transportation Statistics Annual Report 1997.
Washington, D.C.
U.S. Department of Transportation, Bureau of Transporta-
tion. Freight Shipments in America, Preliminary Highlights
from the 2002 Commodity Flow Survey.
U.S. General Accounting Offi ce. Trucking Regulation—Price
Competition and Market Structure in the Trucking Industry.
February 1987, GAO/RCED-87-16.
Wikipedia, the free encyclopedia—Containerization. Found
on the internet: http://en.wikipedia.org/wiki/Containeriza-
tion.
Yuskavage, Robert E. “Issues in the Measurement of Trans-
portation Output: The Perspective of the BEA Industry
Accounts.” Paper presented at the May 4, 2001 Brookings
Workshop on Transportation Output and Productivity; Wash-
ington, D.C., 2001.
Yuskavage, Robert E. “Improved Estimates of Gross Product by Industry, 1959-94.” Survey of Current Business, 1996.

APOSTOLIDES 37
APPENDIX A. BASIC GROWTH-ACCOUNTING METHODOLOGY
The empirical relationship used to estimate growth of multifactor productivity by the basic growth-accounting methodology is shown below:
ΔT = ΔQ – [(α∗ ΔLabor) + (β∗ ΔCapital) + ( γ ∗ ΔIntermediate Inputs )] T Q Labor Capital Intermediate Inputs
Where:
ΔT = Growth of MFP T
ΔQ = Growth of gross output Q
ΔLabor = Growth of labor Labor
ΔCapital = Growth of capital Capital
ΔIntermediate Inputs = Growth of intermediate inputs Intermediate Inputs
α = Share of labor cost in output
β = Share of capital cost in output
γ = Share of intermediate inputs cost in output.

38 ESTIMATION AND ANALYSIS OF MULTIFACTOR PRODUCTIVITY IN TRUCK TRANSPORTATION: 1987-2003
APPENDIX B. METHODOLOGY WITH THE TORNQVIST INDEX
Multifactor productivity is the ratio of the output index to a weighted average of input indexes. A Tornqvist formula expresses the change in multifactor productivity as the difference between the rate of change in output and the weighted average of the rates of change in various inputs.
Let
Ln = the natural logarithm of a variable
A = multifactor productivity
Q = output
I = combined input
K = capital input
L = labor input
M = intermediate input
Wk = the average share of capital cost in total cost in two adjacent periods
Wl = the average share of labor cost in total cost in two adjacent periods
Wm = the average share of intermediate input cost in total cost in two adjacent periods,
The change in the multifactor productivity is then:
(1)
Or
(2)
A multifactor productivity index can be further developed by calculating the antilog of ΔLnA, chain-ing up the resulting annual rates of change, and expressing the resulting series as a percentage of a selected base year. Equivalently, the change in the multifactor productivity can be directly expressed as At/At-1 = (Qt/Qt-1) / (It/It-1). Again, At/At-1 can be chained over time and converted into an index number.
All variables, except for cost shares, are in the form of a constant dollar quantity index. The output quantity index is usually derived by defl ating the industry output in current dollars by an appropriate price index when the industry output is a single measure. When an industry produces multiple products and the output measure of each individual product is available, such individual outputs may be defl ated separately by more detailed price indexes. In that case, the total output quantity index can be derived through a Tornqvist aggregation such as:
(3) ,
where iQ is the output of the ith product, and
iw is the average share of the ith product in the total output.
∆LnA= Ln( )= Ln( )- [Wk(Ln )+Wl(Ln )+Wm(Ln )]At
At-1 Qt-1
Qt Kt
Kt-1
Lt
Lt-1
Mt
Mt-1
∆LnA= Ln( )= Ln( )- Ln( )At
At-1 Qt-1
Qt It
It-1
∑ Δnii LnQw
1

APOSTOLIDES 39
APPENDIX C DATA ON GROSS OUPUT AND INTERMEDIATE INPUTS FOR TRUCK
TRANSPORTATION, FROM THE GDP BY-INDUSTRY ACCOUNTS AND THE INPUT - OUTPUT
ACCOUNTS.
GDP BY INDUSTRY ACCOUNTS
Year Gross output ($ millions) Intermediate inputs ($ millions)
1998 $184,085 $97,889
1999 $198,687 $108,849
2000 $213,173 $120,352
2001 $205,674 $112,359
2002 $205,587 $109,936
2003 $204,278 $105,917
INPUT-OUTPUT ACCOUNTS
YearGross output ($ millions) -
producers’ pricesIntermediate inputs ($ millions) -
producers’ prices
1998 $184,085 $97,889
1999 $198,687 $108,849
2000 $213,173 $120,352
2001 $205,674 $112,359
2002 $205,587 $109,936
2003 $204,278 $105,917
NOTE: The number for I-O gross output, for 2002, came from the annual I-O data.
SOURCES: BEA websites. For GDP-by-Industry data: http://www.bea.gov/industry/gdpbyind_data.htm. For Input-Output data: http://www.bea.gov/industry/io_annual.htm.
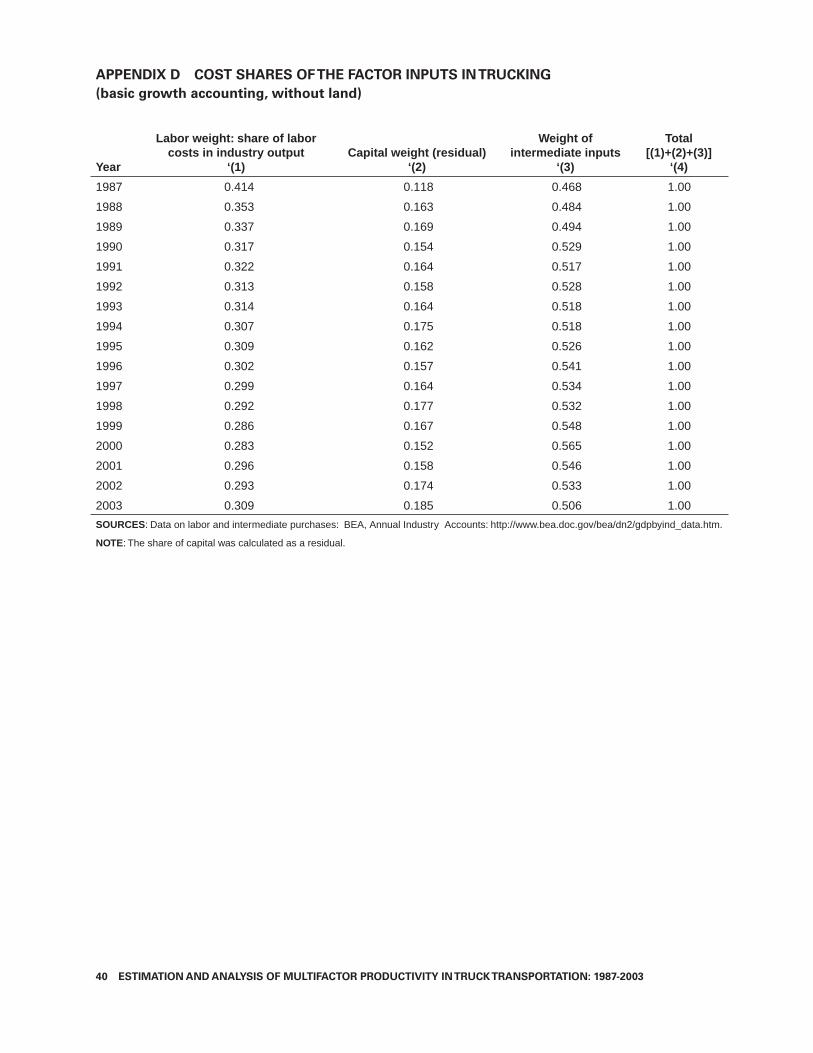
40 ESTIMATION AND ANALYSIS OF MULTIFACTOR PRODUCTIVITY IN TRUCK TRANSPORTATION: 1987-2003
APPENDIX D COST SHARES OF THE FACTOR INPUTS IN TRUCKING
(basic growth accounting, without land)
Year
Labor weight: share of labor costs in industry output
‘(1)Capital weight (residual)
‘(2)
Weight of intermediate inputs
‘(3)
Total [(1)+(2)+(3)]
‘(4)
1987 0.414 0.118 0.468 1.00
1988 0.353 0.163 0.484 1.00
1989 0.337 0.169 0.494 1.00
1990 0.317 0.154 0.529 1.00
1991 0.322 0.164 0.517 1.00
1992 0.313 0.158 0.528 1.00
1993 0.314 0.164 0.518 1.00
1994 0.307 0.175 0.518 1.00
1995 0.309 0.162 0.526 1.00
1996 0.302 0.157 0.541 1.00
1997 0.299 0.164 0.534 1.00
1998 0.292 0.177 0.532 1.00
1999 0.286 0.167 0.548 1.00
2000 0.283 0.152 0.565 1.00
2001 0.296 0.158 0.546 1.00
2002 0.293 0.174 0.533 1.00
2003 0.309 0.185 0.506 1.00
SOURCES: Data on labor and intermediate purchases: BEA, Annual Industry Accounts: http://www.bea.doc.gov/bea/dn2/gdpbyind_data.htm.
NOTE: The share of capital was calculated as a residual.

APOSTOLIDES 41
Ap
pe
nd
ix E
B
EA
LA
BO
R D
ATA
FO
R T
RU
CK
TR
AN
SP
OR
TA
TIO
N—
NA
ICS
AN
D S
IC
(in
clu
din
g s
elf
-em
plo
yed
tru
ckers
)
Ext
rap
ola
tin
g N
AIC
S d
ata
fro
m S
IC d
ata
NA
ICS
(B
EA
inte
rnet
sit
e)S
IC (
87)
(B
EA
inte
rnet
sit
e)
Year
Per
son
s en
gag
ed in
p
rod
uct
ion
(t
ho
usa
nd
s)‘(
1)
Fu
ll-ti
me
equ
ival
ent
emp
loye
es
(th
ou
san
ds)
‘(2)
Co
mp
ensa
tio
n
of
FT
E
emp
loye
es
($ m
illio
ns)
‘(3)
Co
mp
ensa
tio
n o
f F
TE
em
plo
yees
($
bill
ion
s)‘(
4)
Per
son
s en
gag
ed in
p
rod
uct
ion
(th
ou
san
ds)
‘(5)
Fu
ll-ti
me
equ
ival
ents
(t
ho
usa
nd
s)‘(
6)
Lab
or
com
pen
a-ti
on
, FT
Es
($ m
illio
ns)
‘(7)
Per
son
s en
gag
ed in
p
rod
uct
ion
(t
ho
usa
nd
s)
(NA
ICS
)‘(
8)
Fu
ll-ti
me
equ
ival
ent
emp
loye
es
(th
ou
san
ds)
(N
AIC
S)
‘(9)
Co
mp
ensa
tio
n
of
FT
E
emp
loye
es
($ m
illio
ns)
(N
AIC
S)
‘(10
)
Co
mp
ensa
tio
n
of
FT
E
emp
loye
es
($ b
illio
ns)
(N
AIC
S)
‘(11
)
Co
mp
ensa
tio
n
of
FT
E
emp
loye
es
($ t
ho
usa
nd
s)
(NA
ICS
)‘(
12)
Co
mp
ensa
ton
per
FT
E
emp
loye
e (N
AIC
S)
‘(13
)
1987
1,67
11,
426
$42
,806
1,
282
1,07
7 $
34,1
46
$34
.1
$34
,145
,674
$
31,6
91
1988
1,54
41,
308
$41
,138
1,
184
988
$32
,815
$
32.8
$
32,8
15,1
37
$33
,204
1989
1,54
61,
335
$42
,699
1,
186
1,00
9 $
34,0
60
$34
.1
$34
,060
,322
$
33,7
67
1990
1,49
81,
311
$44
,302
1,
149
991
$35
,339
$
35.3
$
35,3
39,0
10
$35
,676
1991
1,50
31,
296
$45
,203
1,
153
979
$36
,058
$
36.1
$
36,0
57,7
23
$36
,823
1992
1,52
31,
298
$47
,572
1,
168
981
$37
,947
$
37.9
$
37,9
47,4
38
$38
,693
1993
1,60
01,
371
$50
,368
1,
227
1,03
6 $
40,1
78
$40
.2
$40
,177
,763
$
38,7
86
1994
1,70
51,
448
$54
,608
1,
308
1,09
4 $
43,5
60
$43
.6
$43
,559
,944
$
39,8
15
1995
1,76
61,
505
$57
,376
1,
355
1,13
7 $
45,7
68
$45
.8
$45
,767
,934
$
40,2
49
1996
1,84
41,
542
$59
,348
1,
415
1,16
5 $
47,3
41
$47
.3
$47
,340
,968
$
40,6
33
1997
1,86
91,
586
$62
,963
1,
434
1,19
8 $
50,2
25
$50
.2
$50
,224
,597
$
41,9
12
1998
1,49
1 1
,247
$
53,6
63
$53
.7
1,94
41,
650
$67
,221
1,
491
1,24
7 $
53,6
21
$53
,621
,136
$
43,0
11
1999
1,53
6 1
,296
$
56,7
80
$56
.8
2,00
91,
715
$71
,687
1,
541
1,29
6 $
57,1
84
$57
,183
,594
$
44,1
30
2000
1,56
5 1
,323
$
60,2
81
$60
.3
2,04
01,
751
$75
,570
1,
565
1,32
3 $
60,2
81
$60
,281
,003
$
45,5
64
2001
1,57
2 1
,341
$
60,8
67
$60
.9
2002
1,54
6 1
,297
$
59,8
66
$59
.9
2003
1,51
7 1
,283
$
60,7
89
$60
.8
SO
UR
CE
S: L
abor
dat
a un
der
NA
ICS
wer
e ob
tain
ed fr
om ta
ble
6.5D
at t
he B
EA
inte
rnet
site
: http
://w
ww
.bea
.gov
/bea
/dn/
nipa
web
/Tab
leV
iew
.asp
?Sel
ecte
dTab
le=
186&
Firs
tYea
r=20
02&
last
yea
r=20
03&
Freq
=Ye
ar
Labo
r da
ta u
nder
SIC
(19
87)
wer
e ob
tain
ed fr
om ta
ble
6.5C
(fu
ll-tim
e eq
uiva
lent
em
ploy
ees)
at t
he B
EA
inte
rnet
site
: http
://w
ww
.bea
.gov
/bea
/dn/
nipa
web
/Tab
leV
iew
asp?
Sel
ecte
dTab
le=
185&
Firs
tYea
r=19
99&
last
ye
ar=
2000
&Fr
eq=
Year
NO
TE
: Dat
a re
fl ect
the
recl
assi
fi cat
ion
of a
ir co
urie
rs, f
rom
truc
king
and
war
ehou
sing
to tr
ansp
orta
tion
by a
ir.

42 ESTIMATION AND ANALYSIS OF MULTIFACTOR PRODUCTIVITY IN TRUCK TRANSPORTATION: 1987-2003
APPENDIX F GROWTH OF TRUCKING MFP, ESTIMATED BY THE TWO METHODS
(without land)
Percentage Rate of Change
YearBasic growth accounting methodology
‘(1)Tornqvist methodology
‘(2)Difference [(1)-(2)]
‘(3)
1988 7.7 8.6 (0.9)
1989 1.0 1.0 (0.0)
1990 0.6 1.0 (0.4)
1991 4.1 4.2 (0.1)
1992 3.8 3.9 (0.1)
1993 0.7 0.7 0.0
1994 0.6 0.5 0.1
1995 (2.3) -2.2 (0.1)
1996 0.2 0.2 (0.0)
1997 (0.2) -0.2 (0.0)
1998 (0.4) -0.4 (0.1)
1999 (1.3) -1.2 (0.2)
2000 (0.6) -0.5 (0.0)
2001 (2.5) -2.4 (0.0)
2002 1.4 1.4 (0.0)
2003 0.4 0.7 (0.3)
NOTES AND SOURCES: The MFP numbers in column 1 are from Table 2, and are based on the basic growth-accounting methodology, without land. The MFP estimates in column 2 are from Table 3, and are based on the Tornqvist methodology, without land.

APOSTOLIDES 43
APPENDIX G CAPITAL INPUT INDEX
Indexes (2000=100) Cost shares (%)
Year
Structures and equipment index
‘(1)Land index
‘(2)
Structures and equipment cost share
‘(3)
Land cost share
‘(4)
Combined capital input index
‘(5)
1987 65.31 33.36 0.974 0.026 63.64
1988 67.34 34.10 0.975 0.025 65.61
1989 67.80 35.28 0.973 0.027 66.09
1990 65.19 37.10 0.971 0.029 63.72
1991 62.69 39.57 0.968 0.032 61.46
1992 59.84 41.84 0.965 0.035 58.87
1993 61.51 43.60 0.965 0.035 60.54
1994 69.66 47.33 0.966 0.034 68.46
1995 78.75 54.78 0.966 0.034 77.46
1996 82.45 60.22 0.963 0.037 81.24
1997 90.11 70.02 0.958 0.042 89.00
1998 94.58 80.72 0.953 0.047 93.80
1999 97.67 90.68 0.948 0.052 97.28
2000 100.00 100.00 0.942 0.058 100.00
2001 97.84 106.69 0.934 0.066 98.36
2002 95.18 109.54 0.930 0.070 96.04
2003 93.63 111.68 0.927 0.073 94.72
SOURCES: Calculations are by consultant. For data on structures and equipment: BEA Fixed Asets Accounts at: http://www.bea.gov/bea/dn/FA2004/Detail/Index.html. Other data were calculated by BTS (consultants); the calcuations are described in the text - section “Calcula-tions with the Tornqvist Index” and “MFP Calculations with Land”.
NOTE: Column 5 is the result of combining the indexes for Structures/Equipment and Land (columns 1 and 2) by using their cost shares (columns 3 and 4), through a Tornqvist aggregation.

44 ESTIMATION AND ANALYSIS OF MULTIFACTOR PRODUCTIVITY IN TRUCK TRANSPORTATION: 1987-2003
APPENDIX H – ESTIMATION OF LAND COST
With the assumptions provided in the text, the estimation of the land cost is as follows:
1) Calculate ratio (a) by using data for Structures value, divided by Structures & Equipment value (BEA data).
2) Calculate ratio (b) (Structures cost/Structures + Equipment cost) by assuming that it is equiva-lent to ratio (a). Structures & Equipment cost is the gross operating surplus of the industry.
3) Calculate ratio (c) by using the ratio of Land value/Structures value (Manvel study, 1966) and data for Structures value (BEA). Non-availability of structures (value) data (from BEA) for the earlier years of analysis led to the extrapolation of NAICS structures stock (value) data by using SIC structures stock (value) data.
This calculation provides Land value for a specifi c year.
4) For ratio (d), use the cost of structures net of depreciation. Land is not depreciated. By us-ing the estimate for structures cost and ratio (d), calculate Land cost. This number is used for the weight of land in the calculations.

APOSTOLIDES 45
APPENDIX I COST SHARES OF THE FACTOR INPUTS IN
TRUCKING (percentage)
YearIntermediate inputs
‘(1)Capital
‘(2)Labor
‘(3)
Total [(1)+(2)+(3)]
‘(4)
1987 0.474 0.188 0.339 1.000
1988 0.490 0.181 0.329 1.000
1989 0.499 0.183 0.317 1.000
1990 0.534 0.165 0.301 1.000
1991 0.522 0.174 0.304 1.000
1992 0.534 0.169 0.296 1.000
1993 0.524 0.179 0.297 1.000
1994 0.524 0.180 0.296 1.000
1995 0.532 0.170 0.298 1.000
1996 0.547 0.164 0.289 1.000
1997 0.540 0.172 0.288 1.000
1998 0.537 0.168 0.294 1.000
1999 0.553 0.158 0.289 1.000
2000 0.570 0.145 0.285 1.000
2001 0.552 0.149 0.299 1.000
2002 0.538 0.165 0.297 1.000
2003 0.512 0.176 0.312 1.000
SOURCES: Calculations are by consultants. The calculations are explained in the text, in section “Weights of Inputs”. Data for output, labor, and intermediate inputs were obtained from BEA Industry Accounts at: http://www.bea.gov/bea/dn2/gdpbyind_data.htm.Data for fi xed assets, from Fixed Asset Accounts at: http://www.bea.gov/bea/dn/FA2004/Details/Index.html.
NOTE: The weights of the three inputs indicate their relative share in total industry costs. They add up to 1.00 (total industry costs).
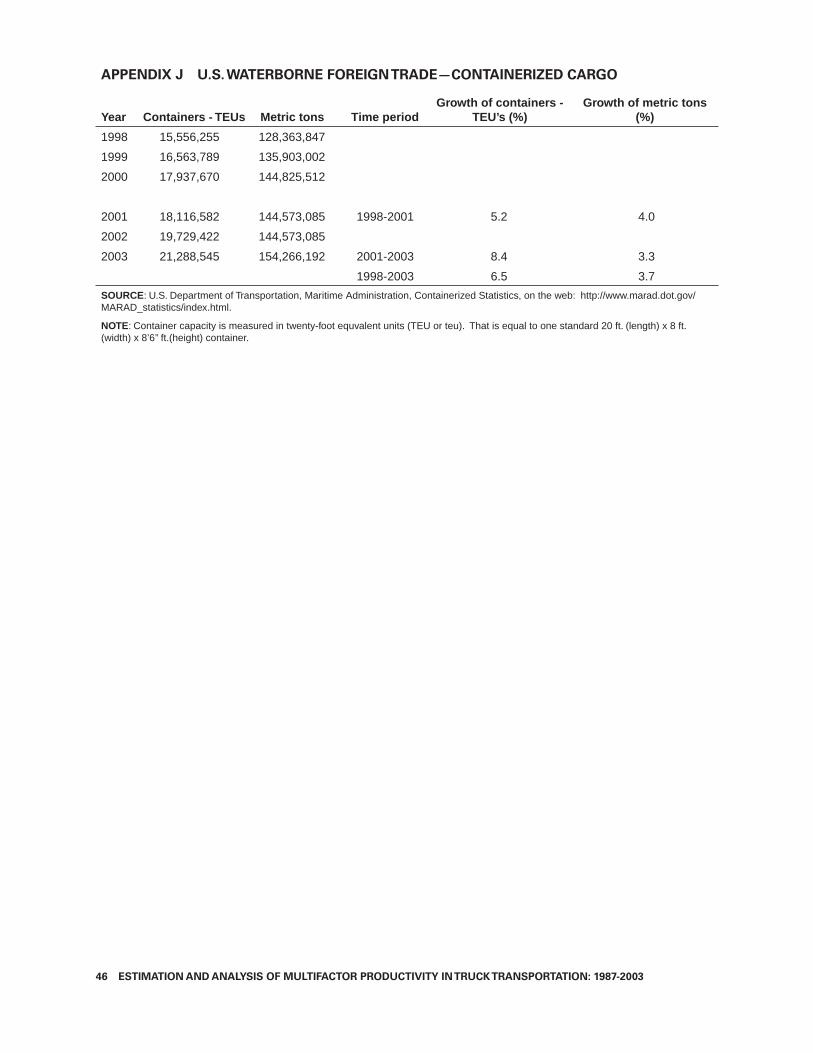
46 ESTIMATION AND ANALYSIS OF MULTIFACTOR PRODUCTIVITY IN TRUCK TRANSPORTATION: 1987-2003
APPENDIX J U.S. WATERBORNE FOREIGN TRADE—CONTAINERIZED CARGO
Year Containers - TEUs Metric tons Time periodGrowth of containers -
TEU’s (%)Growth of metric tons
(%)
1998 15,556,255 128,363,847
1999 16,563,789 135,903,002
2000 17,937,670 144,825,512
2001 18,116,582 144,573,085 1998-2001 5.2 4.0
2002 19,729,422 144,573,085
2003 21,288,545 154,266,192 2001-2003 8.4 3.3
1998-2003 6.5 3.7
SOURCE: U.S. Department of Transportation, Maritime Administration, Containerized Statistics, on the web: http://www.marad.dot.gov/MARAD_statistics/index.html.
NOTE: Container capacity is measured in twenty-foot equvalent units (TEU or teu). That is equal to one standard 20 ft. (length) x 8 ft. (width) x 8’6’’ ft.(height) container.
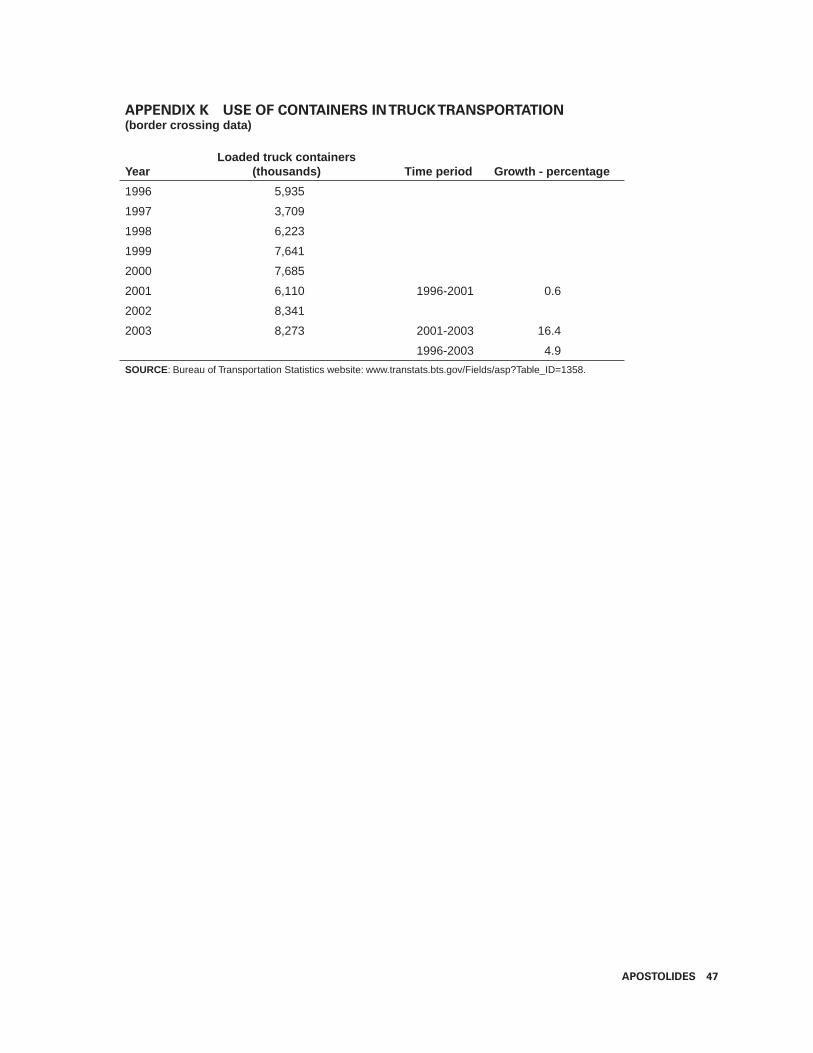
APOSTOLIDES 47
APPENDIX K USE OF CONTAINERS IN TRUCK TRANSPORTATION (border crossing data)
YearLoaded truck containers
(thousands) Time period Growth - percentage
1996 5,935
1997 3,709
1998 6,223
1999 7,641
2000 7,685
2001 6,110 1996-2001 0.6
2002 8,341
2003 8,273 2001-2003 16.4
1996-2003 4.9
SOURCE: Bureau of Transportation Statistics website: www.transtats.bts.gov/Fields/asp?Table_ID=1358.

48 ESTIMATION AND ANALYSIS OF MULTIFACTOR PRODUCTIVITY IN TRUCK TRANSPORTATION: 1987-2003
APPENDIX L SHIPMENTS BY TRUCKLOAD AND LESS-
THAN-TRUCKLOAD FIRMS(millions of dollars)
Year Less-than-truckload Truckload TotalLTL/total (percent)
1989 41,740 65,905 107,645 0.39
1990 45,710 71,412 117,122 0.39
1991 46,626 71,106 117,732 0.40
1992 49,119 77,930 127,049 0.39
1993 51,604 83,396 135,000 0.38
1998 40,298 99,424 139,722 0.29
1999 41,468 104,780 146,248 0.28
2000 44,318 110,086 154,404 0.29
2001 44,207 108,411 152,618 0.29
2002 45,117 108,757 153,874 0.29
2003 45,613 112,724 158,337 0.29
SOURCE: Data for 1989-1993, from U.S. Census Bureau, Transportation Annual Survey, 1998, Table 4, pl 11. Data for 1998-2003, from U.S. Census Bureau, website: http://www.census.gov/svsd/www/ services/sas/sas_data/48/sas48_rpt_2004/pdf