Career Planning Guide | NIACC
61
CAREER PLANNING GUIDE NORTH IOWA AREA C O M M U N I T Y COLLEGE
Transcript of Career Planning Guide | NIACC

CAREER PLANNING
GUIDE
NORTH IOWA AREA C O M M U N I T Y C O L L E G E

W E WA N T TO H E L P YO U S U C C E E D. Whether your goal is to transfer to a four-year university or get started on a career path right away, we’ll help you get there.
You are more than just a number at NIACC. Small class sizes, engaged faculty, low tuition rates, high career placement rates, and a culture of student success across the campus, ensure you’ll be supported every step of the way.
Spend some time on campus and we think you‘ll agree that NIACC should be your first choice.
Online. >> www.niacc.eduHead to our website; it is full of information on programs, transfer options, careers, scholarships, and financial aid that will give you a sense of what we will do for you at North Iowa Area Community College.
Visit Us. >> www.niacc.edu/visitVisiting the North Iowa Area Community College (NIACC) campus or center is more than just seeing-it is experiencing what the college has to offer. Come experience NIACC and see how we will help you succeed.
Explore! >> Explore is our premier visit experience and is held during the fall. This even gives high school students a chance to really experience our programs and our campus.
Hands on activities, demonstrations, and simulations, led by NIACC instructors and area employers, kick-off the day. You’ll have the opportunity to check out the campus, win great prizes, and enjoy lunch -- on us!
The visit is capped off by a FREE CONCERT by a popular band or artist. It’s a great way to see what NIACC has to offer and have some fun!
Busting Out Blue >> Busting Out Blue is a fun Saturday visit held in the spring in conjunction with NIACC Trojans basketball games. Students will arrive one hour prior to the women’s game to learn about NIACC and the academic programs available. In between games, students will tour housing to see how our new housing facility can provide the perfect place to stay on campus. After the men’s game, students are invited to an activity in the Auditorium sponsored by the NIACC Student Senate.
Each attendee will receive a free-shirt and have a chance to win great prizes like a TV, wireless headphones or a tablet.
Virtual Tour. >> niacc.college-tour.com
Apply. >> www.niacc.edu/applySubmitting your application is easy and free.

Transfer.............................................................................................02
Non-Traditional Careers .............................................................03
How to Use this Guide ................................................................04
Resources ........................................................................................05
Graduate Cluster to Industry Sector ......................................06
Employment Information ..........................................................07
Career Planning .............................................................................08
Agriculture, Food, and Natural Resources ...........................10
Architecture and Construction ................................................13
Arts, Audio/Video Technology, and Communications ....16
Business, Management, and Administration .....................19
Education and Training ..............................................................22
Table of ContentsFinance ............................................................................................. 25
Health Science ............................................................................... 28
Human Services ............................................................................ 31
Information Technology ............................................................ 34
Law, Public Safety, Corrections, and Security ..................... 37
Manufacturing ............................................................................... 40
Marketing, Sales, and Service .................................................. 43
Science, Technology, Engineering, and Mathematics ..... 46
Transportation, Distribution, and Logistics ......................... 49
Regional In-Demand Occupations ......................................... 52
County Information ..................................................................... 53
Notes ................................................................................................. 57

Your Success is Our #1 Priority You’ll find life on the NIACC campus engaging and fun with support around every corner. We are here to help you succeed. >> www.niacc.edu/student-life
Student Learning Center.A place for individual students or groups to study with resources close at hand. Students may drop in for help or make an appointment with an instructor or peer tutor for assistance in most subject areas. We will help you with study strategies, test taking tips, and note taking systems.
Counseling and Advising.NIACC students have access to many services, at no charge, including personal counseling, academic and transfer advising, student support services, disability services, vocational rehabilitation services, and screenings.
Career Counseling and Employment Center.Students receive free individual career counseling to help them identify their overall career direction and educational goals. We provide assistance completing applications, developing cover letters and resumes, interview preparation, and much more.
Job Postings.At NIACC, we help our graduating students, alumni and area residents connect with businesses who are searching for employees. We have an active list of current job openings that businesses have shared with us.
Life on Campus.Sporting events, musicals, bingo, magicians, and bowling are just a few of the events you can attend at NIACC. You’ll find fun and interesting activities everywhere you go.
Clubs and Organizations.More than 40 recreational, intellectual and social activities will make your college experience even more memorable. Join the club!
Campus View Student Housing Complex.Located on the North end of campus, our new student housing complex is surrounded by beautiful lakes complete with a shelter house and a recreational trail into town. The grounds also include basketball, sand volleyball, and tennis courts.
GOAL:
Attend a four-year College or University.
North Iowa Area Community College offers Associate of Arts and Associate of Science Degrees:
• Equivalent to the first two years of a bachelor’s degree.
• Designed to transfer to a four-year college or university where you can continue your education goals.
North Iowa Area Community College offers course options to match your career and educational interests including but not limited to agriculture, animal science, business administration, communication, criminal justice, early childhood, education, human services, industrial technology, teacher education, and psychology.
Your dedicated academic advisor will work closely with you to ensure the award transfers to the college or university of your choice.
LEARN MORE. www.niacc.edu/transfer
02

GENDER ON THE JOB Career exploration is serious business. As you survey different career options, you may feel discouraged from following certain paths because you are a female or because you are a male. Take note when this happens! Gender stereotypes are actually what contribute to the under-representation of women and men in many occupations. These stereotypes or biases often occur unconsciously. Your career planning process must be informed, thoughtful, and open-minded. Use the following tips to help you stay informed on your career journey: » Accept no limits. Your career choice is based on your interests and determination to develop skills. It should not be based on gender stereotypes. Value your dreams and aspirations. » You will possibly spend 50+ years working. Make an informed decision based on job opportunities and interests, and choose something you will enjoy. Learn the standards of performance and the skill set required for an occupation. Remember, you are not expected to have all the skills before you start working. That’s why North Iowa Area Community College is here! » Seek out mentors in non-traditional occupations and look for shadowing or volunteer opportunities in these areas. This will help you make informed decisions and develop a support system. If you need a hand with this, seek help from staff at your high school, Southeastern Community College, or your parents. » When both men and women work in the same industry, that industry becomes stronger and is more representative of our world as a whole. Both genders bring unique experiences, perspectives, and skill sets to an occupation.
» It takes courage to stand up and break tradition; but it’s your life and you are in charge.
*Non-traditional careers are occupations in which one gender comprises less than 25 percent of all individuals employed in that field.
Sample Non-Traditional Careers for Women Architect Carpenter Electrician Mechanic Engineer Welder
Sample Non-Traditional Careers for Men Health Information Technology Nurse Elementary Teacher Cosmetologist Administrative Assistant Veterinary Technician
Non-Traditional Careers*
03
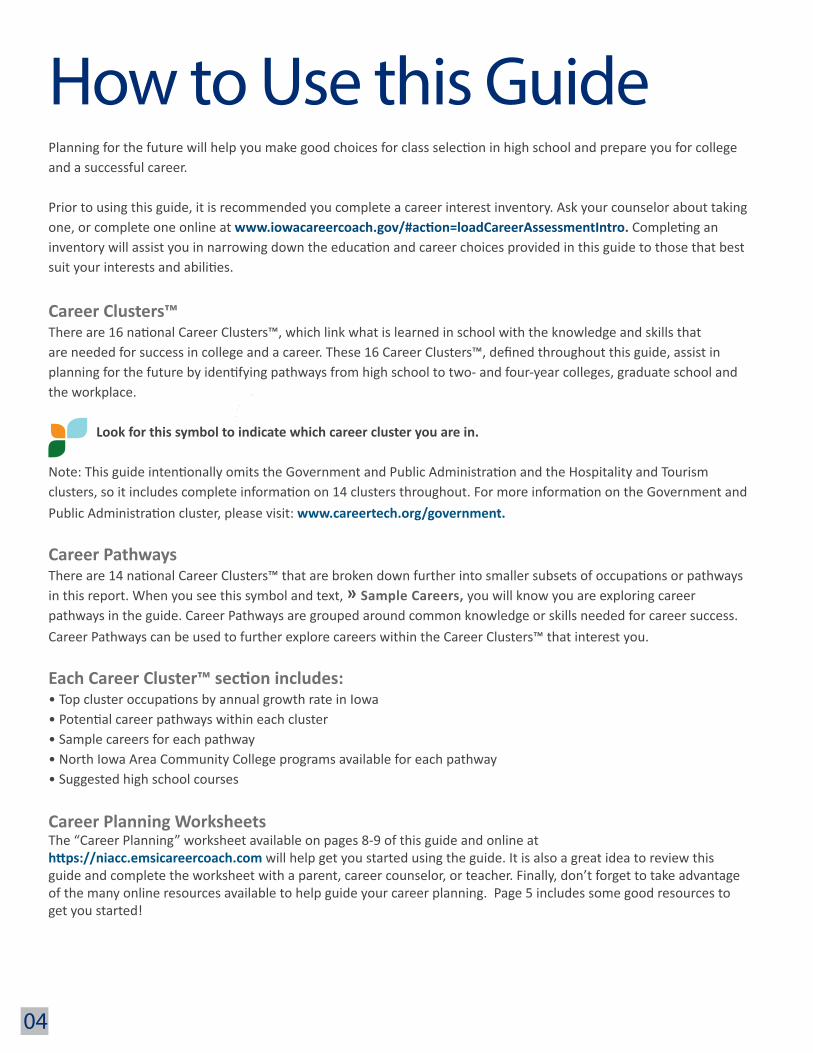
How to Use this GuidePlanning for the future will help you make good choices for class selection in high school and prepare you for college and a successful career.
Prior to using this guide, it is recommended you complete a career interest inventory. Ask your counselor about taking one, or complete one online at www.iowacareercoach.gov/#action=loadCareerAssessmentIntro. Completing an inventory will assist you in narrowing down the education and career choices provided in this guide to those that best suit your interests and abilities.
Career Clusters™There are 16 national Career Clusters™, which link what is learned in school with the knowledge and skills that are needed for success in college and a career. These 16 Career Clusters™, defined throughout this guide, assist in planning for the future by identifying pathways from high school to two- and four-year colleges, graduate school and the workplace.
Look for this symbol to indicate which career cluster you are in.
Note: This guide intentionally omits the Government and Public Administration and the Hospitality and Tourism clusters, so it includes complete information on 14 clusters throughout. For more information on the Government and Public Administration cluster, please visit: www.careertech.org/government.
Career PathwaysThere are 14 national Career Clusters™ that are broken down further into smaller subsets of occupations or pathways in this report. When you see this symbol and text, » Sample Careers, you will know you are exploring career pathways in the guide. Career Pathways are grouped around common knowledge or skills needed for career success. Career Pathways can be used to further explore careers within the Career Clusters™ that interest you.
Each Career Cluster™ section includes:• Top cluster occupations by annual growth rate in Iowa• Potential career pathways within each cluster• Sample careers for each pathway• North Iowa Area Community College programs available for each pathway• Suggested high school courses
Career Planning Worksheets The “Career Planning” worksheet available on pages 8-9 of this guide and online at https://niacc.emsicareercoach.com will help get you started using the guide. It is also a great idea to review this guide and complete the worksheet with a parent, career counselor, or teacher. Finally, don’t forget to take advantage of the many online resources available to help guide your career planning. Page 5 includes some good resources to get you started!
04

Resources North Iowa Area Community College » www.niacc.edu » www.facebook.com/myniacc Learn more about the possible college programs that interest you at www.niacc.edu/academics. NIACC Career & Employment Center » www.niacc.edu/careerservices The NIACC Career and Employment Center provides career planning and job search assistance to NIACC students before and after graduation. They can help you find local employment, perfect your resume, and polish up your job seeking and employment skills.
NIACC Career Link » www.niacc.edu/careerlink » www.niacc.edu/career-connections Take college courses while in high school. Career Link provides credits to meet your high school graduation requirements, as well as requirements for two- and four-year degrees. All tuition and textbook fees are paid through an agreement between your local high school and North Iowa Area Community College.
Career and Technical Education (CTE) » www.careertech.org Explore the knowledge and skills required for each Career Cluster™ and Pathway, find sample education plans, view brochures for each Career Cluster™ and more. Career and Technical Education (CTE) Interest Survey » www.careertech.org/student-interest-survey Use this interest survey to determine top clusters for students to explore. Available in English and Spanish.
Elevate Advanced Manufacturing » www.elevateiowa.com Consider a career in manufacturing in Iowa! Educators and students should use this resource to explore the amazing opportunities available in Iowa through the advanced manufacturing field.
Iowa Career Coach » www.iowacareercoach.gov Iowa’s Career Coach is a career exploration tool that allows users to research careers (by tasks, typical education, wages, and employer demand), find training providers, create a resume, and connect to job opportunities.
Iowa Workforce Development » www.iowaworkforcedevelopment.gov Provides job outlook and wage data, as well as information on offerings at your local IowaWORKS office.
Labor Market Information » www.iowalmi.gov Find out about the current workforce, employment, and economy status in Iowa. Go to: www.iowaworkforcedevelopment.gov/occupational-projections for detailed information on the estimated activity for each occupation in areas of employment, new jobs, replacements, total annual openings, and current wages.
Mapping Your Future » www.mappingyourfuture.org Explore careers no matter what stage you are in your planning process. This resource includes sections for middle/ high school, undergraduate, graduate, student loan borrowers, parent, and middle/high school counselors.
O*Net OnLine » www.onetonline.org There are many ways to explore careers on this website! Find occupations by Career Cluster™ or sort by Career Pathway.
05
Graduate Cluster to Industry Sector
060606
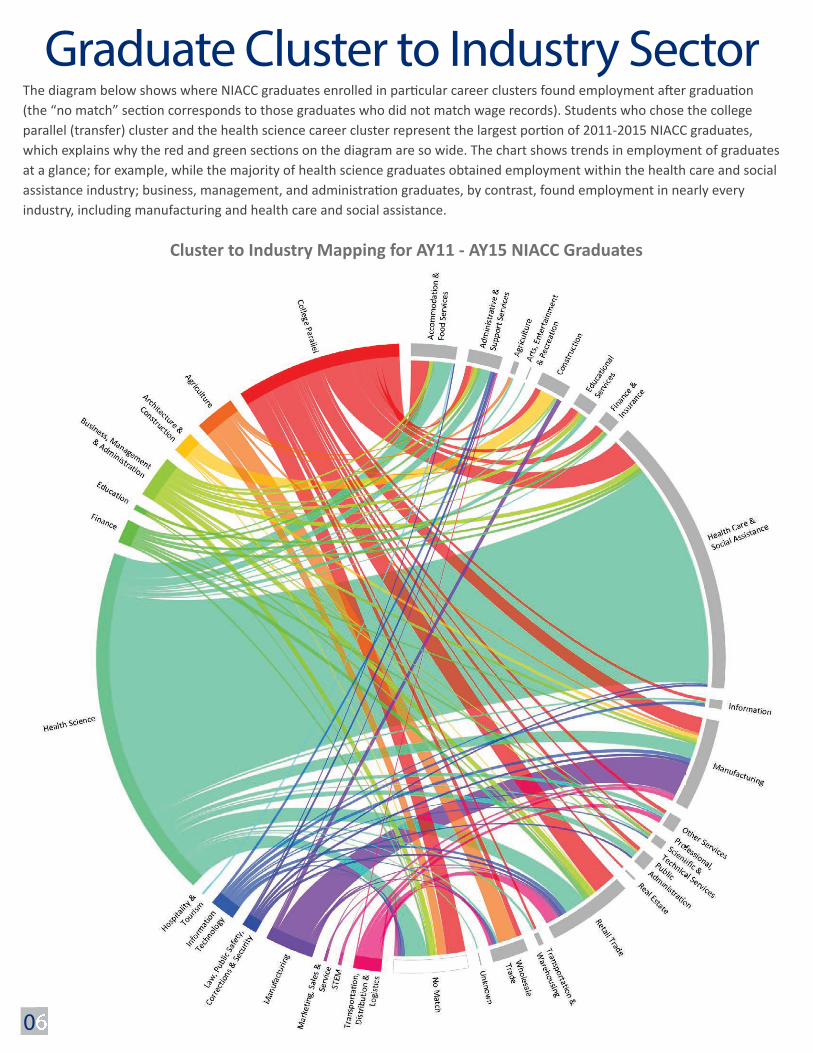
The diagram below shows where NIACC graduates enrolled in particular career clusters found employment after graduation (the “no match” section corresponds to those graduates who did not match wage records). Students who chose the college parallel (transfer) cluster and the health science career cluster represent the largest portion of 2011-2015 NIACC graduates, which explains why the red and green sections on the diagram are so wide. The chart shows trends in employment of graduates at a glance; for example, while the majority of health science graduates obtained employment within the health care and social assistance industry; business, management, and administration graduates, by contrast, found employment in nearly every industry, including manufacturing and health care and social assistance.
Cluster to Industry Mapping for AY11 - AY15 NIACC Graduates

Lessthan5,2,305
5to9,695
10to49,785
50to99,108100to249,64 250ormore,19
The Iowa Workforce Development (IWD) Region 2 (Cerro Gordo, Floyd, Franklin, Hancock, Mitchell, Winnebago, and Worth counties) Career Cluster™ analysis provides detailed information on benefits offered, wages, skills required, and employment growth within each Career Cluster™. This information is provided to further assist in career planning while using this guide.
Career Clusters™ are a break in the tradition of thinking about the labor market in terms of industries and occupational groups. Whereas industries revolve around a similar product group and occupational groups focus on similar roles, Career Clusters™ more directly identify the knowledge and skills needed to follow a pathway toward career goals and provide a context for exploring the many occupational options available. Traditional occupational groups may include jobs with similar responsibilities but on widely disparate career paths, while Career Clusters™ group jobs more directly related to their career pathways across multiple industries. Students, parents, and educators can use Career Clusters™ to help focus educational planning towards obtaining the necessary knowledge, competencies, and training for success in a particular career pathway across multiple industries. Employers can use the Career Clusters™ information to compare benefits and employment growth for the groups in which they hire. The information can be a powerful tool to assess competitiveness and business strategy for future hiring. There are 14 Career Clusters™ Discussed in this Report: • Agriculture, Food, and Natural Resources • Architecture and Construction • Arts, Audio/Video Technology, and Communications • Business, Management, and Administration • Education and Training • Finance • Health Science Since Career Clusters™ consist of occupations across many industries, businesses may employ people who are included in many Career Clusters™. For this reason, a business may be counted in a single or many Career Clusters™. While each business may identify more closely with a particular industry or even a particular occupational group, the employees may identify more closely with their particular Career Cluster™. This makes the information extremely important from a human resources perspective to better empathize and plan for the needs of the distinct groups of employees.
There are 3,976 businesses in IWD Region 2, reporting a total employment level of 51,069. The chart to the rightshows a breakdown of the employment level by business size.
• Human Services • Information Technology • Law, Public Safety, Corrections, and Security • Manufacturing • Marketing, Sales, and Service • Science, Technology, Engineering, and Mathematics • Transportation, Distribution, and Logistics
Employment Information
Source: Iowa Workforce Development, QCEW 2017 Q1
07
Employment Levels by Business Size

My Top Career Clusters™Refer to your results from your Career Coach Assessment (www.iowacareercoach.gov/#action=loadCareerAssessmentIntro). You can concentrate on just one Career Cluster™, or you may choose to expand your exploration to two clusters.
1. ________________________________________________________________________________________
2. ________________________________________________________________________________________
Careers to ResearchUse Career Coach (www.iowacareercoach.gov) to find additional careers in your top Career Clusters™.
1. ________________________________________________________________________________________
2. ________________________________________________________________________________________
3. ________________________________________________________________________________________
4. ________________________________________________________________________________________
5. ________________________________________________________________________________________
6. ________________________________________________________________________________________
Non-traditional Careers to ConsiderRead the information on non-traditional careers found on page 3 of this guide, then select non-traditional careers in your top Career Clusters™ to research.
1. ________________________________________________________________________________________
2. ________________________________________________________________________________________
Career Clusters™ that Interest MeOnce you have completed your career research you will be able to narrow down the careers in the cluster that interest you. Using this guide through career exploration will help you focus on your future education and college goals as you plan your high school courses.
1. ________________________________________________________________________________________
2. ________________________________________________________________________________________
3. ________________________________________________________________________________________
My Top Skills Based on your top career choices, which top skills should you possess?
1. ________________________________________________________________________________________
2. ________________________________________________________________________________________
3. ________________________________________________________________________________________
Career Planning
08

My Top CareersBased on your career research, try to narrow down your list of possible careers. Be sure to consider: • classes you will need to take in high school and college • the amount of education required for the career • where you can live to perform that career • the number of projected job openings in the field • how many hours you will work • the type of environment where you will work • if travel is required • what kind of benefits you can expect to receive
1. ________________________________________________________________________________________
2. ________________________________________________________________________________________
3. ________________________________________________________________________________________
My Top ProgramsBased on your top career choices, which programs should you consider for college?
1. ________________________________________________________________________________________
2. ________________________________________________________________________________________
3. ________________________________________________________________________________________
4. ________________________________________________________________________________________
Other Colleges and Programs to ConsiderWhat other colleges or college programs are you considering? Be sure to research specific programs at each college to make sure it is a fit for your top pathways and careers. When considering colleges, be sure to consider: • location • environment • size • cost • activities • success rate for job placement and/or graduate school
1. ________________________________________________________________________________________
2. ________________________________________________________________________________________
3. ________________________________________________________________________________________
09
Percent Who Continued Their Education
18.1%
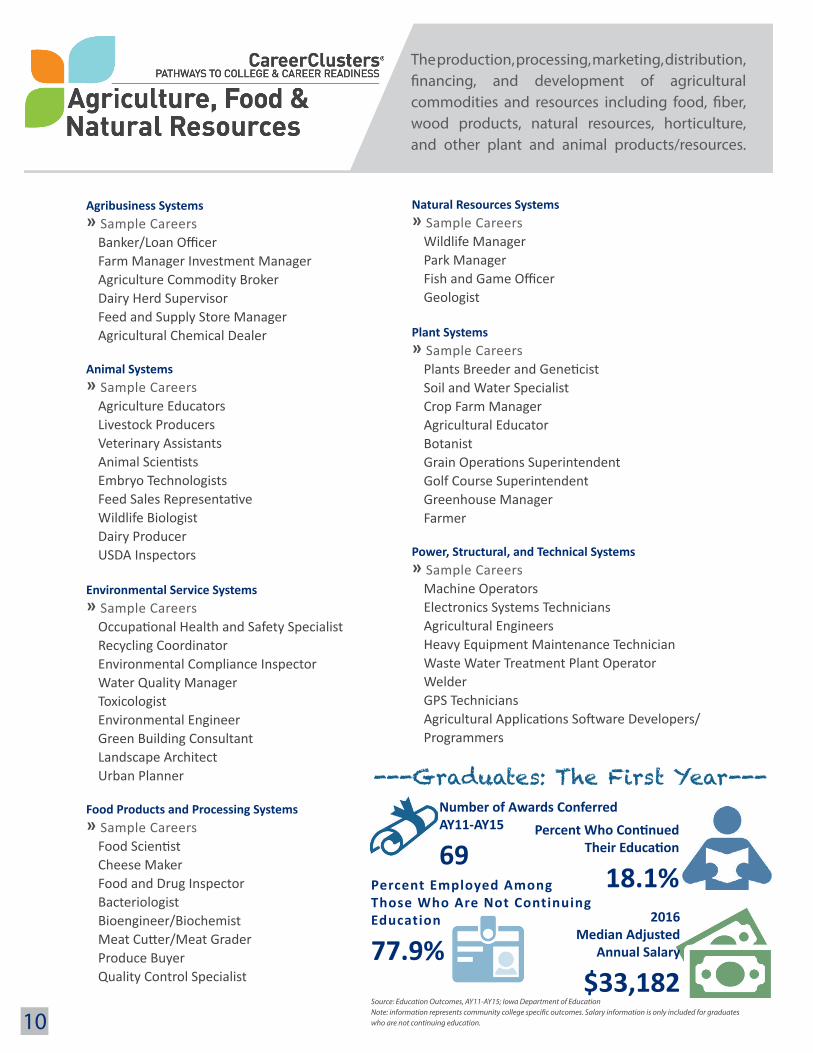
The production, processing, marketing, distribution, �nancing, and development of agricultural commodities and resources including food, �ber, wood products, natural resources, horticulture, and other plant and animal products/resources.
Agribusiness Systems » Sample Careers Banker/Loan Officer Farm Manager Investment Manager Agriculture Commodity Broker Dairy Herd Supervisor Feed and Supply Store Manager Agricultural Chemical Dealer
Animal Systems » Sample Careers Agriculture Educators Livestock Producers Veterinary Assistants Animal Scientists Embryo Technologists Feed Sales Representative Wildlife Biologist Dairy Producer USDA Inspectors
Environmental Service Systems » Sample Careers Occupational Health and Safety Specialist Recycling Coordinator Environmental Compliance Inspector Water Quality Manager Toxicologist Environmental Engineer Green Building Consultant Landscape Architect Urban Planner
Food Products and Processing Systems » Sample Careers Food Scientist Cheese Maker Food and Drug Inspector Bacteriologist Bioengineer/Biochemist Meat Cutter/Meat Grader Produce Buyer Quality Control Specialist
Natural Resources Systems » Sample Careers Wildlife Manager Park Manager Fish and Game Officer Geologist
Plant Systems » Sample Careers Plants Breeder and Geneticist Soil and Water Specialist Crop Farm Manager Agricultural Educator Botanist Grain Operations Superintendent Golf Course Superintendent Greenhouse Manager Farmer
Power, Structural, and Technical Systems » Sample Careers Machine Operators Electronics Systems Technicians Agricultural Engineers Heavy Equipment Maintenance Technician Waste Water Treatment Plant Operator Welder GPS Technicians Agricultural Applications Software Developers/ Programmers
10
---Graduates: The First Year---Number of Awards ConferredAY11-AY15
69
2016Median Adjusted
Annual Salary
$33,182
Percent Employed Among Those Who Are Not Continuing Education
77.9%Source: Education Outcomes, AY11-AY15; Iowa Department of EducationNote: information represents community college speci�c outcomes. Salary information is only included for graduates who are not continuing education.

AGRICULTURE, FOOD, AND NATURAL RESOURCES CAREER CLUSTER™ OCCUPATIONS BY ANNUAL OPENINGS
ANNUAL OPENINGS = Annual New Jobs plus Annual Replacements (rounded); Employment data suppression (Occupational employment data may not add up or equal occupational group totals due to rounding and/or suppression of occupations with less than ten rounded total annual openings.);
ANNUAL GROWTH RATE = Ten year growth rate (not shown) divided by ten;
ENTRY-LEVEL HOURLY RATE = Average of the lowest third of reported wages for the occupation;
MID-CAREER HOURLY RATE = Average wage computed by dividing the estimated total wage for an occupation by its weighted employment;
EDUCATION/WORK EXPERIENCE/JOB TRAINING levels are determined by the U.S. Department of Labor’s Bureau of Labor Statistics (BLS). Alternative pathways may exist as well as differing educational, training or licensing requirements per state. Iowa requirements are used in this publication when available.
Source: EMSI
11Source: Education Outcomes, AY11-AY15; Iowa Department of EducationNote: information represents community college speci�c outcomes. Salary information is only included for graduates who are not continuing education.
Occupation
Annu
al O
peni
ngs
Annu
al G
row
th
Estim
ated
jobs
by
2025
Entr
y-Le
vel H
ourly
Ra
teM
id-C
aree
r Hou
rly
Rate
Typi
cal E
ntry
-Lev
el
Educ
ation
Wor
k Ex
perie
nce
Requ
ired
Typi
cal O
n-th
e-Jo
b Tr
aini
ng
Farmers, Ranchers, and Other Agricultural Managers 664 0.6% 31,876 $9.72 $13.40 HS 5+ years NoneFirst-Line Supervisors of Farming, Fishing, and Forestry Workers 31 1.2% 998 $16.23 $27.13 HS < 5 years None
Tree Trimmers and Pruners 15 2.0% 362 $10.99 $15.15 HS None Short-TermEnvironmental Engineers 12 2.6% 261 $27.61 $40.23 B None NoneNatural Sciences Managers 11 1.3% 348 $33.17 $48.69 B 5+ years NoneAgricultural Inspectors 9 0.4% 281 $16.69 $22.86 B None Moderate-TermAgricultural Engineers 8 0.3% 265 $25.28 $36.99 B None NoneEnvironmental Engineering Technicians 4 3.0% 95 $16.16 $23.03 A None NoneAnimal Breeders 4 1.4% 99 $13.55 $21.91 HS < 5 years Short-TermForest and Conservation Workers 3 0.5% 154 $10.28 $16.64 HS None Moderate-TermLogging Equipment Operators 3 -2.7% 78 $14.29 $17.71 HS None Moderate-Term
THE FOLLOWING DATA IS FOR THE STATE OF IOWA AS A WHOLE
EDUCATION:< HS = Less than high schoolHS = High school diploma or equivalentPS = Postsecondary non-degree awardSC = Some college, no degree
A = Associate’s degreeB = Bachelor's degreeG = Advanced degree

North Iowa Area Community College PROGRAMS OF STUDY
• AGRICULTURE - TRANSFER• AGRICULTURE MARKETING & FINANCE• AGRICULTURE OPERATIONS MANAGEMENT• AGRICULTURE SALES & SERVICE• AGRICULTURE TECHNOLOGY• ANIMAL ECOLOGY• BIOLOGY - TRANSFER• ENVIRONMENTAL SCIENCES - TRANSFER• FORESTRY - TRANSFER• HORTICULTURE - TRANSFER• VETERINARY MEDICINE - TRANSFER
SUGGESTED HIGH SCHOOL COURSES
• ACCOUNTING• AGRICULTURE EDUCATION• BUSINESS EDUCATION• COMMUNICATION• COMPUTER APPLICATIONS• ENGLISH/COMPOSITION• FOREIGN LANGUAGE• LAB SCIENCES: BIOLOGY, CHEMISTRY, PHYSICS,
MICROBIOLOGY• MATH: TECHNICAL MATH, ALGEBRA,
TRIGONOMETRY, CALCULUS• PRE-EMPLOYMENT STRATEGIES
12
THE CLASSES I HAVE TAKEN AT NIACC WERE ENJOYABLE,
AND THE PROFESSORS WERE VERY HELPFUL IN
GUIDING ME TOWARDS MY EDUCATIONAL GOALS.
---MATT
“
”
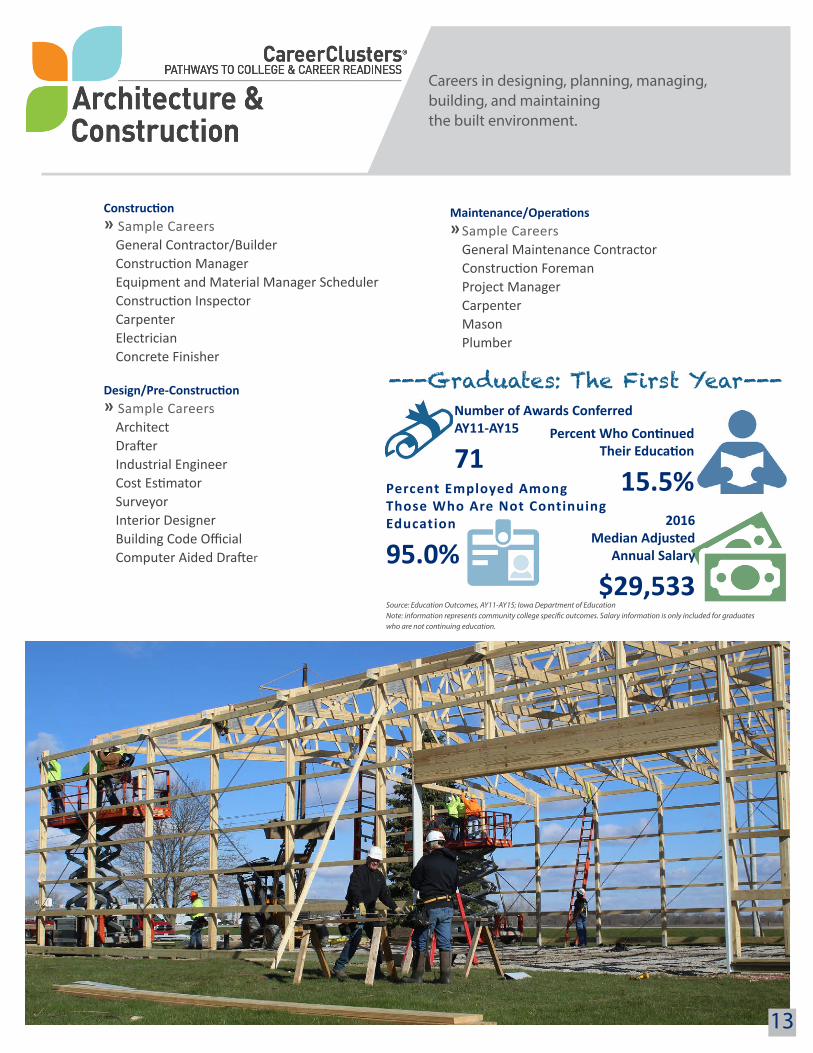
Careers in designing, planning, managing, building, and maintaining the built environment.
Construction » Sample Careers General Contractor/Builder Construction Manager Equipment and Material Manager Scheduler Construction Inspector Carpenter Electrician Concrete Finisher
Design/Pre-Construction » Sample Careers Architect Drafter Industrial Engineer Cost Estimator Surveyor Interior Designer Building Code Official Computer Aided Drafter
Maintenance/Operations » Sample Careers General Maintenance Contractor Construction Foreman Project Manager Carpenter Mason Plumber
13
Percent Who Continued Their Education
15.5%
---Graduates: The First Year---Number of Awards ConferredAY11-AY15
71
2016Median Adjusted
Annual Salary
$29,533
Percent Employed Among Those Who Are Not Continuing Education
95.0%Source: Education Outcomes, AY11-AY15; Iowa Department of EducationNote: information represents community college speci�c outcomes. Salary information is only included for graduates who are not continuing education.

ARCHITECTURE AND CONSTRUCTION CAREER CLUSTER™ OCCUPATIONS BY ANNUAL OPENINGS
ANNUAL OPENINGS = Annual New Jobs plus Annual Replacements (rounded); Employment data suppression (Occupational employment data may not add up or equal occupational group totals due to rounding and/or suppression of occupations with less than ten rounded total annual openings.);
ANNUAL GROWTH RATE = Ten year growth rate (not shown) divided by ten;
ENTRY-LEVEL HOURLY RATE = Average of the lowest third of reported wages for the occupation;
MID-CAREER HOURLY RATE = Average wage computed by dividing the estimated total wage for an occupation by its weighted employment;
EDUCATION/WORK EXPERIENCE/JOB TRAINING levels are determined by the U.S. Department of Labor’s Bureau of Labor Statistics (BLS). Alternative pathways may exist as well as differing educational, training or licensing requirements per state. Iowa requirements are used in this publication when available.
14
Source: EMSI
Occupation
Annu
al O
peni
ngs
Annu
al G
row
th
Estim
ated
Jobs
by
202
5En
try-
Leve
l Ho
urly
Rat
eM
id-C
aree
r Ho
urly
Rat
eTy
pica
l Ent
ry-
Leve
l Edu
catio
n
Wor
k Ex
perie
nce
Requ
ired
Typi
cal O
n-th
e-Jo
b Tr
aini
ng
Electricians 364 1.9% 10,462 $15.07 $24.07 HS None ApprenticeshipCarpenters 356 1.6% 13,622 $12.26 $17.30 HS None ApprenticeshipOperating Engineers and Other Construction Equipment Operators 210 1.2% 6,557 $13.99 $21.41 HS None Moderate-TermFirst-Line Supervisors of Construction Trades and Extraction Workers 206 1.4% 7,689 $16.32 $25.19 HS 5+ years NonePlumbers, Pipefitters, and Steamfitters 167 1.5% 6,707 $13.43 $22.13 HS None ApprenticeshipMechanical Engineers 130 1.0% 3,082 $23.43 $35.64 B None NoneCivil Engineers 120 2.5% 2,754 $22.97 $36.91 B None NoneIndustrial Engineers 118 1.0% 3,163 $25.16 $35.51 B None NoneFirst-Line Supervisors of Housekeeping and Janitorial Workers 88 1.3% 2,552 $10.17 $16.27 HS < 5 years NoneHighway Maintenance Workers 69 0.5% 3,624 $14.89 $20.10 HS None Moderate-TermSheet Metal Workers 49 1.3% 1,618 $14.33 $23.43 HS None ApprenticeshipStructural Iron and Steel Workers 48 1.6% 1,047 $18.63 $24.82 HS None ApprenticeshipElectrical Engineers 47 1.1% 1,521 $26.39 $36.88 B None NoneArchitects, Except Landscape and Naval 42 2.4% 1,006 $20.00 $30.85 B None Internship/ResidencyHelpers--Electricians 37 3.6% 844 $10.51 $14.49 HS None Short-TermBrickmasons and Blockmasons 35 1.7% 1,239 $14.48 $19.96 HS None ApprenticeshipPesticide Handlers, Sprayers, and Applicators, Vegetation 35 0.9% 1,083 $10.45 $14.23 HS None Moderate-TermConstruction and Building Inspectors 32 1.6% 865 $16.66 $25.64 HS 5+ years Moderate-TermFirst-Line Supervisors of Landscaping, Lawn Service, and Groundskeeping Workers 28 1.0% 1,284 $12.80 $18.27 HS < 5 years None
Insulation Workers, Mechanical 27 3.5% 677 $14.28 $21.12 HS None ApprenticeshipElectrical and Electronics Engineering Technicians 26 0.5% 1,069 $17.52 $26.70 A None NoneIndustrial Engineering Technicians 24 0.6% 924 $15.56 $23.48 A None NoneFence Erectors 22 1.4% 644 $11.02 $14.81 HS None Moderate-TermCivil Engineering Technicians 22 0.3% 947 $15.81 $24.89 A None NoneGlaziers 21 1.8% 547 $13.29 $19.86 HS None ApprenticeshipPest Control Workers 21 1.5% 550 $11.21 $15.42 HS None Moderate-TermArchitectural and Civil Drafters 19 0.8% 901 $15.94 $23.14 A None NonePaving, Surfacing, and Tamping Equipment Operators 18 1.3% 659 $14.01 $20.07 HS None Moderate-TermElectronics Engineers, Except Computer 16 2.8% 373 $27.56 $36.90 B None NoneHazardous Materials Removal Workers 15 1.3% 484 $12.79 $18.03 HS None Moderate-Term
EDUCATION:< HS = Less than high schoolHS = High school diploma or equivalentPS = Postsecondary non-degree awardSC = Some college, no degree
A = Associate’s degreeB = Bachelor's degreeG = Advanced degree
THE FOLLOWING DATA IS FOR THE STATE OF IOWA AS A WHOLE

North Iowa Area Community College PROGRAMS OF STUDY
• BUILDING TRADES• HEATING AND AIR CONDITIONING TECHNOLOGY
SUGGESTED HIGH SCHOOL COURSES
• BUSINESS EDUCATION• COMMUNICATION• COMPUTER APPLICATIONS• ENGLISH/COMPOSITION• FOREIGN LANGUAGE• INDUSTRIAL TECHNOLOGY EDUCATION:
• ELECTRICAL SYSTEMS, CONSTRUCTION, CABINETMAKING, POWER TECHNOLOGY, DRAFTING, INTRODUCTION TO ENGINEERING, MACHINE OPERATIONS, BLUEPRINT READING, WELDING, SAFETY, WOOD
• MATH: TECHNICAL MATH, ALGEBRA, TRIGONOMETRY, CALCULUS
• PRE-EMPLOYMENT STRATEGIES
15
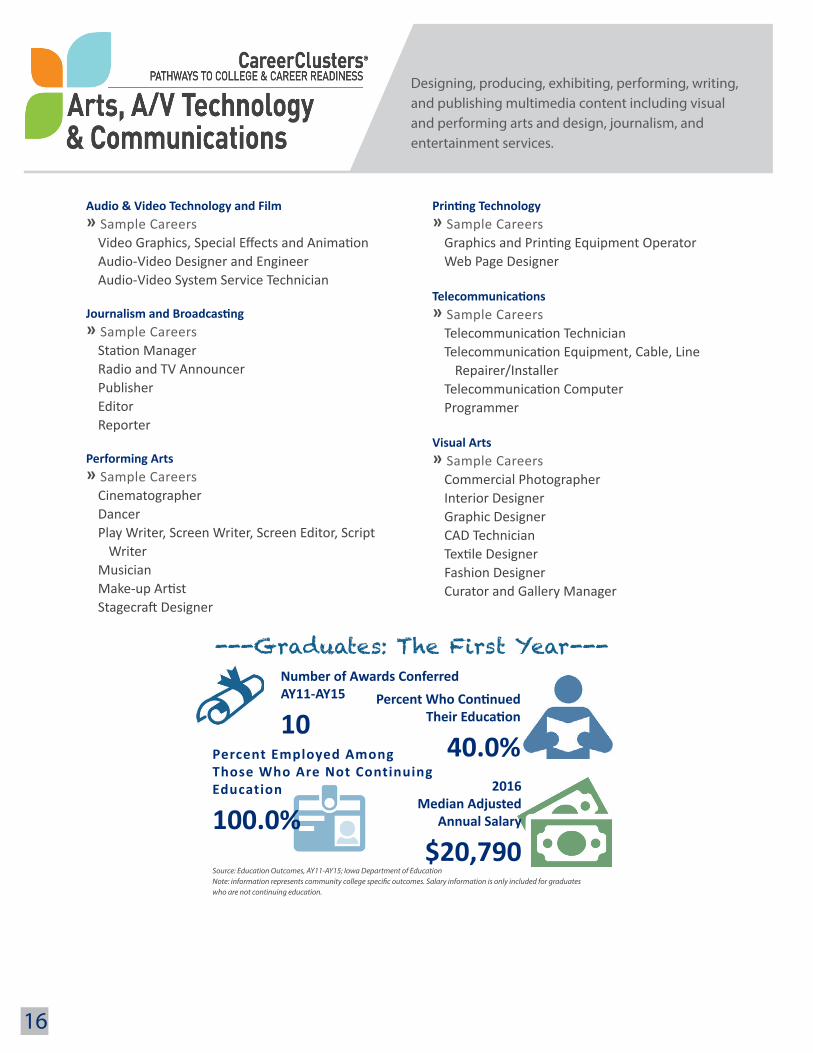
Designing, producing, exhibiting, performing, writing, and publishing multimedia content including visual and performing arts and design, journalism, and entertainment services.
Audio & Video Technology and Film » Sample Careers Video Graphics, Special Effects and Animation Audio-Video Designer and Engineer Audio-Video System Service Technician
Journalism and Broadcasting » Sample Careers Station Manager Radio and TV Announcer Publisher Editor Reporter
Performing Arts » Sample Careers Cinematographer Dancer Play Writer, Screen Writer, Screen Editor, Script Writer Musician Make-up Artist Stagecraft Designer
Printing Technology » Sample Careers Graphics and Printing Equipment Operator Web Page Designer
Telecommunications » Sample Careers Telecommunication Technician Telecommunication Equipment, Cable, Line Repairer/Installer Telecommunication Computer Programmer
Visual Arts » Sample Careers Commercial Photographer Interior Designer Graphic Designer CAD Technician Textile Designer Fashion Designer Curator and Gallery Manager
16
Percent Who Continued Their Education
40.0%
---Graduates: The First Year---Number of Awards ConferredAY11-AY15
10
2016 Median Adjusted
Annual Salary
$20,790
Percent Employed Among Those Who Are Not Continuing Education
100.0%Source: Education Outcomes, AY11-AY15; Iowa Department of EducationNote: information represents community college speci�c outcomes. Salary information is only included for graduates who are not continuing education.

17
ARTS, A/V TECHNOLOGY, AND COMMUNICATIONS CAREER CLUSTER™ OCCUPATIONS BY ANNUAL OPENINGS
ANNUAL OPENINGS = Annual New Jobs plus Annual Replacements (rounded); Employment data suppression (Occupational employment data may not add up or equal occupational group totals due to rounding and/or suppression of occupations with less than ten rounded total annual openings.);
ANNUAL GROWTH RATE = Ten year growth rate (not shown) divided by ten;
ENTRY-LEVEL HOURLY RATE = Average of the lowest third of reported wages for the occupation;
MID-CAREER HOURLY RATE = Average wage computed by dividing the estimated total wage for an occupation by its weighted employment;
EDUCATION/WORK EXPERIENCE/JOB TRAINING levels are determined by the U.S. Department of Labor’s Bureau of Labor Statistics (BLS). Alternative pathways may exist as well as differing educational, training or licensing requirements per state. Iowa requirements are used in this publication when available.
Source: EMSI
Occupation
Annu
al O
peni
ngs
Annu
al G
row
th
Estim
ated
Jobs
by
2025
Entr
y-Le
vel H
ourly
Ra
teM
id-C
aree
r Hou
rly
Rate
Typi
cal E
ntry
-Lev
el
Educ
ation
Wor
k Ex
perie
nce
Requ
ired
Typi
cal O
n-th
e-Jo
b Tr
aini
ng
Coaches and Scouts 204 1.3% 5,120 $8.25 $13.19 B None NoneGraphic Designers 125 1.9% 3,007 $12.33 $18.02 B None NoneEditors 55 0.9% 1,667 $12.33 $20.64 B < 5 years NoneInterior Designers 53 3.9% 1,000 $12.33 $17.47 B None NoneMusicians and Singers 51 0.6% 1,514 $9.96 $25.69 HS None Long-TermPublic Relations Specialists 48 1.1% 2,038 $15.90 $26.66 B None NoneMerchandise Displayers and Window Trimmers 39 0.8% 1,129 $9.46 $11.88 HS None Moderate-TermReporters and Correspondents 32 -0.6% 867 $10.18 $15.18 B None NoneMusic Directors and Composers 31 0.7% 941 $13.17 $23.27 B < 5 years NoneAudio and Video Equipment Technicians 25 2.1% 711 $9.60 $14.98 PS None Short-TermTechnical Writers 24 1.2% 607 $18.18 $25.43 B < 5 years Short-TermProducers and Directors 22 0.2% 572 $12.30 $22.76 B < 5 years NoneCommercial and Industrial Designers 22 1.8% 534 $16.90 $24.26 B None NoneWriters and Authors 20 -0.1% 791 $11.73 $17.93 B None Moderate-TermInterpreters and Translators 20 2.1% 633 $13.30 $18.75 B None Short-TermFloral Designers 16 -2.6% 569 $8.63 $11.77 HS None Moderate-TermArt Directors 12 1.1% 362 $16.02 $25.01 B 5+ years NonePhotographers 11 -2.0% 767 $9.66 $14.26 HS None Long-TermRadio and Television Announcers 10 -0.1% 437 $9.16 $15.47 B None NoneUmpires, Referees, and Other Sports Officials 9 1.0% 244 $8.34 $10.46 HS None Moderate-TermActors 7 0.3% 183 $12.22 $19.77 SC None Long-TermAthletes and Sports Competitors 7 -0.3% 201 $11.92 $26.47 HS None Long-TermFine Artists, Including Painters, Sculptors, and Illustrators 6 -1.5% 231 $6.79 $9.13 HS None Long-TermDancers 6 -0.1% 182 $8.89 $13.84 HS None Long-TermMultimedia Artists and Animators 6 0.6% 204 $11.55 $17.03 B None Moderate-TermBroadcast Technicians 5 0.3% 234 $8.57 $16.48 A None Short-TermFashion Designers 4 3.3% 89 $18.85 $22.99 B None NonePublic Address System and Other Announcers 3 -0.3% 141 $9.45 $14.04 HS None Short-TermCraft Artists 3 -2.7% 113 $4.95 $6.14 HS None Long-TermSound Engineering Technicians 3 1.2% 101 $15.74 $22.57 PS None Short-Term
EDUCATION:< HS = Less than high schoolHS = High school diploma or equivalentPS = Postsecondary non-degree awardSC = Some college, no degree
A = Associate’s degreeB = Bachelor's degreeG = Advanced degree
THE FOLLOWING DATA IS FOR THE STATE OF IOWA AS A WHOLE

North Iowa Area Community College PROGRAMS OF STUDY
• ART-VISUAL/GRAPHIC - TRANSFER• ENGLISH - TRANSFER• FAMILY & CONSUMER SCIENCE - TRANSFER• JOURNALISM - TRANSFER• MUSIC - TRANSFER• PUBLIC RELATIONS - TRANSFER• SPEECH - TRANSFER• THEATER - TRANSFER
SUGGESTED HIGH SCHOOL COURSES
• ART• BUSINESS EDUCATION• COMMUNICATION• COMPUTER APPLICATIONS• ENGLISH/COMPOSITION• FOREIGN LANGUAGE• GRAPHIC ARTS• MATH: TECHNICAL MATH, ALGEBRA• MUSIC• PRE-EMPLOYMENT STRATEGIES• THEATER
18
I LIKE MY CLASSES BECAUSE I AM LEARNING MORE STYLES OF
WRITING WHICH WILL HELP ME IN MY CAREER SOMEDAY.
---HANNAH
“”

Encompasses planning, organizing, directing, and evaluating business functions essential to e�cient and productive business operations. Business, management, and administration career opportunities are available in every sector of the economy.
Administrative Support » Sample Careers Administrative Assistant Executive Assistant Receptionist Medical Transcriptionist Legal Secretary
Business Information Management » Sample Careers Accountant Auditor Bookkeeper Certified Public Accountant Accounts Receivable Clerk Billing Clerk
General Management » Sample Careers Entrepreneur General Manager Accounting Manager Billing Manager Payroll Manager Facilities Manager
Human Resources Management » Sample Careers Human Resources Manager Compensation and Benefits Manager Corporate Trainer Personnel Recruiter Human Resources Assistant
Operations Management » Sample Careers Systems Analyst Marketing Analyst Business Consultant Product Manager
19
Percent Who Continued Their Education
26.2%
---Graduates: The First Year---Number of Awards ConferredAY11-AY15
137
2016 Median Adjusted
Annual Salary
$17,378
Percent Employed Among Those Who Are Not Continuing Education
86.0%Source: Education Outcomes, AY11-AY15; Iowa Department of EducationNote: information represents community college speci�c outcomes. Salary information is only included for graduates who are not continuing education.

20
BUSINESS, MANAGEMENT, AND ADMINISTRATION CAREER CLUSTER™ OCCUPATIONS BY ANNUAL OPENINGS
ANNUAL OPENINGS = Annual New Jobs plus Annual Replacements (rounded); Employment data suppression (Occupational employment data may not add up or equal occupational group totals due to rounding and/or suppression of occupations with less than ten rounded total annual openings.);
ANNUAL GROWTH RATE = Ten year growth rate (not shown) divided by ten;
ENTRY-LEVEL HOURLY RATE = Average of the lowest third of reported wages for the occupation;
MID-CAREER HOURLY RATE = Average wage computed by dividing the estimated total wage for an occupation by its weighted employment;
EDUCATION/WORK EXPERIENCE/JOB TRAINING levels are determined by the U.S. Department of Labor’s Bureau of Labor Statistics (BLS). Alternative pathways may exist as well as differing educational, training or licensing requirements per state. Iowa requirements are used in this publication when available.
Occupation
Annu
al
Ope
ning
s
Annu
al G
row
th
Estim
ated
Jobs
by
202
5
Entr
y-Le
vel
Hour
ly R
ate
Mid
-Car
eer
Hour
ly R
ate
Typi
cal E
ntry
-Le
vel E
duca
tion
Wor
k Ex
perie
nce
Requ
ired
Typi
cal O
n-th
e-Jo
b Tr
aini
ng
Customer Service Representatives 1,125 1.2% 30,061 $9.77 $15.56 HS None Short-TermOffice Clerks, General 1,035 0.8% 37,309 $9.45 $14.99 HS None Short-TermGeneral and Operations Managers 774 1.2% 27,080 $16.45 $43.90 B < 5 years NoneSecretaries and Administrative Assistants, Except Legal, Medical, and Executive 686 1.2% 30,750 $9.81 $15.07 HS None Short-Term
Tellers 563 1.9% 9,366 $9.42 $12.26 HS None Short-TermFirst-Line Supervisors of Office and Administrative Support Workers 496 1.7% 13,171 $13.75 $22.98 HS < 5 years NoneBookkeeping, Accounting, and Auditing Clerks 446 1.1% 23,590 $9.88 $16.04 HS None Moderate-TermReceptionists and Information Clerks 390 1.2% 10,708 $8.99 $13.02 HS None Short-TermFinancial Managers 259 1.4% 8,646 $26.70 $51.69 B 5+ years NoneMedical Secretaries 218 2.3% 7,017 $10.66 $15.41 HS None Moderate-TermShipping, Receiving, and Traffic Clerks 214 1.0% 6,156 $10.44 $15.49 HS None Short-TermMedical and Health Services Managers 206 1.3% 5,960 $23.29 $37.91 B None NoneInsurance Claims and Policy Processing Clerks 195 1.6% 4,898 $13.69 $18.12 HS None Moderate-TermBilling and Posting Clerks 165 1.5% 5,317 $12.51 $16.91 HS None Short-TermConstruction Managers 148 0.7% 5,289 $15.99 $29.79 B None Moderate-TermBill and Account Collectors 140 1.2% 3,661 $11.74 $16.03 HS None Moderate-TermExecutive Secretaries and Executive Administrative Assistants 138 -0.0% 11,108 $13.80 $20.60 HS < 5 years NoneHuman Resources Specialists 136 1.2% 4,846 $15.54 $25.88 B None NoneSales Managers 125 1.2% 3,930 $25.25 $50.01 B < 5 years NoneLibrary Assistants, Clerical 120 1.2% 2,275 $8.21 $11.35 HS None Short-TermProduction, Planning, and Expediting Clerks 116 0.9% 3,511 $13.66 $21.01 HS None Moderate-TermPostal Service Mail Carriers 108 -2.5% 2,777 $17.76 $24.71 HS None Short-TermComputer and Information Systems Managers 108 1.7% 3,802 $37.29 $54.40 B 5+ years NoneChief Executives 101 1.0% 3,401 $25.89 $71.86 B 5+ years NoneLoan Interviewers and Clerks 100 1.3% 5,433 $12.69 $16.83 HS None Short-TermDispatchers, Except Police, Fire, and Ambulance 92 1.6% 2,201 $11.65 $18.78 HS None Moderate-TermSocial and Community Service Managers 92 1.5% 2,833 $15.51 $25.67 B 5+ years NoneAdministrative Services Managers 81 1.3% 2,945 $19.85 $35.76 B < 5 years NoneEducation Administrators, Elementary and Secondary School 80 0.6% 2,536 $30.51 $43.30 G 5+ years None
Source: EMSI
EDUCATION:< HS = Less than high schoolHS = High school diploma or equivalentPS = Postsecondary non-degree awardSC = Some college, no degree
A = Associate’s degreeB = Bachelor's degreeG = Advanced degree
THE FOLLOWING DATA IS FOR THE STATE OF IOWA AS A WHOLE

21
North Iowa Area Community College PROGRAMS OF STUDY
• ACCOUNTING - TRANSFER• ADMINISTRATIVE OFFICE• BUSINESS - TRANSFER• BUSINESS ADMINISTRATION• BUSINESS MANAGEMENT• ECONOMICS - TRANSFER• ENTREPRENEURSHIP & SMALL BUSINESS
MANAGEMENT• MANAGEMENT INFORMATION SYSTEMS -
TRANSFER• SOFTWARE APPLICATIONS SPECIALIST• SPORT MANAGEMENT
SUGGESTED HIGH SCHOOL COURSES
• ACCOUNTING• BUSINESS EDUCATION• COMMUNICATION• COMPUTER APPLICATIONS• ECONOMICS• ENGLISH/COMPOSITION• FOREIGN LANGUAGE• GRAPHIC ARTS• MATH• PRE-EMPLOYMENT STRATEGIES• PSYCHOLOGY
I KNEW THAT I WANTED A BUSINESS MAJOR WHEN I
CAME TO NIACC. HAVING THE OPPORTUNITY TO TAKE A
VARIETY OF BUSINESS CLASSES HAS HELPED ME NARROW
DOWN MY AREA OF INTEREST.
---DYLAN
“
”

Planning, managing, and providing education and training services and related learning support services.
Administration and Administrative Support » Sample Careers Superintendent Principal Curriculum Developer Education Researcher
Professional Support Services » Sample Careers Psychologist Social Worker Counselor
Teaching/Training » Sample Careers Preschool Teacher Special Education Teacher Elementary or Secondary Teacher Teacher Aid Childcare Worker Group Worker Professor
22

23
EDUCATION AND TRAINING CAREER CLUSTER™ OCCUPATIONS BY ANNUAL OPENINGS
ANNUAL OPENINGS = Annual New Jobs plus Annual Replacements (rounded); Employment data suppression (Occupational employment data may not add up or equal occupational group totals due to rounding and/or suppression of occupations with less than ten rounded total annual openings.);
ANNUAL GROWTH RATE = Ten year growth rate (not shown) divided by ten;
ENTRY-LEVEL HOURLY RATE = Average of the lowest third of reported wages for the occupation;
MID-CAREER HOURLY RATE = Average wage computed by dividing the estimated total wage for an occupation by its weighted employment;
EDUCATION/WORK EXPERIENCE/JOB TRAINING levels are determined by the U.S. Department of Labor’s Bureau of Labor Statistics (BLS). Alternative pathways may exist as well as differing educational, training or licensing requirements per state. Iowa requirements are used in this publication when available.
Source: EMSI
Occupation
Annu
al O
peni
ngs
Annu
al G
row
th
Estim
ated
Jobs
by
2025
Entr
y-Le
vel H
ourly
Ra
te
Mid
-Car
eer H
ourly
Ra
teTy
pica
l Ent
ry-L
evel
Ed
ucati
on
Wor
k Ex
perie
nce
Requ
ired
Typi
cal O
n-th
e-Jo
b Tr
aini
ng
Teacher Assistants 609 0.8% 20,558 $8.23 $11.07 SC None NoneElementary School Teachers, Except Special Education 557 1.1% 17,735 $16.16 $24.17 B None Internship/ResidencyPostsecondary Teachers 534 1.4% 19,981 $16.41 $39.78 G None NoneSecondary School Teachers, Except Special and Career/Technical Education 383 0.6% 11,941 $15.76 $23.99 B None Internship/Residency
Preschool Teachers, Except Special Education 270 1.8% 6,357 $9.02 $12.82 A None NoneMiddle School Teachers, Except Special and Career/Technical Education 201 1.2% 6,303 $16.50 $25.28 B None Internship/Residency
Substitute Teachers 194 0.7% 8,306 $10.22 $13.28 B None Internship/ResidencyLibrary Technicians 118 0.9% 1,951 $8.90 $14.43 PS None NoneSelf-Enrichment Education Teachers 110 1.5% 3,719 $10.21 $17.23 HS < 5 years NoneKindergarten Teachers, Except Special Education 51 1.2% 1,342 $15.47 $22.80 B None Internship/ResidencyLibrarians 45 0.7% 1,584 $12.55 $22.88 G None NoneSpecial Education Teachers, Kindergarten and Elementary School 40 0.7% 1,717 $15.96 $24.21 B None Internship/Residency
Instructional Coordinators 29 1.3% 1,471 $22.73 $34.13 G 5+ years NoneSpecial Education Teachers, Secondary School 24 0.5% 1,078 $18.33 $25.54 B None Internship/ResidencySpecial Education Teachers, Middle School 22 0.6% 984 $16.90 $25.55 B None Internship/ResidencyCareer/Technical Education Teachers, Secondary School 21 0.6% 659 $15.96 $24.77 B < 5 years Internship/ResidencyAdult Basic and Secondary Education and Literacy Teachers and Instructors 10 1.4% 350 $14.10 $22.20 B None Internship/Residency
Special Education Teachers, Preschool 7 1.8% 229 $17.19 $26.34 B None Internship/ResidencyCurators 4 1.2% 135 $13.09 $22.48 G None NoneFarm and Home Management Advisors 4 0.7% 288 $12.83 $23.09 G None NoneMuseum Technicians and Conservators 3 1.0% 100 $9.99 $21.28 B None NoneCareer/Technical Education Teachers, Middle School 3 0.6% 93 $19.14 $24.29 B < 5 years Internship/ResidencyArchivists 2 1.3% 52 $16.11 $22.96 G None None
EDUCATION:< HS = Less than high schoolHS = High school diploma or equivalentPS = Postsecondary non-degree awardSC = Some college, no degree
A = Associate’s degreeB = Bachelor's degreeG = Advanced degree
THE FOLLOWING DATA IS FOR THE STATE OF IOWA AS A WHOLE

North Iowa Area Community College PROGRAMS OF STUDY
• ATHLETIC TRAINER - TRANSFER• COACHING - TRANSFER• EARLY CHILDHOOD EDUCATION• ELEMENTARY EDUCATION - TRANSFER• FAMILY & CONSUMER SCIENCE - TRANSFER• HISTORY - TRANSFER• PHYSICAL EDUCATION - TRANSFER• SECONDARY EDUCATION - TRANSFER• TEACHER’S AIDE - TRANSFER
SUGGESTED HIGH SCHOOL COURSES
• BUSINESS EDUCATION• COMMUNICATION• COMPUTER APPLICATIONS• ECONOMICS• ENGLISH/COMPOSITION• FAMILY AND CONSUMER SCIENCES• FOREIGN LANGUAGE• GRAPHIC ARTS• MATH• PRE-EMPLOYMENT STRATEGIES• PSYCHOLOGY
24
NIACC HAS TAUGHT ME WHAT IT TAKES TO BE A SUCCESSFUL TEACHER, FROM GREAT TEACHERS THEMSELVES. THANKS TO NIACC I AM CONFIDENT I
CHOSE THE PERFECT CAREER PATH.
---NICK
“”

Planning services for �nancial and investment planning, banking, insurance, and business �nancial management.
Accounting » Sample Careers Accountant Payroll Clerk
Banking Services » Sample Careers Loan Officer Teller Debt Counselor Customer Service Representative
Business Finance » Sample Careers Economist Financial Analyst Controller
Insurance » Sample Careers Claims Agent Insurance Appraiser Underwriter Sales Agent
Securities and Investments » Sample Careers Personal Financial Advisor Tax Preparer Investment Advisor
25
Percent Who Continued Their Education
20.7%
---Graduates: The First Year---Number of Awards ConferredAY11-AY15
80
2016 Median Adjusted
Annual Salary
$23,932
Percent Employed Among Those Who Are Not Continuing Education
92.3%Source: Education Outcomes, AY11-AY15; Iowa Department of EducationNote: information represents community college speci�c outcomes. Salary information is only included for graduates who are not continuing education.
26
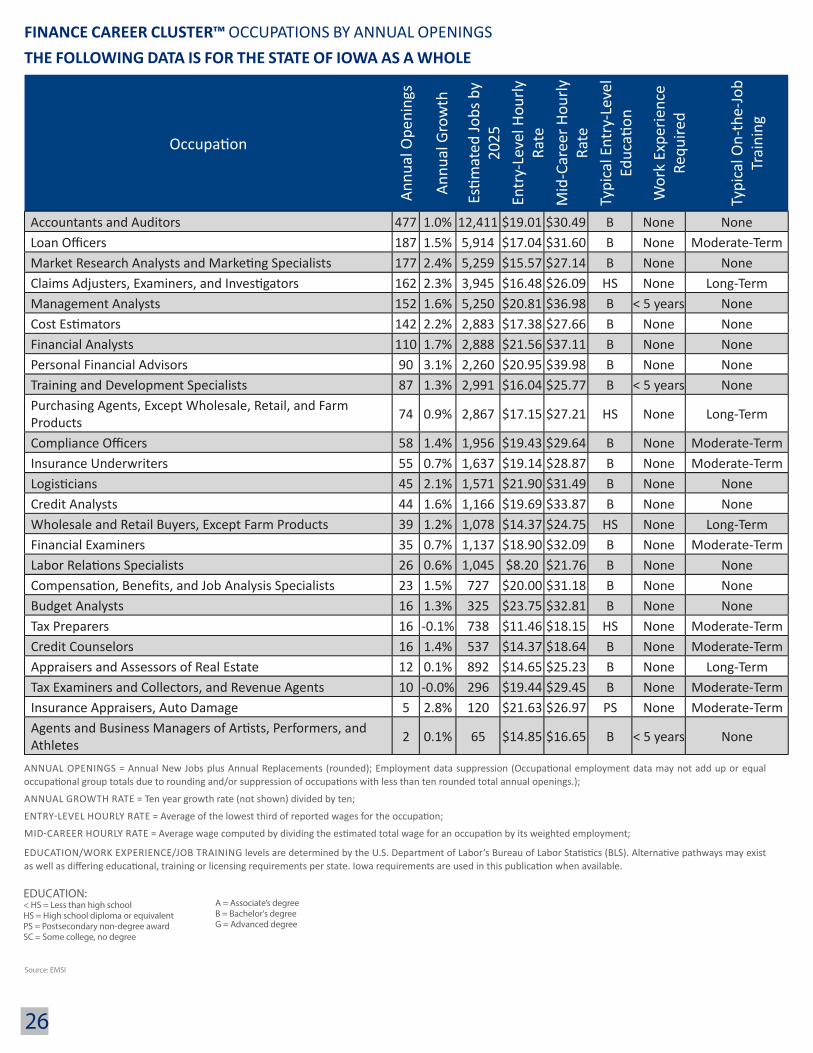
FINANCE CAREER CLUSTER™ OCCUPATIONS BY ANNUAL OPENINGS
ANNUAL OPENINGS = Annual New Jobs plus Annual Replacements (rounded); Employment data suppression (Occupational employment data may not add up or equal occupational group totals due to rounding and/or suppression of occupations with less than ten rounded total annual openings.);
ANNUAL GROWTH RATE = Ten year growth rate (not shown) divided by ten;
ENTRY-LEVEL HOURLY RATE = Average of the lowest third of reported wages for the occupation;
MID-CAREER HOURLY RATE = Average wage computed by dividing the estimated total wage for an occupation by its weighted employment;
EDUCATION/WORK EXPERIENCE/JOB TRAINING levels are determined by the U.S. Department of Labor’s Bureau of Labor Statistics (BLS). Alternative pathways may exist as well as differing educational, training or licensing requirements per state. Iowa requirements are used in this publication when available.
Source: EMSI
Occupation
Annu
al O
peni
ngs
Annu
al G
row
th
Estim
ated
Jobs
by
2025
Entr
y-Le
vel H
ourly
Ra
teM
id-C
aree
r Hou
rly
Rate
Typi
cal E
ntry
-Lev
el
Educ
ation
Wor
k Ex
perie
nce
Requ
ired
Typi
cal O
n-th
e-Jo
b Tr
aini
ng
Accountants and Auditors 477 1.0% 12,411 $19.01 $30.49 B None NoneLoan Officers 187 1.5% 5,914 $17.04 $31.60 B None Moderate-TermMarket Research Analysts and Marketing Specialists 177 2.4% 5,259 $15.57 $27.14 B None NoneClaims Adjusters, Examiners, and Investigators 162 2.3% 3,945 $16.48 $26.09 HS None Long-TermManagement Analysts 152 1.6% 5,250 $20.81 $36.98 B < 5 years NoneCost Estimators 142 2.2% 2,883 $17.38 $27.66 B None NoneFinancial Analysts 110 1.7% 2,888 $21.56 $37.11 B None NonePersonal Financial Advisors 90 3.1% 2,260 $20.95 $39.98 B None NoneTraining and Development Specialists 87 1.3% 2,991 $16.04 $25.77 B < 5 years NonePurchasing Agents, Except Wholesale, Retail, and Farm Products 74 0.9% 2,867 $17.15 $27.21 HS None Long-Term
Compliance Officers 58 1.4% 1,956 $19.43 $29.64 B None Moderate-TermInsurance Underwriters 55 0.7% 1,637 $19.14 $28.87 B None Moderate-TermLogisticians 45 2.1% 1,571 $21.90 $31.49 B None NoneCredit Analysts 44 1.6% 1,166 $19.69 $33.87 B None NoneWholesale and Retail Buyers, Except Farm Products 39 1.2% 1,078 $14.37 $24.75 HS None Long-TermFinancial Examiners 35 0.7% 1,137 $18.90 $32.09 B None Moderate-TermLabor Relations Specialists 26 0.6% 1,045 $8.20 $21.76 B None NoneCompensation, Benefits, and Job Analysis Specialists 23 1.5% 727 $20.00 $31.18 B None NoneBudget Analysts 16 1.3% 325 $23.75 $32.81 B None NoneTax Preparers 16 -0.1% 738 $11.46 $18.15 HS None Moderate-TermCredit Counselors 16 1.4% 537 $14.37 $18.64 B None Moderate-TermAppraisers and Assessors of Real Estate 12 0.1% 892 $14.65 $25.23 B None Long-TermTax Examiners and Collectors, and Revenue Agents 10 -0.0% 296 $19.44 $29.45 B None Moderate-TermInsurance Appraisers, Auto Damage 5 2.8% 120 $21.63 $26.97 PS None Moderate-TermAgents and Business Managers of Artists, Performers, and Athletes 2 0.1% 65 $14.85 $16.65 B < 5 years None
EDUCATION:< HS = Less than high schoolHS = High school diploma or equivalentPS = Postsecondary non-degree awardSC = Some college, no degree
A = Associate’s degreeB = Bachelor's degreeG = Advanced degree
THE FOLLOWING DATA IS FOR THE STATE OF IOWA AS A WHOLE

27
North Iowa Area Community College PROGRAMS OF STUDY
• ACCOUNTING - TRANSFER• INSURANCE & FINANCIAL MANAGEMENT• FINANCE - TRANSFER
SUGGESTED HIGH SCHOOL COURSES
• ACCOUNTING• BUSINESS EDUCATION• COMMUNICATION• COMPUTER APPLICATIONS• ECONOMICS• ENGLISH/COMPOSITION• FOREIGN LANGUAGE• MATH• PRE-EMPLOYMENT STRATEGIES• STATISTICS
THE ACCOUNTING PROGRAM AND COURSES I’VE TAKEN ARE REALLY
PREPARING ME FOR MY FUTURE. MY INSTRUCTORS HAVE DONE A GREAT JOB OF TEACHING, GETTING ME READY FOR
HIGHER LEVEL COURSES AT A UNIVERSITY, AND EVENTUALLY A FULL-TIME JOB.
---RACHEL
“
”

Planning, managing, and providing therapeutic services, diagnostic services, health informatics, support services, and biotechnology research and development.
Biotechnology Research and Development » Sample Careers Biochemist Cell Biologist Lab Technician Research Assistant Toxicologist
Diagnostic Services » Sample Careers Clinical Lab Technician Electrocardiographic (ECG) Technician Electronic Diagnostic (EEG) Technologist Geneticist Nutritionist Phlebotomist Radiologist
Health Informatics » Sample Careers Registration Clerk Unit Coordinator Health Information Coder Medical Biller Medical Reimbursement Specialist Clinical Data Analyst Public Health Educator Transcriptionist Medical Documentation Specialist Health Information Software Specialist
Therapeutic Services » Sample Careers Physician Physician Assistant Athletic Trainer Chiropractor Dental Assistant Dietician Massage Therapist Paramedic Registered Nurse Licensed Practical Nurse Respiratory Therapist Physical Therapist Counselor Social Worker Veterinarian Support Services » Sample Careers Environmental Services Facilities Manager Food Service Materials Manager
28
Percent Who Continued Their Education
51.2%
---Graduates: The First Year---Number of Awards ConferredAY11-AY15
1,705
2016 Median Adjusted
Annual Salary
$23,491
Percent Employed Among Those Who Are Not Continuing Education
93.5%Source: Education Outcomes, AY11-AY15; Iowa Department of EducationNote: information represents community college speci�c outcomes. Salary information is only included for graduates who are not continuing education.
29
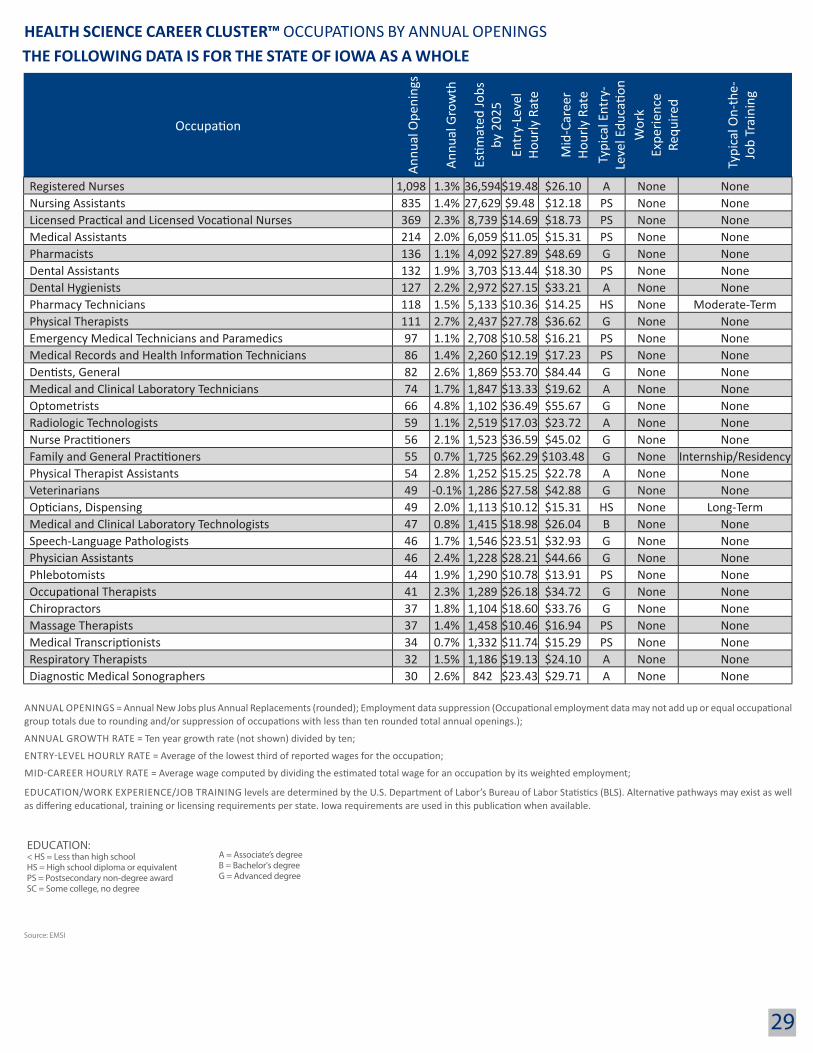
HEALTH SCIENCE CAREER CLUSTER™ OCCUPATIONS BY ANNUAL OPENINGS
Source: EMSI
ANNUAL OPENINGS = Annual New Jobs plus Annual Replacements (rounded); Employment data suppression (Occupational employment data may not add up or equal occupational group totals due to rounding and/or suppression of occupations with less than ten rounded total annual openings.);
ANNUAL GROWTH RATE = Ten year growth rate (not shown) divided by ten;
ENTRY-LEVEL HOURLY RATE = Average of the lowest third of reported wages for the occupation;
MID-CAREER HOURLY RATE = Average wage computed by dividing the estimated total wage for an occupation by its weighted employment;
EDUCATION/WORK EXPERIENCE/JOB TRAINING levels are determined by the U.S. Department of Labor’s Bureau of Labor Statistics (BLS). Alternative pathways may exist as well as differing educational, training or licensing requirements per state. Iowa requirements are used in this publication when available.
Occupation
Annu
al O
peni
ngs
Annu
al G
row
th
Estim
ated
Jobs
by
202
5En
try-
Leve
l Ho
urly
Rat
e
Mid
-Car
eer
Hour
ly R
ate
Typi
cal E
ntry
-Le
vel E
duca
tion
Wor
k Ex
perie
nce
Requ
ired
Typi
cal O
n-th
e-Jo
b Tr
aini
ng
Registered Nurses 1,098 1.3% 36,594$19.48 $26.10 A None NoneNursing Assistants 835 1.4% 27,629 $9.48 $12.18 PS None NoneLicensed Practical and Licensed Vocational Nurses 369 2.3% 8,739 $14.69 $18.73 PS None NoneMedical Assistants 214 2.0% 6,059 $11.05 $15.31 PS None NonePharmacists 136 1.1% 4,092 $27.89 $48.69 G None NoneDental Assistants 132 1.9% 3,703 $13.44 $18.30 PS None NoneDental Hygienists 127 2.2% 2,972 $27.15 $33.21 A None NonePharmacy Technicians 118 1.5% 5,133 $10.36 $14.25 HS None Moderate-TermPhysical Therapists 111 2.7% 2,437 $27.78 $36.62 G None NoneEmergency Medical Technicians and Paramedics 97 1.1% 2,708 $10.58 $16.21 PS None NoneMedical Records and Health Information Technicians 86 1.4% 2,260 $12.19 $17.23 PS None NoneDentists, General 82 2.6% 1,869 $53.70 $84.44 G None NoneMedical and Clinical Laboratory Technicians 74 1.7% 1,847 $13.33 $19.62 A None NoneOptometrists 66 4.8% 1,102 $36.49 $55.67 G None NoneRadiologic Technologists 59 1.1% 2,519 $17.03 $23.72 A None NoneNurse Practitioners 56 2.1% 1,523 $36.59 $45.02 G None NoneFamily and General Practitioners 55 0.7% 1,725 $62.29 $103.48 G None Internship/ResidencyPhysical Therapist Assistants 54 2.8% 1,252 $15.25 $22.78 A None NoneVeterinarians 49 -0.1% 1,286 $27.58 $42.88 G None NoneOpticians, Dispensing 49 2.0% 1,113 $10.12 $15.31 HS None Long-TermMedical and Clinical Laboratory Technologists 47 0.8% 1,415 $18.98 $26.04 B None NoneSpeech-Language Pathologists 46 1.7% 1,546 $23.51 $32.93 G None NonePhysician Assistants 46 2.4% 1,228 $28.21 $44.66 G None NonePhlebotomists 44 1.9% 1,290 $10.78 $13.91 PS None NoneOccupational Therapists 41 2.3% 1,289 $26.18 $34.72 G None NoneChiropractors 37 1.8% 1,104 $18.60 $33.76 G None NoneMassage Therapists 37 1.4% 1,458 $10.46 $16.94 PS None NoneMedical Transcriptionists 34 0.7% 1,332 $11.74 $15.29 PS None NoneRespiratory Therapists 32 1.5% 1,186 $19.13 $24.10 A None NoneDiagnostic Medical Sonographers 30 2.6% 842 $23.43 $29.71 A None None
EDUCATION:< HS = Less than high schoolHS = High school diploma or equivalentPS = Postsecondary non-degree awardSC = Some college, no degree
A = Associate’s degreeB = Bachelor's degreeG = Advanced degree
THE FOLLOWING DATA IS FOR THE STATE OF IOWA AS A WHOLE
Source: Education Outcomes, AY11-AY15; Iowa Department of EducationNote: information represents community college speci�c outcomes. Salary information is only included for graduates who are not continuing education.

North Iowa Area Community College PROGRAMS OF STUDY
• ADVANCED EMERGENCY MEDICAL TECHNICIAN• CHIROPRACTIC - TRANSFER• DENTAL HYGIENE - TRANSFER• DENTISTRY - TRANSFER• EMERGENCY MEDICAL RESPONDER• EMERGENCY MEDICAL TECHNICIAN• EXERCISE SCIENCE - TRANSFER• HEALTH PROMOTION/COMMUNITY HEALTH -
TRANSFER• MEDICAL ASSISTANT• MEDICAL LABORATORY TECHNICIAN• MEDICAL ADMINISTRATIVE ASSISTANT• MEDICAL TECHNOLOGY - TRANSFER• MEDICINE - TRANSFER• MORTUARY SCIENCE - TRANSFER• NURSE AIDE (CNA)• NURSING-BACHELORS DEGREE (BSN) - TRANSFER• NURSING-ASSOCIATE DEGREE (RN)• NURSING-PRACTICAL NURSING (LPN)• OCCUPATIONAL THERAPY - TRANSFER• OPTOMETRY - TRANSFER• PHARMACY - TRANSFER• PHARMACY TECHNICIAN• PHYSICAL FITNESS & WELLNESS - CERTIFICATE• PHYSICAL FITNESS & WELLNESS - DIPLOMA• PHYSICAL FITNESS & WELLNESS - TRANSFER• PHYSICAL THERAPY - TRANSFER• PHYSICAL THERAPY ASSISTANT• PHYSICIAN ASSISTANT - TRANSFER• PSYCHOLOGY - TRANSFER• RADIOLOGIC TECHNOLOGY• RADIOLOGY - TRANSFER
SUGGESTED HIGH SCHOOL COURSES
• ANATOMY & PHYSIOLOGY• COMMUNICATION & ENGLISH/COMPOSITION• FAMILY & CONSUMER SCIENCE• FIRST AID/CPR• FOREIGN LANGUAGE• LABORATORY SCIENCE• MATH • MEDICAL TERMINOLOGY• NUTRITION• PRE-EMPLOYMENT STRATEGIES• STATISTICS
WHEN I CHOSE TO GO TO NIACC, I KNEW I WANTED TO MAJOR IN
EITHER NURSING OR RADIOLOGY. TAKING SEVERAL DIFFERENT CLASSES HELPED ME DECIDE THAT RADIOLOGY
WAS THE BEST PATH FOR ME.
---PAIGE
“
”
30

Preparing individuals for employment in career pathways that relate to families and human needs.
Consumer Services » Sample Careers Consumer Credit Counselor Banker Customer Service Representative Inside Sales Representative Buyer
Counseling and Mental Health Services » Sample Careers School Counselor/Psychologist Substance Abuse and Behavioral Disorder Counselor Marriage, Child, and Family Counselor Early Childhood Development and Services » Sample Careers Childcare Facility Director Preschool Teacher Nanny Teacher Assistant Childcare Worker
Family and Community Services » Sample Careers Adult Day Care Coordinator Religious Leader Human Services Worker Social Services Worker Vocational Rehabilitation Counselor
Personal Care Services » Sample Careers Cosmetologist Manicurist and Pedicurist Esthetician Massage Therapist Funeral Director Spa Attendant
31

32
HUMAN SERVICES CAREER CLUSTER™ OCCUPATIONS BY ANNUAL OPENINGS
ANNUAL OPENINGS = Annual New Jobs plus Annual Replacements (rounded); Employment data suppression (Occupational employment data may not add up or equal occupational group totals due to rounding and/or suppression of occupations with less than ten rounded total annual openings.);
ANNUAL GROWTH RATE = Ten year growth rate (not shown) divided by ten;
ENTRY-LEVEL HOURLY RATE = Average of the lowest third of reported wages for the occupation;
MID-CAREER HOURLY RATE = Average wage computed by dividing the estimated total wage for an occupation by its weighted employment;
EDUCATION/WORK EXPERIENCE/JOB TRAINING levels are determined by the U.S. Department of Labor’s Bureau of Labor Statistics (BLS). Alternative pathways may exist as well as differing educational, training or licensing requirements per state. Iowa requirements are used in this publication when available.
Source: EMSI
Occupation
Annu
al O
peni
ngs
Annu
al G
row
th
Estim
ated
Jobs
by
2025
Entr
y-Le
vel H
ourly
Ra
teM
id-C
aree
r Hou
rly
Rate
Typi
cal E
ntry
-Lev
el
Educ
ation
Wor
k Ex
perie
nce
Requ
ired
Typi
cal O
n-th
e-Jo
b Tr
aini
ng
Childcare Workers 958 1.4% 24,060 $7.37 $8.47 HS None Short-TermHairdressers, Hairstylists, and Cosmetologists 359 1.4% 10,324 $9.35 $11.66 PS None NoneSocial and Human Service Assistants 221 1.4% 6,008 $9.09 $14.27 HS None Short-TermChild, Family, and School Social Workers 140 1.3% 4,387 $13.05 $20.84 B None NoneClergy 129 1.9% 3,631 $12.00 $21.81 B None Moderate-TermFitness Trainers and Aerobics Instructors 114 1.8% 4,243 $8.53 $12.54 HS None Short-TermRecreation Workers 105 1.5% 4,226 $8.08 $11.63 B None NoneResidential Advisors 90 1.5% 1,667 $8.79 $12.70 HS None Short-TermEducational, Guidance, School, and Vocational Counselors 87 1.0% 2,955 $14.37 $23.85 G None None
Mental Health Counselors 73 2.0% 1,966 $11.77 $19.25 G None Internship/ResidencyFirst-Line Supervisors of Personal Service Workers 70 0.9% 2,302 $10.40 $15.06 HS < 5 years NoneDirectors, Religious Activities and Education 69 1.0% 1,659 $10.61 $21.42 B < 5 years NoneHealthcare Social Workers 69 1.8% 1,924 $16.22 $23.12 G None NoneRehabilitation Counselors 68 0.8% 2,498 $10.85 $17.34 G None NoneSubstance Abuse and Behavioral Disorder Counselors 59 1.7% 1,691 $13.22 $20.83 HS None Moderate-TermMental Health and Substance Abuse Social Workers 43 1.8% 1,200 $13.46 $20.31 B None NoneBarbers 31 1.3% 840 $7.23 $8.40 PS None NoneCommunity Health Workers 27 1.8% 669 $9.35 $15.13 HS None Short-TermHealth Educators 25 1.6% 641 $17.65 $27.10 B None NoneAnimal Trainers 20 -1.5% 357 $10.72 $13.23 HS None Moderate-TermMorticians, Undertakers, and Funeral Directors 18 1.2% 563 $14.73 $26.77 A None Long-TermMarriage and Family Therapists 16 2.8% 379 $13.21 $20.69 G None Internship/ResidencyProbation Officers and Correctional Treatment Specialists 16 0.0% 581 $20.82 $30.61 B None Short-Term
Funeral Attendants 15 0.4% 606 $8.29 $10.75 HS None Short-TermManicurists and Pedicurists 10 0.9% 612 $7.60 $9.83 PS None NoneLocker Room, Coatroom, and Dressing Room Attendants 10 1.9% 151 $8.36 $9.32 HS None Short-Term
Skincare Specialists 9 1.8% 386 $9.66 $13.56 PS None NoneSlot Supervisors 7 0.2% 290 $10.08 $16.73 HS < 5 years None
EDUCATION:< HS = Less than high schoolHS = High school diploma or equivalentPS = Postsecondary non-degree awardSC = Some college, no degree
A = Associate’s degreeB = Bachelor's degreeG = Advanced degree
THE FOLLOWING DATA IS FOR THE STATE OF IOWA AS A WHOLE

North Iowa Area Community College PROGRAMS OF STUDY
• HUMAN SERVICES - TRANSFER• SOCIAL WORK - TRANSFER• SOCIOLOGY - TRANSFER
SUGGESTED HIGH SCHOOL COURSES
• BUSINESS EDUCATION• COMMUNICATION• COMPUTER APPLICATIONS• FAMILY & CONSUMER SCIENCE• FOREIGN LANGUAGE• PRE-EMPLOYMENT STRATEGIES
33
TAKING THE PSYCHOLOGY AND SOCIOLOGY CLASSES NEEDED FOR MY
HUMAN SERVICES MAJOR HAS MADE ME REALIZE I AM ON THE RIGHT TRACK FOR
MY FUTURE.---DORY
“”

Building linkages in IT occupations framework: for entry-level, technical and professional careers related to the design, development, support, and management of hardware, software multimedia, and systems integration services.
Information Support and Services » Sample Careers Data Administrator Database Developer Systems Analyst Technical Editor Help Desk Specialist E-business Specialist
Network Systems » Sample Careers Communication Analyst Network Administrator PC Support Specialist Systems Administrator Technical Support Specialist
Web and Digital Communications » Sample Careers Animator Applications Engineer Multimedia Developer Programmer Software Applications Specialist Test Engineer Web Designer Web Site Developer Webmaster
34
Percent Who Continued Their Education
18.1%
---Graduates: The First Year---Number of Awards ConferredAY11-AY15
82
2016 Median Adjusted
Annual Salary
$26,430
Percent Employed Among Those Who Are Not Continuing Education
88.2%Source: Education Outcomes, AY11-AY15; Iowa Department of EducationNote: information represents community college speci�c outcomes. Salary information is only included for graduates who are not continuing education.

Source: Education Outcomes, AY11-AY15; Iowa Department of EducationNote: information represents community college speci�c outcomes. Salary information is only included for graduates who are not continuing education.
35
INFORMATION TECHNOLOGY CAREER CLUSTER™ OCCUPATIONS BY ANNUAL OPENINGS
ANNUAL OPENINGS = Annual New Jobs plus Annual Replacements (rounded); Employment data suppression (Occupational employment data may not add up or equal occupational group totals due to rounding and/or suppression of occupations with less than ten rounded total annual openings.);
ANNUAL GROWTH RATE = Ten year growth rate (not shown) divided by ten;
ENTRY-LEVEL HOURLY RATE = Average of the lowest third of reported wages for the occupation;
MID-CAREER HOURLY RATE = Average wage computed by dividing the estimated total wage for an occupation by its weighted employment;
EDUCATION/WORK EXPERIENCE/JOB TRAINING levels are determined by the U.S. Department of Labor’s Bureau of Labor Statistics (BLS). Alternative pathways may exist as well as differing educational, training or licensing requirements per state. Iowa requirements are used in this publication when available.
Source: EMSI
Occupation
Annu
al O
peni
ngs
Annu
al G
row
th
Estim
ated
Jobs
by
2025
Entr
y-Le
vel H
ourly
Ra
teM
id-C
aree
r Hou
rly
Rate
Typi
cal E
ntry
-Lev
el
Educ
ation
Wor
k Ex
perie
nce
Requ
ired
Typi
cal O
n-th
e-Jo
b Tr
aini
ng
Computer Systems Analysts 262 2.4% 7,407 $23.36 $36.46 B None NoneSoftware Developers, Applications 257 1.8% 9,363 $25.61 $38.21 B None NoneComputer User Support Specialists 176 2.1% 5,342 $11.72 $20.58 SC None Moderate-TermNetwork and Computer Systems Administrators 114 1.2% 4,359 $20.68 $32.11 B None NoneComputer Programmers 99 2.1% 2,355 $20.40 $31.51 B None NoneSoftware Developers, Systems Software 97 2.4% 3,018 $32.09 $43.88 B None NoneWeb Developers 91 4.2% 1,965 $13.49 $25.27 A None NoneComputer Network Support Specialists 57 0.6% 2,672 $17.18 $25.97 A None NoneDatabase Administrators 40 1.5% 1,240 $22.46 $37.71 B < 5 years NoneComputer Network Architects 37 1.6% 1,157 $28.66 $42.38 B 5+ years NoneOperations Research Analysts 31 3.1% 683 $22.18 $34.53 B None NoneActuaries 29 2.6% 600 $27.61 $44.89 B None Long-TermInformation Security Analysts 28 3.5% 653 $22.14 $35.01 B < 5 years NoneStatisticians 11 2.9% 203 $24.39 $32.15 G None NoneComputer and Information Research Scientists 6 1.4% 208 $25.16 $38.00 G None None
EDUCATION:< HS = Less than high schoolHS = High school diploma or equivalentPS = Postsecondary non-degree awardSC = Some college, no degree
A = Associate’s degreeB = Bachelor's degreeG = Advanced degree
THE FOLLOWING DATA IS FOR THE STATE OF IOWA AS A WHOLE

36
North Iowa Area Community College PROGRAMS OF STUDY• BUSINESS TECHNOLOGY• COMPUTER SCIENCE - TRANSFER• INFORMATION ASSURANCE & SECURITY• INFORMATION TECHNOLOGY
SUGGESTED HIGH SCHOOL COURSES
• BUSINESS EDUCATION• COMMUNICATION• COMPUTER APPLICATIONS/COMPUTER SCIENCE• MATH• PRE-EMPLOYMENT STRATEGIES• WEBPAGE DESIGN
GROWING UP IN MASON CITY I NEVER THOUGHT THAT I WOULD LIVE IN THE DORMS AT NIACC, BUT IT WAS BY FAR MY BEST DECISION. I HAVE MADE SO
MANY NEW FRIENDS AND HAVE BEEN ABLE TO TRULY HAVE THE FULL COLLEGE
EXPERIENCE.
---PEYTON
“
”

Planning, managing, and providing legal, public safety, protective, and homeland security services, including professional and technical support services.
Correction Services » Sample Careers Jail Administrator Correctional Trainer Case Manager Probation Officer
Emergency and Fire Management Services » Sample Careers Emergency Management and Response Coordinator EMT Fire Fighter Dispatcher Rescue Worker Law Enforcement Services » Sample Careers Bailiff Criminal Investigator Game Enforcement Officer Sheriff Animal Control Officer
Legal Services » Sample Careers Attorney Investigator Legal Assistant Legal Secretary Mediator/Arbitrator
Security and Protective Services » Sample Careers Computer Forensics Specialist Loss Prevention Manager Armored Car Guard Security Officer Life Guard
37
Percent Who Continued Their Education
43.0%
---Graduates: The First Year---Number of Awards ConferredAY11-AY15
74
2016 Median Adjusted
Annual Salary
$23,707
Percent Employed Among Those Who Are Not Continuing Education
95.6%Source: Education Outcomes, AY11-AY15; Iowa Department of EducationNote: information represents community college speci�c outcomes. Salary information is only included for graduates who are not continuing education.

38
LAW, PUBLIC SAFETY, CORRECTIONS, AND SECURITY CAREER CLUSTER™ OCCUPATIONS BY ANNUAL OPENINGS
ANNUAL OPENINGS = Annual New Jobs plus Annual Replacements (rounded); Employment data suppression (Occupational employment data may not add up or equal occupational group totals due to rounding and/or suppression of occupations with less than ten rounded total annual openings.);
ANNUAL GROWTH RATE = Ten year growth rate (not shown) divided by ten;
ENTRY-LEVEL HOURLY RATE = Average of the lowest third of reported wages for the occupation;
MID-CAREER HOURLY RATE = Average wage computed by dividing the estimated total wage for an occupation by its weighted employment;
EDUCATION/WORK EXPERIENCE/JOB TRAINING levels are determined by the U.S. Department of Labor’s Bureau of Labor Statistics (BLS). Alternative pathways may exist as well as differing educational, training or licensing requirements per state. Iowa requirements are used in this publication when available.
Source: EMSI
Occupation
Annu
al O
peni
ngs
Annu
al G
row
th
Estim
ated
Jobs
by
2025
Entr
y-Le
vel H
ourly
Ra
teM
id-C
aree
r Hou
rly
Rate
Typi
cal E
ntry
-Lev
el
Educ
ation
Wor
k Ex
perie
nce
Requ
ired
Typi
cal O
n-th
e-Jo
b Tr
aini
ng
Security Guards 234 1.4% 8,627 $9.05 $15.39 HS None Short-TermPolice and Sheriff’s Patrol Officers 210 0.6% 5,760 $17.75 $26.00 HS None Moderate-TermLifeguards, Ski Patrol, and Other Recreational Protective Service Workers 167 1.3% 2,173 $7.86 $8.81 HS None Short-Term
Correctional Officers and Jailers 101 0.3% 3,464 $15.86 $22.72 HS None Moderate-TermFirefighters 63 0.6% 1,971 $10.10 $18.81 PS None Long-TermFirst-Line Supervisors of Police and Detectives 29 0.5% 846 $23.83 $34.65 HS < 5 years Moderate-TermFirst-Line Supervisors of Fire Fighting and Prevention Workers 23 0.6% 488 $23.06 $32.65 PS < 5 years Moderate-TermDetectives and Criminal Investigators 14 0.3% 578 $23.36 $35.65 HS < 5 years Moderate-TermFirst-Line Supervisors of Correctional Officers 11 0.3% 281 $23.63 $32.37 HS < 5 years Moderate-TermCrossing Guards 6 0.2% 377 $10.42 $13.53 HS None Short-TermPrivate Detectives and Investigators 6 0.7% 135 $17.76 $24.75 HS < 5 years Moderate-TermTransportation Security Screeners 5 0.5% 187 $15.39 $17.60 HS None Short-TermGaming Surveillance Officers and Gaming Investigators 4 -0.1% 269 $10.87 $16.06 HS None Short-TermFish and Game Wardens 4 0.2% 137 $18.83 $28.06 HS None Short-TermFire Inspectors and Investigators 3 0.7% 78 $16.68 $27.04 HS 5+ years Moderate-TermAnimal Control Workers 2 0.5% 87 $9.99 $17.06 HS None Moderate-TermParking Enforcement Workers 2 0.5% 73 $15.69 $19.80 HS None Short-TermBailiffs 2 0.7% 57 $14.10 $21.59 HS None Moderate-Term
EDUCATION:< HS = Less than high schoolHS = High school diploma or equivalentPS = Postsecondary non-degree awardSC = Some college, no degree
A = Associate’s degreeB = Bachelor's degreeG = Advanced degree
THE FOLLOWING DATA IS FOR THE STATE OF IOWA AS A WHOLE

North Iowa Area Community College PROGRAMS OF STUDY• CRIMINAL JUSTICE - TRANSFER• LAW - TRANSFER• LEGAL OFFICE ASSOCIATE
SUGGESTED HIGH SCHOOL COURSES
• BUSINESS EDUCATION• COMMUNICATION• COMPUTER APPLICATIONS/COMPUTER SCIENCE• ENGLISH/COMPOSITION• FOREIGN LANGUAGE• LAW• MATH• PRE-EMPLOYMENT STRATEGIES• PSYCHOLOGY/SOCIOLOGY/SOCIAL STUDIES
39
NIACC’S STAFF, STUDENTS AND FACULTY HAVE MADE THIS A GREAT PLACE TO
GET YOUR EDUCATION. BEING AN INTERNATIONAL STUDENT AND TAKING
COURSES IN CRIMINAL JUSTICE HAS BEEN A GREAT WAY TO BROADEN MY
PERSPECTIVE ON WHAT I WANT TO DO SOMEDAY.
---JULIAN
“
”

Planning, managing, and performing the processing of materials into intermediate or �nal products and related professional and technical support activities such as production planning and control, maintenance, and manufacturing/process engineering.
Health, Safety, and Environmental Assurance » Sample Careers Environmental Engineer Safety Coordinator Safety Team Leader
Logistics and Inventory Control » Sample Careers Transportation Manager Industrial Truck Operator Logistical Engineer Material Handler Traffic Manager Shipping and Receiving Clerk
Maintenance, Installation, and Repair » Sample Careers Facility Electrician Industrial Maintenance Mechanic Maintenance Repairer Manufacturing Production Process Development » Sample Careers Design Engineer Electronics Engineer Industrial Engineer Manufacturing Technician Production Manager
Production » Sample Careers Assembler Machine Operator Electrical Installer Production Associate Sheet Metal Worker Tool and Die Maker Welder Quality Assurance » Sample Careers Calibration Technician Inspector Quality Control Technician Process Technician
40
Percent Who Continued Their Education
31.9%
---Graduates: The First Year---Number of Awards ConferredAY11-AY15
184
2016 Median Adjusted
Annual Salary
$37,784
Percent Employed Among Those Who Are Not Continuing Education
93.7%Source: Education Outcomes, AY11-AY15; Iowa Department of EducationNote: information represents community college speci�c outcomes. Salary information is only included for graduates who are not continuing education.

Source: Education Outcomes, AY11-AY15; Iowa Department of EducationNote: information represents community college specific outcomes. Salary information is only included for graduates who are not continuing education.
North Iowa Area Community College PROGRAMS OF STUDY• GENERAL MACHINIST• INDUSTRIAL SYSTEMS TECHNOLOGY• INDUSTRIAL TECHNOLOGY• TOOL & DIE TECHNOLOGY• WELDING
SUGGESTED HIGH SCHOOL COURSES
• BUSINESS EDUCATION• COMMUNICATION• COMPUTER APPLICATIONS• ENGLISH/COMPOSITION• FOREIGN LANGUAGE• INDUSTRIAL TECHNOLOGY:
• ELECTRICAL SYSTEMS, CONSTRUCTION, CABINETMAKING, POWER TECHNOLOGY, DRAFTING, INTRO TO ENGINEERING, MACHINE OPERATIONS, BLUEPRINT READING, WELDING, SAFETY, WOOD
• MATH:• TECHNICAL MATH, ALGEBRA, TRIGONOMETRY,
CALCULUS• PRE-EMPLOYMENT STRATEGIES• SCIENCE:
• TECHNICAL PHYSICS, CHEMISTRY
41
THE INSTRUCTORS IN THE INDUSTRIAL AREA ARE REALLY KNOWLEDGEABLE.
NOT ONLY DO THEY HELP YOU WITH THE PROJECTS YOU ARE WORKING ON BUT
THEY ALSO GUIDE YOU THROUGH REAL-WORLD ISSUES AND PREPARE YOU TO GET
A JOB WHEN YOU ARE DONE WITH THE PROGRAM. THEY ARE GREAT!
---JAMES
“
”
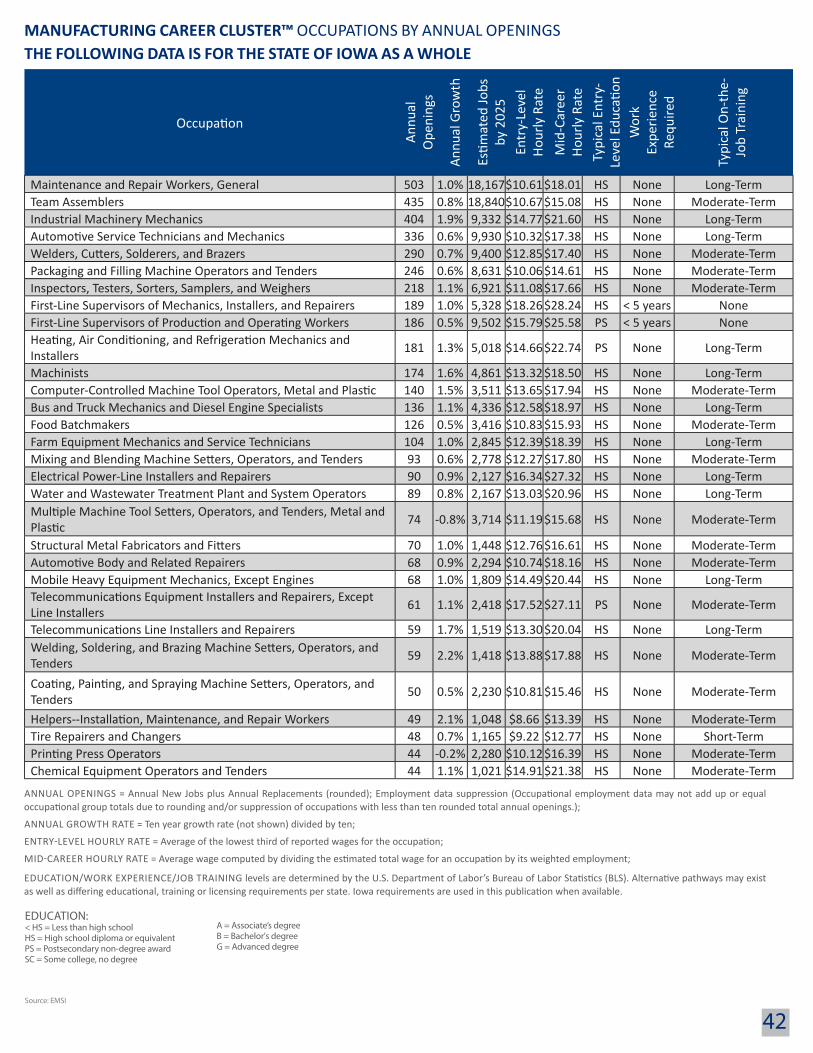
42
MANUFACTURING CAREER CLUSTER™ OCCUPATIONS BY ANNUAL OPENINGS
ANNUAL OPENINGS = Annual New Jobs plus Annual Replacements (rounded); Employment data suppression (Occupational employment data may not add up or equal occupational group totals due to rounding and/or suppression of occupations with less than ten rounded total annual openings.);
ANNUAL GROWTH RATE = Ten year growth rate (not shown) divided by ten;
ENTRY-LEVEL HOURLY RATE = Average of the lowest third of reported wages for the occupation;
MID-CAREER HOURLY RATE = Average wage computed by dividing the estimated total wage for an occupation by its weighted employment;
EDUCATION/WORK EXPERIENCE/JOB TRAINING levels are determined by the U.S. Department of Labor’s Bureau of Labor Statistics (BLS). Alternative pathways may exist as well as differing educational, training or licensing requirements per state. Iowa requirements are used in this publication when available.
Source: EMSI
Occupation
Annu
al
Ope
ning
s
Annu
al G
row
th
Estim
ated
Jobs
by
202
5En
try-
Leve
l Ho
urly
Rat
eM
id-C
aree
r Ho
urly
Rat
eTy
pica
l Ent
ry-
Leve
l Edu
catio
nW
ork
Expe
rienc
e Re
quire
d
Typi
cal O
n-th
e-Jo
b Tr
aini
ng
Maintenance and Repair Workers, General 503 1.0% 18,167$10.61$18.01 HS None Long-TermTeam Assemblers 435 0.8% 18,840$10.67$15.08 HS None Moderate-TermIndustrial Machinery Mechanics 404 1.9% 9,332 $14.77$21.60 HS None Long-TermAutomotive Service Technicians and Mechanics 336 0.6% 9,930 $10.32$17.38 HS None Long-TermWelders, Cutters, Solderers, and Brazers 290 0.7% 9,400 $12.85$17.40 HS None Moderate-TermPackaging and Filling Machine Operators and Tenders 246 0.6% 8,631 $10.06$14.61 HS None Moderate-TermInspectors, Testers, Sorters, Samplers, and Weighers 218 1.1% 6,921 $11.08$17.66 HS None Moderate-TermFirst-Line Supervisors of Mechanics, Installers, and Repairers 189 1.0% 5,328 $18.26$28.24 HS < 5 years NoneFirst-Line Supervisors of Production and Operating Workers 186 0.5% 9,502 $15.79$25.58 PS < 5 years NoneHeating, Air Conditioning, and Refrigeration Mechanics and Installers 181 1.3% 5,018 $14.66$22.74 PS None Long-Term
Machinists 174 1.6% 4,861 $13.32$18.50 HS None Long-TermComputer-Controlled Machine Tool Operators, Metal and Plastic 140 1.5% 3,511 $13.65$17.94 HS None Moderate-TermBus and Truck Mechanics and Diesel Engine Specialists 136 1.1% 4,336 $12.58$18.97 HS None Long-TermFood Batchmakers 126 0.5% 3,416 $10.83$15.93 HS None Moderate-TermFarm Equipment Mechanics and Service Technicians 104 1.0% 2,845 $12.39$18.39 HS None Long-TermMixing and Blending Machine Setters, Operators, and Tenders 93 0.6% 2,778 $12.27$17.80 HS None Moderate-TermElectrical Power-Line Installers and Repairers 90 0.9% 2,127 $16.34$27.32 HS None Long-TermWater and Wastewater Treatment Plant and System Operators 89 0.8% 2,167 $13.03$20.96 HS None Long-TermMultiple Machine Tool Setters, Operators, and Tenders, Metal and Plastic 74 -0.8% 3,714 $11.19$15.68 HS None Moderate-Term
Structural Metal Fabricators and Fitters 70 1.0% 1,448 $12.76$16.61 HS None Moderate-TermAutomotive Body and Related Repairers 68 0.9% 2,294 $10.74$18.16 HS None Moderate-TermMobile Heavy Equipment Mechanics, Except Engines 68 1.0% 1,809 $14.49$20.44 HS None Long-TermTelecommunications Equipment Installers and Repairers, Except Line Installers 61 1.1% 2,418 $17.52$27.11 PS None Moderate-Term
Telecommunications Line Installers and Repairers 59 1.7% 1,519 $13.30$20.04 HS None Long-TermWelding, Soldering, and Brazing Machine Setters, Operators, and Tenders 59 2.2% 1,418 $13.88$17.88 HS None Moderate-Term
Coating, Painting, and Spraying Machine Setters, Operators, and Tenders 50 0.5% 2,230 $10.81$15.46 HS None Moderate-Term
Helpers--Installation, Maintenance, and Repair Workers 49 2.1% 1,048 $8.66 $13.39 HS None Moderate-TermTire Repairers and Changers 48 0.7% 1,165 $9.22 $12.77 HS None Short-TermPrinting Press Operators 44 -0.2% 2,280 $10.12$16.39 HS None Moderate-TermChemical Equipment Operators and Tenders 44 1.1% 1,021 $14.91$21.38 HS None Moderate-Term
EDUCATION:< HS = Less than high schoolHS = High school diploma or equivalentPS = Postsecondary non-degree awardSC = Some college, no degree
A = Associate’s degreeB = Bachelor's degreeG = Advanced degree
THE FOLLOWING DATA IS FOR THE STATE OF IOWA AS A WHOLE
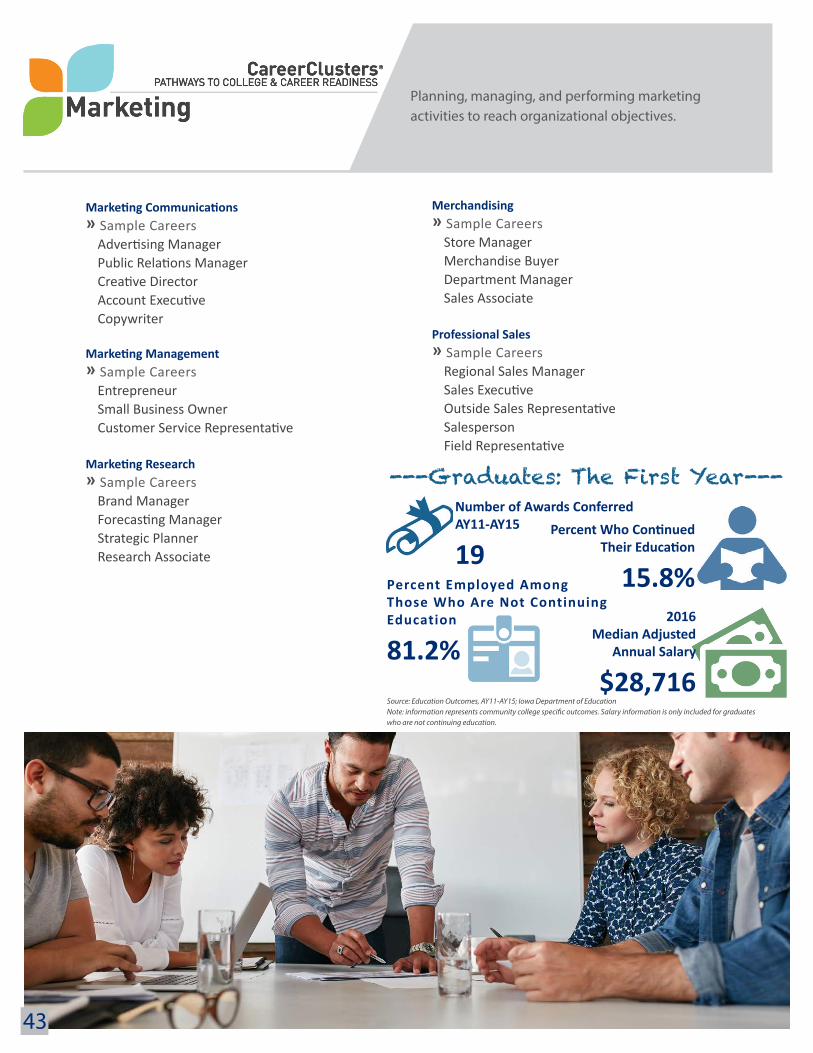
Planning, managing, and performing marketing activities to reach organizational objectives.
Marketing Communications » Sample Careers Advertising Manager Public Relations Manager Creative Director Account Executive Copywriter Marketing Management » Sample Careers Entrepreneur Small Business Owner Customer Service Representative Marketing Research » Sample Careers Brand Manager Forecasting Manager Strategic Planner Research Associate
Merchandising » Sample Careers Store Manager Merchandise Buyer Department Manager Sales Associate
Professional Sales » Sample Careers Regional Sales Manager Sales Executive Outside Sales Representative Salesperson Field Representative
43
Percent Who Continued Their Education
15.8%
---Graduates: The First Year---Number of Awards ConferredAY11-AY15
19
2016 Median Adjusted
Annual Salary
$28,716
Percent Employed Among Those Who Are Not Continuing Education
81.2%Source: Education Outcomes, AY11-AY15; Iowa Department of EducationNote: information represents community college speci�c outcomes. Salary information is only included for graduates who are not continuing education.
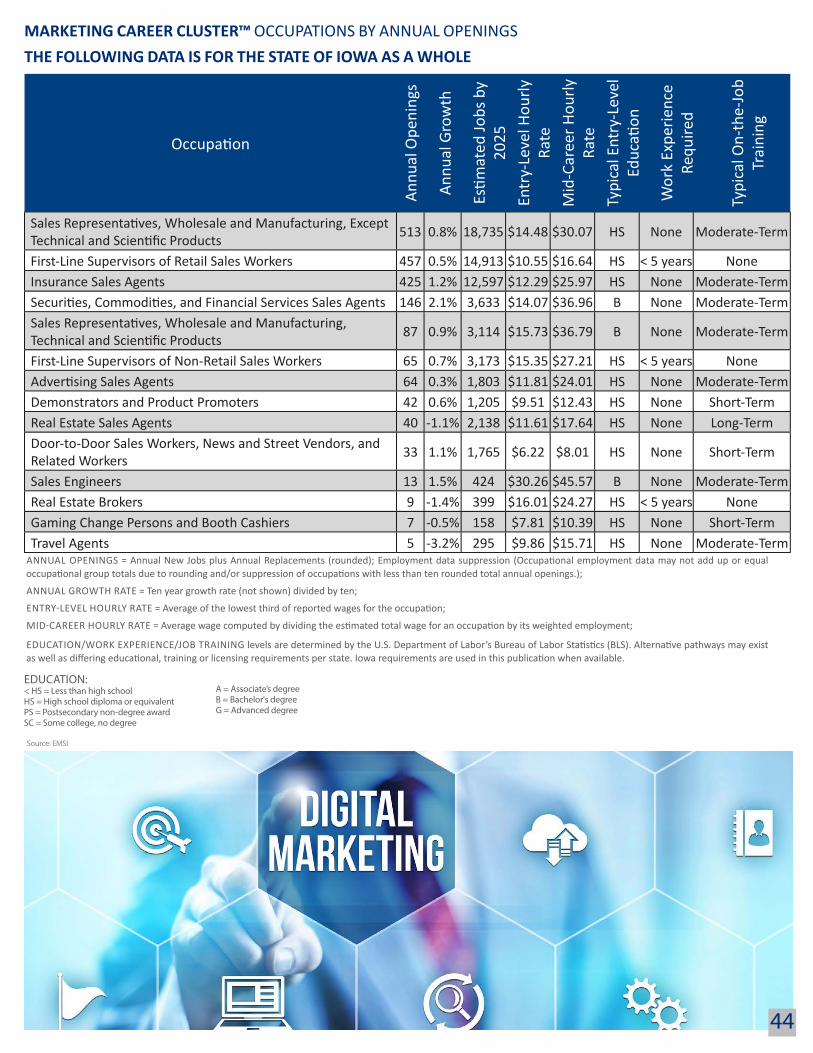
44
MARKETING CAREER CLUSTER™ OCCUPATIONS BY ANNUAL OPENINGS
ANNUAL OPENINGS = Annual New Jobs plus Annual Replacements (rounded); Employment data suppression (Occupational employment data may not add up or equal occupational group totals due to rounding and/or suppression of occupations with less than ten rounded total annual openings.);
ANNUAL GROWTH RATE = Ten year growth rate (not shown) divided by ten;
ENTRY-LEVEL HOURLY RATE = Average of the lowest third of reported wages for the occupation;
MID-CAREER HOURLY RATE = Average wage computed by dividing the estimated total wage for an occupation by its weighted employment;
EDUCATION/WORK EXPERIENCE/JOB TRAINING levels are determined by the U.S. Department of Labor’s Bureau of Labor Statistics (BLS). Alternative pathways may exist as well as differing educational, training or licensing requirements per state. Iowa requirements are used in this publication when available.
Source: EMSI
Occupation
Annu
al O
peni
ngs
Annu
al G
row
th
Estim
ated
Jobs
by
2025
Entr
y-Le
vel H
ourly
Ra
teM
id-C
aree
r Hou
rly
Rate
Typi
cal E
ntry
-Lev
el
Educ
ation
Wor
k Ex
perie
nce
Requ
ired
Typi
cal O
n-th
e-Jo
b Tr
aini
ng
Sales Representatives, Wholesale and Manufacturing, Except Technical and Scientific Products 513 0.8% 18,735 $14.48 $30.07 HS None Moderate-Term
First-Line Supervisors of Retail Sales Workers 457 0.5% 14,913 $10.55 $16.64 HS < 5 years NoneInsurance Sales Agents 425 1.2% 12,597 $12.29 $25.97 HS None Moderate-TermSecurities, Commodities, and Financial Services Sales Agents 146 2.1% 3,633 $14.07 $36.96 B None Moderate-TermSales Representatives, Wholesale and Manufacturing, Technical and Scientific Products 87 0.9% 3,114 $15.73 $36.79 B None Moderate-Term
First-Line Supervisors of Non-Retail Sales Workers 65 0.7% 3,173 $15.35 $27.21 HS < 5 years NoneAdvertising Sales Agents 64 0.3% 1,803 $11.81 $24.01 HS None Moderate-TermDemonstrators and Product Promoters 42 0.6% 1,205 $9.51 $12.43 HS None Short-TermReal Estate Sales Agents 40 -1.1% 2,138 $11.61 $17.64 HS None Long-TermDoor-to-Door Sales Workers, News and Street Vendors, and Related Workers 33 1.1% 1,765 $6.22 $8.01 HS None Short-Term
Sales Engineers 13 1.5% 424 $30.26 $45.57 B None Moderate-TermReal Estate Brokers 9 -1.4% 399 $16.01 $24.27 HS < 5 years NoneGaming Change Persons and Booth Cashiers 7 -0.5% 158 $7.81 $10.39 HS None Short-TermTravel Agents 5 -3.2% 295 $9.86 $15.71 HS None Moderate-Term
EDUCATION:< HS = Less than high schoolHS = High school diploma or equivalentPS = Postsecondary non-degree awardSC = Some college, no degree
A = Associate’s degreeB = Bachelor's degreeG = Advanced degree
THE FOLLOWING DATA IS FOR THE STATE OF IOWA AS A WHOLE

North Iowa Area Community College PROGRAMS OF STUDY• MARKETING & SALES• MARKETING - TRANSFER
SUGGESTED HIGH SCHOOL COURSES
• BUSINESS EDUCATION• COMMUNICATION• COMPUTER APPLICATIONS• ECONOMICS• ENGLISH/COMPOSITION• FOREIGN LANGUAGE• GRAPHIC ARTS• MARKETING• MATH• PRE-EMPLOYMENT STRATEGIES• PSYCHOLOGY
45
MY MARKETING CLASSES ARE EXACTLY WHAT I HOPED THEY WOULD BE. THEY
CHALLENGE ME AND I REALLY LIKE WORKING WITH OTHER STUDENTS ON
PROJECTS.
---TINA
“”

Planning, managing, and providing scienti�c research and professional and technical services (e.g. physical science, social science, engineering) including laboratory and testing services and research and development services.
Engineering and Technology » Sample Careers Electrician Civil Engineer Electronics Technician Manufacturing Technician Quality Technician
Science and Mathematics » Sample Careers Anthropologist Biologist Economist Nuclear Chemist Science Teacher Statistician
46
Percent Who Continued Their Education
26.3%
---Graduates: The First Year---Number of Awards ConferredAY11-AY15
19
2016 Median Adjusted
Annual Salary
$33,098
Percent Employed Among Those Who Are Not Continuing Education
92.9%Source: Education Outcomes, AY11-AY15; Iowa Department of EducationNote: information represents community college speci�c outcomes. Salary information is only included for graduates who are not continuing education.
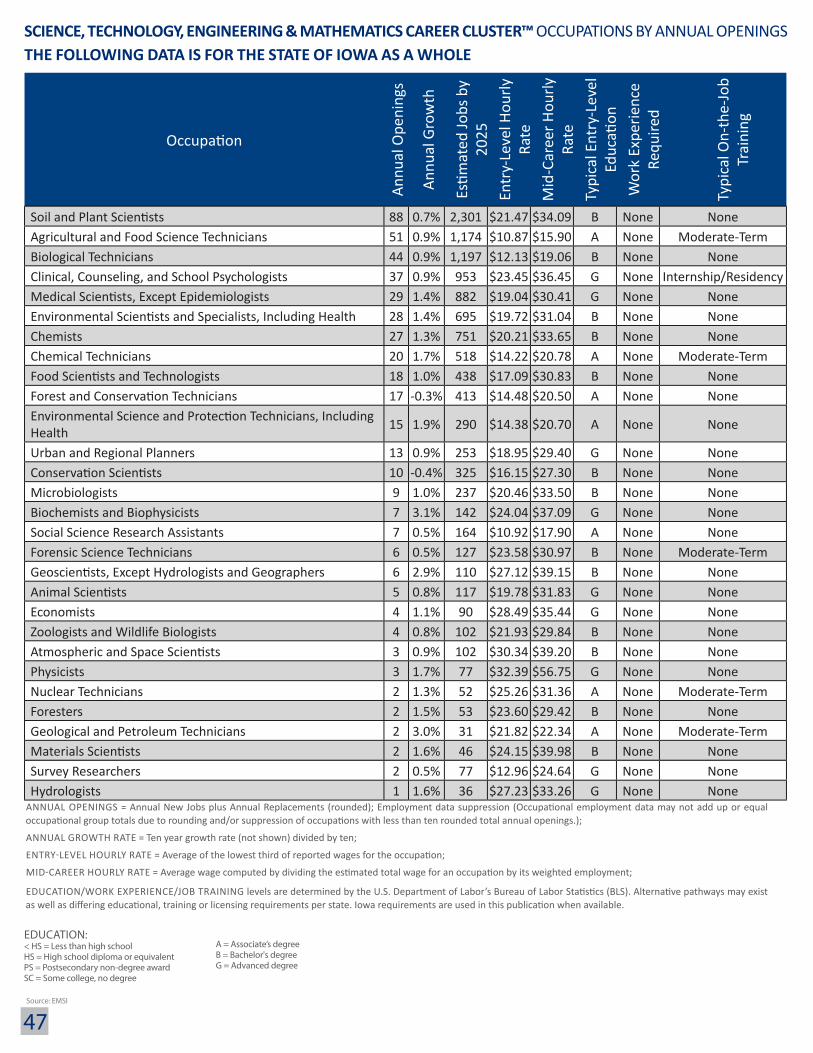
47
SCIENCE, TECHNOLOGY, ENGINEERING & MATHEMATICS CAREER CLUSTER™ OCCUPATIONS BY ANNUAL OPENINGS
ANNUAL OPENINGS = Annual New Jobs plus Annual Replacements (rounded); Employment data suppression (Occupational employment data may not add up or equal occupational group totals due to rounding and/or suppression of occupations with less than ten rounded total annual openings.);
ANNUAL GROWTH RATE = Ten year growth rate (not shown) divided by ten;
ENTRY-LEVEL HOURLY RATE = Average of the lowest third of reported wages for the occupation;
MID-CAREER HOURLY RATE = Average wage computed by dividing the estimated total wage for an occupation by its weighted employment;
EDUCATION/WORK EXPERIENCE/JOB TRAINING levels are determined by the U.S. Department of Labor’s Bureau of Labor Statistics (BLS). Alternative pathways may exist as well as differing educational, training or licensing requirements per state. Iowa requirements are used in this publication when available.
Source: EMSI
Occupation
Annu
al O
peni
ngs
Annu
al G
row
th
Estim
ated
Jobs
by
2025
Entr
y-Le
vel H
ourly
Ra
teM
id-C
aree
r Hou
rly
Rate
Typi
cal E
ntry
-Lev
el
Educ
ation
Wor
k Ex
perie
nce
Requ
ired
Typi
cal O
n-th
e-Jo
b Tr
aini
ng
Soil and Plant Scientists 88 0.7% 2,301 $21.47 $34.09 B None NoneAgricultural and Food Science Technicians 51 0.9% 1,174 $10.87 $15.90 A None Moderate-TermBiological Technicians 44 0.9% 1,197 $12.13 $19.06 B None NoneClinical, Counseling, and School Psychologists 37 0.9% 953 $23.45 $36.45 G None Internship/ResidencyMedical Scientists, Except Epidemiologists 29 1.4% 882 $19.04 $30.41 G None NoneEnvironmental Scientists and Specialists, Including Health 28 1.4% 695 $19.72 $31.04 B None NoneChemists 27 1.3% 751 $20.21 $33.65 B None NoneChemical Technicians 20 1.7% 518 $14.22 $20.78 A None Moderate-TermFood Scientists and Technologists 18 1.0% 438 $17.09 $30.83 B None NoneForest and Conservation Technicians 17 -0.3% 413 $14.48 $20.50 A None NoneEnvironmental Science and Protection Technicians, Including Health 15 1.9% 290 $14.38 $20.70 A None None
Urban and Regional Planners 13 0.9% 253 $18.95 $29.40 G None NoneConservation Scientists 10 -0.4% 325 $16.15 $27.30 B None NoneMicrobiologists 9 1.0% 237 $20.46 $33.50 B None NoneBiochemists and Biophysicists 7 3.1% 142 $24.04 $37.09 G None NoneSocial Science Research Assistants 7 0.5% 164 $10.92 $17.90 A None NoneForensic Science Technicians 6 0.5% 127 $23.58 $30.97 B None Moderate-TermGeoscientists, Except Hydrologists and Geographers 6 2.9% 110 $27.12 $39.15 B None NoneAnimal Scientists 5 0.8% 117 $19.78 $31.83 G None NoneEconomists 4 1.1% 90 $28.49 $35.44 G None NoneZoologists and Wildlife Biologists 4 0.8% 102 $21.93 $29.84 B None NoneAtmospheric and Space Scientists 3 0.9% 102 $30.34 $39.20 B None NonePhysicists 3 1.7% 77 $32.39 $56.75 G None NoneNuclear Technicians 2 1.3% 52 $25.26 $31.36 A None Moderate-TermForesters 2 1.5% 53 $23.60 $29.42 B None NoneGeological and Petroleum Technicians 2 3.0% 31 $21.82 $22.34 A None Moderate-TermMaterials Scientists 2 1.6% 46 $24.15 $39.98 B None NoneSurvey Researchers 2 0.5% 77 $12.96 $24.64 G None NoneHydrologists 1 1.6% 36 $27.23 $33.26 G None None
EDUCATION:< HS = Less than high schoolHS = High school diploma or equivalentPS = Postsecondary non-degree awardSC = Some college, no degree
A = Associate’s degreeB = Bachelor's degreeG = Advanced degree
THE FOLLOWING DATA IS FOR THE STATE OF IOWA AS A WHOLE

48
North Iowa Area Community College PROGRAMS OF STUDY• ACTUARIAL SCIENCE & STATISTICS - TRANSFER• BIOLOGY - TRANSFER• BIOTECHNOLOGY• CHEMISTRY - TRANSFER• ENGINEERING - TRANSFER• ENVIRONMENTAL SCIENCE - TRANSFER• GEOGRAPHY - TRANSFER• MATHEMATICS - TRANSFER• PHYSICS - TRANSFER
SUGGESTED HIGH SCHOOL COURSES• COMPUTER APPLICATIONS• INDUSTRIAL TECHNOLOGY: ELECTRICAL SYSTEMS,
CONSTRUCTION, CABINETMAKING, POWER TECHNOLOGY, DRAFTING, INTRO TO ENGINEERING, MACHINE OPERATIONS, BLUEPRINT READING
• MATH: TECHNICAL, ALGEBRA, TRIGONOMETRY, CALCULUS
• PRE-EMPLOYMENT STRATEGIES• SCIENCE: PHYSICS, CHEMISTRY
I REALLY LIKE THE ENGINEERING PROGRAM BECAUSE THE INSTRUCTORS ARE FRIENDLY AND MAKE THE SUBJECT
MATTER EASY TO LEARN.
---GREG
“”
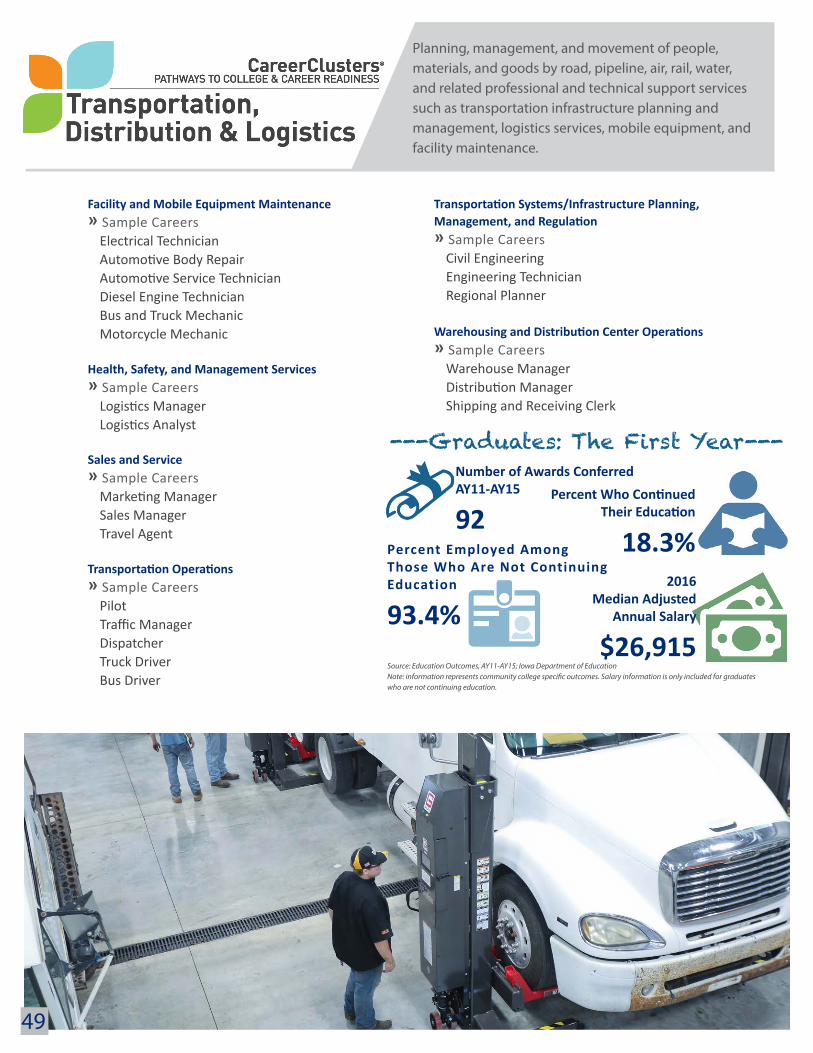
Planning, management, and movement of people, materials, and goods by road, pipeline, air, rail, water, and related professional and technical support services such as transportation infrastructure planning and management, logistics services, mobile equipment, and facility maintenance.
Facility and Mobile Equipment Maintenance » Sample Careers Electrical Technician Automotive Body Repair Automotive Service Technician Diesel Engine Technician Bus and Truck Mechanic Motorcycle Mechanic Health, Safety, and Management Services » Sample Careers Logistics Manager Logistics Analyst
Sales and Service » Sample Careers Marketing Manager Sales Manager Travel Agent Transportation Operations » Sample Careers Pilot Traffic Manager Dispatcher Truck Driver Bus Driver
Transportation Systems/Infrastructure Planning, Management, and Regulation » Sample Careers Civil Engineering Engineering Technician Regional Planner
Warehousing and Distribution Center Operations » Sample Careers Warehouse Manager Distribution Manager Shipping and Receiving Clerk
49
Percent Who Continued Their Education
18.3%
---Graduates: The First Year---Number of Awards ConferredAY11-AY15
92
2016 Median Adjusted
Annual Salary
$26,915
Percent Employed Among Those Who Are Not Continuing Education
93.4%Source: Education Outcomes, AY11-AY15; Iowa Department of EducationNote: information represents community college speci�c outcomes. Salary information is only included for graduates who are not continuing education.

50
TRANSPORTATION, DISTRIBUTION AND LOGISTICS CAREER CLUSTER™ OCCUPATIONS BY ANNUAL OPENINGS
ANNUAL OPENINGS = Annual New Jobs plus Annual Replacements (rounded); Employment data suppression (Occupational employment data may not add up or equal occupational group totals due to rounding and/or suppression of occupations with less than ten rounded total annual openings.);
ANNUAL GROWTH RATE = Ten year growth rate (not shown) divided by ten;
ENTRY-LEVEL HOURLY RATE = Average of the lowest third of reported wages for the occupation;
MID-CAREER HOURLY RATE = Average wage computed by dividing the estimated total wage for an occupation by its weighted employment;
EDUCATION/WORK EXPERIENCE/JOB TRAINING levels are determined by the U.S. Department of Labor’s Bureau of Labor Statistics (BLS). Alternative pathways may exist as well as differing educational, training or licensing requirements per state. Iowa requirements are used in this publication when available.
Source: EMSI
Occupation
Annu
al O
peni
ngs
Annu
al G
row
th
Estim
ated
Jobs
by
2025
Entr
y-Le
vel H
ourly
Ra
teM
id-C
aree
r Hou
rly
Rate
Typi
cal E
ntry
-Lev
el
Educ
ation
Wor
k Ex
perie
nce
Requ
ired
Typi
cal O
n-th
e-Jo
b Tr
aini
ng
Heavy and Tractor-Trailer Truck Drivers 1,278 1.1% 45,196 $13.21 $19.66 PS None Short-TermLight Truck or Delivery Services Drivers 273 1.0% 10,866 $8.93 $15.03 HS None Short-TermBus Drivers, School or Special Client 141 0.6% 6,083 $8.92 $15.32 HS None Short-TermDriver/Sales Workers 114 0.7% 4,974 $8.03 $12.71 HS None Short-TermFirst-Line Supervisors of Transportation and Material-Moving Machine and Vehicle Operators 104 1.2% 2,741 $15.12 $26.01 HS < 5 years None
First-Line Supervisors of Helpers, Laborers, and Material Movers, Hand 85 1.6% 2,081 $13.25 $23.39 HS < 5 years None
Bus Drivers, Transit and Intercity 43 0.7% 1,751 $10.12 $14.50 HS None Moderate-TermCrane and Tower Operators 38 1.5% 835 $12.88 $22.39 HS < 5 years Moderate-TermRailroad Conductors and Yardmasters 22 0.0% 699 $18.98 $26.40 HS None Moderate-TermLocomotive Engineers 20 0.0% 631 $21.13 $28.36 HS < 5 years Moderate-TermExcavating and Loading Machine and Dragline Operators 17 0.7% 1,046 $13.16 $17.44 HS < 5 years Moderate-TermCommercial Pilots 13 2.3% 283 $20.51 $38.75 HS None Moderate-TermRailroad Brake, Signal, and Switch Operators 12 0.2% 367 $16.89 $26.52 HS None Moderate-TermTransportation Inspectors 8 1.3% 188 $20.63 $32.23 HS None Moderate-TermAmbulance Drivers and Attendants, Except Emergency Medical Technicians 6 1.3% 234 $8.47 $12.34 HS None Moderate-Term
Captains, Mates, and Pilots of Water Vessels 6 1.2% 100 $20.61 $32.04 B None NoneAir Traffic Controllers 5 0.1% 115 $26.60 $46.15 A None Long-TermTraffic Technicians 4 0.9% 96 $15.25 $18.23 HS None Moderate-TermTransportation Attendants, Except Flight Attendants 3 1.1% 100 $8.41 $11.10 HS None Short-TermCommercial Divers 2 1.0% 59 $16.34 $22.34 PS None Moderate-TermAirfield Operations Specialists 2 0.6% 41 $17.04 $26.69 HS None Long-TermAirline Pilots, Copilots, and Flight Engineers 2 0.9% 55 $37.81 $53.23 B < 5 years Moderate-TermSubway and Streetcar Operators 2 0.6% 55 $19.63 $23.82 HS None Moderate-TermRail Yard Engineers, Dinkey Operators, and Hostlers 2 0.8% 51 $12.82 $16.55 HS None Moderate-TermShip Engineers 1 0.9% 25 $24.13 $34.56 B None NoneBridge and Lock Tenders 1 -0.1% 30 $23.42 $26.62 HS None Short-TermMotorboat Operators 1 2.6% 18 $16.96 $24.45 HS None Short-Term
EDUCATION:< HS = Less than high schoolHS = High school diploma or equivalentPS = Postsecondary non-degree awardSC = Some college, no degree
A = Associate’s degreeB = Bachelor's degreeG = Advanced degree
THE FOLLOWING DATA IS FOR THE STATE OF IOWA AS A WHOLE

North Iowa Area Community College PROGRAMS OF STUDY
• LOGISTICS• AUTOMOTIVE SERVICE TECHNOLOGY• DIESEL TECHNOLOGY
SUGGESTED HIGH SCHOOL COURSES
• BUSINESS EDUCATION• COMMUNICATION• COMPUTER APPLICATIONS• ENGLISH/COMPOSITION• INDUSTRIAL TECHNOLOGY:
• SMALL ENGINES, AUTOMOTIVE, DIESEL, WELDING, POWER TECHNOLOGY
• MATH• PRE-EMPLOYMENT STRATEGIES• SCIENCE: TECHNICAL PHYSICS
51
THE CLASSES HAVE A TON OF HANDS ON INSTRUCTION WHICH OF COURSE IS MY
FAVORITE PART. YOU ARE NOT SITTING IN A CLASS ALL DAY, YOU ARE WORKING ON
ACTUAL CUSTOMER CARS AND TRUCKS AND THAT EXPERIENCE IS SO VALUABLE
FOR WHEN I GET OUT INTO THE REAL WORLD OF WORK.
---JAMIE
“
”

52
IN-DEMAND OCCUPATIONS IN THE NORTH IOWA AREA COMMUNITY COLLEGE REGION
ANNUAL OPENINGS = Annual New Jobs plus Annual Replacements (rounded); Employment data suppression (Occupational employment data may not add up or equal occupational group totals due to rounding and/or suppression of occupations with less than ten rounded total annual openings.);
ENTRY-LEVEL HOURLY RATE = Tenth percentile of reported wages for the occupation;
MID-CAREER HOURLY RATE = Average wage computed by dividing the estimated total wage for an occupation by its weighted employment;
EDUCATION levels are determined by the U.S. Department of Labor’s Bureau of Labor Statistics (BLS). Alternative pathways may exist as well as differing educational, training or licensing requirements per state. Iowa requirements are used in this publication when available.
Source: EMSI
Occupation Annual Openings
Entry-Level Hourly Rate
Mid-Career Hourly Rate
Typical Entry-Level Education
Team Assemblers 215 $11.88 $15.11 HSHeavy and Tractor-Trailer Truck Drivers 183 $12.76 $18.13 PSWelders, Cutters, Solderers, and Brazers 107 $13.43 $17.89 HSConstruction Laborers 87 $11.47 $18.48 < HSGeneral and Operations Managers 77 $12.72 $37.74 BRegistered Nurses 75 $19.57 $25.66 BCustomer Service Representatives 70 $10.56 $17.18 HSSales Representatives, Wholesale and Manufacturing, Except Technical and Scientific Products 67 $14.80 $29.52 HS
Maintenance and Repair Workers, General 64 $11.43 $17.86 HSFirst-Line Supervisors of Retail Sales Workers 56 $10.60 $16.63 HSFirst-Line Supervisors of Production and Operating Workers 52 $16.93 $24.61 HSElementary School Teachers, Except Special Education 51 $15.15 $23.65 BLight Truck or Delivery Services Drivers 48 $9.19 $17.20 HSAutomotive Service Technicians and Mechanics 40 $10.39 $16.93 PSCarpenters 40 $12.28 $16.55 HSSocial and Human Service Assistants 38 $9.26 $16.82 HSAccountants and Auditors 38 $16.87 $28.72 BInspectors, Testers, Sorters, Samplers, and Weighers 35 $11.96 $17.63 HSFirst-Line Supervisors of Office and Administrative Support Workers 34 $13.62 $23.40 HS
Secondary School Teachers, Except Special and Career/Technical Education 30 $16.78 $24.73 B
Agricultural Equipment Operators 30 $12.65 $16.64 < HSMixing and Blending Machine Setters, Operators, and Tenders 30 $12.13 $17.68 HS
Bus Drivers, School or Special Client 28 $8.87 $15.04 HSIndustrial Machinery Mechanics 25 $15.18 $21.31 HSBilling and Posting Clerks 24 $11.88 $16.96 HSOperating Engineers and Other Construction Equipment Operators 24 $15.44 $20.86 HS
Medical Secretaries 23 $9.70 $15.69 HSShipping, Receiving, and Traffic Clerks 23 $12.37 $16.57 HSAutomotive Body and Related Repairers 23 $10.82 $17.34 HSParts Salespersons 22 $12.08 $19.45 < HSMedical Assistants 21 $12.71 $15.71 PS
EDUCATION:< HS = Less than high schoolHS = High school diploma or equivalentPS = Postsecondary non-degree awardSC = Some college, no degree
A = Associate’s degreeB = Bachelor's degreeG = Advanced degree
OCCUPATIONS BY NUMBER OF ANNUAL OPENINGS AND AVERAGE HOURLY WAGE OF $15.00 OR MORE
Regional In-Demand Occupations

Top Industries by Employment Level Total EmployeesManufacturing 1,590Health Care and Social Assistance 930Retail Trade 772Educational Services 542Accommodation and Food Services 289
Number of Businesses by Employment SizeTop Industries by Number of Businesses <5 5-9 10-49 50+ TotalHealth Care and Social Assistance 38 3 15 6 62
Other Services 46 8 4 *** 58
Retail Trade 28 9 17 3 57
Finance and Insurance 30 6 *** *** 39
Construction 22 6 5 *** 33
Number of Businesses by Employment SizeTop Industries by Number of Businesses <5 5-9 10-49 50+ TotalRetail Trade 83 68 71 14 236
Health Care and Social Assistance 72 29 45 18 164
Other Services 114 30 14 *** 159
Accommodation and Food Services 44 29 58 8 139
Construction 89 22 20 *** 133
County InformationCerro Gordo
Top Industries by Employment Level Total EmployeesHealth Care and Social Assistance 5,429Retail Trade 3,620Manufacturing 2,676Accommodation and Food Services 2,125Educational Services 1,953
Floyd
1 in 22 Cerro Gordo County residents are served by North Iowa Area Community College annually.
In FY15, 1,811 students in Cerro Gordo County were served by North
Iowa Area Community College.
1 in 14 Floyd County residents are served by North Iowa Area Community College annually.
In FY15, 1,416 students in Floyd County were served by North Iowa Area
Community College.
Source: Iowa Workforce Development, QCEW 2017 Q1
53

54
Number of Businesses by Employment SizeTop Industries by Number of Businesses <5 5-9 10-49 50+ TotalRetail Trade 16 12 9 *** 38
Construction 24 5 7 *** 37
Wholesale Trade 21 9 7 *** 37
Other Services 31 3 *** *** 35
Agriculture, Forestry, Fishing and Hunting 21 6 3 *** 30
Franklin
Top Industries by Employment Level Total EmployeesManufacturing 829Health Care and Social Assistance 443Educational Services 370Retail Trade 342Management of Companies 244
Number of Businesses by Employment SizeTop Industries by Number of Businesses <5 5-9 10-49 50+ Total
Retail Trade 22 10 10 *** 43
Wholesale Trade 20 8 11 *** 39
Transportation and Warehousing 25 5 5 3 38
Other Services 26 7 *** *** 34
Construction 23 4 3 *** 30
Hancock
Top Industries by Employment Level Total EmployeesManufacturing 3,269Health Care and Social Assistance 680Transportation and Warehousing 505Retail Trade 329Wholesale Trade 261
1 in 14 Franklin County residents are served by North Iowa Area Community College annually.
In FY15, 2,554 students in Franklin
County were served by North Iowa Area Community College.
1 in 33 Hancock County residents are served by North Iowa Area Community College annually.
In FY15, 335 students in Hancock County were served by North Iowa Area
Community College.

Top Industries by Employment Level Total EmployeesEducational Services 734Manufacturing 575Retail Trade 549Health Care and Social Assistance 462Agriculture, Forestry, Fishing and Hunting 309
Number of Businesses by Employment SizeTop Industries by Number of Businesses <5 5-9 10-49 50+ TotalRetail Trade 27 7 21 *** 56
Construction 27 8 5 *** 41
Other Services 34 4 *** *** 39
Health Care and Social Assistance 21 5 7 3 36
Wholesale Trade 21 4 4 *** 29
Number of Businesses by Employment SizeTop Industries by Number of Businesses <5 5-9 10-49 50+ TotalConstruction 37 12 5 *** 54
Retail Trade 28 12 11 *** 51
Other Services 32 3 *** *** 35
Health Care and Social Assistance 9 7 11 3 30
Agriculture, Forestry, Fishing and Hunting 18 *** 5 *** 25
Mitchell
Top Industries by Employment Level Total EmployeesManufacturing 1,039Health Care and Social Assistance 584Educational Services 408Retail Trade 356Construction 226
Winnebago
1 in 22 MitchellCounty residents are served by North Iowa Area Community College annually.
In FY15, 1,811 students in Mitchell County were served by North Iowa Area
Community College.
1 in 14 Winnebago County residents are served by North Iowa Area Community College annually.
In FY15, 1,416 students in Winnebago County were served by North
Iowa Area Community College.
55

56
Number of Businesses by Employment SizeTop Industries by Number of Businesses <5 5-9 10-49 50+ TotalConstruction 26 6 3 *** 35
Other Services 20 3 *** *** 25
Retail Trade 12 7 5 *** 24
Wholesale Trade 11 7 4 *** 22
Finance and Insurance 14 3 *** *** 18
Worth
Top Industries by Employment Level Total EmployeesManufacturing 445Arts, Entertainment and Recreation 383Educational Services 194Health Care and Social Assistance 172Retail Trade 170
1 in 14 Worth County residents are served by North Iowa Area Community College annually.
In FY15, 2,554 students in Worth County were served by North Iowa Area
Community College.

57
NOTES: _______________________________________________________________________________
_____________________________________________________________________________________________
_____________________________________________________________________________________________
_____________________________________________________________________________________________
_____________________________________________________________________________________________
_____________________________________________________________________________________________
_____________________________________________________________________________________________
_____________________________________________________________________________________________
_____________________________________________________________________________________________
_____________________________________________________________________________________________
_____________________________________________________________________________________________
_____________________________________________________________________________________________
_____________________________________________________________________________________________
_____________________________________________________________________________________________
_____________________________________________________________________________________________
_____________________________________________________________________________________________
_____________________________________________________________________________________________
_____________________________________________________________________________________________
_____________________________________________________________________________________________
_____________________________________________________________________________________________
_____________________________________________________________________________________________
_____________________________________________________________________________________________
_____________________________________________________________________________________________
_____________________________________________________________________________________________

58
This publication was produced with information from the Iowa Department of Education, Iowa Workforce Development and North Iowa Area Community College.
It is the policy of North Iowa Area Community College to not discriminate on the basis of race, color, national origin, sex (including pregnancy), disability, age, sexual orientation, gender identity, genetic information, creed,
religion, actual or potential parental, family and marital status or veteran’s status in its programs, activities, or employment practices as required by the Iowa Code sections 216.6 and 216.9, Titles VI and VII of the Civil
Rights Act of 1964 (42 U.S.C. § 2000d and 2000e), the Equal Pay Act of 1973 (29 U.S.C. § 206, et seq.), Title IX (Educational Amendments, 20 U.S.C.§§ 1681 --- 1688), Section 504 (Rehabilitation Act of 1973, 29 U.S.C. § 794),
and the Americans with Disabilities Act (42 U.S.C. § 12101, et seq.).
Individuals having questions or complaints related to compliance with this policy should contact Shelly Schmit, EEO/AA Officer, 500 College Drive, Mason City, IA 50401 or via telephone at 641-422-4211.
Inquiries may also be directed to the Director of the Office for Civil Rights, U.S. Department of Education, Citigroup Center, 500 W. Madison, Suite 1475, Chicago, IL 60661, phone number 312/730-1560, fax 312/730-1576.
Let’s Connect
/myniacc
/myniacc
/myniacc
/niacc_trojans
/niacc
Main Campus500 College Drive
Mason City, IA 50401641-422-888-GO-NIACC
641.421.1264
Enrollment Services Office: 641.422.4245
Community Education CentersCharles City, Garner, Hampton, Lake Mills and Osage
www.niacc.edu