CARBON REDUCTION OPTIMIZATION IN WASTE … · CARBON REDUCTION OPTIMIZATION IN WASTE TREATMENT...
12
The Third Joint Seminar of Japan and Indonesia Environmental Sustainability and Disaster Prevention (3 rd ESDP-2015) Institut Teknologi Bandung, Indonesia – November 25 th , 2015 81 CARBON REDUCTION OPTIMIZATION IN WASTE TREATMENT USING DECENTRALIZED SYSTEM WITH THE APPLICATION OF A JOINT CREDIT MECHANISM Agustina Cindy Widyanggita 1*† and Priana Sudjono 2 Master Programme for Environmental Engineering Faculty of Civil and Environmental Engineering, Institut Teknologi Bandung Jl Ganesha 10 Bandung 40132 Email: [email protected] 1 , [email protected] 2 Presenter; † Corresponding author. Abstract: The volume of waste generated in Bandung is increasing along with the increase of population and its activities. Through the process of natural degradation, garbage produces carbon emissions as what happened in waste treatment process. Responding to the waste problem in Bandung related to carbon emissions, it is necessary to make an optimization model to determine the best waste processing techniques for each area in Bandung which are devided by a decentralized system. Reduction in waste treatment costs are obtained from insentive which refers to the joint credit mechanism pattern, while the optimization model using linear programming will be solved using simplex method. Simulation of optimization model is run with a condition where service scope for waste is 70% with middle income people of 40% and low income people of 60%. According to mass balance concept, for 30% emission reduction target, Bandung Utara, Bandung Barat, and Bandung Selatan mostly use composting as their waste treatment with the input allocation of 90%, 99%, and 90% from the total amount of waste in each region, respectively, while Bandung Timur use sanitary landfill the 100% input of waste. When the same condition is applied but the constraint is changed into combined emission reduction for whole Bandung, the operational cost is reduced as much as 998.1 millions rupiah from initial cost. From this study, linear programming can be used for determining waste treatment plant with emissions constraints for making government’s policy. Keywords: organic waste, joint credit mechanism (JCM), optimization, linear programming INTRODUCTION Through the natural degradation process, organic waste emitted carbon emission, as the same with waste treatment process. Every treatment process will emit a different amount of carbon due to its technology. The more advance the technology used, the less carbon emitted, but the operational cost spent can be more expensive. In Joint Credit Mechanism (JCM) initiated by Japan there is carbon trading system where the amount of carbon reducted by Indonesia will be paid by incentive. This incentive from carbon trading can be used to reduce the operational cost for waste treatment process in Bandung City. Management of solid waste system in Bandung City are a decentralized system which mean there are several waste treatment process which are placed according to residential area division. In this research optimization will be conducted to obtain the cheapest waste treatment technology which emitt the smallest amount of carbon emission in each area of decentralized system. The volume of solid waste generated in Bandung City raised as the population and its activity raises which become a big problem related to the lack of solid waste treatment facilities. The management of solid waste is only done by collecting and shipping the waste from TPS to
Transcript of CARBON REDUCTION OPTIMIZATION IN WASTE … · CARBON REDUCTION OPTIMIZATION IN WASTE TREATMENT...

The Third Joint Seminar of Japan and Indonesia Environmental
Sustainability and Disaster Prevention (3rd ESDP-2015)
Institut Teknologi Bandung, Indonesia – November 25th, 2015
81
CARBON REDUCTION OPTIMIZATION IN
WASTE TREATMENT USING DECENTRALIZED SYSTEM
WITH THE APPLICATION OF A JOINT CREDIT MECHANISM
Agustina Cindy Widyanggita1*† and Priana Sudjono2
Master Programme for Environmental Engineering
Faculty of Civil and Environmental Engineering, Institut Teknologi Bandung
Jl Ganesha 10 Bandung 40132
Email: [email protected], [email protected]
Presenter; † Corresponding author.
Abstract: The volume of waste generated in Bandung is increasing along with the increase of population and its
activities. Through the process of natural degradation, garbage produces carbon emissions as what happened in
waste treatment process. Responding to the waste problem in Bandung related to carbon emissions, it is necessary to
make an optimization model to determine the best waste processing techniques for each area in Bandung which are
devided by a decentralized system. Reduction in waste treatment costs are obtained from insentive which refers to
the joint credit mechanism pattern, while the optimization model using linear programming will be solved using
simplex method. Simulation of optimization model is run with a condition where service scope for waste is 70%
with middle income people of 40% and low income people of 60%. According to mass balance concept, for 30%
emission reduction target, Bandung Utara, Bandung Barat, and Bandung Selatan mostly use composting as their
waste treatment with the input allocation of 90%, 99%, and 90% from the total amount of waste in each region,
respectively, while Bandung Timur use sanitary landfill the 100% input of waste. When the same condition is
applied but the constraint is changed into combined emission reduction for whole Bandung, the operational cost is
reduced as much as 998.1 millions rupiah from initial cost. From this study, linear programming can be used for
determining waste treatment plant with emissions constraints for making government’s policy.
Keywords: organic waste, joint credit mechanism (JCM), optimization, linear programming
INTRODUCTION
Through the natural degradation process, organic waste emitted carbon emission, as the
same with waste treatment process. Every treatment process will emit a different amount of
carbon due to its technology. The more advance the technology used, the less carbon emitted, but
the operational cost spent can be more expensive. In Joint Credit Mechanism (JCM) initiated by
Japan there is carbon trading system where the amount of carbon reducted by Indonesia will be
paid by incentive. This incentive from carbon trading can be used to reduce the operational cost
for waste treatment process in Bandung City. Management of solid waste system in Bandung
City are a decentralized system which mean there are several waste treatment process which are
placed according to residential area division. In this research optimization will be conducted to
obtain the cheapest waste treatment technology which emitt the smallest amount of carbon
emission in each area of decentralized system.
The volume of solid waste generated in Bandung City raised as the population and its
activity raises which become a big problem related to the lack of solid waste treatment facilities.
The management of solid waste is only done by collecting and shipping the waste from TPS to

The Third Joint Seminar of Japan and Indonesia Environmental
Sustainability and Disaster Prevention (3rd ESDP-2015)
Institut Teknologi Bandung, Indonesia – November 25th, 2015
82
the final disposal station (TPA) continuously, meanwhile the capaCity left for solid waste can
only be used for 6 years ahead (Sriwuryandari dan Sembiring, 2009). In the final report of
Bandung City BPLH in 2013, it is mentioned that the pilot project of solid waste management is
one of the government effort to reduce the generation of solid waste which will give a long term
advantage. It is also explained that the pilot project will be conducted in modular system, where
certain area is determined together to applied a new management system that can reduce the
investment and operational cost, increase the final disposal’s lifetime, and also give working
opportunity (BPLH, 2013). The average volume of wate generated in Bandung City is 3
Liter/person/day (BPLH, 2013) with the composition of kitchen waste as much as 58% (Sondari,
et al., 2012). With the amount of population of 2.5 millions, so the total waste generated is 7500
m3/day. When the amount of waste generated exceeds the final disposal capaCity, new problem
will be arised that gives negative effect to the environment such as the green house gas (GHG)
emission. Various solid waste treatments have been done, such as recycling organic waste to
compost. Composting have a small reduction number of carbon which is 8 kg CO2 equivalent/ton
of waste, meanwhile the recycling of organic waste generated can reduce the volume of waste
thrown to the final disposal which can indirectly reduce the GHG emission (Sunarto, et al.,
2013). Landfill is the most expensive waste treatment after incineration with the efficiency of
bolume reduction less than 50%, while the efficiency of volume reduction of incineration is
greater which is higher than 50% (Minoglou, et al., 2013).
Landfill also contributes GHG emission of 3-4% from the global emission (Eggleston, et
al., 2006). Green house gases emitted from solid waste sector are various, but the dominant gases
that must be noticed in National GHGs Inventory are CO2, CH4, and N2O. These gases included
as GHG’s have big potential related to global warming. Purwanto (2009) explained that the
potential of global warming or global warming potential (GWP) is the radioactive effect unit of
GHG which is compared to CO2, in other words GWP is an indication of how many ton of CO2
emitted is equal to other one ton of each GHG.
Many countries, including Indonesia has given attention toglobalwarming effect.
Internationally global warming mitigation included in Kyoto Protocol which governs the
obligation to reduce GHG emission related to climate change issue, Japan released a new
mechanism to reduce carbon concentration worldwide which is known as Joint Credit
Mechanism (Oghihara, 2013). Furthermore it is explained that in bilateral cooperation, Japan
gives incentive to its partner who is able to reduce the amount of carbon in its country through
project agreed by both parties. Oghihara (2013) also explained that Indonesia is legally
cooperates with Japan since 2013. Emission trading process have important role in Post-Kyoto
which aim to reduce GHG emission worldwide (Jaehn, et al., 2010).
To response waste issue in Bandung City, optimization model is needed to determine waste
treatment method which has greatest carbon reduction with cheapest operational cost for every
residential area based on decentralized system. Waste treatment method addressed for only
organic waste considering this kind of waste has the greatest percentage of waste in Bandung
City (BPLH, 2013). By using Intermediate Treatment Facility (ITF) in every residential area, it

The Third Joint Seminar of Japan and Indonesia Environmental
Sustainability and Disaster Prevention (3rd ESDP-2015)
Institut Teknologi Bandung, Indonesia – November 25th, 2015
83
is hoped that the economic value, environmental quality and regional income can be raised.
RESEARCH METHOD
Decentralization of Bandung City
In this research, Bandung City is devided into 4 regions that are North Bandung, West
Bandung, East Bandung, and South Bandung. Decentralization is based on administrative
division where assumed that every region has 1 ITF.
Waste Generation in Each Region
Waste generation data is secondary data from 2013 in Laporan Ringkasan Eksekutif tahun
2013 (BPLH Kota Bandung, 2013). In this research assumed that the ratio of population consist
of 40% intermediate income residence (IIR) and 60% low income residence (LIR) with waste
generation coefficients for IIR and LIR are 0,12 kg/person/day dan 0,18 kg/person/day
respectively.
Waste generation assumed 70% consider the waste management service can not reach
100% of waste because blind spot. Blind spot is area that can not be reached by waste
transportation such as area without good access, area with few people which not efficient
because the cost is too large compared with the waste handling. Waste generation followed
Equation 1.
𝑾𝒂𝒔𝒕𝒆 𝑮𝒆𝒏𝒓𝒂𝒕𝒊𝒐𝒏 = 𝑾𝒂𝒔𝒕𝒆 𝑮𝒆𝒏𝒆𝒓𝒂𝒕𝒊𝒐𝒏 𝒄𝒐𝒆𝒇𝒇𝒊𝒄𝒊𝒆𝒏𝒕 𝒙 𝒑𝒐𝒑𝒖𝒍𝒂𝒕𝒊𝒐𝒏 Equation
(1)
Open Dumping Emission
Open dumping emission calculated in term of carbon according to Equation 2 based on
EPA.
𝑪𝒂𝒓𝒃𝒐𝒏 𝒆𝒎𝒊𝒔𝒔𝒊𝒐𝒏 = 𝑾𝒂𝒔𝒕𝒆 𝒈𝒆𝒏𝒆𝒓𝒂𝒕𝒊𝒐𝒏 𝒙 𝒃𝒊𝒐𝒈𝒆𝒏𝒊𝒄 𝒄𝒂𝒓𝒃𝒐𝒏 Equation (2)
where: 𝐶𝑎𝑟𝑏𝑜𝑛 𝐸𝑚𝑖𝑠𝑠𝑖𝑜𝑛 = open dumping emission; 𝑊𝑎𝑠𝑡𝑒 𝑔𝑒𝑛𝑟𝑒𝑎𝑡𝑖𝑜𝑛=waste generation in
tones/year; 𝑏𝑖𝑜𝑔𝑒𝑛𝑖𝑐 𝑐𝑎𝑟𝑏𝑜𝑛 = organic compound carbon (kg C / ton of wet waste)
Waste Treatment Technology
Waste treatment technology which used in this research is composting, anaerobic
digestion, incineration, and sanitary landfill. All technologies must be accredited by JCM or
other institution which handle climate change such as UNFCCC, already applied in Japan, have
known efficiency value, specialize to treat food waste (FW), and suitable for Bandung City by
considering the economic, field availability, accessibility, and the efficiency aspects.
Emission of Waste Treatment Alternatives
Every waste treatment technology emitted different amount of emission. All of the
emission, either carbondioxide, carbon,or methane emission will be converted to equivalent

The Third Joint Seminar of Japan and Indonesia Environmental
Sustainability and Disaster Prevention (3rd ESDP-2015)
Institut Teknologi Bandung, Indonesia – November 25th, 2015
84
carbon emission (C-eq). Carbon emission for composting, anaerobic digestion refer to
Guidelines for National Greenhouse Gas Inventories (IPCC, 2006), while carbon emission for
incineration and sanitary landfill refer to Emission Inverntory Guidebook (EEA, 2013) and EPA’s
Waste Reduction Model (WARM, 2015), respectively.
Carbon Reduction Emission
Carbon reduction emission is the amount of carbon that can be reduced using alternative waste
treatment compared to the amount of carbon emitted by open dumping. The calculation of carbon
emission reduction follows Equation 3.
%𝑒𝑓𝑓 =𝐶𝑎𝑟𝑏𝑜𝑛 𝑒𝑚𝑖𝑠𝑠𝑖𝑜𝑛(𝑜𝑝𝑒𝑛 𝑑𝑢𝑚𝑝𝑖𝑛𝑔)−𝐶𝑎𝑟𝑏𝑜𝑛 𝑒𝑚𝑖𝑠𝑠𝑖𝑜𝑛(𝑎𝑙𝑡𝑒𝑟𝑛𝑎𝑡𝑖𝑣𝑒)
𝐶𝑎𝑟𝑏𝑜𝑛 𝑒𝑚𝑖𝑠𝑠𝑖𝑜𝑛(𝑜𝑝𝑒𝑛 𝑑𝑢𝑚𝑝𝑖𝑛𝑔)𝑥100 Equation(3)
Alternative Treatment Cost
Waste treatment alternatives cost is secondary data from Peraturan Menteri Pekerjaan Umum
which can be seen in Table 1.
Table 1 Waste Treatment Alternatives Cost
Facilities Investment Cost (Rp) Operational Cost (Rp/ton of waste )
Insenerator (IF) 225 million - 3.3 billion/
ton of waste
400 - 600 thousand
Composting (CM) 500 million - 2.4 billion/
ton of waste / day
80 - 200 thousand
Anaerobic Digestion (AD) 660 million - 2.64 billion
/ ton of waste/ day
125 - 250 thousand
Source: Lampiran IV Peraturan Menteri Pekerjaan Umum No.3 Tahun 2013
Policy Related to Carbon Emission
Carbon emission reduction target according to Peraturan Presiden RI Nomor 61 Tahun
2001 about National Action Mitigation of Green House Gases is 26% on 2020 from Bussiness As
Usual (BAU) scenario. If it is related with JCM, carbon emission reduction targeted by Japan for
developing country is only 3%. (DNPI, 2013).
Model Development
Waste management system used in this research can be seen on Figure 1. It is assumed
that every ITF consists of composting facility, anerobic digester, incineration facility, and
sanitary landfill. Based on waste management system on Figure 1, it can be formulated from
decision, objective function, and constraint variables.
Mathematic model begin by determine variable, constraints, and objective of system
model. The n measured relation (𝑟1, 𝑟2, … , 𝑟𝑛) will be stated by decision variable where each
value is determined. Decision variable can be expressed in the ammount of carbon emitted by
each source. In this research, amount of carbon reduced by each waste treatment defined in form
of carbon emitted by related treatment. There are 16 decision variables (xij) on this optimization

The Third Joint Seminar of Japan and Indonesia Environmental
Sustainability and Disaster Prevention (3rd ESDP-2015)
Institut Teknologi Bandung, Indonesia – November 25th, 2015
85
model. Those values are multiplication product of 4 decentralized areas and 4 kinds of waste
treatment technologies.
Critical step in building mathematical model is when making the objective function. Quantitative
measurement development is needed from relative relation showed by every formulated object.
Because of that it is not needed to put every unnecessary detail or factor that predicted to give
same response to all considered alternative treatment. The optimized variable in this model is
total cost for waste management system and emitted carbon in each system. Objective function
in optimization model is to minimize total cost of waste management system.
Transfer Depo (TPS)
Manual Waste Sorting
Incinerator (IF)
Composter (CM)
Anaerobic Digester (AD)
Sanitary Landfill (LF)
BrokerTP, WP, DP, BP
Separable solid waste
Inse
par
able
so
lid w
aste
Solid
was
te
resi
du
al
ITF
Sources à household, restaurant,
hospital, etc
Figure 1 Sistem Pengelolaan Sampah di ITF
The main constraint in this optimization model is elaborated in Equation 4.
∑ Xi,j = 14j=1 , with i = 1 to 4 Equation(4)
That mass balance equation shows that waste can be allocated in various waste
treatments, but the sum of each waste fraction inputted in the treatment plant must be equal to the
total mass of each component.
Research Area
Study area in this research is Bandung City which consists of 4 administrative regions.
The Third Joint Seminar of Japan and Indonesia Environmental
Sustainability and Disaster Prevention (3rd ESDP-2015)
Institut Teknologi Bandung, Indonesia – November 25th, 2015
86
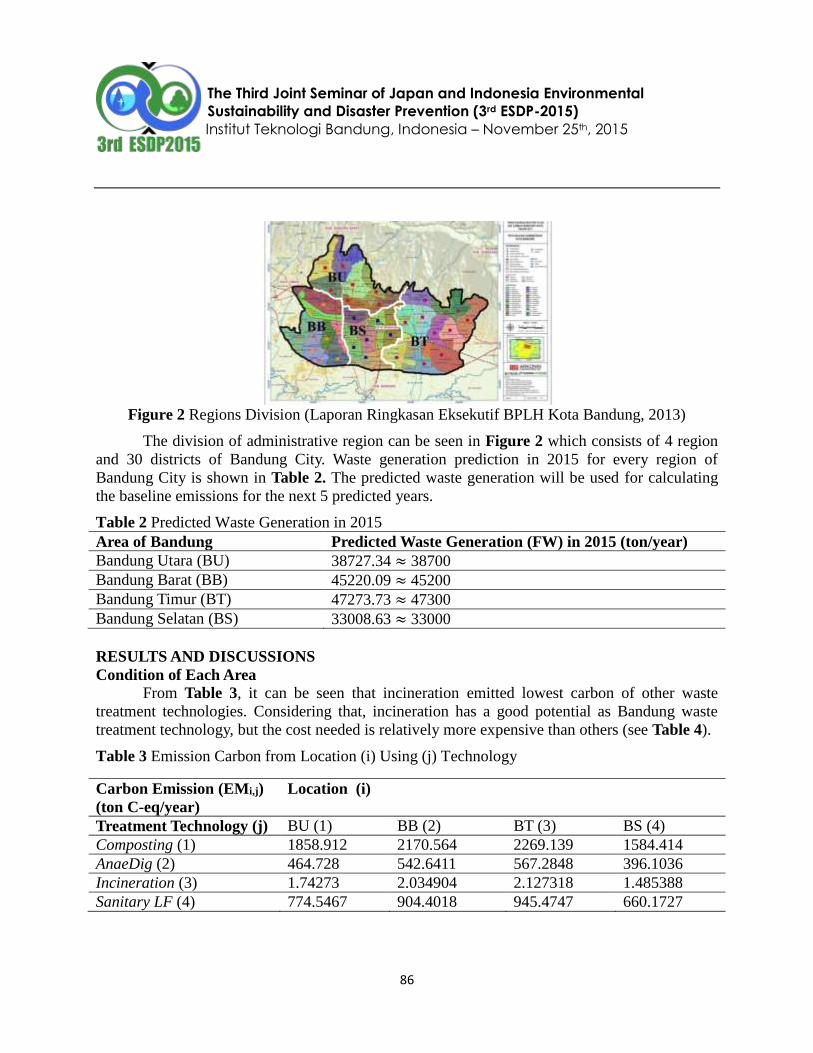
Figure 2 Regions Division (Laporan Ringkasan Eksekutif BPLH Kota Bandung, 2013)
The division of administrative region can be seen in Figure 2 which consists of 4 region
and 30 districts of Bandung City. Waste generation prediction in 2015 for every region of
Bandung City is shown in Table 2. The predicted waste generation will be used for calculating
the baseline emissions for the next 5 predicted years.
Table 2 Predicted Waste Generation in 2015
Area of Bandung Predicted Waste Generation (FW) in 2015 (ton/year)
Bandung Utara (BU) 38727.34 ≈ 38700
Bandung Barat (BB) 45220.09 ≈ 45200
Bandung Timur (BT) 47273.73 ≈ 47300
Bandung Selatan (BS) 33008.63 ≈ 33000
RESULTS AND DISCUSSIONS
Condition of Each Area
From Table 3, it can be seen that incineration emitted lowest carbon of other waste
treatment technologies. Considering that, incineration has a good potential as Bandung waste
treatment technology, but the cost needed is relatively more expensive than others (see Table 4).
Table 3 Emission Carbon from Location (i) Using (j) Technology
Carbon Emission (EMi,j)
(ton C-eq/year)
Location (i)
Treatment Technology (j) BU (1) BB (2) BT (3) BS (4)
Composting (1) 1858.912 2170.564 2269.139 1584.414
AnaeDig (2) 464.728 542.6411 567.2848 396.1036
Incineration (3) 1.74273 2.034904 2.127318 1.485388
Sanitary LF (4) 774.5467 904.4018 945.4747 660.1727

The Third Joint Seminar of Japan and Indonesia Environmental
Sustainability and Disaster Prevention (3rd ESDP-2015)
Institut Teknologi Bandung, Indonesia – November 25th, 2015
87
Moreover not every area has good economic value for using incinerator which should be
built in densely populated area. For relatively low populated area, usage of incineration
technologies needed more cost than sanitary landfill, about 51.42 times more expensive.
Table 4 Operational Cost for Each Source (i) Using (j) Technology
Operational Cost (Ci,j) (millions Rp/ton FW)
Treatment (j) 2015 2020 2025
Composting (1) 0.483 3.495 7.743
AnaeDig (2) 0.646 4.681 10.363
Incineration (3) 1.725 5.850 19.843
Sanitary LF (4) 0.115 0.384 0.521
All of the calculation conducted in the model use open dumping as the baseline. Suggest
the government apllied policy for carbon emission reduction of 20%, so the maximum emission
permitted from all waste treatment is 80% from total carbon emission (see Table 5).
Table 5 Open Dumping (As Baseline)
Location (i) FW (ton/year) Carbon Emission (ton C-eq/year)
NB 38727.34 ≈ 38700 4260.01 ≈ 4260
WB 45220.09 ≈ 45200 4974.21 ≈ 4970
EB 47273.73 ≈ 47300 5200.11 ≈ 5200
SB 33008.63 ≈ 33000 3630.95 ≈ 3630
TOTAL ≈ 164200 ≈ 18060
Mathematical Formulation
Waste management allocated to several kind of technology according to the needs. Based
on that it is needed to find the best proportion of each allocation of treatment. By using cost
efficient Ci,j from Table 3 and decision variable Xi,j, an objective function of total cost can be
formulated (Equation 5).
𝑍𝑐𝑜𝑠𝑡 = ∑ ∑ (𝐶𝑖,𝑗)𝑥(𝑋𝑖,𝑗)𝑛𝑗
𝑚𝑖
Equation(5)
where: m= the amount of emission sources; n=the amount of technology; i=index for emission
sources; j=index of technology; Z=cost for
To obtain the objective function of Z in Equation 5, variable decision Xi,j need to be
solved using linear system with constraints as follow (Equation 6 and Equation 7):
∑ (𝑋𝑖,𝑗)𝑛𝑗 = 1 𝑓𝑜𝑟 𝑒𝑎𝑐ℎ 𝑟𝑒𝑔𝑖𝑜𝑛 𝑤𝑖𝑡ℎ 𝑖 = 1 𝑡𝑜 4 Equation(6)
∑ ∑ [(𝐸𝑀𝑖,𝑗)𝑥(𝑋𝑖,𝑗)]𝑛𝑗
𝑚𝑖 ≤ (1 − %𝑅𝑒𝑑)𝑥𝑇𝑜𝑡𝑎𝑙 𝐶 𝐸𝑚𝑖𝑠𝑠𝑖𝑜𝑛
Equation(7)

The Third Joint Seminar of Japan and Indonesia Environmental
Sustainability and Disaster Prevention (3rd ESDP-2015)
Institut Teknologi Bandung, Indonesia – November 25th, 2015
88
Where: m=the amount of emission sources; n=the amount of technology; i=index for emission
sources; j=index of technology; %Red is the percentage of emission reduction according to the
policy applied; Total C emission=total carbon emission from open dumping
Determining Suitable Technologies for Each Region
Every waste treatment technologies have their own needs. As an example, not every
region can be used for landfill site. When it is raining, runoff spreadings from a higher area will
gives bigger spreading effect then those in flat areas. Other consideration is about the land
availability. Area with smaller residential dense is more feasible for sanitary landfill site with the
hope that negative impact in that area can be minimalized. Based on spatial pattern plan map of
Bandung for 2011- 2031 (Bappeda, 2012) in Figure 3, it can be seen that North Bandung and
East Bandung is the most feasible areas for sanitary landfill site, but due to its topograph, the
elevation in North Bandung is relatively high so it is not suitable as sanitary landfill site. Because
of that, it is determined that East Bandung is choosen as the location for sanitary landfill site.
Figure 3 Spatial Pattern Plan Map of Bandung for 2011 – 2031 (BAPPEDA, 2011)
One of the considerations for choosing incineration site is the cost efficiency problem. If
the incinerator used is a mass burn incinerator in modular combuster type with a capacity of 130
ton of waste/day, so it is better if the amount of waste generated has the same amount of the
incinerator capacity because if the amount of waste generated is much more smaller than the
treatment capacity, operational cost needed will be higher. According to that problem, only West
Bandung and East Bandung area which can give higher economic efficiency with the amount of
waste generation of 123.84 ton/day and 129.59 ton/day, respectively. Other consideration is
population density. Areas with higher population representate a condition where land availability
is not much. According to that, incineration will be used in West and East Bandung. Biological
waste treatment can be done in aerobic condition with composting or anerobic condition using
biodigestion. The problem here is the final product of its treatment which depends on waste
composition. To obtain good quality of liquid fertilizer, biological treatment process must be
mixed with animal feces. It is related to the anaerobic bacteria needed to activate substrate from

The Third Joint Seminar of Japan and Indonesia Environmental
Sustainability and Disaster Prevention (3rd ESDP-2015)
Institut Teknologi Bandung, Indonesia – November 25th, 2015
89
FW. According to this consideration, better to locate biodigester and composter site near farms so
animal feceses can be transferred to composting or biodigestion plant without spending much
money. If it is assumed that liuid fertilizer and compost produced will be used for city garden, so
from Figure 3, green open space and gardens can be founded in every area in Bandung City.
According to all of the considerations before, it is determined to use biodigester and composter
in every area of Bandung City.
Simulation Results For 2020
After the condition of waste for 2015 is known already, prediction of optimization for waste
allocation in 2020 is conducted in two different conditions. Simulation result gives graph shown
in Figure 4.
Figure 4 Comparison of Operational Cost in Both Situations
The first situation is conditioned that every region have its own emission reduction target,
while the second situation is conditioned that Bandung City has a certain emission reduction and
reduction target in each regions are neglected. It can be seen in Figure 4 that by the presence of
carbon trading (see the red line), operational cost of waste treatment in Bandung City became
cheaper than before (see the blue line). Figure 4 also shows the maximum reduction that can be
achieved from each condition where the maximum target reduction for combined emission
constraint is higher than the other one which is 88%.
Allocation of Waste to Be Treated
Figure 5 shows the allocation of waste (ton of FW/year) in Bandung Utara to be treated
using each kind of treatments. The allocation of waste to be treated in Bandung Utara for target

The Third Joint Seminar of Japan and Indonesia Environmental
Sustainability and Disaster Prevention (3rd ESDP-2015)
Institut Teknologi Bandung, Indonesia – November 25th, 2015
90
reduction of 30% using emission constraints for each region is as follows: X11=64784.88,
X12=6415.09, X21=78191.16, X22=8.861468, X23 until X33 is zero, X34=93100, X41=55052.15,
X42=5747.831
Figure 5 Allocation of Waste to Be Treated in Bandung Utara
Three Phases of Simulation Results
Figure 6 Phases of Simulation in 2020
Figure 6 shows the simulation results in 2020 using separated constraint for emission for
each region. There are three phases of simulation results that can be seen in Figure 6. First is the
0%, 770399 25%, 770399
65%, 967187
74%, 1126130
700000
800000
900000
1000000
1100000
1200000
0% 10% 20% 30% 40% 50% 60% 70% 80%
y=770399
y = 2E+06x - 17869R² = 0.991
Emission Reduction Target
The Third Joint Seminar of Japan and Indonesia Environmental
Sustainability and Disaster Prevention (3rd ESDP-2015)
Institut Teknologi Bandung, Indonesia – November 25th, 2015
91
constant phase between target reductions of 0% to 25% which consists of the cheapest waste
treatment plant in each region. In this phase the realized emission reduction is below target
emissions. The second phase occurred when the target for emission reduction is higher than 25%
up to 65% where several regions of Bandung City started to use their second cheapest waste
treatment plant to meet the reduction target. Bandung Utara and Bandung Selatan started to use
Anaerobic Digester. These conditions also occurred for phase three, but it happened in Bandung
Timur only which used Inceneration facility to meet the target reduction.
CONCLUSION AND SUGGESTION
Biodigester and composter will be used in every region, sanitary landfill will be used in
East Bandung, and incinerator will be used in East Bandung and West Bandung.
Allocation of optimal waste fraction input for each waste treatment in every region for 2020 with
emission reduction target of 30% are as follows, x11 = 0.9099, x12 = 0.0900997, x21 = 0.999887,
x22 = 0.000113318, x23 = 0, x31 = 0, x32 = 0, x33 = 0, x34 = 1, x41 = 0.905463, x42 = 0.0945367
with the total operational cost of 784835 millions rupiah.
Carbon trading system application can reduce the operational cost for Bandung City as much as
14436 millions rupiah/year.
REFERENCES BPLH Kota Bandung. 2013. Master Plan Persampahan Kota Bandung.
Eggleston, S., Buendia, L., Kyoko, T., dan Ngara, T. (2006). IPCC Guidelines for Natinal Greenhouse Gas
Inventories. IGES, Vol.5
Hindarto, D. E.,Samyanugraha, A. (2013). Mari Berdagang Karbon: Pengantar Pasar Karbon untuk Pengendalian
Perubahan Iklim. Dewan Nasional Perubahan Iklim: Jakarta.
Jaehn, F. dan Letmathe, P. ( 2010). The Emissions Trading Paradox. European Jurnal of Operational Research, No.
202, pp 248-254
Minoglou, M. dan Komilis, D. (2013). Optimizing The Treatment And Disposal Of Municipal Solid Wastes Using
Mathematical Programming: A Case Study in A Greek Region. Resources, Conservation and Recycling,
No.80, pp 46-57
Oghihara, M.J. 2013. Measurement, Reporting, and Verification (MRV) for Mitigation and Monitoring and
Evaluation (M&E) for Adaptation in the Asia Pasific Region. 22nd Asia Pasific Seminar on Climate
Change. Hanoi Vietnam.
Purwanto, W., 2009. Perhitungan Emisi Gas Rumah Kaca (GRK) Dari Sektor Sampah Perkotaan Di Indonesia.
Jurnal Teknik Lingkungan, Vol: 10, Hal: 01-08.
Sondari, R. R. dan Suzuki, M. M. (2012). Municipal Solid Waste Management Case Studies between Tokyo and
Indonesia in Waste Sorting and Food Waste Processing Activities. Bulletin of The University of Electro-
Coummunication, No.24, Vol.1, pp. 41-50
Suletra, W., Liquiddanu, E., dan Pamungkas, S. (2009). Optimasi Pengalokasian Sampah Wilayah Ke Tempat
Pembuangan Sementara dengan Model Integer Linear Programming (Studi Kasus Kota Surakarta).
Performa, Vol. 8, No. 1, pp. 14-22
Tsilemou, K. dan Panagiotakopoulos, D. (2006). Approximate Cost Functions For Solid Waste Treatment Facilities.
Waste Management Res, Vol. 26, No. 310, pp. 22
Tsilemou, K. dan Panagiotakopoulos, D. (2007). Economic Asessment of Mechanical-Biological Treatment
Facilities. Environ Res Eng Manag, No. 39, pp. 55-63

The Third Joint Seminar of Japan and Indonesia Environmental
Sustainability and Disaster Prevention (3rd ESDP-2015)
Institut Teknologi Bandung, Indonesia – November 25th, 2015
92
Walla, C. dan Schneeberger, W. (2008). The Optimal Size For Biogas Plant. Biomass Bioenerg, Vol. 32, No. 551, pp.
7
Wei, W., Liang, Y., dan Liu, F. (2014). Taxing Strategies for Carbon Emissions: A Bilevel Optimization Approach.
Jurnal of Energies, Vol: 7, Hal: 2228-2245
Zhou, C., Wang, R., dan Zhang, Y. (2010). Fertilizer Efficiency and Environmental Risk of Irrigating Impatiens With
Composting Leachate in Decentralized Solid Waste Management. Waste Management, Vol. 30, pp. 1000-
1005