Path to purchase consumer journey microsoft advertising 2012
Upload
diana-sherlingCategory
view
136download
0
Trends and latest insights on the luxury automotive purchase decision journey2014 summary
www. dianasherling.com /

An overview of the latest
insights of the car purchase
decision journey1. Time frames of the Purchase Decision Journey
2. Order of ‘places’ that influence

Timeframes of the
Purchase Decision
Journey

Automotive ‘average’
timescales for shopping are
getting shorter
Maritz ‘Car Consumer Purchase Journey’ November 2013
Autotrader ‘The Internet is making Car Shopping More Efficient’ June 2013
and spend on average only 3.75hrs in the dealership
(compared to 7.5hrs in 2011)

google.com/think
AVERAGE NUMBER OF DIGITAL SOURCES USED
7.3
8.1 8.1
<1 month research 1-3 months research 3+ months research
Time is no longer a factor
Source: Millward Brown Digital/Google Vehicle Shopper Path to Purchase Study, September 2013
RT1. Which of the following online sources, if any, did you use to look for information on cars/trucks using these types of devices? N=1591 / O7. How much time passed from when you first
started shopping to when you actually purchased a [Car Type]? N=1591
82% of purchasers are
in-market for
3 months or less
As purchasers use many online sources regardless of time in-market
6
The majority of ‘shoppers’
decide within 3 months
Google ‘Automotive Shopping Behaviour Study’ 2011
Google ‘Digital drives auto shopping’ November 2013

‘Explore’ happens between 3-2
months towards being ‘in-
market’
27 27
purchasers search to navigate to online sources
2009 2010
awareness
interest
consideration
test-drive
purchase
6 Months
share of new buyers referred to OEM sites by search
3 Months
2 Months
1 Month
1 Week
Auto Shopper Behavior Study, Google/Compete, 2011. Clickstream data, by time periods, discrete months, January 2010-December 2010.
30%
37%
42%
48%
38%
25%
37%
36%
40%
34%
search directs at least a third of traffic within 3 months of purchase
Google ‘Automotive Shopping Behaviour Study’ 2011
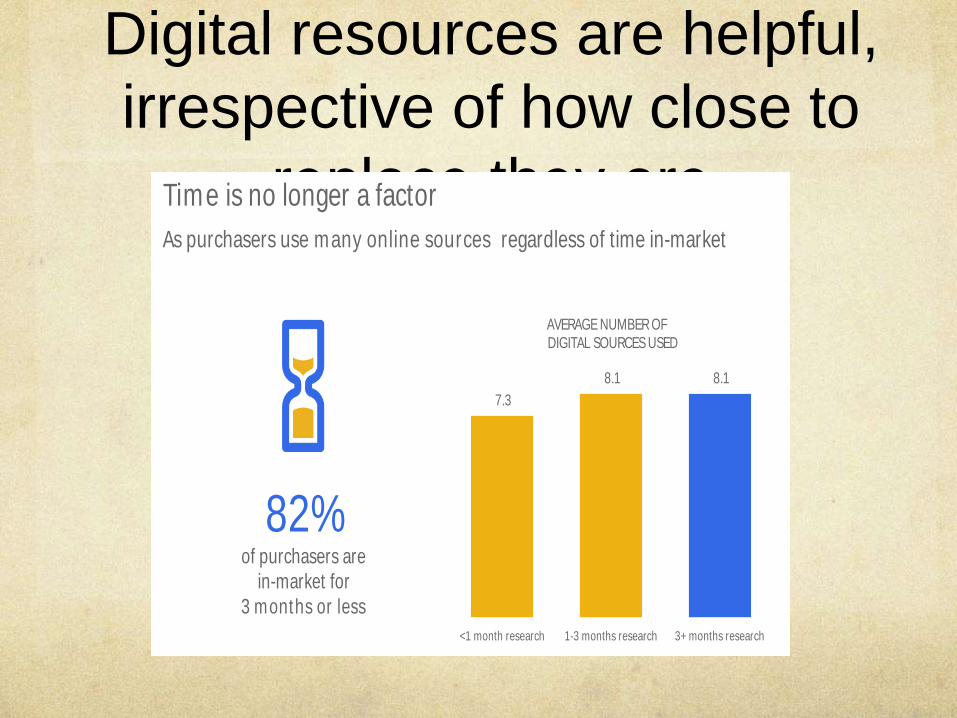
Digital resources are helpful,
irrespective of how close to
replace they are
google.com/think
AVERAGE NUMBER OF DIGITAL SOURCES USED
7.3
8.1 8.1
<1 month research 1-3 months research 3+ months research
Time is no longer a factor
Source: Millward Brown Digital/Google Vehicle Shopper Path to Purchase Study, September 2013
RT1. Which of the following online sources, if any, did you use to look for information on cars/trucks using these types of devices? N=1591 / O7. How much time passed from when you first
started shopping to when you actually purchased a [Car Type]? N=1591
82% of purchasers are
in-market for
3 months or less
As purchasers use many online sources regardless of time in-market
6
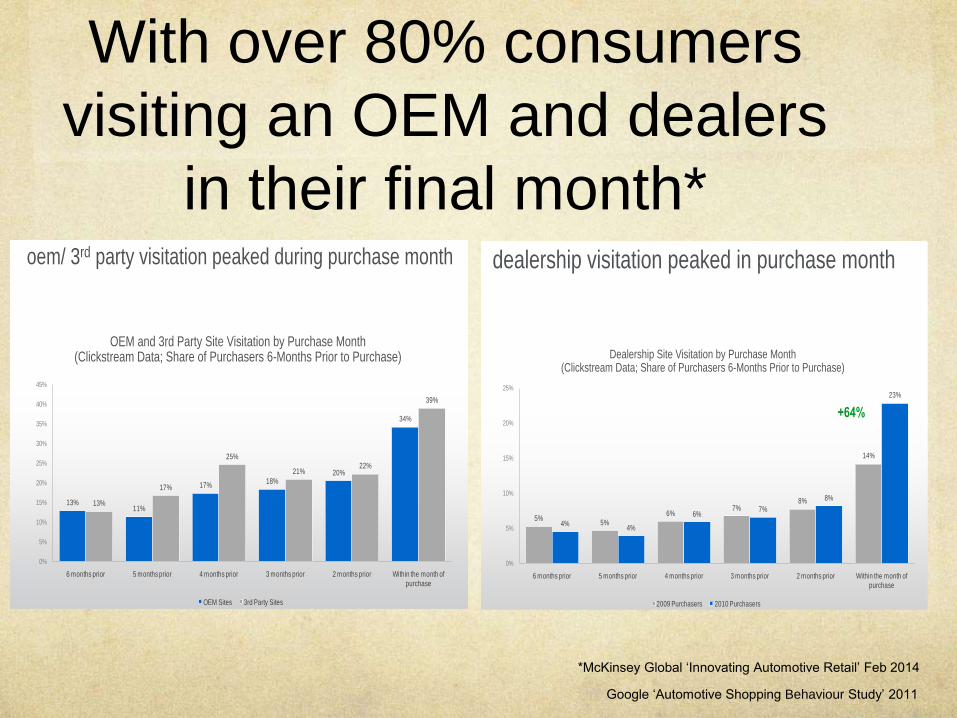
With over 80% consumers
visiting an OEM and dealers
in their final month*
25 25
5%5%
6%7%
8%
14%
4%4%
6%7%
8%
23%
0%
5%
10%
15%
20%
25%
6 months prior 5 months prior 4 months prior 3 months prior 2 months prior Within the month of
purchase
2009 Purchasers 2010 Purchasers
dealership visitation peaked in purchase month
Dealership Site Visitation by Purchase Month (Clickstream Data; Share of Purchasers 6-Months Prior to Purchase)
Auto Shopper Behavior Study, Google/Compete, 2011. Clickstream data, January 2009-December 2010
+64%
*McKinsey Global ‘Innovating Automotive Retail’ Feb 201418 18
oem/ 3rd party visitation peaked during purchase month
OEM and 3rd Party Site Visitation by Purchase Month (Clickstream Data; Share of Purchasers 6-Months Prior to Purchase)
13%11%
17%18%
20%
34%
13%
17%
25%
21%22%
39%
0%
5%
10%
15%
20%
25%
30%
35%
40%
45%
6 months prior 5 months prior 4 months prior 3 months prior 2 months prior Within the month of
purchase
OEM Sites 3rd Party Sites
Auto Shopper Behavior Study, Google/Compete, 2011. Clickstream data, January 2010-December 2010
Google ‘Automotive Shopping Behaviour Study’ 2011

But sometimes the process
isn’t as ‘final’ as we’d like
http://www.nielsen.com/in/en/insights/reports/2014/how-indian-consumers-navigate-the-car-buying-journey.html

Confirmed by McKinsey
McKinsey Global ‘Innovating Automotive Retail’ Feb 2014

80% new and 100% used start
their journey online*
* McKinsey Global ‘Innovating Automotive Retail’ Feb 2014
google.com/think
The research process often kicks off online
Source: Millward Brown Digital/Google Vehicle Shopper Path to Purchase Study, September 2013
MI3. What role did each of the following advertisements play while you were shopping for cars/trucks? Please select all of the responses that apply for each type of advertisement. N=101-1,030.
25%
26%
27%
28%
28%
29%
34%
34%
34%
35%
Magazine ad
Newspaper ad
Online site ad
Email ad
Search ad
TV ad
Tablet ad
Mobile ad
Video ad
Direct mail
AD TYPES THAT PROMPTED CONSUMERS TO START RESEARCHING
3 OF 5 top ad formats for
prompting research
were digital
9

With an increasing number of
digital touchpoints used for
research

Digital hugely influences ‘in
person’ action at the
dealers
google.com/think
19%
27%
35%
38%
53%
26%
32%
37%
37%
40%
43%
56%
57%
62%
69%
77%
81%
83%
59%
82%
89%
89%
Radio
Flyers & brochures
Magazines
Newspapers
TV
Auction sites
Newspaper sites
Social media
Video sites
Classified/listing sites
Online mapping tools
Regional dealer sites
Consumer review sites
Professional review sites
Third party sites
Family & friends
Salesperson
Test drive
Dealer visit
Digital plays a big role leading up to purchase
Source: Millward Brown Digital/Google Vehicle Shopper Path to Purchase Study, September 2013 RT1. Which of the following online sources, if any, did you use to look for information on cars/trucks using these types of devices? Please select all options that apply for each source. N=1,591
(2013); N=1072 (2012) / RT2. Which of the following sources, if any, did you use to look for information on cars/trucks? N=1,591 (2013); N=1072 (2012)
+20% YoY
+23% YoY
+28% YoY
In Person
Online
Offline
Dealer sites
Manufacturer sites
Search engines
8
Google ‘Digital drives auto shopping’ November 2013

With some consumers are
already doing the entire
journey on their mobilesMobile in particulars use has increased by 460% year
on year and is increasingly used for all stages of the
purchase decision journey
google.com/think
Shoppers turn to mobile for a variety of research & comparison activities
Source: Millward Brown Digital/Google Vehicle Shopper Path to Purchase Study, September 2013
RT11. Which of the following, if any, did you do on your mobile device (e.g., tablet and/or mobile phone) while shopping for cars/trucks? Please select all that apply. N=715 (2013)/N=338 (2012)
29%
35%
35%
37%
37%
38%
38%
39%
39%
44%
Searched dealer inventory
Read auto reviews
Read car/truck features & specs
Compared vehicles
Read general car/truck info
Located dealer
Viewed current offers
Read consumer reviews
Called dealer
Viewed images of cars/trucks
MOBILE ACTIONS TAKEN WHILE SHOPPING
+47% YoY
+46% YoY
+57% YoY
11
Google ‘Digital drives auto shopping’ November 2013