Capital structure analysis for nrb bearings
19
CAPITAL STRUCTURE ANALYSIS PREPARED BY : SUMIT KR SINGH
-
Upload
sumit-kr-singh -
Category
Data & Analytics
-
view
79 -
download
3
Transcript of Capital structure analysis for nrb bearings
CAPITAL STRUCTURE ANALYSIS
PREPARED BY : SUMIT KR SINGH

COMPANY’S PROFILE
Date of Establishment 30-06 1965
Revenue 94.5557 ( USD in Millions )
Market Cap 11252.71386 ( Rs. in Millions )
Corporate Address Dhannur,15 Sir P M Road ,Fort Mumbai-400001,
Maharashtra
www.nrbbearings.com
Management Details Chairperson - Trilochan Singh Sahney
MD -
Directors - Ashank Desai, Devesh S Sahney, Aslesha A
Gowariker, S B (Ravi) Pandit, Uday Khanna, Tashwinder
Singh, Harshbeena S Zaveri
Business Operation Bearings
Background NRB Bearing was incorporated in 1965 as an Indo-French
venture with Nadella, pioneering the production of needle
roller bearings in India. NRB acquired SNL Bearings in
June 2000. Over the years NRB has expanded to five
modern manufacturing facilities producing needle,
spherical, cylindrical, wide-inner ring bearings, tapered
roller bearings and ball bearings. The TUV Managements
services (Gmbh), internatio
Company Secretary Satish C Rangani
Bankers DBS Bank, Citi Bank, BNP Paribas
Auditors Deloitte Haskins & Sells
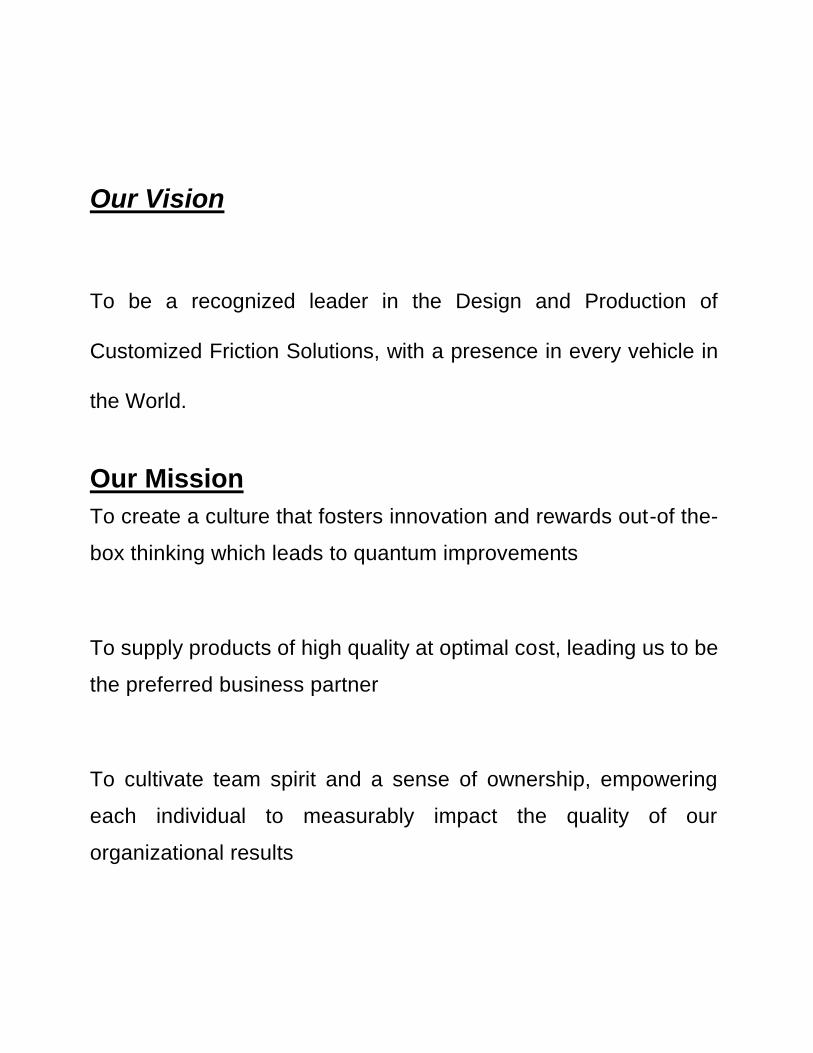
Our Vision
To be a recognized leader in the Design and Production of
Customized Friction Solutions, with a presence in every vehicle in
the World.
Our Mission
To create a culture that fosters innovation and rewards out-of the-
box thinking which leads to quantum improvements
To supply products of high quality at optimal cost, leading us to be
the preferred business partner
To cultivate team spirit and a sense of ownership, empowering
each individual to measurably impact the quality of our
organizational results

To recognize individuals who respect and communicate our values
and are consistently ethical
What is a 'Capital Structure'
A capital structure is a mix of a company's long-term debt, specific short-term
debt, common equity and preferred equity. The capital structure is how a
firm finances its overall operations and growth by using different sources of
funds.
Debt comes in the form of bond issues or long-term notes payable, while
equity is classified as common stock, preferred stock or retained
earnings. Short-term debt such as working capital requirements is also
considered to be part of the capital structure.
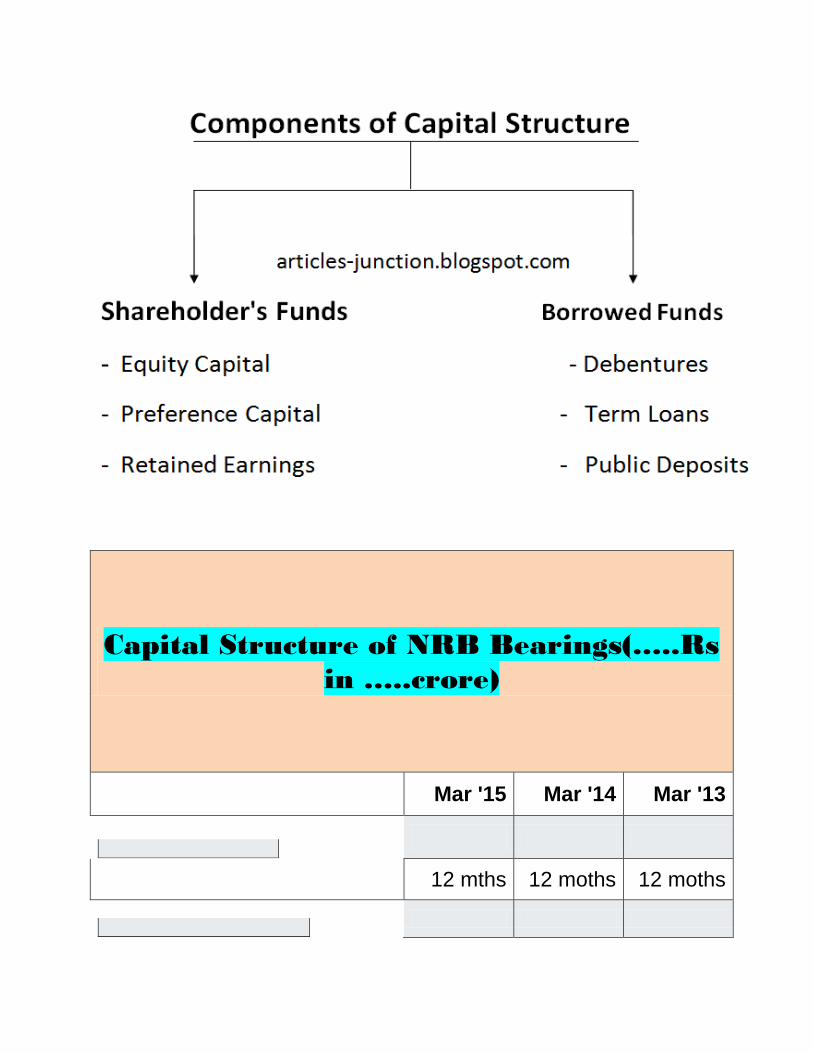
Capital Structure of NRB Bearings(…..Rs
in …..crore)
Mar '15 Mar '14 Mar '13
12 mths 12 moths 12 moths
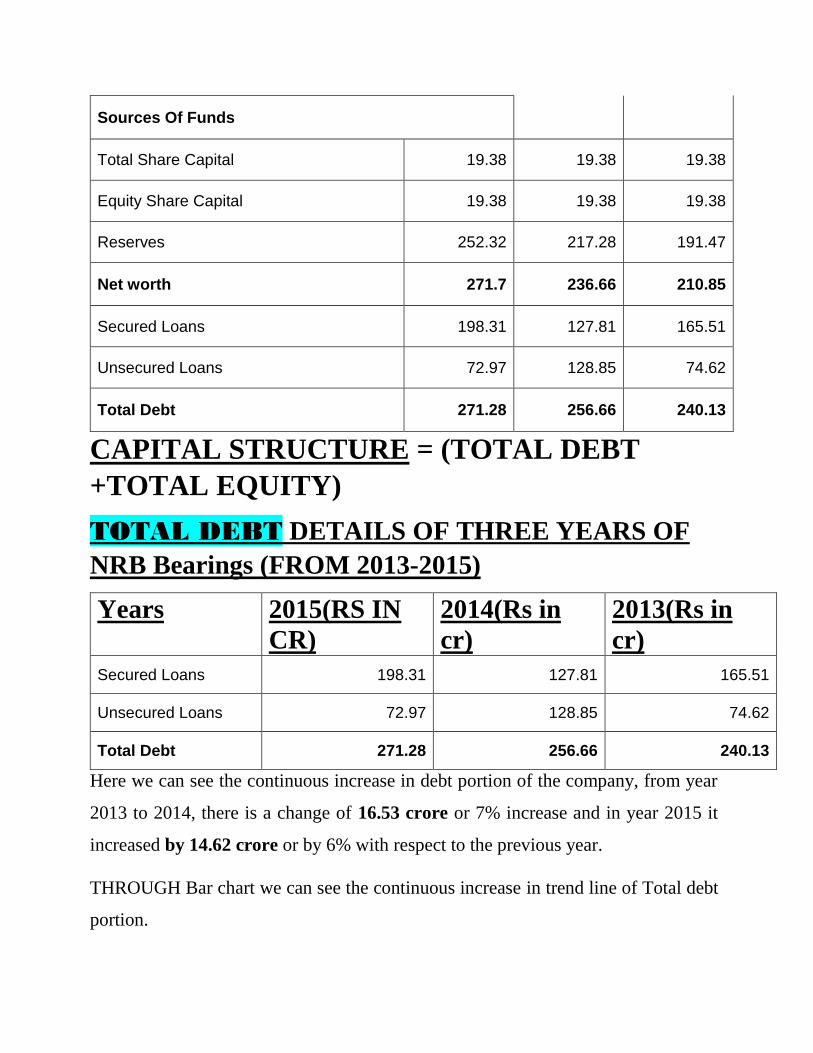
Sources Of Funds
Total Share Capital 19.38 19.38 19.38
Equity Share Capital 19.38 19.38 19.38
Reserves 252.32 217.28 191.47
Net worth 271.7 236.66 210.85
Secured Loans 198.31 127.81 165.51
Unsecured Loans 72.97 128.85 74.62
Total Debt 271.28 256.66 240.13
CAPITAL STRUCTURE = (TOTAL DEBT
+TOTAL EQUITY)
TOTAL DEBT DETAILS OF THREE YEARS OF
NRB Bearings (FROM 2013-2015)
Years 2015(RS IN
CR)
2014(Rs in
cr)
2013(Rs in
cr)
Secured Loans 198.31 127.81 165.51
Unsecured Loans 72.97 128.85 74.62
Total Debt 271.28 256.66 240.13
Here we can see the continuous increase in debt portion of the company, from year
2013 to 2014, there is a change of 16.53 crore or 7% increase and in year 2015 it
increased by 14.62 crore or by 6% with respect to the previous year.
THROUGH Bar chart we can see the continuous increase in trend line of Total debt
portion.

TOTAL EQUITY DETAILS FOR THREE YEARS
NRB Bearings (FROM2013-2015)
YEARS 2015(Rs in cr) 2014(Rs in cr) 2013(Rs in cr)
Total Share Capital 19.38 19.38 19.38
Equity Share Capital 19.38 19.38 19.38
Reserves 252.32 217.28 191.47
Net worth 271.7 236.66 210.85
Here in case of equity share also we can see the continuous increase in equity portion
(from year 2013 to 2015 there is a change of 60.85 crore or 29%), but here company
is not increasing the further equity shareholdings, the main reason for increase in their
Mar '15 Mar '14 Mar '13
Secured Loans 198.31 127.81 165.51
Unsecured Loans 72.97 128.85 74.62
Total Debt 271.28 256.66 240.13
198.31
127.81
165.51
72.97
128.85
74.62
271.28256.66
240.13
0
50
100
150
200
250
300
rs in
cr
Axis Title
Chart showing Debt portion
Secured Loans Unsecured Loans Total Debt Linear (Total Debt)
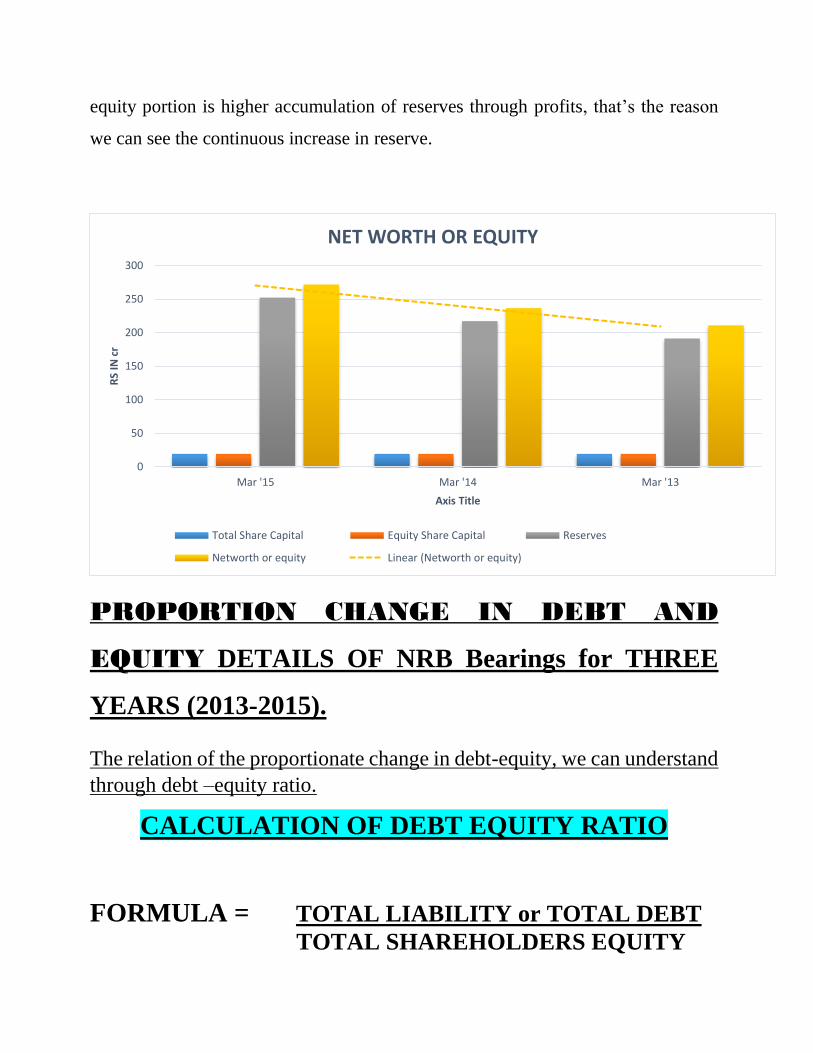
equity portion is higher accumulation of reserves through profits, that’s the reason
we can see the continuous increase in reserve.
PROPORTION CHANGE IN DEBT AND
EQUITY DETAILS OF NRB Bearings for THREE
YEARS (2013-2015).
The relation of the proportionate change in debt-equity, we can understand
through debt –equity ratio.
CALCULATION OF DEBT EQUITY RATIO
FORMULA = TOTAL LIABILITY or TOTAL DEBT TOTAL SHAREHOLDERS EQUITY
0
50
100
150
200
250
300
Mar '15 Mar '14 Mar '13
RS
IN c
r
Axis Title
NET WORTH OR EQUITY
Total Share Capital Equity Share Capital Reserves
Networth or equity Linear (Networth or equity)
YEAR 2015(Rest in
cry)
2014(Rs in
cr)
2013(Rs in
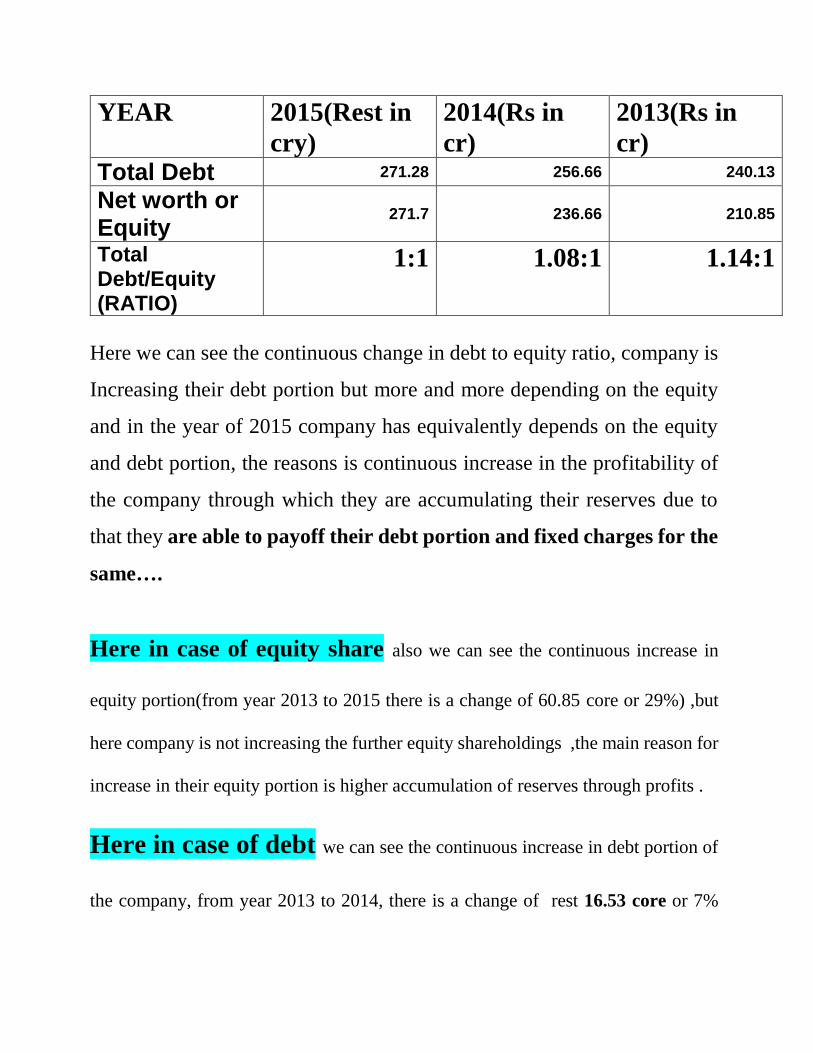
cr) Total Debt 271.28 256.66 240.13
Net worth or Equity
271.7 236.66 210.85
Total Debt/Equity (RATIO)
1:1 1.08:1 1.14:1
Here we can see the continuous change in debt to equity ratio, company is
Increasing their debt portion but more and more depending on the equity
and in the year of 2015 company has equivalently depends on the equity
and debt portion, the reasons is continuous increase in the profitability of
the company through which they are accumulating their reserves due to
that they are able to payoff their debt portion and fixed charges for the
same….
Here in case of equity share also we can see the continuous increase in
equity portion(from year 2013 to 2015 there is a change of 60.85 core or 29%) ,but
here company is not increasing the further equity shareholdings ,the main reason for
increase in their equity portion is higher accumulation of reserves through profits .
Here in case of debt we can see the continuous increase in debt portion of
the company, from year 2013 to 2014, there is a change of rest 16.53 core or 7%

increase and in year 2015 it increased by rs 14.62 crore or by 6% with respect to the
previous year.
The entire change in the debt equity portion has an effects on the financial
leverage, earning per share, Interest obligation and the dividend policy of
the company.
That will be further analyzed.
INTEREST OBLIGATIONS DUE TO DEBT STRUCTURE
Year 2015 2014 2013
Operating Profit
114.75
114.75
100.61
PBDIT
118.37
105.18
102.33

Interest
15.85 17.19 17.31
Chart shows the trend of Interest obligations.
Here we can see that after continuous increase in debt also interest obligation is
decreasing it may be because of the lower cost of debt in continuous years debt
financing, due to change in the debt proportion of the company, the actual change or
decrease in interest payable from 2013 to 2015 is RS 1.44 crore and decrease in %
change by 8%.
DIVIDEND DETAILS AND PAYOUT RATIO
Financial Ratios of NRB Bearings
Per Share Ratios Mar 15 14-Mar 13-Mar
Dividend / Share(Rs.) 1.5 1.1 1.7
Dividend Payout Ratio (NP) (%) 27.92 27.92 35.03
Dividend Payout Ratio (CP) (%) 18.08 14.92 21.39
Mar '15 Mar '14 Mar '13
Interest 15.87 17.19 17.31
15
15.5
16
16.5
17
17.5
18
Rs
in c
r
Axis Title
Interest Obligations
Interest Linear (Interest)
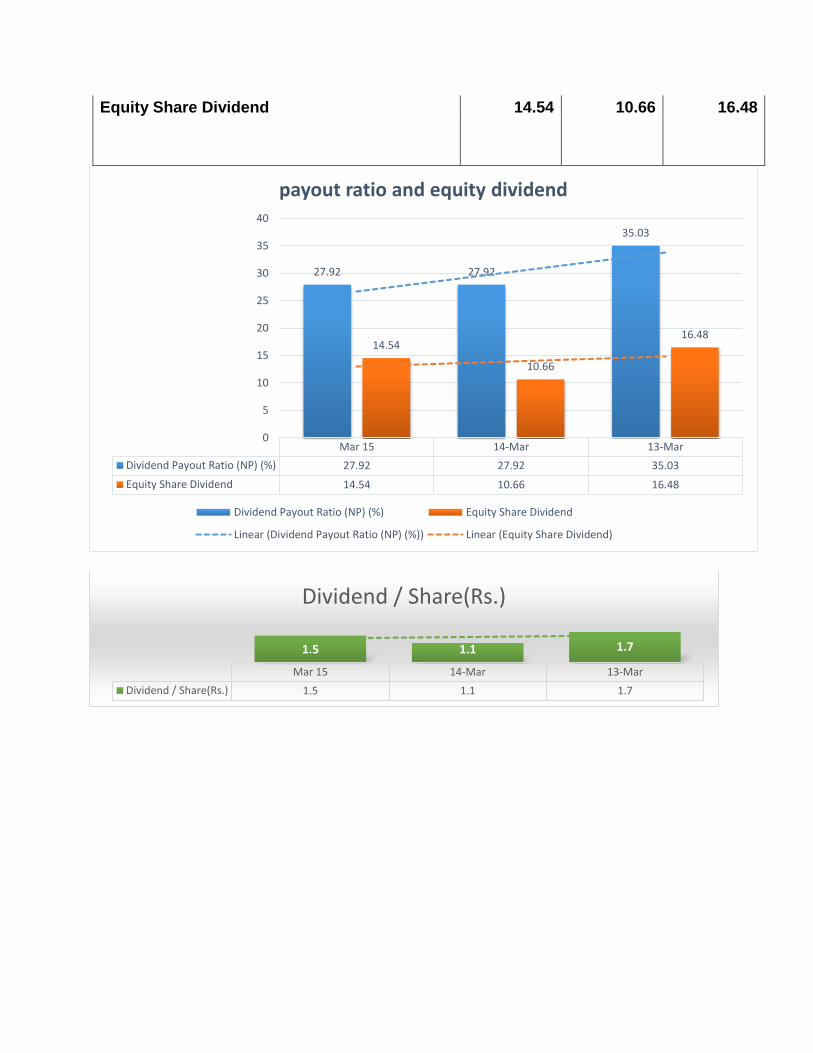
Equity Share Dividend 14.54 10.66 16.48
Mar 15 14-Mar 13-Mar
Dividend Payout Ratio (NP) (%) 27.92 27.92 35.03
Equity Share Dividend 14.54 10.66 16.48
27.92 27.92
35.03
14.54
10.66
16.48
0
5
10
15
20
25
30
35
40
payout ratio and equity dividend
Dividend Payout Ratio (NP) (%) Equity Share Dividend
Linear (Dividend Payout Ratio (NP) (%)) Linear (Equity Share Dividend)
Mar 15 14-Mar 13-Mar
Dividend / Share(Rs.) 1.5 1.1 1.7
1.5 1.1 1.7
Dividend / Share(Rs.)

Here we can see the relationship between dividend per share, payout ratio
and the equity dividend available to shareholders because all are varying
because of the profitability proportion of the firm.
Here we can directly see company is changing their payout policy, in year
2013 company pays 35.03% of total earnings of the firm but in successive
years company reduced payout ratio to 27.92%, it may be because of
reduction in debt and future investment purpose of the firm.so firm decided
to reduce the dividend rate and started accumulating reserves for
investments and debt payout purpose.
DIVIDEND POLICY OF YEAR 2013 AND 2015
1.5 1.1 1.7
27.92 27.92
35.03
14.54
10.66
16.48
0
5
10
15
20
25
30
35
40
Mar 15 14-Mar 13-Mar
dividend policy
Dividend / Share(Rs.) Dividend Payout Ratio (NP) (%)
Equity Share Dividend Linear (Dividend Payout Ratio (NP) (%))

Dividend (2013)
Directors recommend dividend of Rs.1.70/- per equity share of Rs.2/- (Rs.2.00 per
share for previous year) payable to members/beneficial owners as per the Register of
Members as applicable aggregating Rs.1647.68 lacs.
Dividend (2015)
Directors recommend dividend of Rs.1.50/-per equity share of Rs.2/-
(Rs.1.10 per share for previous year) payable to members/beneficial
Owners as per the Register of Members as applicable aggregating Rest.
1453.84 lacs.
LEVERAGE
The degree to which an investor or business is utilizing
borrowed money. Companies that are highly leveraged may be at risk of bankruptcy if they
are unable to make payments on their debt; they may also be unable to find new lenders in

The future.
The ability of the company to pay the fixed charges or cost.
TYPES OF LEVERAGE
FINANCIAL LEVERAGE OPERATING LEVERAGE
FINANCIAL LEVERAGE
Financial leverage can be aptly described as the extent to which a business or
investor is using the borrowed money. Business companies with high leverage are
considered to be at risk of bankruptcy if, in case, they are not able to repay the debts,
it might lead to difficulties in getting new lenders in future. It is not that financial
leverage is always bad. However, it can lead to an increased shareholders’ return on

investment. Also, very often, there are tax advantages related with borrowing, also
known as leverage.
FORMULA = EBIT (Earnings before interest and taxes)
EBT (Earning Before Tax)
CALCULATION OF EBIT AND EBT
Mar 15 14-Mar 13-Mar
PBDIT 118.37 105.18 102.33
Less: depreciation 28.31 33.27 29.97
EBIT 90.06 71.91 72.36 LESS: Interest 15.87 17.19 17.31
EBT 74.19 54.72 55.05
CALCULATION OF FINANCIAL LEVERAGE (FL)
YEAR 2015 2014 2013
EBIT 90.06 71.91 72.36 EBT 74.19 54.72 55.05 FINANCIAL
LEVERAGE)
1.214 1.314 1.314

Here we can see on the base of financial leverage risk proportion has reduced ,in year
2013 risk proportion was high because of high financial leverage and it has reduced
from 1.314 to 1.214 in year 2015 and firm risk element has reduced due to low
financial Leverage.
Definition of Degree of Financial Leverage
The degree of financial leverage (DFL) is the leverage ratio that sums up the effect
of an amount of financial leverage on the earning per share of a company. The degree
of financial leverage or DFL makes use of fixed cost to provide finance to the firm
and also includes the expenses before interest and taxes. If the Degree of Financial
Leverage is high, the Earnings per Share or EPS would be more unpredictable while
all other factors would remain the same.
CALCULATION OF DDEGREE OF FINANCIAL LEVERAGE
FORMULA= %Change in EPS
%Change in EBIT
CALCULATION OF %CHANGE IN EBITAND EPS
Mar 15 14-Mar 13-Mar
PBDIT 118.37 105.18 102.33
Less: depreciation 28.31 33.27 29.97
EBIT 90.06 71.91 72.36
LESS: Interest 15.87 17.19 17.31

EBT 74.19 54.72 55.05 Earnings Per Share (Rs) 5.37 3.94 4.85
% CHANGE IN EPS 36% 19% 3%
%CHANGE IN EBIT 20% 1% 10%
DOFL (DEGREE OF FINANCIAL LEVERAGE)
YEAR 2015 2014 2013
% CHANGE IN EPS 36% 19% 3%
%CHANGE IN EBIT 20% 1% 10% DEGREE OF FINANCIAL
LEVERAGE 1.8 19 .3
The ratio shows that the higher the degree of financial leverage, the more volatile is
EPS. Since interest is a fixed expense, leverage magnifies returns and EPS, which is
good when operating income is rising, but it can be a problem during tough economic
times when operating income is under pressure.
If the DOFL IS EQUAL TO 1 than company is operating well and there is not
such volatility in earning potential of the firm. But here DOFL is changing by
huge % and it shows the high level of risk element for EPS.
OVERALL ANALYSIS
1. On the base of debt equity portion we can see the dramatic increase in debt, debt
equity ratio is continuous decreasing, and the earning potential of the firm is
increasing, that can be seen through the EPS of the firm.
TAX SHIELD ALSO PLAYS IMPORTANT ROLE IN INCREASE IN EPS
2. The prime reason for increase in the profit and EPS and also the market value of
share is high level of accumulation of profit through lowest dividend payout policy
of the firm that reflects through reserves.

3. Here there is no increase in the share value of the firm, increase in the net worth
due to increased profit and the high reserves.
4. On the base of degree of financial leverage we can say that the risk element of the
firm has reduced through successive years because of low financial leverage.
5.But DOFL shows that the volatility into the earning capacity of the firm
irrespective of increased earning ,that is reflected through the EPS .WHICH SHOWS
The high volatility into the fixed charges of the firm that reflected through the DOFL.
FUTURE PROSPECT OF THE COMPANY IS GOOD AND COMPANY
CONTINOUSLY MAKING HIGHER PROFITS AND MAKING LESS DEBT
PROPORTION TO GET THE HIGH MARKET PRICE AND EPS.