Capital ight and development: An overview of concepts ... · United Nations Development Programme...
24
Transcript of Capital ight and development: An overview of concepts ... · United Nations Development Programme...
Capital �ight and development: An overview of
concepts, methods, and data sources
Niels Johannesen (University of Copenhagen) andJukka Pirttilä (University of Tampere and UNU-WIDER)
UNU-WIDER and National Treasury Conference(Pretoria, 1 December 2016)
1 / 24
Outline
Introduction
Capital �ight by individualsEstimates by ZucmanAlternative estimates
Cross-border activities by �rmsSome in�uential macro-level estimatesMicro-data based estimates
Discussion
2 / 24

Background
I Much emphasis in tax and development debates on thepotential losses of tax revenues that is due to capital �ight
I Capital �ight (sudden out�ow of cash and securities) canpartly be illicit / at least in the gray area
I Such activities can be undertaken by both individuals (notreporting capital income they hold o�shore) or �rms (bytransfer pricing)
I How severe are the revenue losses due to such activities?
I Our recent UNU-WIDER study (Johannesen and Pirttilä,2016) o�ers a critical review of current estimates
3 / 24
Outline
Introduction
Capital �ight by individualsEstimates by ZucmanAlternative estimates
Cross-border activities by �rmsSome in�uential macro-level estimatesMicro-data based estimates
Discussion
4 / 24

Outline
Introduction
Capital �ight by individualsEstimates by ZucmanAlternative estimates
Cross-border activities by �rmsSome in�uential macro-level estimatesMicro-data based estimates
Discussion
5 / 24
Outline
Introduction
Capital �ight by individualsEstimates by ZucmanAlternative estimates
Cross-border activities by �rmsSome in�uential macro-level estimatesMicro-data based estimates
Discussion
6 / 24
Estimates of hidden wealth by individuals
I Zucman (2013, 2015) estimates the extent of �nancial wealthheld by private individuals o�shore
I The method relies on anomalies in countries' portfoliosecurities data (assets and liabilities positions of countries)
I worldwide total liabilities exceed total assetsI because assets held in tax havens are not reported
I there is also a systematic pattern that tax havens feature thelargest discrepancies
7 / 24
Outline
Introduction
Capital �ight by individualsEstimates by ZucmanAlternative estimates
Cross-border activities by �rmsSome in�uential macro-level estimatesMicro-data based estimates
Discussion
8 / 24
The sources-and-uses and hot-money methods
I Uses countries' balance of payments dataI Sources: (net) increases in foreign debt and (net) increases inforeign direct investment
I Uses: the de�cit on the current account and increases in thecountry's foreign reserves
I If sources exceed uses, it is thought that this must be due totransfers of capital to foreign countries by private individuals
I This includes errors and omissions + some other �ows (suchas deposits by foreign banks + short-term capital �ows)
I Therefore, recent hot money estimates concentrate only onerrors and omissions
9 / 24
Results from these methods
I Zucman estimates that 8% of �nancial wealth is hidden in taxhavens
I Using assumptions on rates of return and e�ective capitalincome tax rates, the stock can be changed into a �ow ofrevenue losses
I worldwide summing up to around 200 billion USD annually
I Sources and usesI United Nations Development Programme (2011): US$20billion from the least developed countries
I Henry (2012):US$150�200 billion from all developing countries
I Hot money narrowI Global Financial Integrity (2015): US$200 billion fromdeveloping countries
10 / 24
Outline
Introduction
Capital �ight by individualsEstimates by ZucmanAlternative estimates
Cross-border activities by �rmsSome in�uential macro-level estimatesMicro-data based estimates
Discussion
11 / 24

Outline
Introduction
Capital �ight by individualsEstimates by ZucmanAlternative estimates
Cross-border activities by �rmsSome in�uential macro-level estimatesMicro-data based estimates
Discussion
12 / 24
Corporate tax spillovers
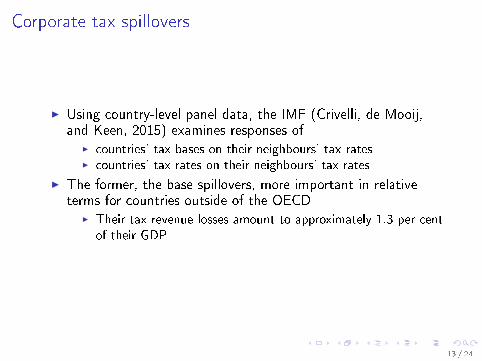
I Using country-level panel data, the IMF (Crivelli, de Mooij,and Keen, 2015) examines responses of
I countries' tax bases on their neighbours' tax ratesI countries' tax rates on their neighbours' tax rates
I The former, the base spillovers, more important in relativeterms for countries outside of the OECD
I Their tax revenue losses amount to approximately 1.3 per centof their GDP
13 / 24
Gross excluding reversals
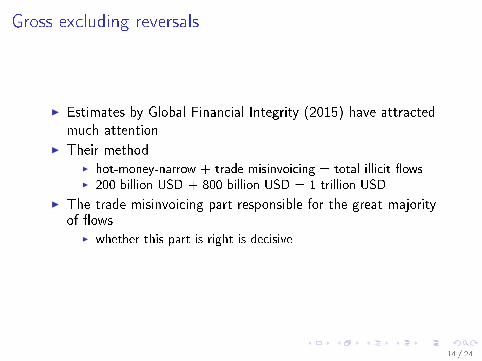
I Estimates by Global Financial Integrity (2015) have attractedmuch attention
I Their methodI hot-money-narrow + trade misinvoicing = total illicit �owsI 200 billion USD + 800 billion USD = 1 trillion USD
I The trade misinvoicing part responsible for the great majorityof �ows
I whether this part is right is decisive
14 / 24
Trade misinvoicing channel
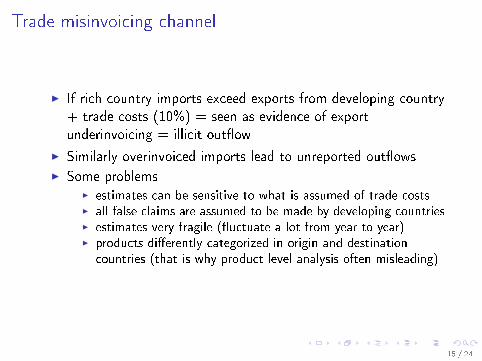
I If rich country imports exceed exports from developing country+ trade costs (10%) = seen as evidence of exportunderinvoicing = illicit out�ow
I Similarly overinvoiced imports lead to unreported out�ows
I Some problemsI estimates can be sensitive to what is assumed of trade costsI all false claims are assumed to be made by developing countriesI estimates very fragile (�uctuate a lot from year to year)I products di�erently categorized in origin and destinationcountries (that is why product-level analysis often misleading)
15 / 24
Trade misinvoicing channel II
I Perhaps most puzzling is that if one estimates also illicitin�ows using the same method (but a mirror image), theyexceed illicit out�ows. So on average, developing countriesbene�t from these �ows
I Bottom line: it is hard to use their numbers to come up withconvincing estimates (see also Nitsch 2016)
I Even if numbers were correct, one needs to remember that thegreatest out�ows are from large middle-income countries,meaning that public �nance issues in poorest countries wouldnot be solved if these �ows were curtailed
16 / 24
Outline
Introduction
Capital �ight by individualsEstimates by ZucmanAlternative estimates
Cross-border activities by �rmsSome in�uential macro-level estimatesMicro-data based estimates
Discussion
17 / 24
Utilizing international enterprise data sets
I This research strategy utilizes �rm-level panels where parentsand their subsidiaries are linked to study transfer mispricing
I �rms can use within-company-chain pricing to shift pro�tsacross borders
I The pro�t shown in an a�liate is explained by the tax variables(e.g. the tax di�erence between the destination and the origin)
I The method has been used outside of developed countries onlyvery recently:
I OECD (2015): estimated annual global loss of governmentrevenue from base erosion and pro�t shifting of aroundUS$100�240 billion
I Johannesen, Tørsløv, and Wier (2016): develop methods thatare less demanding in terms of data requirements and applythem to a global sample of multinational �rms. Reportedpro�ts are roughly twice as sensitive to tax incentives indeveloping countries as in developed countries.
18 / 24

Some new approaches
I Using customs data to impute transfer pricingI Cristea and Nguyen (2016): Danish �rms + foreign taxvariation
I Event studiesI Johannesen and Larsen (2016): study the adoption of new�nancial reporting standards by the European Commission forthe value of oil, gas, and mining �rms (value dropped up to10%)
I LeaksI Galizia and Galizia (2016): leaked data by InternationalConsortium of Investigative Journalists used to study theresponses to European savings directive
19 / 24
Outline
Introduction
Capital �ight by individualsEstimates by ZucmanAlternative estimates
Cross-border activities by �rmsSome in�uential macro-level estimatesMicro-data based estimates
Discussion
20 / 24
What do the numbers mean for Africa?
I Zucman (2015) calculates that Africa loses tax revenuesamounting to 14 billion USD due to capital held o�shore byindividuals
I Applying the estimates of Crivelli, de Mooij, and Keen (2015)implies that the revenue loss from income-shifting by MNEs isapproximately 20 billion USD
I At the same time, ODA to Africa (50 billion USD) exceeds therevenue loss due to illegal capital �ight in Africa
I the revenue loss is around 10% of their tax revenuesI also smaller than FDI or remittances
I To sum up: illicit capital �ight is a serious problem butunlikely to solve African revenue issues. Domestic sourcesmust continue to be responsible for the bulk of tax collection
21 / 24
Conclusion
I It is true that developing countries are more vulnerable tocapital �ight (also because of the greater relative importanceof the CIT)
I Research on illicit �nancial �ows bene�ts from shiftingattention to more credible micro-data based estimates
I also studies evaluating the e�ectiveness of policies designed tocombat these �ows
I using peer review to screen the results before publishing
I Investing in technical assistance to help tax agencies to raiserevenues from both domestic actors and multinationals holdsconsiderable promise
I Supporting international tax units in the revenue authorities indeveloping countries to bene�t more from international taxinformation exchange would be one example of such initiatives.
22 / 24
References I
Cristea, A., and D. Nguyen (2016): �Transfer Pricing by MultinationalFirms: New Evidence from Foreign Firm Ownerships,� American
Economic Journal: Economic Policy, forthcoming.
Crivelli, E., R. de Mooij, and M. Keen (2015): �Base Erosion, Pro�tShifting and Developing Countries,� Working Paper 15/118,International Monetary Fund.
Galizia, M., and P. Galizia (2016): �O�shore Financial Activity and TaxPolicy: Evidence from a Leaked Dataset,� Journal of Public Policy,forthcoming.
Global Financial Integrity (2015): �Illicit Financial Flows from DevelopingCountries: 2004-2013,� .
Henry, J. (2012): The Price of O�shore Revisited. Chesham, Bucks: TaxJustice Network.
Johannesen, N., and D. Larsen (2016): �The Power of FinancialTransparency: An Event Study of Country-by-Country ReportingStandards,� Economics Letters, forthcoming.
23 / 24
References IIJohannesen, N., and J. Pirttilä (2016): �Capital �ight and development:
An overview of concepts, methods, and data sources,� WorkingPaper 95, UNU-WIDER.
Johannesen, N., T. Tørsløv, and L. Wier (2016): �Are Less DevelopedCountries more Exposed to Multinational Tax Avoidance?: Methodand Evidence from Micro-Data,� Working Paper 10, UNU-WIDER.
Nitsch, V. (2016): �Trillion Dollar estimate: Illicit �nancial �ows fromdeveloping countries,� Discussion Papers in Economics 227,Technische Universität Darmstadt.
OECD (2015): �Measuring and Monitoring BEPS, Action 11�2015 FinalReport,� Base Erosion and Pro�t Shifting Project.
United Nations Development Programme (2011): �Illicit Financial Flowsfrom the Least Developed Countries: 1990�2008,� .
Zucman, G. (2013): �The Missing Wealth of Nations, Are Europe andthe U.S. net Debtors or net Creditors?,� Quarterly Journal of
Economics, 128(3), 1321�1364.
(2015): The Hidden Wealth of Nations. The Scourge of Tax
Havens. The University of Chicago Press.
24 / 24