Canara Bank Stock Update Initiating Coverage Canara Bank
15
1 Canara Bank Stock Update Canara Bank Initiating Coverage October 18, 2021
Transcript of Canara Bank Stock Update Initiating Coverage Canara Bank

1
Canara Bank
Stock Update
Canara Bank
Initiating Coverage
October 18, 2021
2
Canara Bank
Our Take:
Post the amalgamation with Syndicate Bank, Canara Bank has become third largest public sector bank in terms of total business. With over a century of banking operations in the India, it has become an established player in the south region. Apart from banking, it also has presence across various financial services via Subsidiaries and JVs. The bank has well-balanced asset mix and it has started focusing on retail, agriculture and MSME (“RAM”) sectors which will lead to better risk diversification, increased revenue and improved margins. Canara bank has raised money via QIP in two tranches in the past one year; still it lags behind the peers. The CASA ratio, which remained below the industry average level, has started to improve with the amalgamation and management’s increased focus. The earning profile of the bank was modest in past few years due to high credit cost, which has started to improve from FY21. It has built up strong provision buffer (PCR at 81.2% as of Q1FY22), which otherwise was cause of worry earlier. We believe that worst in terms of asset quality deterioration is over and now the positive steps by the Government over past several years like consolidation of various PSU banks, capital infusion, formation of ‘bad bank’ etc. have improved the environment for growth. Recent announcement of the Union Cabinet’s approval of Central Government guarantee of up to Rs. 30,600 Cr to National Asset Reconstruction Company Limited for five years will be positive for large PSU banks. Canara Bank will be the lead sponsor and biggest shareholder of National Asset Reconstruction Company Ltd (NARCL), contributing up to 12% equity to comply with new rules after the Reserve Bank of India (RBI) amended its capital structure. Faster resolution by the IBC could also help in recoveries and bring down slippages in future. Privatization buzz has kept the PSU bank sector in limelight. Acquisition of some PSB by any prestigious corporates/Institutions – local or foreign - at a good valuation may rerate the sector. We remain cautious on the asset quality front due to high corporate book. It has high BB & below rated book and has high exposure to sectors like Infrastructure, NBFC etc. Valuation & Recommendation: The earnings profile of Canara Bank was severely impacted over the last few years primarily because of high credit costs; the same has seen an improvement in since FY21. The bank reported profit after tax (PAT) of Rs 2558Cr during FY21, as compared to substantial losses incurred over the last couple of years (loss of Rs 2236Cr reported for FY20). Going forward, we expect Canara Bank to grow its loan book at 8.5% CAGR while NII and Net profit are expected to grow at 10.9% and 72.1% (due to lower base) CAGR respectively over FY21-23E. ROAA is estimated to improve to 0.6% in FY23E from current 0.3% in FY21 and RoE could rise to 10.8% in FY23 from 5.2% in FY21. For the overall industry, with the arrival of the festive season, the credit growth is likely to improve in coming months, driven by retail and agriculture while industry and services continue to be slow. We expect healthy recoveries and upgrades in next two years. Asset quality
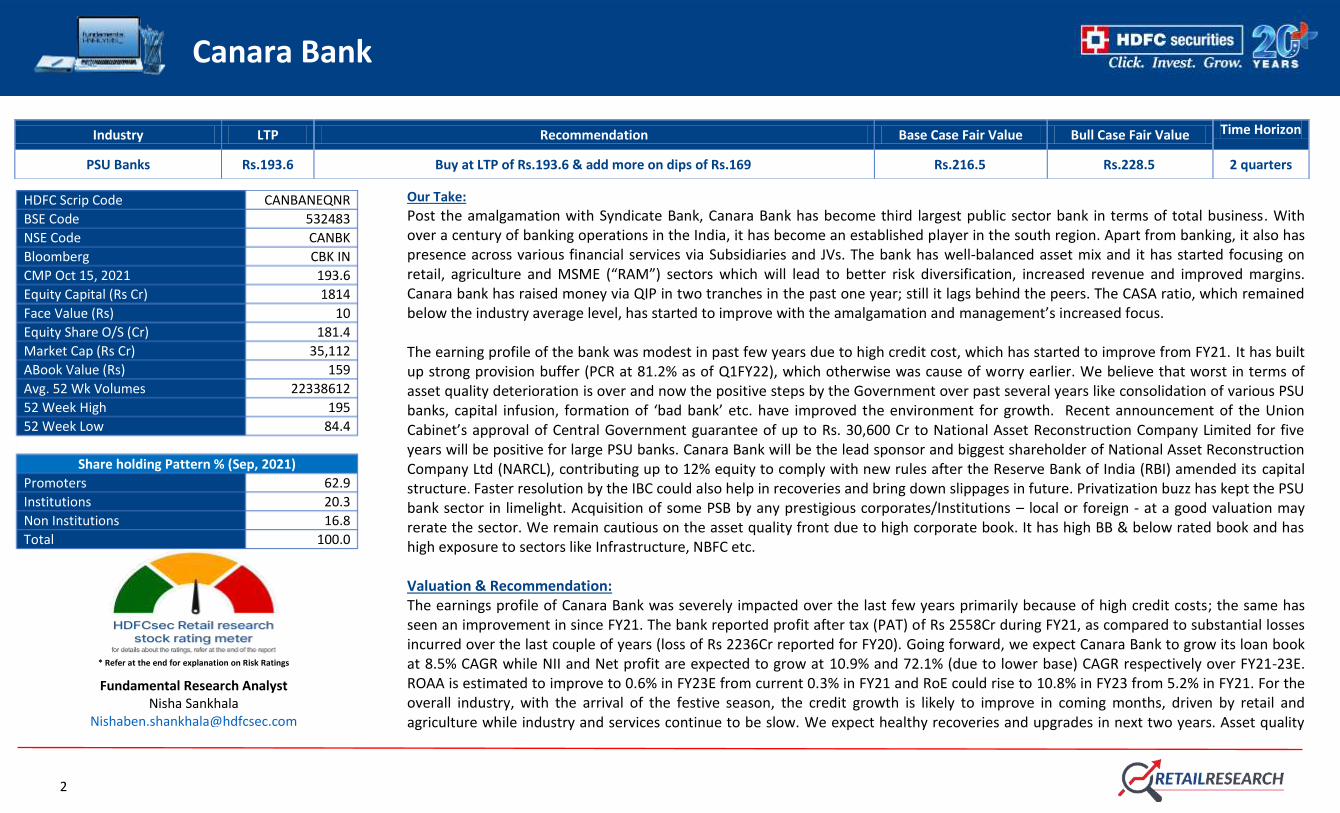
Industry LTP Recommendation Base Case Fair Value Bull Case Fair Value Time Horizon
PSU Banks Rs.193.6 Buy at LTP of Rs.193.6 & add more on dips of Rs.169 Rs.216.5 Rs.228.5 2 quarters
HDFC Scrip Code CANBANEQNR
BSE Code 532483
NSE Code CANBK
Bloomberg CBK IN
CMP Oct 15, 2021 193.6
Equity Capital (Rs Cr) 1814
Face Value (Rs) 10
Equity Share O/S (Cr) 181.4
Market Cap (Rs Cr) 35,112
ABook Value (Rs) 159
Avg. 52 Wk Volumes 22338612
52 Week High 195
52 Week Low 84.4
Share holding Pattern % (Sep, 2021)
Promoters 62.9
Institutions 20.3
Non Institutions 16.8
Total 100.0
* Refer at the end for explanation on Risk Ratings
Fundamental Research Analyst Nisha Sankhala
3
Canara Bank
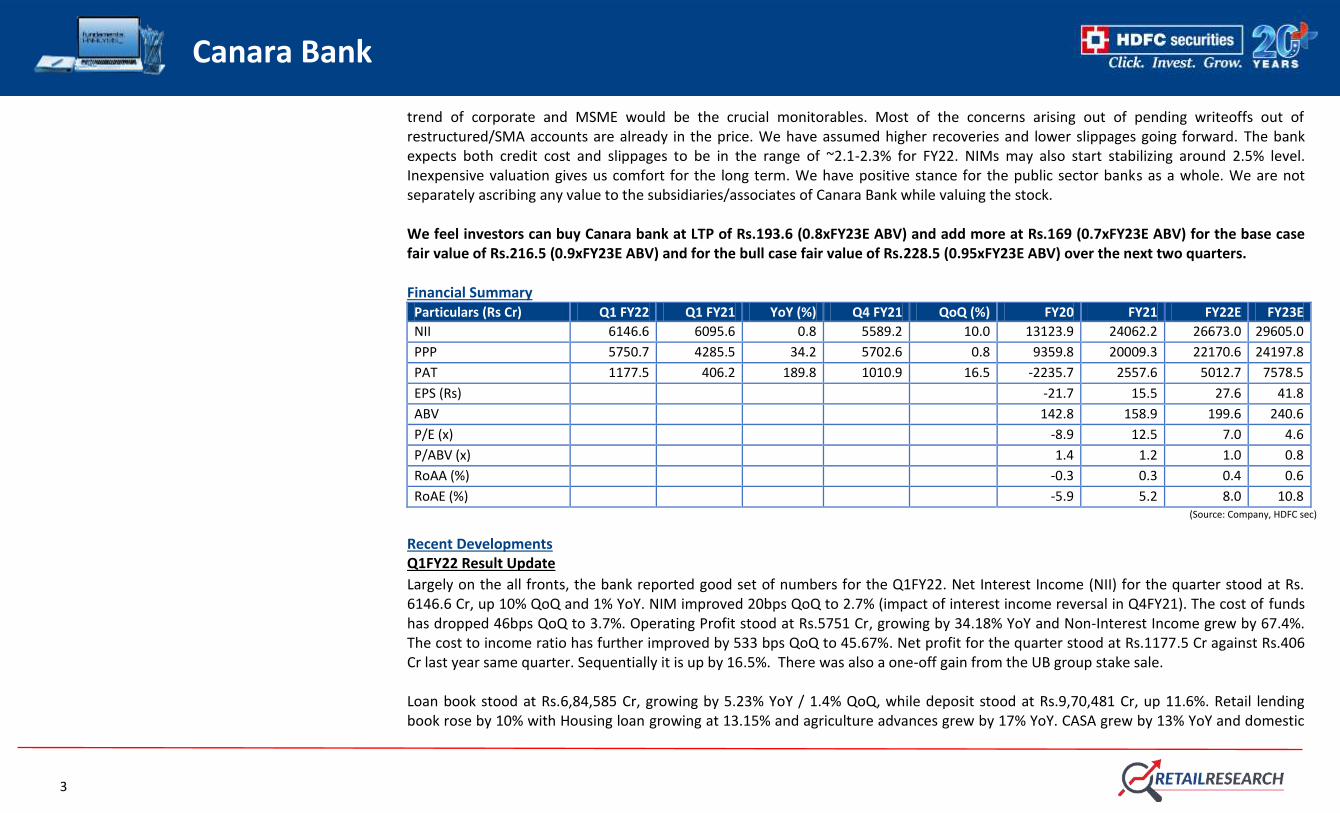
trend of corporate and MSME would be the crucial monitorables. Most of the concerns arising out of pending writeoffs out of restructured/SMA accounts are already in the price. We have assumed higher recoveries and lower slippages going forward. The bank expects both credit cost and slippages to be in the range of ~2.1-2.3% for FY22. NIMs may also start stabilizing around 2.5% level. Inexpensive valuation gives us comfort for the long term. We have positive stance for the public sector banks as a whole. We are not separately ascribing any value to the subsidiaries/associates of Canara Bank while valuing the stock. We feel investors can buy Canara bank at LTP of Rs.193.6 (0.8xFY23E ABV) and add more at Rs.169 (0.7xFY23E ABV) for the base case fair value of Rs.216.5 (0.9xFY23E ABV) and for the bull case fair value of Rs.228.5 (0.95xFY23E ABV) over the next two quarters. Financial Summary
Particulars (Rs Cr) Q1 FY22 Q1 FY21 YoY (%) Q4 FY21 QoQ (%) FY20 FY21 FY22E FY23E
NII 6146.6 6095.6 0.8 5589.2 10.0 13123.9 24062.2 26673.0 29605.0
PPP 5750.7 4285.5 34.2 5702.6 0.8 9359.8 20009.3 22170.6 24197.8
PAT 1177.5 406.2 189.8 1010.9 16.5 -2235.7 2557.6 5012.7 7578.5
EPS (Rs) -21.7 15.5 27.6 41.8
ABV 142.8 158.9 199.6 240.6
P/E (x) -8.9 12.5 7.0 4.6
P/ABV (x) 1.4 1.2 1.0 0.8
RoAA (%) -0.3 0.3 0.4 0.6
RoAE (%) -5.9 5.2 8.0 10.8 (Source: Company, HDFC sec)
Recent Developments Q1FY22 Result Update
Largely on the all fronts, the bank reported good set of numbers for the Q1FY22. Net Interest Income (NII) for the quarter stood at Rs. 6146.6 Cr, up 10% QoQ and 1% YoY. NIM improved 20bps QoQ to 2.7% (impact of interest income reversal in Q4FY21). The cost of funds has dropped 46bps QoQ to 3.7%. Operating Profit stood at Rs.5751 Cr, growing by 34.18% YoY and Non-Interest Income grew by 67.4%. The cost to income ratio has further improved by 533 bps QoQ to 45.67%. Net profit for the quarter stood at Rs.1177.5 Cr against Rs.406 Cr last year same quarter. Sequentially it is up by 16.5%. There was also a one-off gain from the UB group stake sale. Loan book stood at Rs.6,84,585 Cr, growing by 5.23% YoY / 1.4% QoQ, while deposit stood at Rs.9,70,481 Cr, up 11.6%. Retail lending book rose by 10% with Housing loan growing at 13.15% and agriculture advances grew by 17% YoY. CASA grew by 13% YoY and domestic

4
Canara Bank
CASA ratio stood at 32.5%. We expect that the Bank shall emerge stronger by the end of FY22 since Q1FY22 earnings have shown early signs of recovery. The bank has cut branches by ~5% in one quarter, indicating post-merger rationalization. Asset Quality
Both headline asset quality numbers improved during the quarter on the back of contained slippages and higher upgrades. The Gross
Non-Performing Assets (GNPA) ratio stood at 8.5% vs 8.93% QoQ and 8.84% YoY, while the Net Non-Performing Assets (NNPA) stood at
3.46% vs 3.82% QoQ and 3.95% YoY. Provision Coverage Ratio (PCR) improved to 81.18% as at June 2021 from 78.95% as at June 2020.
Cash recovery plus up gradation was about Rs.4750 Cr and the slippages were at Rs.4391 Cr (2.8% annualized). Restructured loan stood at
Rs. 18234 Cr (2.8% of loans). The bank expects both credit cost and slippages to be in the range of ~2.1-2.3% for FY22. It had provided
moratorium to some of its borrowers. Though collections declined during the initial months of the first wave, they had improved
subsequently. However, the second wave of the pandemic led to intermittent lockdowns and localised restrictions, thus impacting
collections once again. Although the impact has been moderate during this phase, any adverse change in the payment discipline of the
borrowers may lead to higher delinquencies.
We remain cautious on the asset quality front due to high corporate book. After COVID induced lock downs, the quality of credit - retail and MSME segments across the industry level has deteriorated. In Q1FY22, 56% of the gross slippages came from the MSME and 18-20% came from the retail. We remain watchful in these segments for the coming quarters. Canara bank’s loan book as on June-21 has a very high exposure to corporate and MSME segment which comprised of ~44.63% and 15.62% of its total domestic advances. In the corporate space it has high exposure to core economy sectors like NBFC (13%), Infra (13%), Textiles (2.6%), Metal (2.5%) and commercial real estate (2%). Out of the total, almost 19% of the borrowers are from the category of BB & below rating. Rating wise, 94.45% of standard NBFC exposure is rated A & above. Sector Wise NPA Classification
GNPA (Rs. Cr) Advance Outstanding (Rs. Cr) GNPA (%)
Domestic Gross NPA 52703 661236 7.97
Global Gross NPA 58215 684585 8.5
Retail 1765 115291 1.53
Agriculture 9239 156801 5.89
MSME 15590 106958 14.58
Corporate & Others 31621 305535 10.35

5
Canara Bank
GNPA (Rs. Cr) Advance Outstanding (Rs. Cr) GNPA (%)
Total Retail NPA 1765 115291 1.53
Housing Loans 745 65136 1.14
Vehicle Loans 288 13433 2.14
Education Loan 216 12278 1.76
Other Personal Loans 516 24444 2.11
Special Mention Accounts (SMA)
Mar-21 Jun-21
No of Accounts
% to Gross Advances
No of Accounts
% to Gross Advances
SMA 2 126 0.7 234 1.06
SMA 1 261 1.47 164 0.59
TOTAL SMA 1 & 2 387 2.17 398 1.65
SMA 0 383 1.05 378 1.38
TOTAL 770 3.22 776 3.04
Canara bank has identified NPAs to the tune of Rs5150 cr (0.8% of loans) to be transferred to NARCL. This will further bring down NPAs in Q2/Q3.
Rating Mix of Domestic Credit
Industry Credit Outstanding (%)

6
Canara Bank
Established player in the south region Canara bank has over a century of banking operations in the Indian banking system. As a result of the brand recognition and widespread presence across India, the bank has an established market presence in several business segments, such as wholesale, retail and treasury. Post the amalgamation, Canara Bank has become third largest public sector bank. It has customer base of around 10.5 Cr. As of June 30, 2021, the bank has a wide distribution network in India that included 9,877 branches across 28 states and 8 union territories as well as 9,053 business correspondents. In particular, the bank has a strong presence in south India with 4,574 branches (46.31 %) in the southern region of India namely, Karnataka, Andhra Pradesh, Telangana, Tamil Nadu, Kerala, Lakshadweep and Puducherry, as of June 30, 2021. Further, as of June 30, 2021, 40.32 % and 55.93 % of the domestic advances and deposits were contributed by these southern states of India, respectively. The bank intends to increase customer penetration through expansion of branch and ATM network in other states. The international operations include four branches in London, Hong Kong, New York and Dubai, as of June 30, 2021. Apart from banking, it also has presence across various financial services via Subsidiaries and JVs, such as housing finance, asset management, life insurance, factoring, brokerage, software, merchant banking, venture capital and rural regional banking, which provide significant cross-selling opportunities. Increase in fee-based income
In addition to loans and other interest generating products, the bank’s integrated branch and electronic banking network and its
increasingly diversified product and service portfolio has enabled it to generate fee and commission based income. The bank further
intends to focus on increasing the fee based income by focusing on bancassurance, cross-selling of mutual fund products, executor,
trustee and taxation related services, syndication of loans, leasing of lockers, GoI business, letters of credit and bank guarantees (non-fund
based business), fee and processing charges from loan and advances, foreign exchange business, credit and debit card business,
agricultural consultancy and merchant banking.
Capital adequacy level
The bank’s capital adequacy level has remained inferior as compared to other big PSBs post the amalgamation with Syndicate Bank. In the
past also the Government has consistently infused capital to support the capitalisation level. Canara Bank and Syndicate Bank combined
received Rs.7,704 Cr and Rs.3,963 Cr, respectively, in FY18 and FY19 under Indradhanush package. Then again in FY20, Rs. 6,571 Cr was
received. The bank had raised funds via QIP’s first tranche in Dec-20 (Rs.2000 Cr at Rs.109 per share). The second tranche was launched
recently in Aug-21, in which the bank has raised Rs.2500 Cr at the price of Rs. 149.3 per share. Life Insurance Corporation of India (LIC),
BNP Paribas Arbitrage, Societe Generale and Indian Bank were among the qualified institutional buyers (QIBs) to be allotted more than 5%
equity shares in the issue. Now, the Government of India’s share has come down at 62.93% as compared to 69.33% in Jun-21.

7
Canara Bank
Post QIP, Capital Adequacy Ratio stands at 13.8% with Tier-1 at 10.8% as compared to 13.36% and 10.3% respectively in Q1FY22. This is
still at subpar level compared to the large PSB peers. The QIP was part of a fundraising plan of Rs.9,000 Cr during FY22. Apart from the
QIP, the bank is also planning to raise Rs.4,000 Cr through Additional Tier-I bonds, and another Rs.2,500 Cr via Additional Tier-II bonds.
These planned fund raise will improve the capitalisation level. Further the bank also has stake in various subsidiaries; via stake sale it can
raise funds.
Retail Segment- A key focus area The Bank has a well-balanced asset mix, encompassing sectors such as Agriculture and Micro, Small and Medium Enterprises (MSMEs) as well as other retail assets (key focus area), including Housing, Education, and Vehicle loans. The management has driven the operations towards a balanced asset portfolio with a focus on retail operations, and selective attention to corporate operations. This is determined by the ability to match the risk appetite of such corporate credit. This has enabled it to reduce the exposure to some of the distressed sectors in India, and has allowed it to deploy resources to the higher yielding sectors of retail and MSME credit instead. We believe the strategically diversified asset portfolio across the retail, agriculture and MSME (“RAM”) sectors will lead to better risk diversification, increased revenue and improved margins. Management has informed that the focus area will be mortgage-based retail products to reduce the risk associated with loans having little or no collateral. Such loans mainly comprise home loans and loans against property to salaried employees and small business owners with income adequate to repay their loans. They intend to market the retail credit products to employees of several GoI and state government departments, multinationals and corporations, real estate developers and automobile manufacturers and dealers. Further, they have set up a ‘Gold Loan’ wing, which is exclusively focused on providing gold loans to the customers.
Gross Domestic Credit Mix (%)
Retail Lending Book Mix(%)

8
Canara Bank
Improving CASA
The CASA ratio of the bank has remained subpar compared to other big PSBs and also below the industry average level. However, with the
amalgamation and management’s increased focus, it has started to improve. CASA ratio was 29.18%, 31.38%, 32.73% and 32.51% in FY19,
FY20 and FY21 and Q1FY22, respectively. Management has informed that they will continue to focus on premier CASA products, such as
‘Canara Galaxy’, ‘Canara Privilege’, ‘SB Powerplus’ and NRI accounts to improve the average balances under CASA. They have also
launched CASA CONNECT campaign for enriching CASA. Reduction of dependence in bulk deposit and increase in CASA deposits will bring
the competitive advantage to the bank by bringing in low cost of funds. Also the ratio of retail term deposits to total deposits is at 41.6%
as of Q1FY22, which ensures lower concentration risk, increases the spread of the liability portfolio and enhances profitability when
compared with higher-cost time deposits. Management has guided that they are expecting CASA ratio to reach up to 36.5% by the end of
FY22. Under the “Pradhan Mantri Jan Dhan Yojana” (“PMJDY”), as of June 30, 2021, the bank has opened 1.4 Cr accounts, and the
balance contained in such accounts amounted to Rs.6103 Cr.
Privatization buzz, bad bank creation and NPA recovery to keep PSB sector in lime light In FY21, bank credit growth was lowest since last four years as lenders and borrowers remained risk averse due to the pandemic-led uncertainty. However, the PSU Banks have reported net profits in FY21 after five consecutive years of losses, supported by treasury gains and lower provisions. We expect high single digit or low double digit credit growth in FY22.
Gradually improving CASA Ratio (%)

9
Canara Bank
After a prolonged period of stress, Indian banking sector had finally entered into resolution and recovery phase. With this, corporate facing banks like Canara bank with big corporate book size have a lot to gain. The pandemic effect has impacted the resolution process in FY21 due to increased operational challenges. Total resolution amount was ~Rs.260 bn, almost a quarter of the realisations in FY20. However, now as the situation has improved, the financial creditors could realise Rs.550-600 bn in FY22 through successful resolution plans from the IBC, as per ICRA’s estimates. Canara bank expects Rs.15000 Cr (of which Rs.4,750 cr was done in Q1) of recovery in FY22, which is same as slippages expectation (Rs.14000-15000 Cr) for the year. The bank has created a specialised vertical and staff to take care of the monitoring and recovery, and they are also aggressively considering One-time Settlement (OTS). In Q1FY22 they have done about 89,000 OTS and the amount settled is about 1,250 cr. As proposed by Finance Minister in the Union Budget, the bad bank will help in aggregating the loan book of stressed assets from all banks, and facilitate an easy process of auctioning through the Swiss challenge method. Public sectors banks will be its promoters, who will collectively hold 51%. Recently, the Union Cabinet has approved Central Government guarantee of up to Rs.30,600 Cr to National Asset Reconstruction Company Limited for five years. The recent Supreme Court ruling allowing banks to invoke personal guarantees provided by promoters and KMPs (key managerial personnel) in the event of default by the borrowing company could pressurize a lot of promoters to come up with settlement terms, leading to faster and bigger recoveries. This judgment gives NCLTs the jurisdiction to deal with personal guarantors of corporate debtors alongside the Corporate Insolvency Resolution Process (CIRP) proceedings of corporate debtors/principal borrowers, thereby having a more comprehensive system in place for recovery of debts. Government is also planning to privatize a few PSU banks in the near term as part of the government’s broader divestment goals. This has created a lot of buzz in the sector. Acquisition of these banks by the big players at a good valuation may re-rate the sector.
Canara Bank Roadmap for FY22
Parameters Guidance
Deposits Growth (Global) 8.2%
Advances Growth (Global) 7.5%
Business Growth (Global) 7.9%
NIM (Global) (Annualized) 2.8%
CASA (Domestic CASA to Domestic Deposit) 36.5%
Gross NPA (Global) 7.9%
Net NPA (Global) 2.8%

10
Canara Bank
PCR (Global) 84.0%
Slippage Ratio (Global) (Annualized) 2.6%
Credit Cost (Global)(Annualized) 2.25%
Return on Equity( RoE) 8.6%
Earning per share ( EPS) ( Annualized) 19
Return on Average Assets ( RoA) 0.31%
Capital Raising Plan (Rs Cr)
QIP Equity 2500
Additional Tier-I Bonds 4000
Tier-II Bonds 2500
Total 9000
Risks & Concerns
Any unfavorable change in rules and regulatory policies can have a negative impact on earnings outlook of the Bank.
The second wave and subsequent lock down has impacted overall India including rural areas also this time. This is major cause of worry as new uncertainties have emerged. Further lockdowns on the back of 3rd wave can derail the process of recovery. Slower than expected pickup in the economy may impact the loan book growth for the bank and lead to higher slippages/NPAs.
A sharp rise in interest rate could also result in MTM losses on its investment portfolio.
A higher-than-expected deterioration in the asset quality could result in the erosion of the Tier I capital. Fresh formation of bad loans could keep provision high and return ratio compressed for a long time.
Any further delay in the resolution of large assets due to current uncertainties and extension granted under IBC can postpone recoveries.
The continuous fund raise and capital infusion by government will be EPS dilutive and it might impact the stock price in a negative way. It has done two QIPs in last one year; still the capitalization level stands at subpar level compared to the large PSB peers. The government stake is at 63% as of Sep-21.
Successful integration of the merger of Syndicate bank with Canara bank is important. Any delay or slippage in this could impact the consolidated operations.
The bank has lower than industry average CASA ratio, which limits its ability to raise funds at a lower cost. However, post amalgamation the situation seems to be improving.
As mentioned above, Canara Bank is an established payer in the southern region, a major part of the bank’s branches are concentrated in southern India, making it vulnerable to risks associated with having geographically concentrated operations. The

11
Canara Bank
competitive intensity for deposits has traditionally been high in Karnataka; erstwhile both Canara Bank and Syndicate Bank and now merged entity have high presence in Karnataka.
The MSME and retail segments were hit hard by pandemic; this was also evident from June results. In the Q1FY22, GNPAs on retail and MSME loan books of public sector banks rose to 7.28% compared to 6% a year ago. Due to increased focus in RAM segments Canara bank also had to restructure a large part of assets from these segments.
Company Background: Canara Bank is among the leading scheduled public sector commercial banks in India. It was found in 1906 as a private entity and became a nationalized bank in 1969. Recently, the Government of India approved the scheme of amalgamation of Syndicate Bank into Canara Bank with effect from April 1, 2020. As a result, as of June, 2021, it is the third largest public sector bank in India in terms of total business. The bank offers a wide range of banking and financial products and services to both large and mid-sized corporates and micro, small and medium enterprises (“MSME”) as well as retail and agriculture customers. The operations are internally aligned into distinct business lines for (i) wholesale banking operations, (ii) retail banking operations, (iii) treasury operations, and (iv) other banking operations (through our subsidiaries, associates and joint ventures).
Subsidiaries Holding(%) Associates & Joint Ventures Holding(%)
Canara Robeco Asset Management Company Ltd. 51 Can Fin Homes Ltd. 30
Canara Bank Securities Ltd. 100 Andhra Pragathi Grameena Bank 35
Canara Bank (Tanzania) Ltd. 100 Karnataka Gramin Bank 35
Canbank Computer Services Ltd. 69.14 Kerala Gramin Bank 35
Canbank Venture Capital Fund Ltd. 100 Karnataka Vikas Grameena Bank 35
Synd Bank Services Ltd 100 Commercial Indo Bank LLC, Moscow (JV with SBI) 40
Canbank Financial Services Ltd. 100
Canbank Factors Ltd. 70
Canara HSBC OBC Life Insurance Company Ltd. 51

12
Canara Bank
Peer comparisons
CMP
P/ABV P/E FY21
FY21 FY22E FY23E FY21 FY22E FY23E ROAE (%) ROAA (%) NIM % GNPA % NNPA % CASA % Loan Book
(Rs. Bn)
PNB 42.6 0.85 0.68 0.58 22.4 9.9 5.3 2.6 0.2 3.2 14.1 5.7 45.9 6,742
BOB 88.7 0.83 0.77 0.67 55.4 13.6 9.3 1.1 0.1 2.7 8.9 3.1 40.2 7,063
INDIAN 164.5 0.71 0.64 0.54 6.2 4.6 3.5 9.9 0.6 2.9 9.9 3.4 42.3 3,640
Canara 193.6 1.22 0.97 0.80 12.5 7.0 4.6 5.2 0.3 2.9 8.9 3.8 32.7 6,390
Cost to Income Ratio (%)
Loan Book (Rs Cr)
Return Ratios(%)
NPA trend %

13
Canara Bank
Financials
Income Statement
Balance Sheet
(Rs Cr) FY19 FY20 FY21 FY22E FY23E (Rs Cr) FY19 FY20 FY21 FY22E FY23E
Interest Income 46810 48935 69240 74079 80413 Share Capital 753 1030 1647 1814 1814
Interest Expenses 32332 35811 45178 47406 50808 Reserves & Surplus 35424 38263 57238 64584 72162
Net Interest Income 14478 13124 24062 26673 29605 Shareholder funds 36177 39293 58885 66398 73977
Non-interest income 6575 7813 15285 15874 16154 Deposits 599033 625351 1010875 1097857 1160818
Operating Income 21053 20937 39347 42547 45759 Borrowings 40992 42762 49984 44446 48890
Operating Expenses 10462 11577 19338 20376 21562 Other Liab & Prov. 18564 16469 33932 37325 41058
PPP 10591 9360 20009 22171 24198 SOURCES OF FUNDS 694767 723875 1153675 1246026 1324743
Prov & Cont 12918 11115 16302 15487 14093 Cash & Bank Balance 66153 68271 178408 210196 204581
Profit Before Tax -2327 -1756 3707 6684 10105 Investment 152985 176245 261690 285243 302642
Tax -2674 480 1150 1671 2526 Advances 427727 432175 639049 683782 752161
PAT 347 -2236 2558 5013 7579 Fixed Assets 8410 8276 11207 12103 12708
Other Assets 39491 38907 63321 54703 52651
TOTAL ASSETS 694767 723875 1153675 1246026 1324743 (Source: Company, HDFC sec)
14
Canara Bank
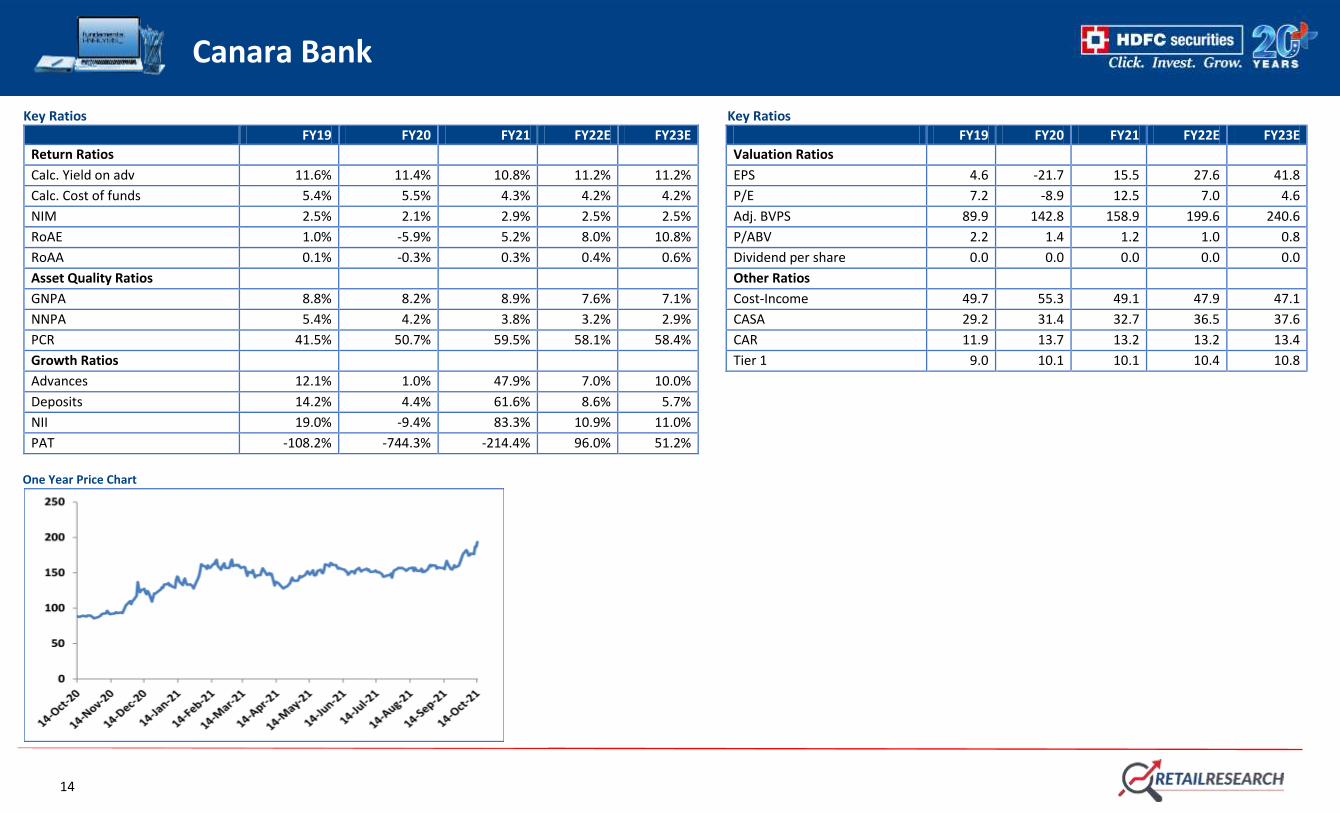
Key Ratios
Key Ratios
FY19 FY20 FY21 FY22E FY23E FY19 FY20 FY21 FY22E FY23E
Return Ratios Valuation Ratios
Calc. Yield on adv 11.6% 11.4% 10.8% 11.2% 11.2% EPS 4.6 -21.7 15.5 27.6 41.8
Calc. Cost of funds 5.4% 5.5% 4.3% 4.2% 4.2% P/E 7.2 -8.9 12.5 7.0 4.6
NIM 2.5% 2.1% 2.9% 2.5% 2.5% Adj. BVPS 89.9 142.8 158.9 199.6 240.6
RoAE 1.0% -5.9% 5.2% 8.0% 10.8% P/ABV 2.2 1.4 1.2 1.0 0.8
RoAA 0.1% -0.3% 0.3% 0.4% 0.6% Dividend per share 0.0 0.0 0.0 0.0 0.0
Asset Quality Ratios Other Ratios
GNPA 8.8% 8.2% 8.9% 7.6% 7.1% Cost-Income 49.7 55.3 49.1 47.9 47.1
NNPA 5.4% 4.2% 3.8% 3.2% 2.9% CASA 29.2 31.4 32.7 36.5 37.6
PCR 41.5% 50.7% 59.5% 58.1% 58.4% CAR 11.9 13.7 13.2 13.2 13.4
Growth Ratios Tier 1 9.0 10.1 10.1 10.4 10.8
Advances 12.1% 1.0% 47.9% 7.0% 10.0%
Deposits 14.2% 4.4% 61.6% 8.6% 5.7%
NII 19.0% -9.4% 83.3% 10.9% 11.0%
PAT -108.2% -744.3% -214.4% 96.0% 51.2%
HDFC Sec Retail Research Rating description
One Year Price Chart

15
Canara Bank
Green Rating stocks This rating is given to stocks that represent large and established business having track record of decades and good reputation in the industry. They are industry leaders or have significant market share. They have multiple streams of cash flows and/or strong balance sheet to withstand downturn in
economic cycle. These stocks offer moderate returns and at the same time are unlikely to suffer severe drawdown in their stock prices. These stocks can be kept as a part of long term portfolio holding, if so desired. This stocks offer low risk and lower reward and are suitable for beginners. They offer
stability to the portfolio.
Yellow Rating stocks This rating is given to stocks that have strong balance sheet and are from relatively stable industries which are likely to remain relevant for long time and unlikely to be affected much by economic or technological disruptions. These stocks have emerged stronger over time but are yet to reach the
level of green rating stocks. They offer medium risk, medium return opportunities. Some of these have the potential to attain green rating over time.
Red Rating stocks This rating is given to emerging companies which are riskier than their established peers. Their share price tends to be volatile though they offer high growth potential. They are susceptible to severe downturn in their industry or in overall economy. Management of these companies need to prove
their mettle in handling cyclicality of their business. If they are successful in navigating challenges, the market rewards their shareholders with handsome gains; otherwise their stock prices can take a severe beating. Overall these stocks offer high risk high return opportunities. Disclosure: I, Nisha Sankhala, (MBA), authors and the names subscribed to this report, hereby certify that all of the views expressed in this research report accurately reflect our views about the subject issuer(s) or securities. HSL has no material adverse disciplinary history as on the date of publication of this report. We also certify that no part of our
compensation was, is, or will be directly or indirectly related to the specific recommendation(s) or view(s) in this report.
Research Analyst or her relative or HDFC Securities Ltd. does not have any financial interest in the subject company. Also Research Analyst or his relative or HDFC Securities Ltd. or its Associate may have beneficial ownership of 1% or more in the subject company at the end of the month immediately preceding the date of publication of the
Research Report. Further Research Analyst or her relative or HDFC Securities Ltd. or its associate does not have any material conflict of interest.
Any holding in stock – No
HDFC Securities Limited (HSL) is a SEBI Registered Research Analyst having registration no. INH000002475.
Disclaimer:
This report has been prepared by HDFC Securities Ltd and is meant for sole use by the recipient and not for circulation. The information and opinions contained herein have been compiled or arrived at, based upon information obtained in good faith from sources believed to be reliable. Such information has not been independently verified and
no guaranty, representation of warranty, express or implied, is made as to its accuracy, completeness or correctness. All such information and opinions are subject to change without notice. This document is for information purposes only. Descriptions of any company or companies or their securities mentioned herein are not intended to be
complete and this document is not, and should not be construed as an offer or solicitation of an offer, to buy or sell any securities or other financial instruments.
This report is not directed to, or intended for display, downloading, printing, reproducing or for distribution to or use by, any person or entity who is a citizen or resident or located in any locality, state, country or other jurisdiction where such distribution, publication, reproduction, availability or use would be contrary to law or regulation or
what would subject HSL or its affiliates to any registration or licensing requirement within such jurisdiction.
If this report is inadvertently sent or has reached any person in such country, especially, United States of America, the same should be ignored and brought to the attention of the sender. This document may not be reproduced, distributed or published in whole or in part, directly or indirectly, for any purposes or in any manner.
Foreign currencies denominated securities, wherever mentioned, are subject to exchange rate fluctuations, which could have an adverse effect on their value or price, or the income derived from them. In addition, investors in securities such as ADRs, the values of which are influenced by foreign currencies effectively assume currency risk.
It should not be considered to be taken as an offer to sell or a solicitation to buy any security. HSL may from time to time solicit from, or perform broking, or other services for, any company mentioned in this mail and/or its attachments.
HSL and its affiliated company(ies), their directors and employees may; (a) from time to time, have a long or short position in, and buy or sell the securities of the company(ies) mentioned herein or (b) be engaged in any other transaction involving such securities and earn brokerage or other compensation or act as a market maker in the
financial instruments of the company(ies) discussed herein or act as an advisor or lender/borrower to such company(ies) or may have any other potential conflict of interests with respect to any recommendation and other related information and opinions.
HSL, its directors, analysts or employees do not take any responsibility, financial or otherwise, of the losses or the damages sustained due to the investments made or any action taken on basis of this report, including but not restricted to, fluctuation in the prices of shares and bonds, changes in the currency rates, diminution in the NAVs,
reduction in the dividend or income, etc.
HSL and other group companies, its directors, associates, employees may have various positions in any of the stocks, securities and financial instruments dealt in the report, or may make sell or purchase or other deals in these securities from time to time or may deal in other securities of the companies / organizations described in this report.
HSL or its associates might have managed or co-managed public offering of securities for the subject company or might have been mandated by the subject company for any other assignment in the past twelve months.
HSL or its associates might have received any compensation from the companies mentioned in the report during the period preceding twelve months from t date of this report for services in respect of managing or co-managing public offerings, corporate finance, investment banking or merchant banking, brokerage services or other advisory
service in a merger or specific transaction in the normal course of business.
HSL or its analysts did not receive any compensation or other benefits from the companies mentioned in the report or third party in connection with preparation of the research report. Accordingly, neither HSL nor Research Analysts have any material conflict of interest at the time of publication of this report. Compensation of our Research
Analysts is not based on any specific merchant banking, investment banking or brokerage service transactions. HSL may have issued other reports that are inconsistent with and reach different conclusion from the information presented in this report.
Research entity has not been engaged in market making activity for the subject company. Research analyst has not served as an officer, director or employee of the subject company. We have not received any compensation/benefits from the subject company or third party in connection with the Research Report.
HDFC securities Limited, I Think Techno Campus, Building - B, "Alpha", Office Floor 8, Near Kanjurmarg Station, Opp. Crompton Greaves, Kanjurmarg (East), Mumbai 400 042 Phone: (022) 3075 3400 Fax: (022) 2496 5066
Compliance Officer: Binkle R. Oza Email: [email protected] Phone: (022) 3045 3600
HDFC Securities Limited, SEBI Reg. No.: NSE, BSE, MSEI, MCX: INZ000186937; AMFI Reg. No. ARN: 13549; PFRDA Reg. No. POP: 11092018; IRDA Corporate Agent License No.: CA0062; SEBI Research Analyst Reg. No.: INH000002475; SEBI Investment Adviser Reg. No.: INA000011538; CIN - U67120MH2000PLC152193
Mutual Funds Investments are subject to market risk. Please read the offer and scheme related documents carefully before investing.