CAN THE PUCALLPA-CRUZEIRO DO SUL ROAD BE...
24
CAN THE PUCALLPA-CRUZEIRO DO SUL ROAD BE DEVELOPED WITH NO NET LOSS OF NATURAL CAPITAL IN PERU? A framework for including natural capital in mitigation
-
Upload
truongdung -
Category
Documents
-
view
214 -
download
0
Transcript of CAN THE PUCALLPA-CRUZEIRO DO SUL ROAD BE...
CAN THE PUCALLPA-CRUZEIRO DO SUL ROAD BE DEVELOPED WITH NO NET
LOSS OF NATURAL CAPITAL IN PERU?
A framework for including natural capital in mitigation
June 2013
AUTHORSNatural Capital Project: Lisa Mandle, Heather Tallis, Adrian Vogl, Stacie Wolny
TNC: Jerry Touval, Leonardo Sotomayor, Sofia VargasWWF and Natural Capital Project: Amy Rosenthal
ACKNOWLEDGMENTSThe authors thank Dazolony Quintero, Paulo Petry, Juan Sebastian Lozano, Marcelo Guevara,
Luis Alberto Gonzales, Juan Carlos Gonzales and Luis Davalos from The Nature Conservancy for valuable information on the study context and feedback on our methods. This report is made possible by the generous support of the American people through the United States
Agency for International Development (USAID) and The Nature Conservancy. The contents are the responsibility of the Board of Trustees of the Leland Stanford Junior University and
do not necessarily reflect the views of USAID, the United States Government, or The Nature Conservancy. The Natural Capital Project is a partnership among Stanford University, The Nature
Conservancy, the World Wildlife Fund and the University of Minnesota.
Cover photograph by Thomas J. Müller/SPDA-ProNaturaleza
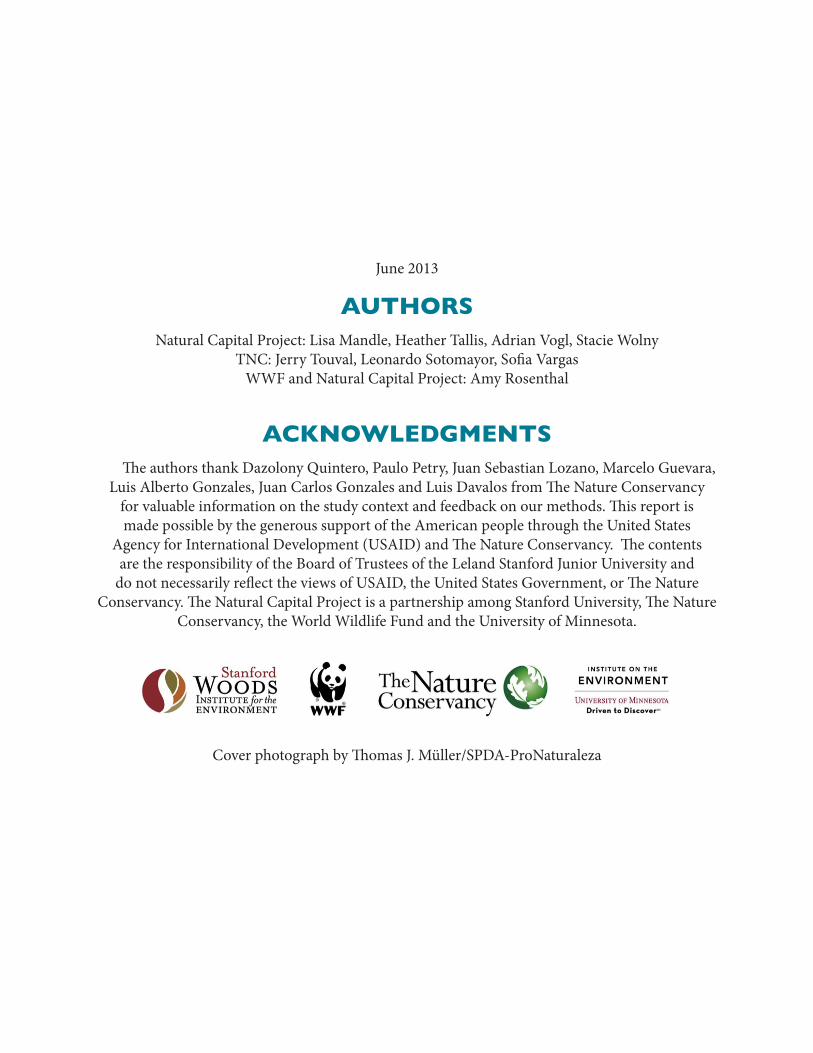
EXECUTIVE SUMMARYExisting approaches to mitigation of impacts generated by infrastructure development are
focused primarily on preventing losses of biodiversity (including species, natural communities and ecological systems). These approaches do not explicitly account for losses of natural capital and the ecosystem services it provides. When natural capital is not incorporated, mitigation activities can result in the redistribution of nature’s benefits to people, creating ecosystem service ‘winners’ and ‘losers’. This social equity aspect is a key factor that needs to be considered when assessing the potential for no net loss of natural capital. Here we use new methods to determine what amount of ecosystem services will be lost – and who will lose them – after the completion of Pucallpa-Cruzeiro do Sul road through the Peruvian Amazon. We estimate the impact of the road alone, as well as the impact of the road plus associated deforestation it is likely to cause as people enter the area and convert forest to agriculture. This study considers the impacts to nearly 250,000 people living in 107 cities and towns in the Ucayali Region of Peru. We also ask whether no net loss can be achieved through mitigation. We use two approaches to mitigation: a practical approach that considers the most feasible locations for protection and restoration given current land tenure, and a targeted approach that focuses on the most effective places on the landscape to achieve natural capital gains. We evaluate the potential for no net loss for four ecosystem services: (1) erosion control; drinking water quality regulation for the pollutants (2) nitrogen and (3) phosphorus; and (4) carbon sequestration. We find that the impacts of road-associated deforestation are likely to be much greater than the impacts of the road alone, especially for erosion control and phosphorous regulation services. If social equity is considered, no net loss is possible with both the practical and targeted approaches only for carbon sequestration and for the road-only impacts of erosion control services. No net loss is not possible for nitrogen and phosphorous regulation services, nor for the impacts of the road plus associated deforestation on erosion control. Overall, the targeted approach comes closer to achieving no net loss than the practical approach. If social equity is ignored, no net loss of all four ecosystem services can be achieved using the targeted approach but not the practical approach. However, by ignoring social equity, this method creates ecosystem services winners and losers.
1
BACKGROUND
The need for a mitigation framework for natural capital
The Nature Conservancy’s Latin America Conservation Council has adopted a strategy for ‘Smart Infrastructure’ that has as its goal ‘designing Latin America’s major energy, mining and transport infrastructure to have no net impact on natural capital.’ This goal presents new and exciting challenges to develop the science that will allow us to achieve the goal of no net impact on natural capital. The Conservancy has identified that for this strategy to be successful, ‘a new generation of analytical and monitoring tools needs to be developed and disseminated to incorporate the direct, indirect and cumulative impacts of infrastructure development at a large landscape level.’
The Conservancy’s approach to sound infrastructure development is based on the application of a ‘mitigation hierarchy’ which requires development projects to avoid, minimize and offset potential impacts. The mitigation hierarchy has been applied with varying degrees of success to strategies that aim for no net loss of biodiversity (where biodiversity is defined as species, natural communities and ecological systems) and some aspects of ecosystem function. This is a relatively straightforward process that asks, for example, that for every hectare of wetland lost via a development project, an equivalent hectare (or some multiple thereof) be protected or restored. This has been widely and successfully used (e.g., Norton 2009, McKenney & Kiesecker 2010). Science-based analytical and monitoring tools already exist to support this approach (e.g., King & Price 2004).
The focus on no net impact of natural capital (as opposed to no net impact on biodiversity) introduces an additional level of complexity for which new science and tools must be developed. Natural capital is defined as the goods and services from nature which are essential for human life. Natural capital provides us with ecosystem services, defined as the benefits people derive from nature. The services that well-functioning ecosystems provide are vital for humanity and include the production of goods (e.g., food), life support processes (e.g., water purification), life fulfilling conditions (e.g., beauty, recreation opportunities) and the conservation of options (e.g., genetic diversity for future use).
Here, we present a new framework that advances the ‘no net loss of natural capital’ objective by accounting for the impacts of development on the environment and people by including ecosystem services in impact assessments and mitigation decisions. We use the proposed Pucallpa-Cruzeiro do Sul Road in the Peruvian Amazon as a case study.
A serviceshed-based mitigation framework for natural capitalOne of the main new ideas presented in this framework, the ‘serviceshed,’ identifies who will
be impacted by proposed developments and who will benefit from ecosystem service mitigation projects. A serviceshed is the area that provides a specific ecosystem service to a specific beneficiary (individual or group of people) (Tallis et al. 2012). This unit in space does not describe how much demand exists for a service, but rather the location and identity of beneficiaries and the associated regions providing them with benefits. Servicesheds are characterized by three
2
components: 1) ecosystem service supply, 2) institutional (legal) access and 3) physical access. The configuration of servicesheds and the importance of these three factors vary by service and beneficiary.
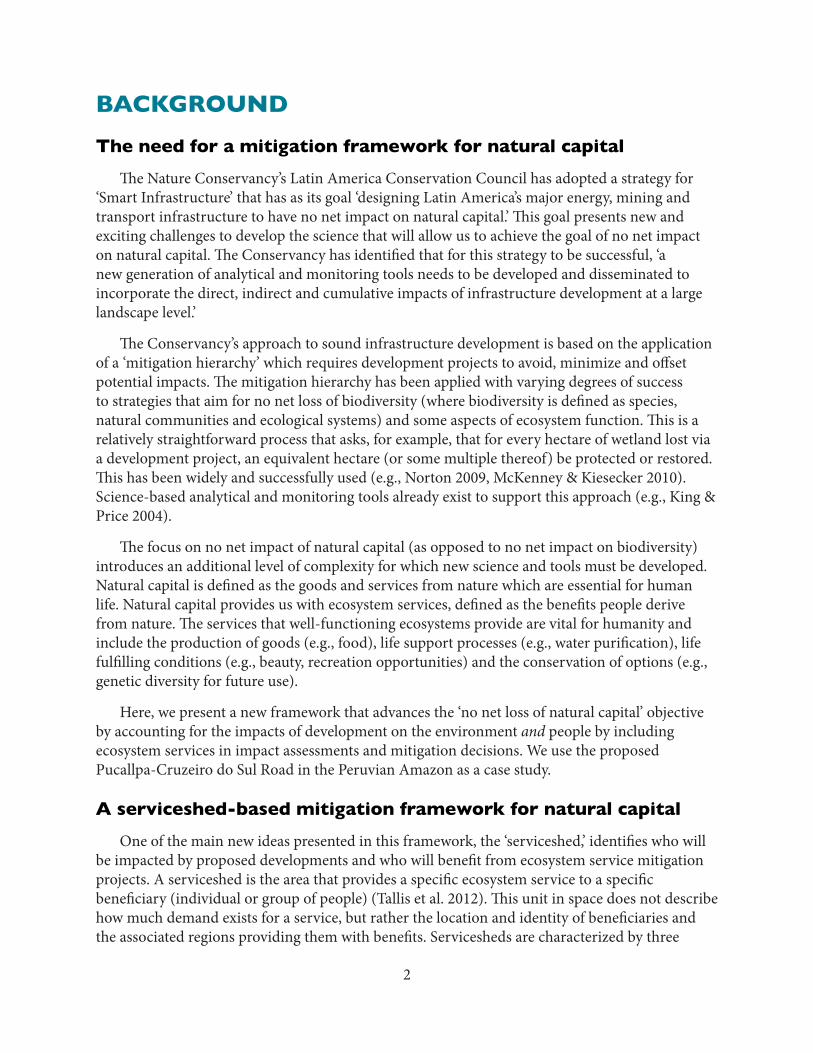
For water-related services (e.g., drinking water supply, hydropower supply, water purification, flood mitigation, erosion control), the serviceshed is the catchment area upstream of the place where people legally access the benefit (cleaner water, lower peak floods, higher dry season supply). In Figure 1, we see five lakes that have recreational fish populations near a city. Each lake’s watershed can act as a filter that keeps the water clean and supports healthy fish populations, and so provides the ‘supply,’ or environmental processes to regulate water quality for recreational fishing. People are willing to drive as far as the white boundary to go fishing (demand), but lake 4 is not in the serviceshed (dotted area) because it does not have road access (physical access). Lake 5 is too far away (again, no physical access), and lake 3 is protected and closed to fishing (institutional or legal access). This leaves lakes 1 and 2 within the demand area for the city, with both physical and institutional access. So the city’s serviceshed for this one ecosystem service is the watershed areas of those two lakes. For some services, such as climate regulation through carbon sequestration, the serviceshed is the planet because the atmosphere is well mixed and there are no institutions or infrastructure that limit a person’s ability to benefit from carbon sequestration.
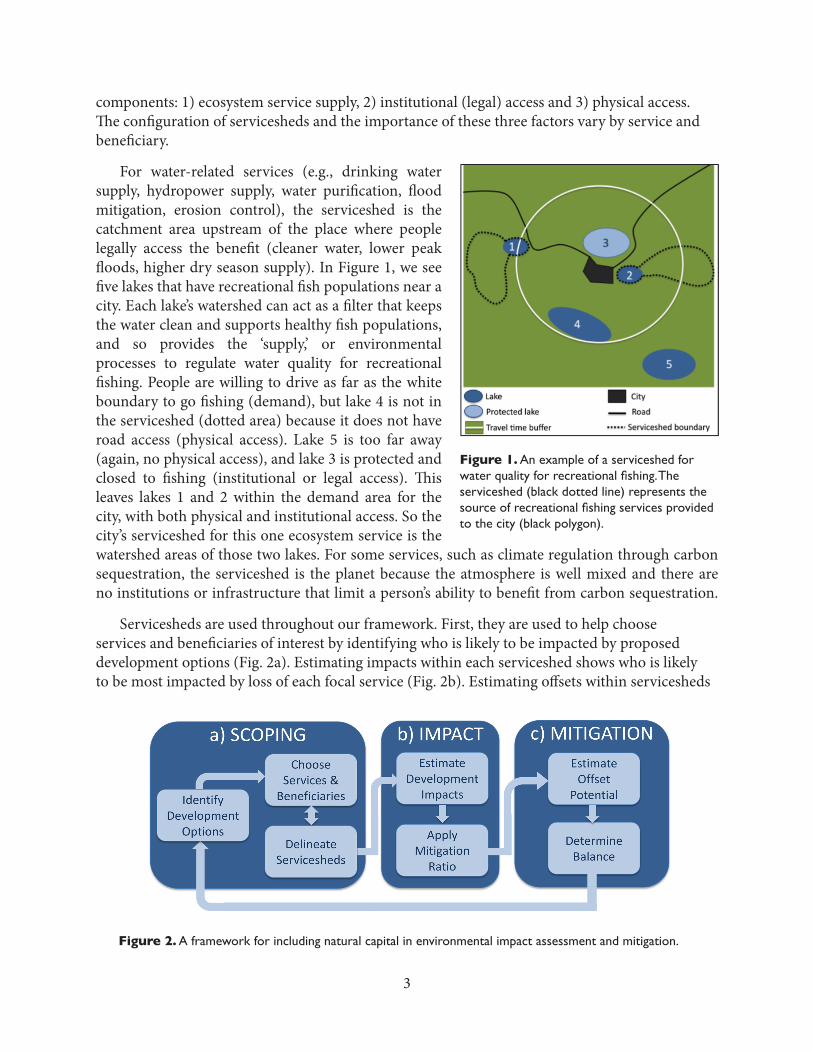
Servicesheds are used throughout our framework. First, they are used to help choose services and beneficiaries of interest by identifying who is likely to be impacted by proposed development options (Fig. 2a). Estimating impacts within each serviceshed shows who is likely to be most impacted by loss of each focal service (Fig. 2b). Estimating offsets within servicesheds
Figure 1. An example of a serviceshed for water quality for recreational fishing. The serviceshed (black dotted line) represents the source of recreational fishing services provided to the city (black polygon).
Figure 2. A framework for including natural capital in environmental impact assessment and mitigation.
3
shows how much potential there is to achieve socially equitable mitigation – returning the same benefits to the same people through mitigation activities like protecting or restoring native vegetation (Fig. 2c). By comparing impacts and offset potentials within each serviceshed, the framework will show who will emerge from the proposed development without ecosystem service losses (‘no net loss’ or ‘balance’ between impacts and offsets) and who will suffer damages. Allowing proposed development to proceed in areas where offsets cannot balance impacts areas will lead to harm. See the Methods section at the end of this report for further details on this framework and its application.
The proposed Pucallpa-Cruzeiro do Sul Road
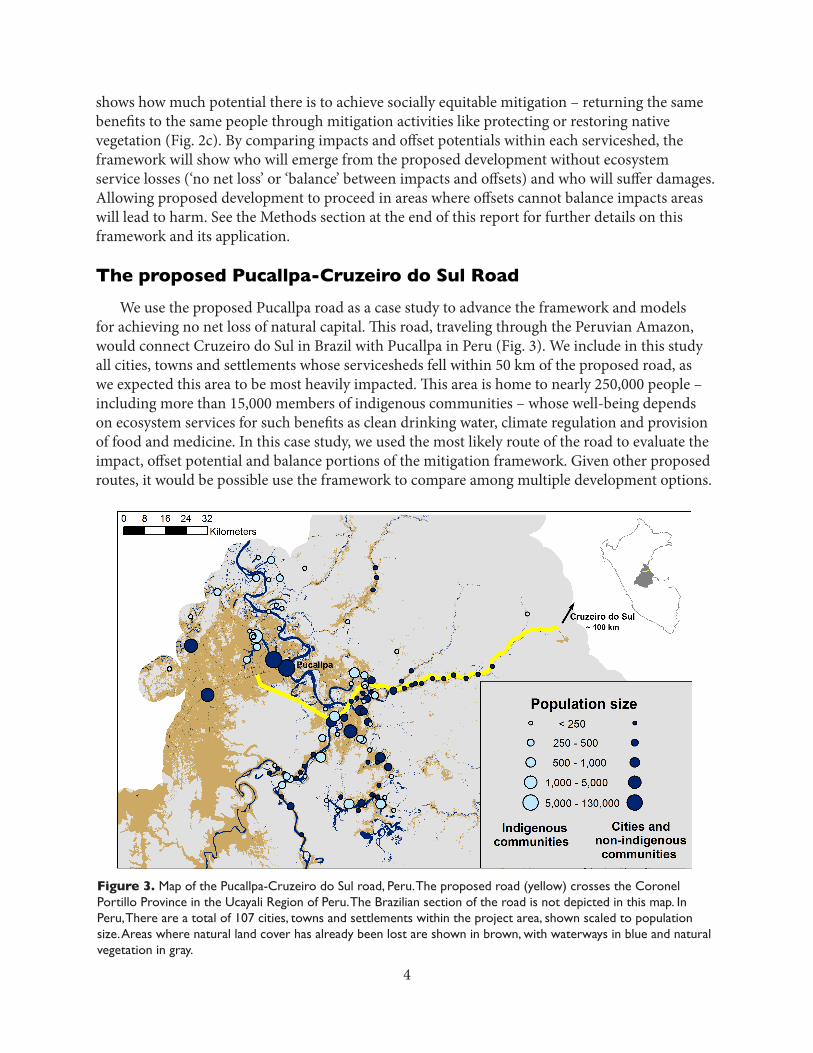
We use the proposed Pucallpa road as a case study to advance the framework and models for achieving no net loss of natural capital. This road, traveling through the Peruvian Amazon, would connect Cruzeiro do Sul in Brazil with Pucallpa in Peru (Fig. 3). We include in this study all cities, towns and settlements whose servicesheds fell within 50 km of the proposed road, as we expected this area to be most heavily impacted. This area is home to nearly 250,000 people – including more than 15,000 members of indigenous communities – whose well-being depends on ecosystem services for such benefits as clean drinking water, climate regulation and provision of food and medicine. In this case study, we used the most likely route of the road to evaluate the impact, offset potential and balance portions of the mitigation framework. Given other proposed routes, it would be possible use the framework to compare among multiple development options.
Figure 3. Map of the Pucallpa-Cruzeiro do Sul road, Peru. The proposed road (yellow) crosses the Coronel Portillo Province in the Ucayali Region of Peru. The Brazilian section of the road is not depicted in this map. In Peru, There are a total of 107 cities, towns and settlements within the project area, shown scaled to population size. Areas where natural land cover has already been lost are shown in brown, with waterways in blue and natural vegetation in gray.
4
Natural capital impact and mitigation approach
We used five ecosystem service models to address two questions:
I) What is the impact of the proposed road on natural capital and ecosystem services?
II) Can mitigation activities (protection, restoration) offset the impacts of the road to achieve no net loss of natural capital?
We consider both the direct impacts of the road (‘road only’), as well as the impacts of the road and associated deforestation (‘road + deforestation’). New roads increase access both to forests and markets, typically leading to increased deforestation in surrounding areas as forested land is cleared for timber extraction and agriculture (CIAT et al. 2012). We projected the amount and location of deforestation due to road construction using historic land cover change data in the study area and IDRISI Land Change Modeler (see Methods section for more details).
To determine the potential for no net loss, we accounted for the benefits of mitigation using two approaches: with social equity (i.e., mitigation within the serviceshed where services were lost) and without social equity (i.e., mitigation within the entire project area, regardless of which serviceshed was affected positively or negatively). No net loss with social equity requires that mitigation activities in each serviceshed count toward offsetting ecosystem service losses only for people within the same serviceshed. This ensures that services are returned to the same people negatively impacted by the road. If no net loss is reached across the project area using mitigation with social equity, ecosystem services will be restored to all people, without creating ecosystem service ‘winners’ and ‘losers.’ In contrast, mitigation without social equity allows mitigation activities in one serviceshed to count toward offsetting ecosystem service losses accrued to people in a different serviceshed, and not necessarily the same people affected by road development. Out-of-serviceshed mitigation ignores social equity and can redistribute the total benefits of natural capital to just a fraction of the population. Even though no net loss may be achieved at the project-area level, there are still ecosystem service ‘winners’ and ‘losers’ on a local level. No net loss with social equity is the only way to ensure no net loss of ecosystem services to all beneficiaries.
We also considered two approaches to choosing mitigation areas. We first took a practical approach, considering limited, feasible areas for protection and restoration. For this option, we allowed mitigation via protection only in areas of native vegetation inside indigenous areas, and via restoration only within existing protected areas and indigenous areas (Fig. 4). Achieving protection and restoration in these areas is likely to be most feasible because of existing management plans and land tenure in these areas. Secondly, we used a targeted approach that allowed us to select the specific places we determined would be the most effective for achieving natural capital gains based on the biophysical characteristics of the landscape (see Methods for more details). In this targeted approach, we considered some degree of practicality, in that we assumed that mitigation would not happen in mining and forestry concessions, urban areas and oil palm plantation areas because of the high opportunity cost of giving up those productive activities (Fig. 4).
5
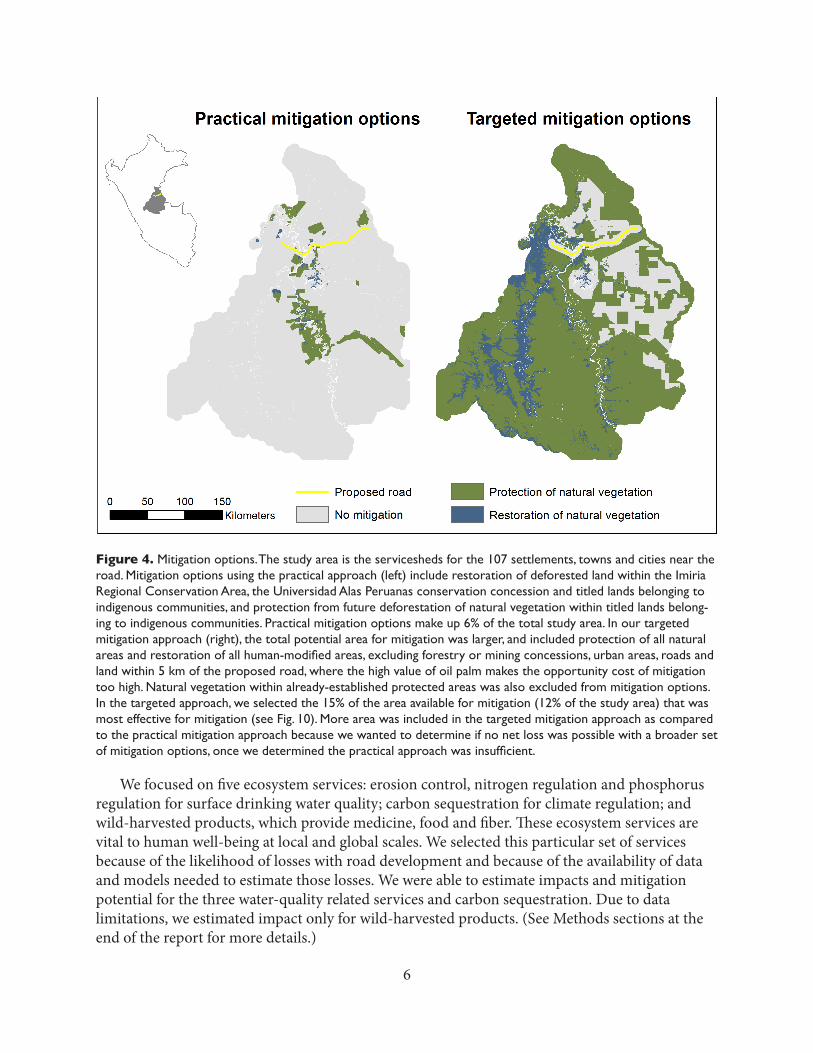
Figure 4. Mitigation options. The study area is the servicesheds for the 107 settlements, towns and cities near the road. Mitigation options using the practical approach (left) include restoration of deforested land within the Imiria Regional Conservation Area, the Universidad Alas Peruanas conservation concession and titled lands belonging to indigenous communities, and protection from future deforestation of natural vegetation within titled lands belong-ing to indigenous communities. Practical mitigation options make up 6% of the total study area. In our targeted mitigation approach (right), the total potential area for mitigation was larger, and included protection of all natural areas and restoration of all human-modified areas, excluding forestry or mining concessions, urban areas, roads and land within 5 km of the proposed road, where the high value of oil palm makes the opportunity cost of mitigation too high. Natural vegetation within already-established protected areas was also excluded from mitigation options. In the targeted approach, we selected the 15% of the area available for mitigation (12% of the study area) that was most effective for mitigation (see Fig. 10). More area was included in the targeted mitigation approach as compared to the practical mitigation approach because we wanted to determine if no net loss was possible with a broader set of mitigation options, once we determined the practical approach was insufficient.
We focused on five ecosystem services: erosion control, nitrogen regulation and phosphorus regulation for surface drinking water quality; carbon sequestration for climate regulation; and wild-harvested products, which provide medicine, food and fiber. These ecosystem services are vital to human well-being at local and global scales. We selected this particular set of services because of the likelihood of losses with road development and because of the availability of data and models needed to estimate those losses. We were able to estimate impacts and mitigation potential for the three water-quality related services and carbon sequestration. Due to data limitations, we estimated impact only for wild-harvested products. (See Methods sections at the end of the report for more details.)
6
KEY FINDINGS
I. What is the impact of the Pucallpa road on natural capital?
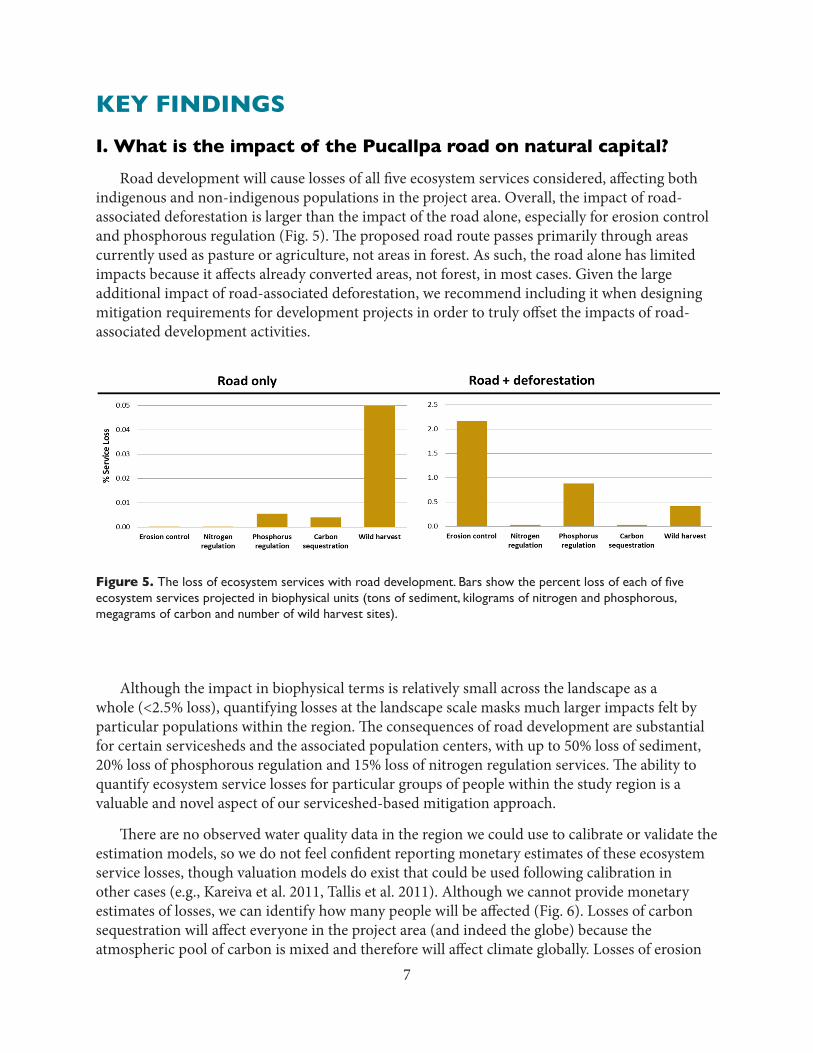
Road development will cause losses of all five ecosystem services considered, affecting both indigenous and non-indigenous populations in the project area. Overall, the impact of road-associated deforestation is larger than the impact of the road alone, especially for erosion control and phosphorous regulation (Fig. 5). The proposed road route passes primarily through areas currently used as pasture or agriculture, not areas in forest. As such, the road alone has limited impacts because it affects already converted areas, not forest, in most cases. Given the large additional impact of road-associated deforestation, we recommend including it when designing mitigation requirements for development projects in order to truly offset the impacts of road-associated development activities.
Although the impact in biophysical terms is relatively small across the landscape as a whole (<2.5% loss), quantifying losses at the landscape scale masks much larger impacts felt by particular populations within the region. The consequences of road development are substantial for certain servicesheds and the associated population centers, with up to 50% loss of sediment, 20% loss of phosphorous regulation and 15% loss of nitrogen regulation services. The ability to quantify ecosystem service losses for particular groups of people within the study region is a valuable and novel aspect of our serviceshed-based mitigation approach.
There are no observed water quality data in the region we could use to calibrate or validate the estimation models, so we do not feel confident reporting monetary estimates of these ecosystem service losses, though valuation models do exist that could be used following calibration in other cases (e.g., Kareiva et al. 2011, Tallis et al. 2011). Although we cannot provide monetary estimates of losses, we can identify how many people will be affected (Fig. 6). Losses of carbon sequestration will affect everyone in the project area (and indeed the globe) because the atmospheric pool of carbon is mixed and therefore will affect climate globally. Losses of erosion
Figure 5. The loss of ecosystem services with road development. Bars show the percent loss of each of five ecosystem services projected in biophysical units (tons of sediment, kilograms of nitrogen and phosphorous, megagrams of carbon and number of wild harvest sites).
7
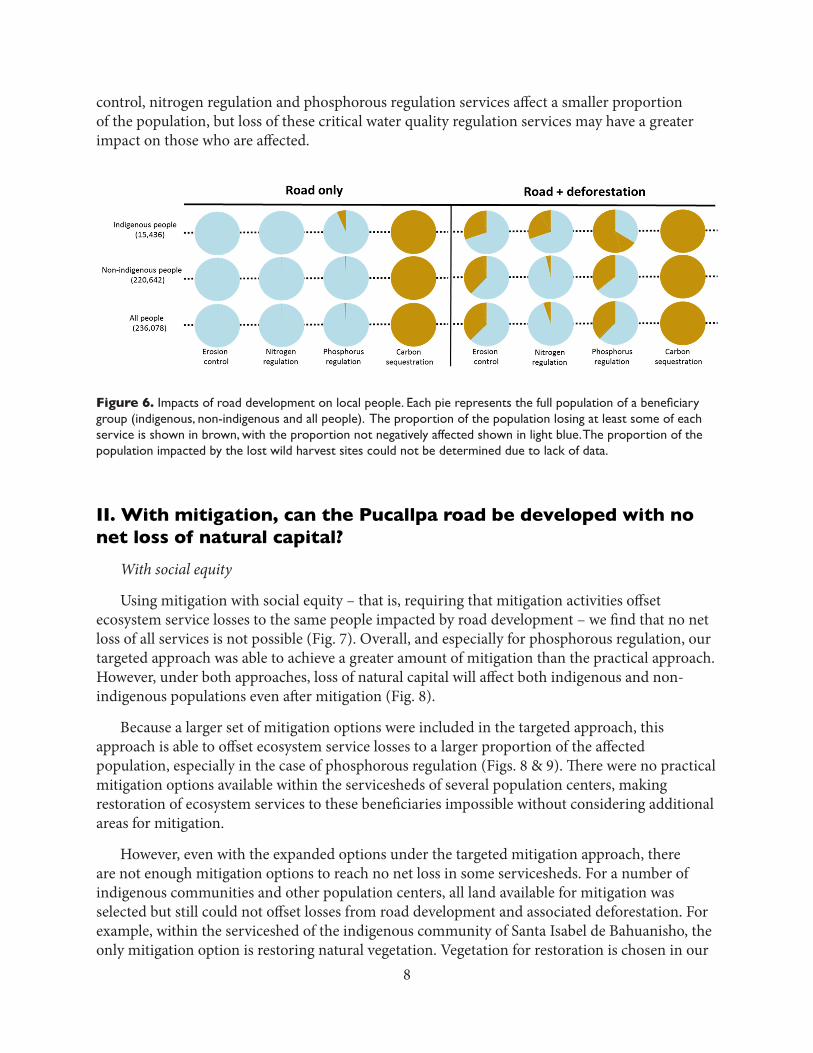
control, nitrogen regulation and phosphorous regulation services affect a smaller proportion of the population, but loss of these critical water quality regulation services may have a greater impact on those who are affected.
II. With mitigation, can the Pucallpa road be developed with no net loss of natural capital?
With social equity
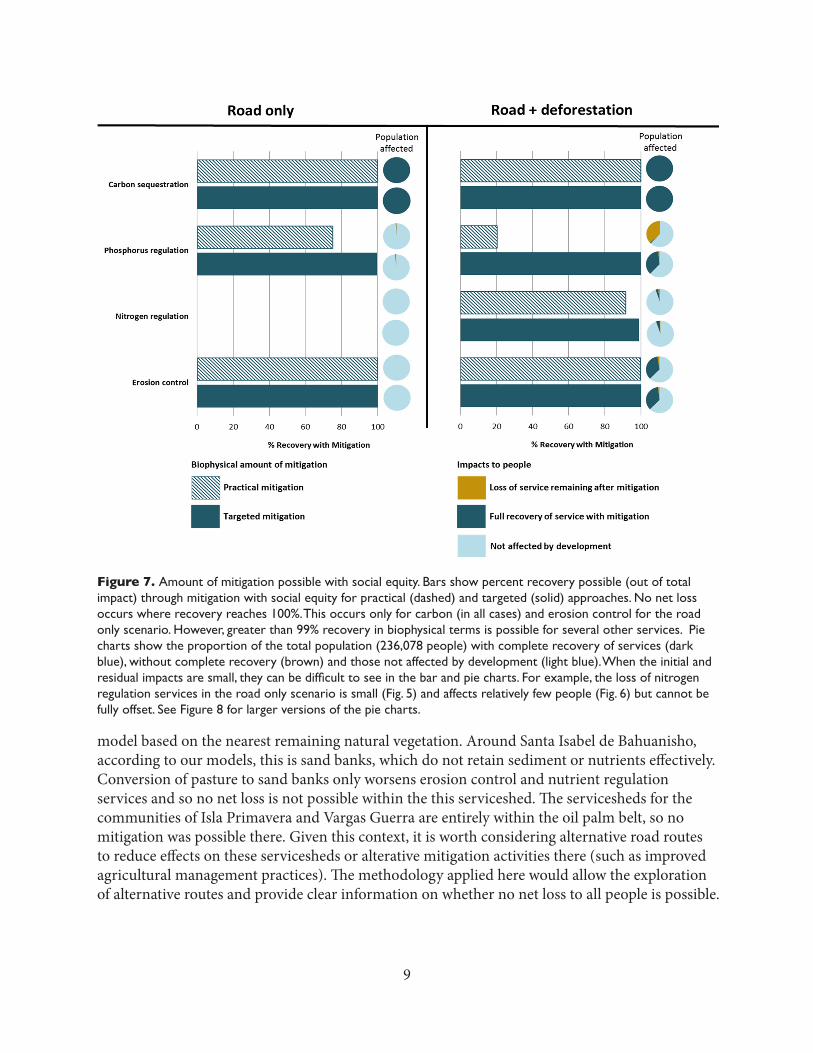
Using mitigation with social equity – that is, requiring that mitigation activities offset ecosystem service losses to the same people impacted by road development – we find that no net loss of all services is not possible (Fig. 7). Overall, and especially for phosphorous regulation, our targeted approach was able to achieve a greater amount of mitigation than the practical approach. However, under both approaches, loss of natural capital will affect both indigenous and non-indigenous populations even after mitigation (Fig. 8).
Because a larger set of mitigation options were included in the targeted approach, this approach is able to offset ecosystem service losses to a larger proportion of the affected population, especially in the case of phosphorous regulation (Figs. 8 & 9). There were no practical mitigation options available within the servicesheds of several population centers, making restoration of ecosystem services to these beneficiaries impossible without considering additional areas for mitigation.
However, even with the expanded options under the targeted mitigation approach, there are not enough mitigation options to reach no net loss in some servicesheds. For a number of indigenous communities and other population centers, all land available for mitigation was selected but still could not offset losses from road development and associated deforestation. For example, within the serviceshed of the indigenous community of Santa Isabel de Bahuanisho, the only mitigation option is restoring natural vegetation. Vegetation for restoration is chosen in our
Figure 6. Impacts of road development on local people. Each pie represents the full population of a beneficiary group (indigenous, non-indigenous and all people). The proportion of the population losing at least some of each service is shown in brown, with the proportion not negatively affected shown in light blue. The proportion of the population impacted by the lost wild harvest sites could not be determined due to lack of data.
8
9
Figure 7. Amount of mitigation possible with social equity. Bars show percent recovery possible (out of total impact) through mitigation with social equity for practical (dashed) and targeted (solid) approaches. No net loss occurs where recovery reaches 100%. This occurs only for carbon (in all cases) and erosion control for the road only scenario. However, greater than 99% recovery in biophysical terms is possible for several other services. Pie charts show the proportion of the total population (236,078 people) with complete recovery of services (dark blue), without complete recovery (brown) and those not affected by development (light blue). When the initial and residual impacts are small, they can be difficult to see in the bar and pie charts. For example, the loss of nitrogen regulation services in the road only scenario is small (Fig. 5) and affects relatively few people (Fig. 6) but cannot be fully offset. See Figure 8 for larger versions of the pie charts.
model based on the nearest remaining natural vegetation. Around Santa Isabel de Bahuanisho, according to our models, this is sand banks, which do not retain sediment or nutrients effectively. Conversion of pasture to sand banks only worsens erosion control and nutrient regulation services and so no net loss is not possible within the this serviceshed. The servicesheds for the communities of Isla Primavera and Vargas Guerra are entirely within the oil palm belt, so no mitigation was possible there. Given this context, it is worth considering alternative road routes to reduce effects on these servicesheds or alterative mitigation activities there (such as improved agricultural management practices). The methodology applied here would allow the exploration of alternative routes and provide clear information on whether no net loss to all people is possible.
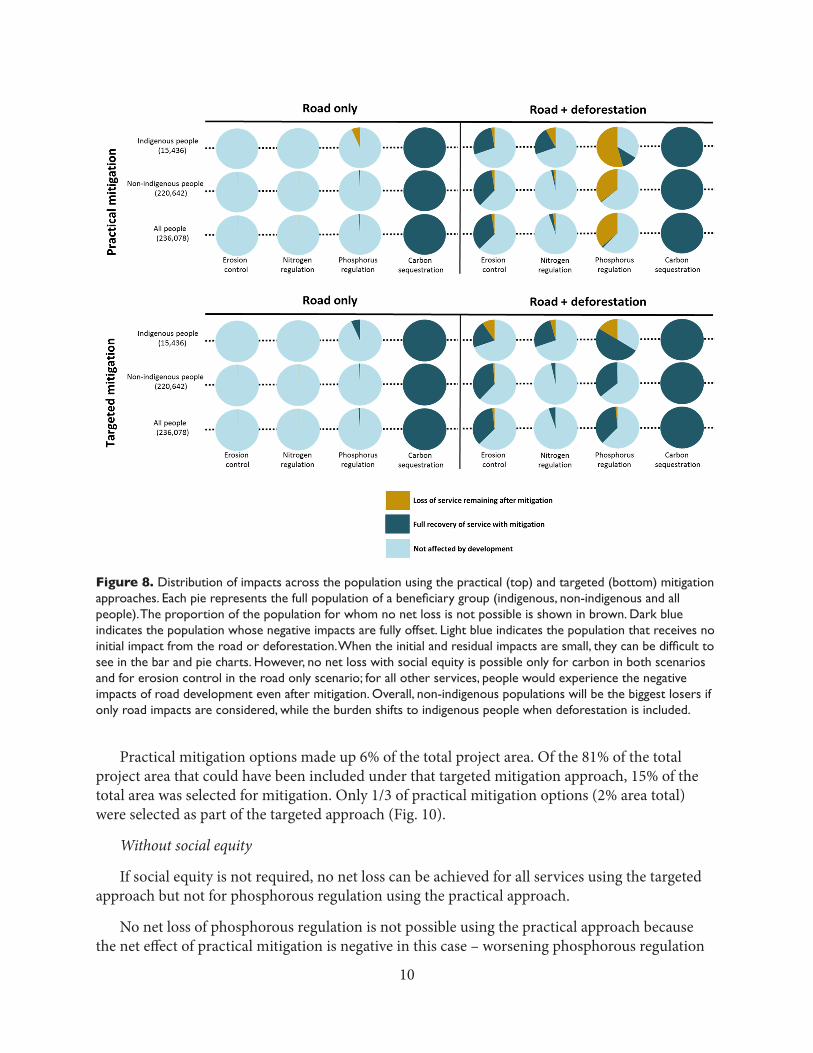
Practical mitigation options made up 6% of the total project area. Of the 81% of the total project area that could have been included under that targeted mitigation approach, 15% of the total area was selected for mitigation. Only 1/3 of practical mitigation options (2% area total) were selected as part of the targeted approach (Fig. 10).
Without social equity
If social equity is not required, no net loss can be achieved for all services using the targeted approach but not for phosphorous regulation using the practical approach.
No net loss of phosphorous regulation is not possible using the practical approach because the net effect of practical mitigation is negative in this case – worsening phosphorous regulation
10
Figure 8. Distribution of impacts across the population using the practical (top) and targeted (bottom) mitigation approaches. Each pie represents the full population of a beneficiary group (indigenous, non-indigenous and all people). The proportion of the population for whom no net loss is not possible is shown in brown. Dark blue indicates the population whose negative impacts are fully offset. Light blue indicates the population that receives no initial impact from the road or deforestation. When the initial and residual impacts are small, they can be difficult to see in the bar and pie charts. However, no net loss with social equity is possible only for carbon in both scenarios and for erosion control in the road only scenario; for all other services, people would experience the negative impacts of road development even after mitigation. Overall, non-indigenous populations will be the biggest losers if only road impacts are considered, while the burden shifts to indigenous people when deforestation is included.
11
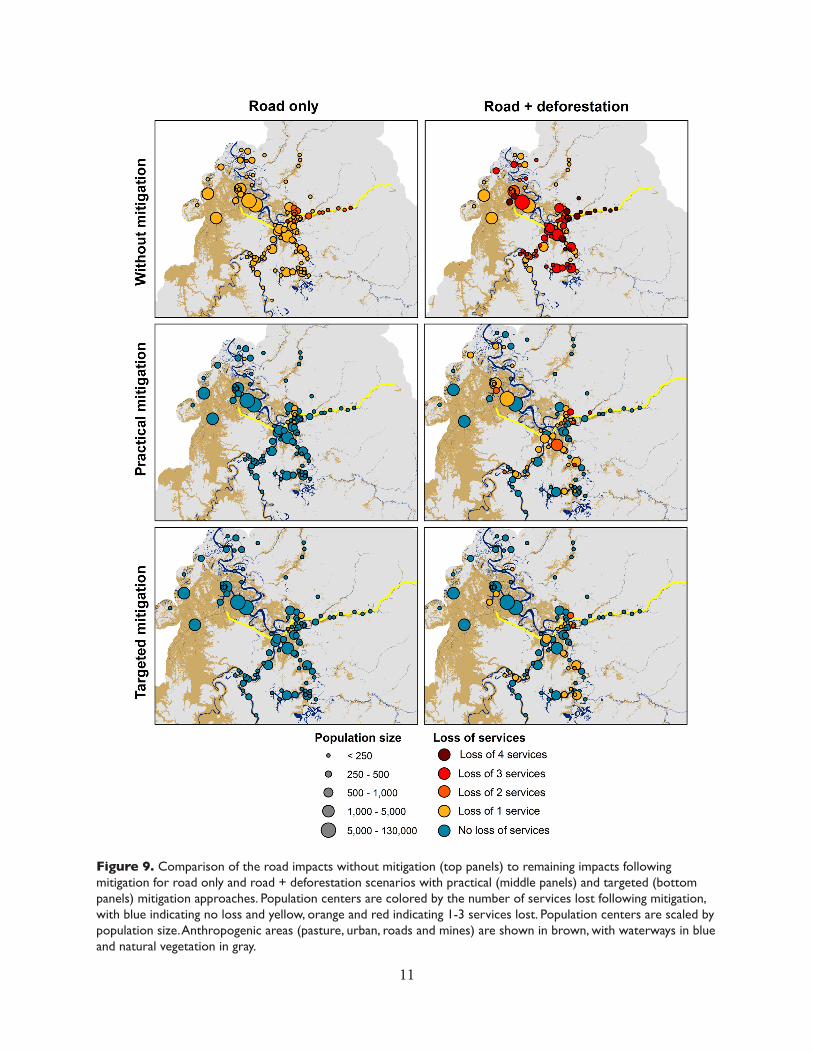
Figure 9. Comparison of the road impacts without mitigation (top panels) to remaining impacts following mitigation for road only and road + deforestation scenarios with practical (middle panels) and targeted (bottom panels) mitigation approaches. Population centers are colored by the number of services lost following mitigation, with blue indicating no loss and yellow, orange and red indicating 1-3 services lost. Population centers are scaled by population size. Anthropogenic areas (pasture, urban, roads and mines) are shown in brown, with waterways in blue and natural vegetation in gray.
12
services to more people than it benefits. This occurs in part because pasture and oil palm are able to retain phosphorous at a higher rate than some forms of natural vegetation, based on our review of global literature, so mitigation through restoration or protection in some locations can reduce nutrient regulation services. Related to this, mitigation that restores one service may have negative consequences for another service. For example, restoring pasture and oil palm to native forest may improve sediment retention but worsen nitrogen retention. This means that mitigation activities offsetting the negative impacts of road development on one service can have negative effects on other services that were not originally affected by the road.
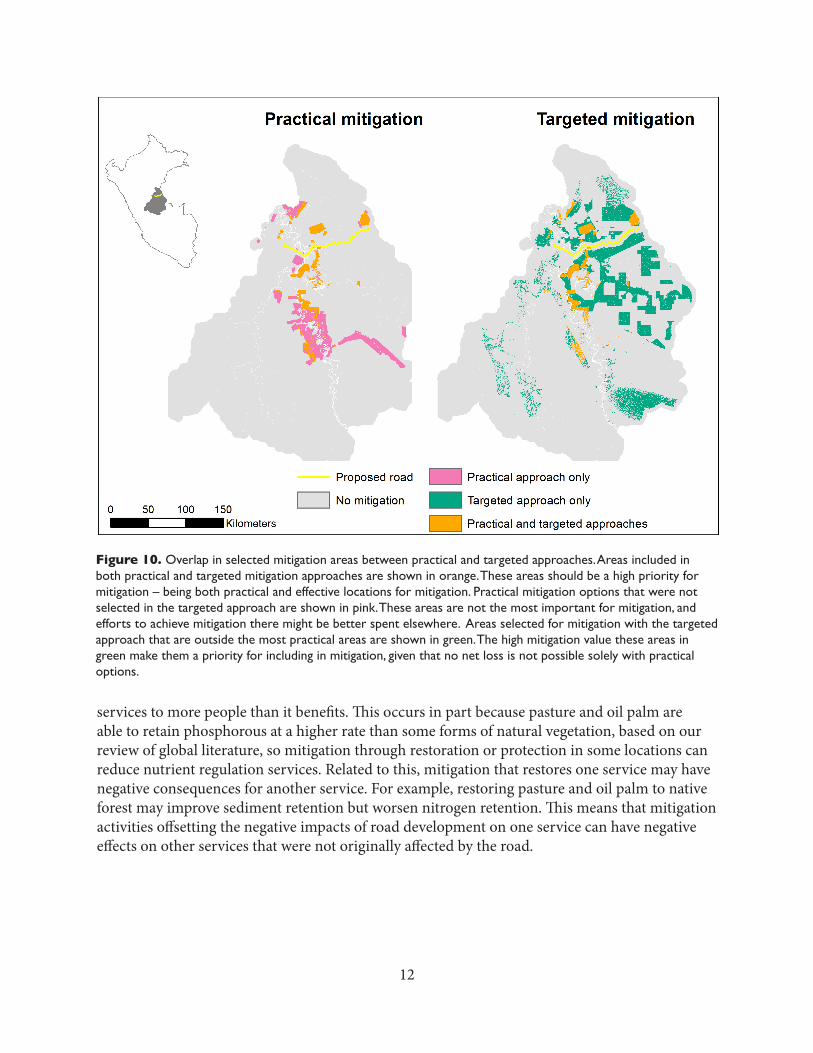
Figure 10. Overlap in selected mitigation areas between practical and targeted approaches. Areas included in both practical and targeted mitigation approaches are shown in orange. These areas should be a high priority for mitigation – being both practical and effective locations for mitigation. Practical mitigation options that were not selected in the targeted approach are shown in pink. These areas are not the most important for mitigation, and efforts to achieve mitigation there might be better spent elsewhere. Areas selected for mitigation with the targeted approach that are outside the most practical areas are shown in green. The high mitigation value these areas in green make them a priority for including in mitigation, given that no net loss is not possible solely with practical options.
METHODSWe followed the serviceshed-based mitigation framework outlined in Figure 2. Here we de-
scribe the methods used in each component of the framework.
Scoping
Identification of development options: road scenario
We used the mitigation framework to assess the most likely route of the proposed Pucallpa-Curzeiro do Sul road. In the ‘road only’ scenario, we modeled the conversion of this route to paved road, with no other changes to the surrounding landscape. However, the impact of road construction on natural capital is likely to come primarily from increases in deforestation in the surrounding landscape as a result of improved access to those areas, rather than from the direct impacts of road itself. Therefore, we also modeled the combined impacts of the road and road-associated deforestation.
We accounted for the impact of road-associated deforestation by creating scenarios of future deforestation both without the road present (road + baseline deforestation) and with the road present (road + increased deforestation). These scenarios were based on projected rates of deforestation to 2030 using Terra-i land cover change data (Touval et al. 2011) and the IDRISI Land Change Modeler, which provides spatially explicit estimates of deforestation probabilities accounting for drivers of deforestation such as distance from cities and roads. We created 5 different scenarios of future deforestation with and without the road present using the probabilities of deforestation generated by the IDRIS Land Change Modeler. This means that if a particular pixel had an 80% probability of deforestation, that pixel would, on average, be deforested in 4 out of 5 scenarios and remain forested in 1 out of 5. It was necessary to convert the probabilities of deforestation into spatially explicit scenarios of land use change in order to calculate ecosystem service impacts using the InVEST models.
As expected, these models predicted that deforestation rates in the study area would increase overall, especially near the Pucallpa-Cruzeiro do Sul road. Based on recent trends in land use change in the area, we assumed that forest lost within 5 km of the road would be converted to oil palm. We assumed that forest lost beyond 5 km from the road would be converted to pasture. We calculated the amount of impact of road-associated deforestation as the mean difference in ecosystem service levels between each of 5 future scenarios of deforestation with and without the road present (road + increased deforestation vs. road + baseline deforestation).
Services, beneficiaries and servicesheds
The value of natural capital stocks comes from the benefits they provide to people in the form of ecosystem services. We assessed five ecosystem services: erosion control, nitrogen regulation and phosphorus regulation for surface drinking water quality; carbon sequestration for climate regulation; and wild-harvested products, which provide medicine, food and fiber. The people we included in this analysis are the 107 population centers within the project area (Fig. 1), housing 236,078 people.
13
For the three water-quality related services (erosion control, nitrogen and phosphorus regulation), the serviceshed is the upstream catchment area that delivers water to the river or stream nearest the settlement. For carbon sequestration, the whole world is the serviceshed because the atmosphere is well mixed, so changes in carbon sequestration have a global effect through climate change. However, the population numbers we report in our impact estimates only reflect the local population impacted, rather than the population of the entire planet. For wild-harvested products, the serviceshed is the area where these products are present and for which members of a population center have physical access and access rights. We were unable to delineate servicesheds for wild-harvested products in the project area because data on access and harvest practices were not available.
Impact
Estimating road impacts
We estimated the impacts of the road and associated deforestation on ecosystem services with the freely available software InVEST (Kareiva et al. 2011; Tallis et al. 2011). We used the sediment retention model to estimate erosion control, the water purification model to estimate nitrogen and phosphorous regulation and the carbon storage and sequestration model to estimate carbon stocks.
The impact of road development was determined by calculating the change in service between the current landscape and the projected future scenarios (road only, road + baseline deforestation, road + increased deforestation) for each serviceshed. To estimate these impacts, we combined a local land use and land cover map (Josse et al. 2007) with regional and global datasets on carbon, soils and climate (Baccini et al. 2012, FAO 2004, FAO et al. 2012, Hijmans et al. 2005, ISIRC 2005a, ISIRC 2005b). When data specific to the project area were not available, we used a global literature review to identify data from similar land uses or vegetation types in other areas and used the average of reported estimates.
The sediment retention model estimates soil retention and loss on land and the accumulation of sediment in streams and rivers. This model predicts sheet erosion but does not account for stream-bank erosion or instream deposition and transport processes that may also contribute to regulating sediment levels in the project area. The water purification model accounts for similar processes to the sediment retention model. We applied the water purification model to estimate total nitrogen and total phosphorus retention and loss on land, and the accumulation of these pollutants in streams and rivers. This model only accounts for nutrient pollutants from non-point sources and also ignores instream processes.
The carbon storage and sequestration model estimates the amount of carbon stored on a landscape in four pools: aboveground biomass, belowground biomass, soil and dead organic matter. Our model does not account for greenhouse gas contributions associated with land use (e.g., from livestock production).
We determined the impact of road development on sites used for the collection of wild-harvested products based on resource use maps from Instituto del Bien Común (unpublished data, 2010). We included sites for medicinal plant collection, wood extraction, hunting and
14

collection of other products. Sites were mapped as point locations; we estimated conservatively that each site extended to a radius of 50 m. Any site located in native vegetation that was converted to road or deforested for pasture or oil palm plantations was considered lost. The resource use maps may not provide a complete inventory of sites used by all population centers, so our calculated losses should be considered a minimum estimate.
Mitigation ratio
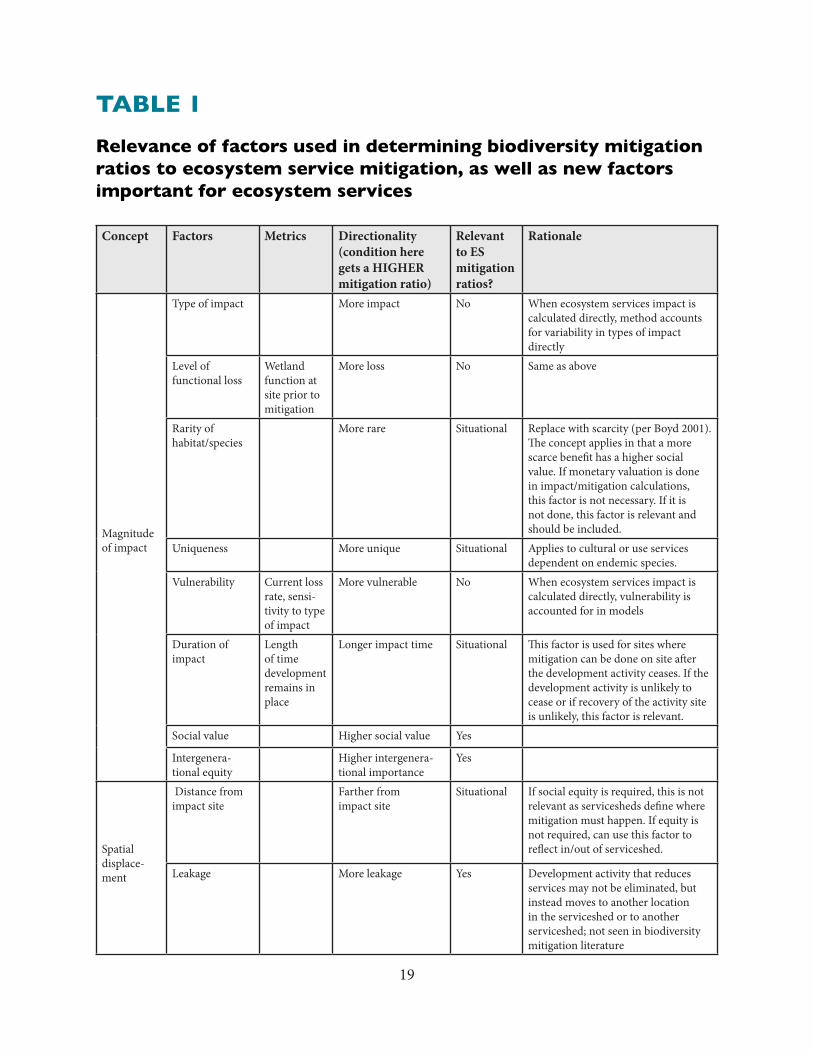
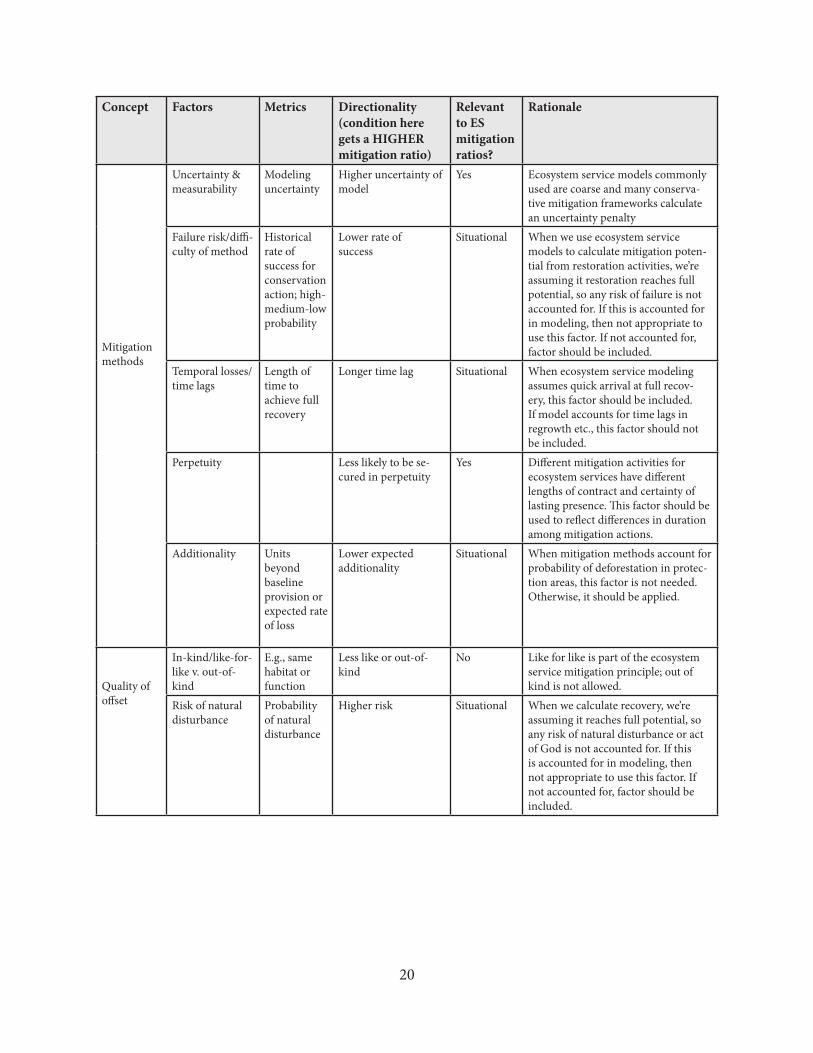
Mitigation activities in practice are rarely as effective at offsetting impacts as expected. In order to truly achieve no net loss, use of mitigation ratios – or adjustment factors – are common. Ratios usually adjust for factors such as time lags (e.g., the time it takes for a restored forest to reach maturity) and risk (e.g., tree mortality associated with forest restoration) associated with mitigation activities. While mitigation ratios for biodiversity compensation have been used widely (McKenney & Kiesecker 2010), there is currently no framework for determining and applying mitigation ratios to natural capital. We have reviewed the biodiversity mitigation literature to determine the factors used in calculating biodiversity mitigation ratios (Appendix A). We have determined which of these factors are relevant for ecosystem service mitigation, as well as additional factors not represented in the biodiversity mitigation literature that should be considered for ecosystem services mitigation (Table 1). However, given the current state of ecosystem service knowledge, we do not have the information necessary to calculate and apply a mitigation ratio other than 1:1 for the proposed Pucallpa road but see this as an avenue of further research. Because we do apply a mitigation ratio of 1:1, our estimates of the amount of mitigation needed should be considered as the minimum possible offset. In the future, the factors included in Table 1 should be integrated into calculations of mitigation ratios for ecosystem service offsets.
Mitigation
Estimation of offset potential
We wanted our estimation of mitigation potential to be realistic. Of course, it is possible that no net loss could be achieved if the entire landscape is restored or protected, but it is very unlikely that this will happen. First we limited mitigation options to those that are most practical based on local property rights and land tenure. Mitigation options (Fig. 4) included: (1) restoration of deforested land within the Imiria Regional Conservation Area, the Universidad Alas Peruanas conservation concession and titled lands belonging to indigenous communities; and (2) protection from future deforestation of natural vegetation within titled lands belonging to indigenous communities. We considered the potential for no net loss of ecosystem services assuming protection and restoration occurred in all the areas identified as practical. However, this practical approach to mitigation was not sufficient to achieve no net loss of ecosystem services with social equity. Several population centers lacked mitigation sites within their servicesheds, so the impacts of even the road alone could not be offset.
We therefore expanded our mitigation options to include a broader set of potentially feasible areas and used a targeted approach to locate mitigation activities in the most effective sites in order to minimize the total area need to reach no net loss. For this analysis, mitigation options included all natural areas outside of forestry or mining concessions, and all human-modified
15
areas excluding urban areas, roads and land within 5 km of the proposed road where the high value of oil palm makes the opportunity cost of mitigation too high.
In this targeted approach, we strategically chose sites for mitigation using ranking models that prioritize the most effective locations for protection and restoration based on the biophysical characteristics of the site (such as slope, distance from rivers and vegetation type), the number of downstream beneficiaries and the amount of downstream mitigation needed (Vogl et al. 2012). In choosing where on the landscape protection would be most effective, we also factored in the probability of future deforestation, prioritizing areas with a high probability of deforestation. This ensures that protection in these areas will benefit natural capital by reducing future deforestation, rather than protecting sites that are unlikely to be deforested anyway.
To determine whether no net loss was possible with this targeted approach, we selected increasing amounts of area for mitigation. When 15% of the total area of the 107 servicesheds was selected, no additional area for mitigation was available in several of the servicesheds with the greatest impacts. Nearly all of the remaining area available for mitigation was located in servicesheds where mitigation needs were already met. Therefore, including more than this 15% in mitigation would not have substantially improved ecosystem service provision, and no net loss with social equity – mitigating all negative effects for all people – is not possible.
Determining Mitigation Balance
To determine whether no net loss was possible for a given mitigation option, we constructed a new scenario reflecting the mitigation activities (restoration of native vegetation and protection of existing vegetation). We used the same ecosystem service models as described above under “Quantifying Impact.” To determine the balance between impact and mitigation, we compared the levels of ecosystem services provided with mitigation to the levels needed to offset the negative impacts of the road, as well as the road plus associated deforestation. When the amount of mitigation equaled or exceeded the amount of impact, no net loss was achieved. Otherwise, we calculated the remaining, unmitigated amount of impact.
Role for local stakeholder participation
Where possible, local stakeholder input would make a valuable contribution to the impact assessment and mitigation process for natural capital. Stakeholders could identify additional services likely to be impacted by road development and associated land use change. Stakeholder knowledge is especially valuable for delineating servicesheds, as this process requires information about both physical access ability and access rights. In this case study, local knowledge about water use and information on access to and management of wild-harvested products would have allowed a more precise delineation of the servicesheds for these services. Information about the relative importance of services to different stakeholder groups could also be incorporated into mitigation design. In cases where fully offsetting all ecosystem service losses is not possible, for example due to trade-offs among services, local stakeholder input could be used to prioritize mitigation of the most important services.
16
REFERENCES CITEDBaccini, A., S.J. Goetz, W.S. Walker, N.T. Laporte, M. Sun, D. Sulla-Menashe, J. Hackler, P.S.A.
Beck, R. Dubayah, M.A. Friedl, S. Samanta and R.A. Houghton. (2012). Estimated carbon dioxide emissions from tropical deforestation improved by carbon-density maps. Nature Climate Change. http://dx.doi.org/10.1038/NCLIMATE1354
CIAT (International Center for Tropical Agriculture), The Nature Conservancy and the Inter-American Development Bank. (2012). Road Impact on Habitat Loss: IIRSA Corridor in Peru 2004-2011.
FAO (Food and Agriculture Organization of the United Nations). 2004. Global map of monthly reference evapotranspiration - 10 arc minutes. Rome, Italy.
FAO (Food and Agriculture Organization of the United Nations), International Institute for Applied Systems Analysis, International Soil Reference and Information Centre, Institute of Soil Science, Chinese Academy of Sciences and Joint Research Centre of the European Comission. (2012). Harmonized World Soil Database. Version 1.2. FAO, Rome, Italy and International Institute for Applied Systems Analysis, Laxenburg, Austria.
Guo, L.B. and R.M. Gifford. (2002). Soil carbon stocks and land use change: a meta analysis. Global Change Biology. 8:345-360.
Hijmans, R.J., S.E. Cameron, J.L. Parra, P.G. Jones and A. Jarvis. (2005). Very high resolution interpolated climate surfaces for global land areas. International Journal of Climatology. 25: 1965-1978.
IPCC (Intergovernmental Panel on Climate Change). (2006). Agriculture, forestry and other land use. Vol. 4 in: 2006 IPCC Guidelines for National Greenhouse Gas Inventories, H.S. Eggleston, L. Buendia, K. Miwa, T. Ngara, and K. Tanabe (eds). Institute for Global Environmental Strategies (IGES), Hayama, Japan.
ISRIC (International Soil Reference and Information Centre). (2005a). Soil and Terrain Database for Latin America and the Caribbean (SOTERLAC). Version 2.0. Wageningen, The Netherlands.
ISRIC (International Soil Reference and Information Centre). (2005b). SOTER-based soil parameter estimates for Latin America and the Caribbean. Version 1.0. Wageningen, The Netherlands.
Josse, C., G. Navarro, F. Encarnación, A. Tovar, P. Comer, W. Ferreira, F. Rodríguez, J. Saito, J. Sanjurjo, J. Dyson, E. Rubin de Celis, R. Zárate, J. Chang, M. Ahuite, C. Vargas, F. Paredes, W. Castro, J. Maco and F. Reátegui. (2007). Sistemas Ecológicos de la Cuenca Amazónica de Perú y Bolivia: Clasificación y mapeo. NatureServe, Arlington, Virginia.
Kareiva, P.K., H. Tallis, T. Ricketts, G. Daily, and S. Polasky. (2011). Natural Capital: Theory and Practice of Mapping Ecosystem Services. Oxford University Press, Oxford.
King, D.M and E.W. Price. (2004). The Five-Step Wetland Mitigation Ratio Calculator. http://www.ebmtools.org/mitigation-ratio-calculator.html
17
McKenney, B.A. and J.M. Kiesecker. (2010). Policy development for biodiversity offsets: a Review of offset frameworks. Environmental Management. 45:165–176
Norton, D.A. (2009). Biodiversity offsets: two New Zealand case studies and an assessment framework. Environmental Management. 43:698-706.
Tallis, H. et al. (2011). InVEST 2.1 beta User’s Guide, Natural Capital Project, Stanford.
Tallis, H., S. Polasky, J.S. Lozano, S. Wolny. (2012). Inclusive wealth accounting for regulating ecosystem services. In Inclusive Wealth Report 2012: Measuring Progress Towards Sustainability. Cambridge University Press, Cambridge.
Touval, J., A. Jarvis, L. Reymondin and K. Argone. (2011). Terra-I: An Eye on Habitat Change. The Nature Conservancy (TNC), Washington, D.C., USA; International Centre for Tropical Agriculture (CIAT), Cali, Colombia; Haute Ecole d’Ingénierie et de Gestion du Canton de Vaud (HEIG-VD), Switzerland; and King’s College London, London, UK. Available online at www.terra-i.org
Vogl, A., H. Tallis, J. Douglass, R. Sharp, F. Veiga, S. Benitez, J. León, E. Game, P. Petry J. Guimerães and J.S. Lozano. (2012). Resource Investment Optimization System (RIOS) User Manual. Natural Capital Project, Stanford.
18
Concept Factors Metrics Directionality (condition here gets a HIGHER mitigation ratio)
Relevant to ES mitigation ratios?
Rationale
Magnitude of impact
Type of impact More impact No When ecosystem services impact is calculated directly, method accounts for variability in types of impact directly
Level of functional loss
Wetland function at site prior to mitigation
More loss No Same as above
Rarity of habitat/species
More rare Situational Replace with scarcity (per Boyd 2001). The concept applies in that a more scarce benefit has a higher social value. If monetary valuation is done in impact/mitigation calculations, this factor is not necessary. If it is not done, this factor is relevant and should be included.
Uniqueness More unique Situational Applies to cultural or use services dependent on endemic species.
Vulnerability Current loss rate, sensi-tivity to type of impact
More vulnerable No When ecosystem services impact is calculated directly, vulnerability is accounted for in models
Duration of impact
Length of time development remains in place
Longer impact time Situational This factor is used for sites where mitigation can be done on site after the development activity ceases. If the development activity is unlikely to cease or if recovery of the activity site is unlikely, this factor is relevant.
Social value Higher social value Yes
Intergenera-tional equity
Higher intergenera-tional importance
Yes
Spatial displace-ment
Distance from impact site
Farther from impact site
Situational If social equity is required, this is not relevant as servicesheds define where mitigation must happen. If equity is not required, can use this factor to reflect in/out of serviceshed.
Leakage More leakage Yes Development activity that reduces services may not be eliminated, but instead moves to another location in the serviceshed or to another serviceshed; not seen in biodiversity mitigation literature
19
TABLE 1
Relevance of factors used in determining biodiversity mitigation ratios to ecosystem service mitigation, as well as new factors important for ecosystem services
Concept Factors Metrics Directionality (condition here gets a HIGHER mitigation ratio)
Relevant to ES mitigation ratios?
Rationale
Mitigation methods
Uncertainty & measurability
Modeling uncertainty
Higher uncertainty of model
Yes Ecosystem service models commonly used are coarse and many conserva-tive mitigation frameworks calculate an uncertainty penalty
Failure risk/diffi-culty of method
Historical rate of success for conservation action; high-medium-low probability
Lower rate of success
Situational When we use ecosystem service models to calculate mitigation poten-tial from restoration activities, we’re assuming it restoration reaches full potential, so any risk of failure is not accounted for. If this is accounted for in modeling, then not appropriate to use this factor. If not accounted for, factor should be included.
Temporal losses/time lags
Length of time to achieve full recovery
Longer time lag Situational When ecosystem service modeling assumes quick arrival at full recov-ery, this factor should be included. If model accounts for time lags in regrowth etc., this factor should not be included.
Perpetuity Less likely to be se-cured in perpetuity
Yes Different mitigation activities for ecosystem services have different lengths of contract and certainty of lasting presence. This factor should be used to reflect differences in duration among mitigation actions.
Additionality Units beyond baseline provision or expected rate of loss
Lower expected additionality
Situational When mitigation methods account for probability of deforestation in protec-tion areas, this factor is not needed. Otherwise, it should be applied.
Quality of offset
In-kind/like-for-like v. out-of-kind
E.g., same habitat or function
Less like or out-of-kind
No Like for like is part of the ecosystem service mitigation principle; out of kind is not allowed.
Risk of natural disturbance
Probability of natural disturbance
Higher risk Situational When we calculate recovery, we’re assuming it reaches full potential, so any risk of natural disturbance or act of God is not accounted for. If this is accounted for in modeling, then not appropriate to use this factor. If not accounted for, factor should be included.
20
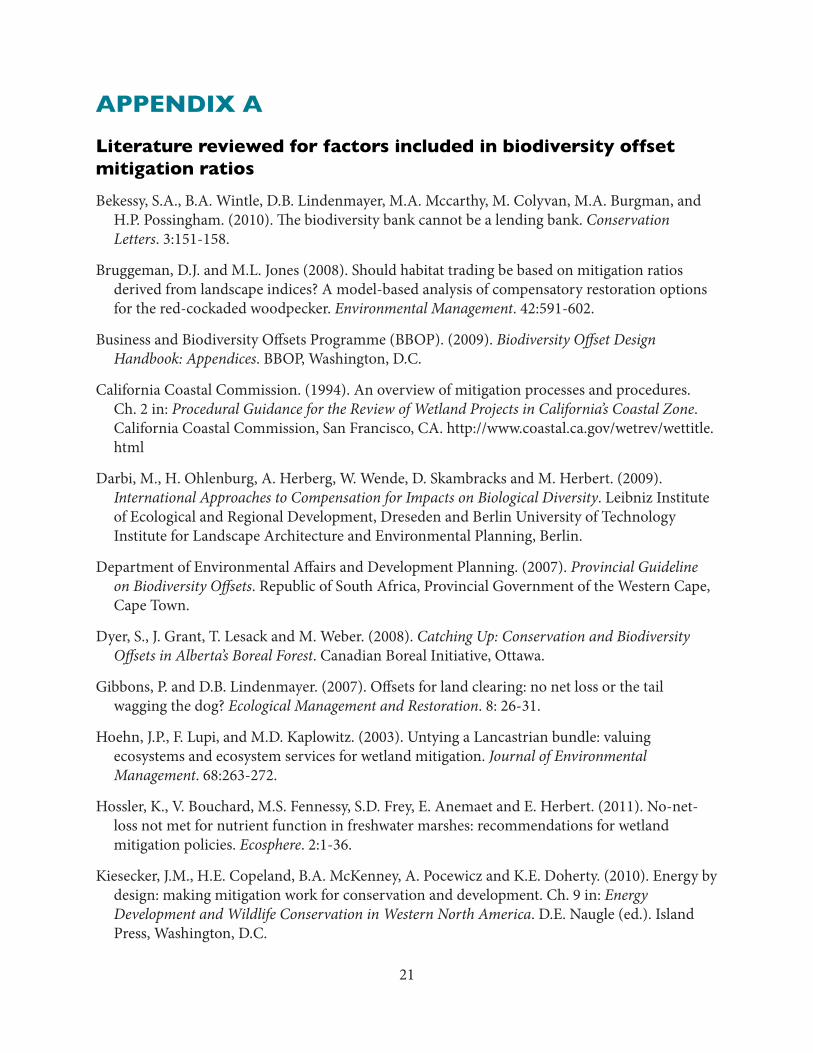
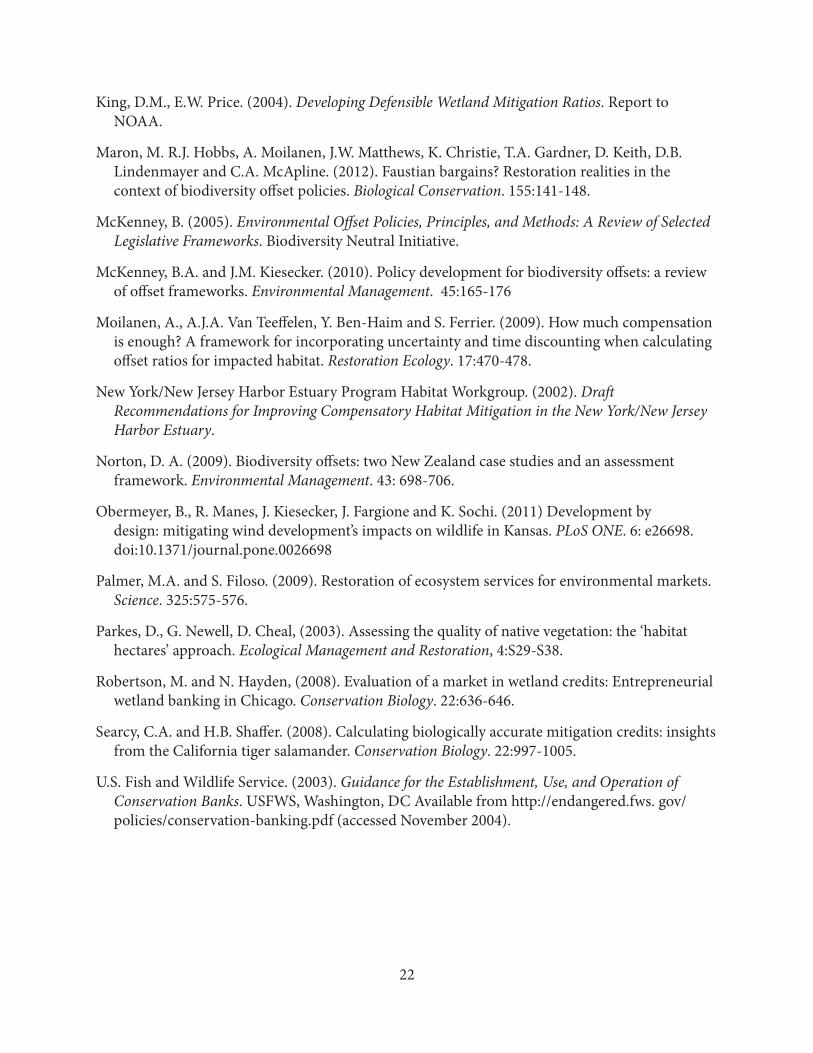
APPENDIX A
Literature reviewed for factors included in biodiversity offset mitigation ratios
Bekessy, S.A., B.A. Wintle, D.B. Lindenmayer, M.A. Mccarthy, M. Colyvan, M.A. Burgman, and H.P. Possingham. (2010). The biodiversity bank cannot be a lending bank. Conservation Letters. 3:151-158.
Bruggeman, D.J. and M.L. Jones (2008). Should habitat trading be based on mitigation ratios derived from landscape indices? A model-based analysis of compensatory restoration options for the red-cockaded woodpecker. Environmental Management. 42:591-602.
Business and Biodiversity Offsets Programme (BBOP). (2009). Biodiversity Offset Design Handbook: Appendices. BBOP, Washington, D.C.
California Coastal Commission. (1994). An overview of mitigation processes and procedures. Ch. 2 in: Procedural Guidance for the Review of Wetland Projects in California’s Coastal Zone. California Coastal Commission, San Francisco, CA. http://www.coastal.ca.gov/wetrev/wettitle.html
Darbi, M., H. Ohlenburg, A. Herberg, W. Wende, D. Skambracks and M. Herbert. (2009). International Approaches to Compensation for Impacts on Biological Diversity. Leibniz Institute of Ecological and Regional Development, Dreseden and Berlin University of Technology Institute for Landscape Architecture and Environmental Planning, Berlin.
Department of Environmental Affairs and Development Planning. (2007). Provincial Guideline on Biodiversity Offsets. Republic of South Africa, Provincial Government of the Western Cape, Cape Town.
Dyer, S., J. Grant, T. Lesack and M. Weber. (2008). Catching Up: Conservation and Biodiversity Offsets in Alberta’s Boreal Forest. Canadian Boreal Initiative, Ottawa.
Gibbons, P. and D.B. Lindenmayer. (2007). Offsets for land clearing: no net loss or the tail wagging the dog? Ecological Management and Restoration. 8: 26-31.
Hoehn, J.P., F. Lupi, and M.D. Kaplowitz. (2003). Untying a Lancastrian bundle: valuing ecosystems and ecosystem services for wetland mitigation. Journal of Environmental Management. 68:263-272.
Hossler, K., V. Bouchard, M.S. Fennessy, S.D. Frey, E. Anemaet and E. Herbert. (2011). No-net-loss not met for nutrient function in freshwater marshes: recommendations for wetland mitigation policies. Ecosphere. 2:1-36.
Kiesecker, J.M., H.E. Copeland, B.A. McKenney, A. Pocewicz and K.E. Doherty. (2010). Energy by design: making mitigation work for conservation and development. Ch. 9 in: Energy Development and Wildlife Conservation in Western North America. D.E. Naugle (ed.). Island Press, Washington, D.C.
21
King, D.M., E.W. Price. (2004). Developing Defensible Wetland Mitigation Ratios. Report to NOAA.
Maron, M. R.J. Hobbs, A. Moilanen, J.W. Matthews, K. Christie, T.A. Gardner, D. Keith, D.B. Lindenmayer and C.A. McApline. (2012). Faustian bargains? Restoration realities in the context of biodiversity offset policies. Biological Conservation. 155:141-148.
McKenney, B. (2005). Environmental Offset Policies, Principles, and Methods: A Review of Selected Legislative Frameworks. Biodiversity Neutral Initiative.
McKenney, B.A. and J.M. Kiesecker. (2010). Policy development for biodiversity offsets: a review of offset frameworks. Environmental Management. 45:165-176
Moilanen, A., A.J.A. Van Teeffelen, Y. Ben-Haim and S. Ferrier. (2009). How much compensation is enough? A framework for incorporating uncertainty and time discounting when calculating offset ratios for impacted habitat. Restoration Ecology. 17:470-478.
New York/New Jersey Harbor Estuary Program Habitat Workgroup. (2002). Draft Recommendations for Improving Compensatory Habitat Mitigation in the New York/New Jersey Harbor Estuary.
Norton, D. A. (2009). Biodiversity offsets: two New Zealand case studies and an assessment framework. Environmental Management. 43: 698-706.
Obermeyer, B., R. Manes, J. Kiesecker, J. Fargione and K. Sochi. (2011) Development by design: mitigating wind development’s impacts on wildlife in Kansas. PLoS ONE. 6: e26698. doi:10.1371/journal.pone.0026698
Palmer, M.A. and S. Filoso. (2009). Restoration of ecosystem services for environmental markets. Science. 325:575-576.
Parkes, D., G. Newell, D. Cheal, (2003). Assessing the quality of native vegetation: the ‘habitat hectares’ approach. Ecological Management and Restoration, 4:S29-S38.
Robertson, M. and N. Hayden, (2008). Evaluation of a market in wetland credits: Entrepreneurial wetland banking in Chicago. Conservation Biology. 22:636-646.
Searcy, C.A. and H.B. Shaffer. (2008). Calculating biologically accurate mitigation credits: insights from the California tiger salamander. Conservation Biology. 22:997-1005.
U.S. Fish and Wildlife Service. (2003). Guidance for the Establishment, Use, and Operation of Conservation Banks. USFWS, Washington, DC Available from http://endangered.fws. gov/policies/conservation-banking.pdf (accessed November 2004).
22


![Cruzeiro ..[1]](https://static.fdocuments.us/doc/165x107/558df7931a28ab60348b4571/cruzeiro-1.jpg)