Can the magic of Abenomics succeed?
38
Highlights Abenomics is a unique policy combining short and mid to long term policies and supply and demand programmes. Exiting deflation has been prioritized. Domestic and external factors have impacted CPI negatively from FY 2014, but moderate inflationary pressure is building up in the Japanese economy. Abenomics has not yet achieved its stable 2% real growth target, but nominal and real growth rate since the FY 2013 exceeds those of the FY 2002-2012 period. As Shinzo Abe’s growth policy will take 5 to 10 years to be fully implemented, Abenomics should succeed provided Abe’s successors have the political will to continue pursuing it. Can the magic of Abenomics succeed? No 2015-24 – December Working Paper Evelyne Dourille-Feer
Transcript of Can the magic of Abenomics succeed?

Highlights
Abenomics is a unique policy combining short and mid to long term policies and supply and demand programmes.
Exiting deflation has been prioritized. Domestic and external factors have impacted CPI negatively from FY 2014, but moderate inflationary pressure is building up in the Japanese economy.
Abenomics has not yet achieved its stable 2% real growth target, but nominal and real growth rate since the FY 2013 exceeds those of the FY 2002-2012 period.
As Shinzo Abe’s growth policy will take 5 to 10 years to be fully implemented, Abenomics should succeed provided Abe’s successors have the political will to continue pursuing it.
Can the magic of Abenomics succeed?
No 2015-24 – December Working Paper
Evelyne Dourille-Feer

CEPII Working Paper Can the magic of Abenomics succeed?
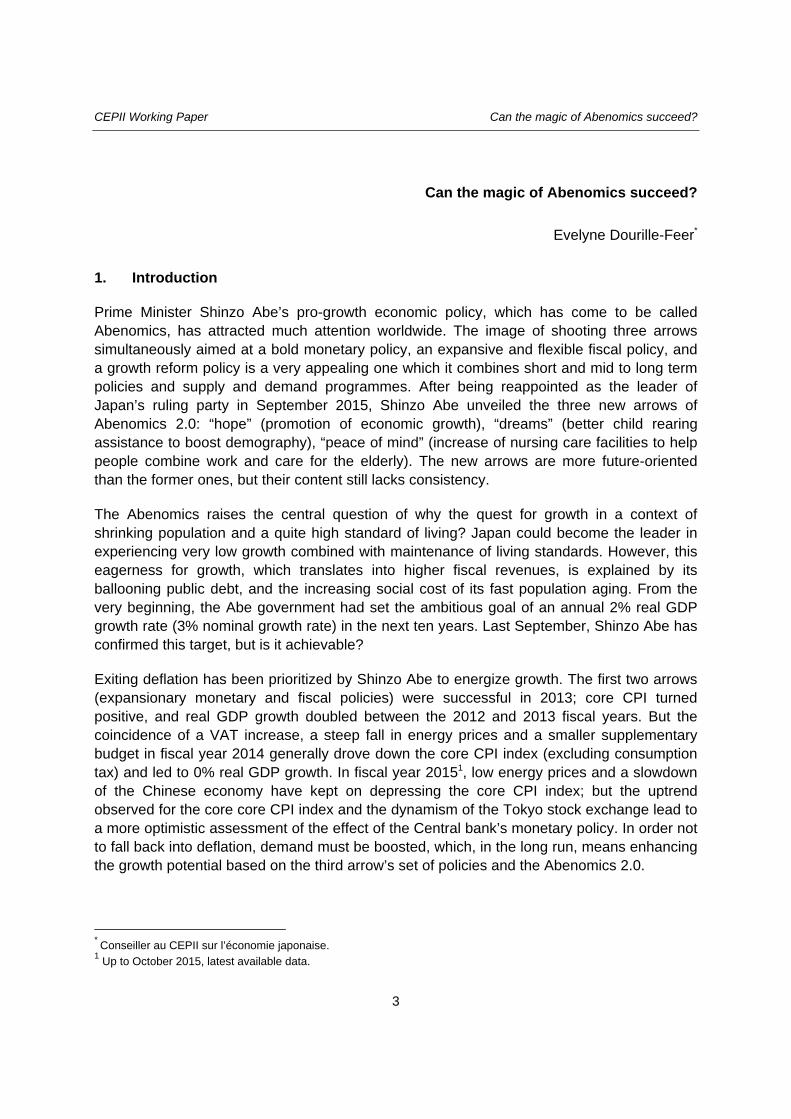
Abstract Prime Minister Shinzo Abe’s pro-growth economic policy, dubbed Abenomics, combines monetary policy and fiscal policy as well as growth reforms. It has attracted much attention worldwide because it combines short and mid to long term policies, and supply and demand programmes. The quest for growth is explained by its ballooning public debt and the increasing social cost of its fast population aging. Exiting deflation has been prioritized by Shinzo Abe to energize growth.Abenomics raises the central question of why the quest for growth in a context of shrinking population and a quite high standard of living? However, this eagerness for growth, which translates into higher fiscal revenues, is explained by its ballooning public debt, and the increasing social cost of its fast population aging. The Abe government has set the ambitious goal of an annual 2% real GDP growth rate. The first two arrows (expansionary monetary and fiscal policies) were successful in 2013. But, in the 2014 fiscal year, the coincidence of a VAT increase, a steep fall in energy prices and a smaller supplementary budget generally drove down the CPI index (excluding consumption tax) and led to zero growth of real GDP and, in the 2015 fiscal year, the developments of CPI and growth were disappointing. In order not to fall back into deflation, demand must be boosted. Shinzo Abe is betting on institutional and technological innovations to foster economic growth in the long run. Abenomics will work its magic if Shinzo Abe has sufficient time and sufficient political strength to fully implement his third policy arrow.
KeywordsGrowth, Macroeconomic policy, Deflation, Innovation.
JELO40, E61, E31, O38.
CEPII (Centre d’Etudes Prospectives et d’Informations Internationales) is a French institute dedicated to producing independent, policy-oriented economic research helpful to understand the international economic environment and challenges in the areas of trade policy, competitiveness, macroeconomics, international finance and growth.
CEPII Working PaperContributing to research in international economics
© CEPII, PARIS, 2015
All rights reserved. Opinions expressed in this publication are those of the author(s) alone.
Editorial Director: Sébastien Jean
Production: Laure Boivin
No ISSN: 1293-2574
CEPII113, rue de Grenelle75007 Paris+33 1 53 68 55 00
www.cepii.frPress contact: [email protected]
Working Paper
CEPII Working Paper Can the magic of Abenomics succeed?
3
Can the magic of Abenomics succeed?
Evelyne Dourille-Feer*
1. Introduction
Prime Minister Shinzo Abe’s pro-growth economic policy, which has come to be called Abenomics, has attracted much attention worldwide. The image of shooting three arrows simultaneously aimed at a bold monetary policy, an expansive and flexible fiscal policy, and a growth reform policy is a very appealing one which it combines short and mid to long term policies and supply and demand programmes. After being reappointed as the leader of Japan’s ruling party in September 2015, Shinzo Abe unveiled the three new arrows of Abenomics 2.0: “hope” (promotion of economic growth), “dreams” (better child rearing assistance to boost demography), “peace of mind” (increase of nursing care facilities to help people combine work and care for the elderly). The new arrows are more future-oriented than the former ones, but their content still lacks consistency.
The Abenomics raises the central question of why the quest for growth in a context of shrinking population and a quite high standard of living? Japan could become the leader in experiencing very low growth combined with maintenance of living standards. However, this eagerness for growth, which translates into higher fiscal revenues, is explained by its ballooning public debt, and the increasing social cost of its fast population aging. From the very beginning, the Abe government had set the ambitious goal of an annual 2% real GDP growth rate (3% nominal growth rate) in the next ten years. Last September, Shinzo Abe has confirmed this target, but is it achievable?
Exiting deflation has been prioritized by Shinzo Abe to energize growth. The first two arrows (expansionary monetary and fiscal policies) were successful in 2013; core CPI turned positive, and real GDP growth doubled between the 2012 and 2013 fiscal years. But the coincidence of a VAT increase, a steep fall in energy prices and a smaller supplementary budget in fiscal year 2014 generally drove down the core CPI index (excluding consumption tax) and led to 0% real GDP growth. In fiscal year 20151, low energy prices and a slowdown of the Chinese economy have kept on depressing the core CPI index; but the uptrend observed for the core core CPI index and the dynamism of the Tokyo stock exchange lead to a more optimistic assessment of the effect of the Central bank’s monetary policy. In order not to fall back into deflation, demand must be boosted, which, in the long run, means enhancing the growth potential based on the third arrow’s set of policies and the Abenomics 2.0.
* Conseiller au CEPII sur l’économie japonaise.
1 Up to October 2015, latest available data.
CEPII Working Paper Can the magic of Abenomics succeed?
4
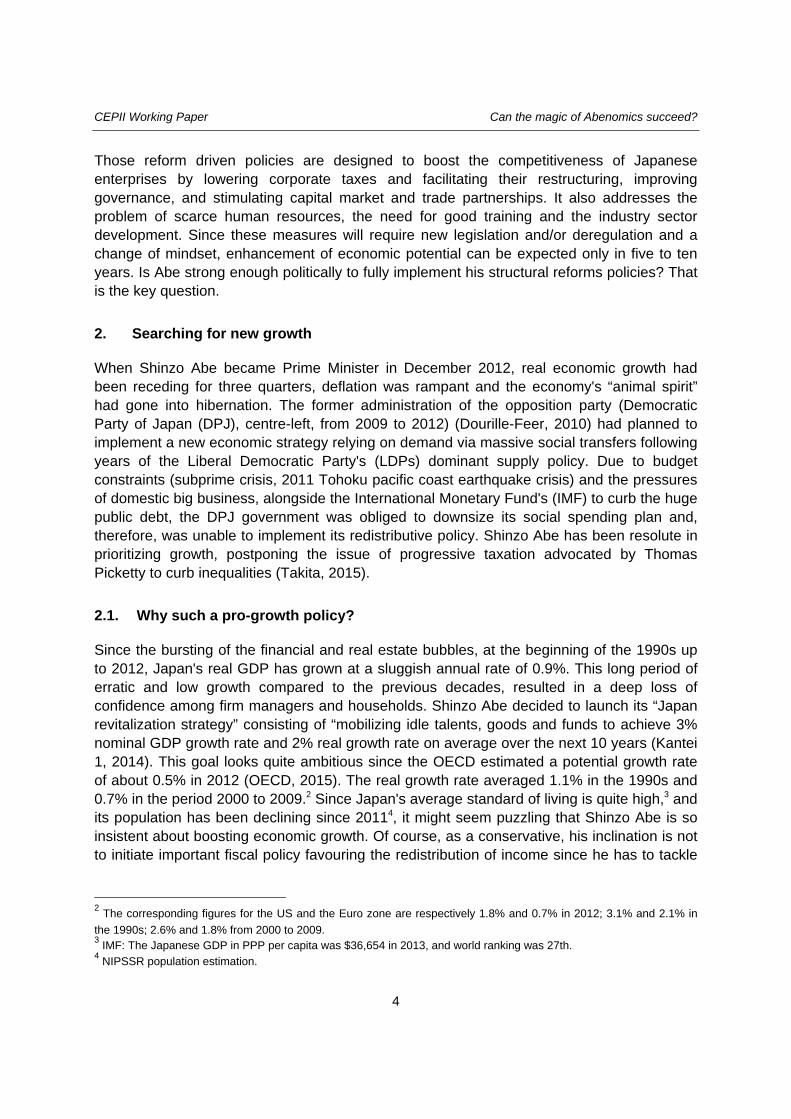
Those reform driven policies are designed to boost the competitiveness of Japanese enterprises by lowering corporate taxes and facilitating their restructuring, improving governance, and stimulating capital market and trade partnerships. It also addresses the problem of scarce human resources, the need for good training and the industry sector development. Since these measures will require new legislation and/or deregulation and a change of mindset, enhancement of economic potential can be expected only in five to ten years. Is Abe strong enough politically to fully implement his structural reforms policies? That is the key question.
2. Searching for new growth
When Shinzo Abe became Prime Minister in December 2012, real economic growth had been receding for three quarters, deflation was rampant and the economy's “animal spirit” had gone into hibernation. The former administration of the opposition party (Democratic Party of Japan (DPJ), centre-left, from 2009 to 2012) (Dourille-Feer, 2010) had planned to implement a new economic strategy relying on demand via massive social transfers following years of the Liberal Democratic Party's (LDPs) dominant supply policy. Due to budget constraints (subprime crisis, 2011 Tohoku pacific coast earthquake crisis) and the pressures of domestic big business, alongside the International Monetary Fund's (IMF) to curb the huge public debt, the DPJ government was obliged to downsize its social spending plan and, therefore, was unable to implement its redistributive policy. Shinzo Abe has been resolute in prioritizing growth, postponing the issue of progressive taxation advocated by Thomas Picketty to curb inequalities (Takita, 2015).
2.1. Why such a pro-growth policy?
Since the bursting of the financial and real estate bubbles, at the beginning of the 1990s up to 2012, Japan's real GDP has grown at a sluggish annual rate of 0.9%. This long period of erratic and low growth compared to the previous decades, resulted in a deep loss of confidence among firm managers and households. Shinzo Abe decided to launch its “Japan revitalization strategy” consisting of “mobilizing idle talents, goods and funds to achieve 3% nominal GDP growth rate and 2% real growth rate on average over the next 10 years (Kantei 1, 2014). This goal looks quite ambitious since the OECD estimated a potential growth rate of about 0.5% in 2012 (OECD, 2015). The real growth rate averaged 1.1% in the 1990s and 0.7% in the period 2000 to 2009.2 Since Japan's average standard of living is quite high,3 and its population has been declining since 20114, it might seem puzzling that Shinzo Abe is so insistent about boosting economic growth. Of course, as a conservative, his inclination is not to initiate important fiscal policy favouring the redistribution of income since he has to tackle
2 The corresponding figures for the US and the Euro zone are respectively 1.8% and 0.7% in 2012; 3.1% and 2.1% in
the 1990s; 2.6% and 1.8% from 2000 to 2009. 3 IMF: The Japanese GDP in PPP per capita was $36,654 in 2013, and world ranking was 27th.
4 NIPSSR population estimation.
CEPII Working Paper Can the magic of Abenomics succeed?
5
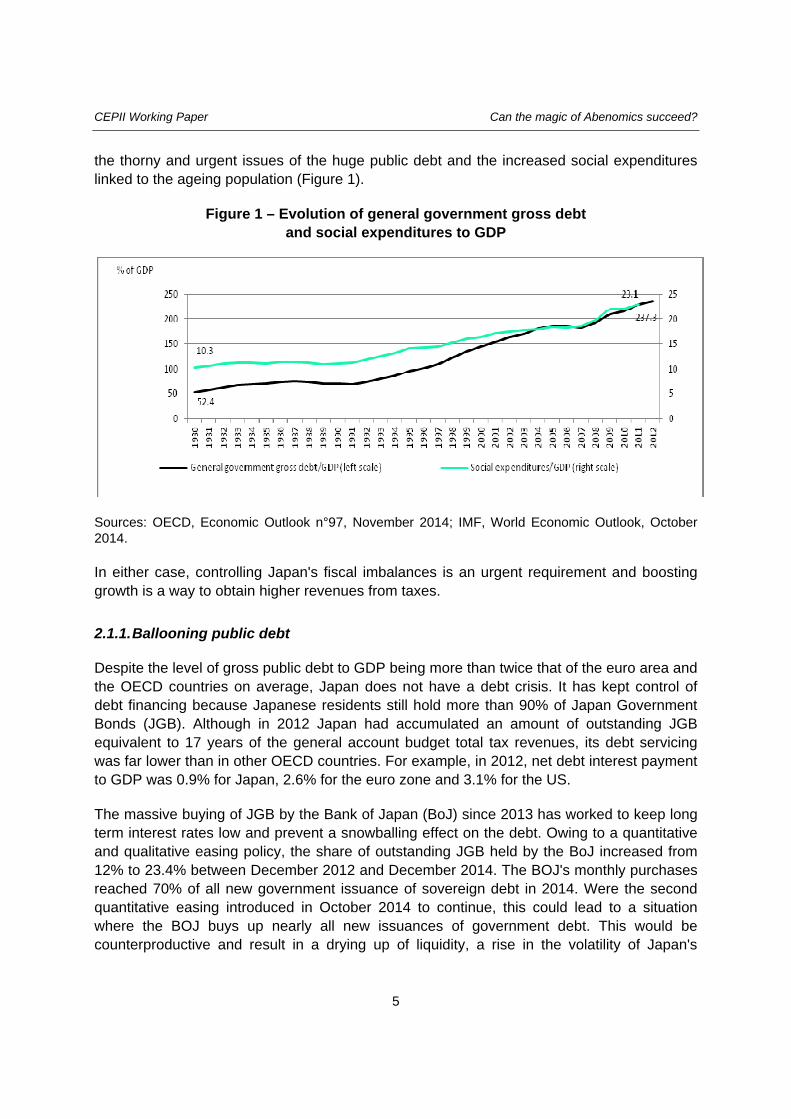
the thorny and urgent issues of the huge public debt and the increased social expenditures linked to the ageing population (Figure 1).
Figure 1 – Evolution of general government gross debt and social expenditures to GDP
Sources: OECD, Economic Outlook n°97, November 2014; IMF, World Economic Outlook, October 2014.
In either case, controlling Japan's fiscal imbalances is an urgent requirement and boosting growth is a way to obtain higher revenues from taxes.
2.1.1. Ballooning public debt
Despite the level of gross public debt to GDP being more than twice that of the euro area and the OECD countries on average, Japan does not have a debt crisis. It has kept control of debt financing because Japanese residents still hold more than 90% of Japan Government Bonds (JGB). Although in 2012 Japan had accumulated an amount of outstanding JGB equivalent to 17 years of the general account budget total tax revenues, its debt servicing was far lower than in other OECD countries. For example, in 2012, net debt interest payment to GDP was 0.9% for Japan, 2.6% for the euro zone and 3.1% for the US.
The massive buying of JGB by the Bank of Japan (BoJ) since 2013 has worked to keep long term interest rates low and prevent a snowballing effect on the debt. Owing to a quantitative and qualitative easing policy, the share of outstanding JGB held by the BoJ increased from 12% to 23.4% between December 2012 and December 2014. The BOJ's monthly purchases reached 70% of all new government issuance of sovereign debt in 2014. Were the second quantitative easing introduced in October 2014 to continue, this could lead to a situation where the BOJ buys up nearly all new issuances of government debt. This would be counterproductive and result in a drying up of liquidity, a rise in the volatility of Japan's

CEPII Working Paper Can the magic of Abenomics succeed?
6
sovereign debt market, and loss of credibility in the financial soundness of the BOJ’s balance sheet because of JGB overload. The limits to this policy of quantitative easing would result in loss of control of the debt financing when the current account balance turns negative; in 2014 the current account surplus was just 0.5% of GDP. Time is ticking away... Due to the ageing in Japan's population, savings rate will decline in the future. However, in 2012, Japan had accumulated a huge amount of external assets making it the top creditor nation with $3.4 trillion ahead of China with $1.7 trillion, and a stock of household net financial wealth which reached 419% of GDP (OECD, 2015).
Japan's gross public debt should be stabilized as a matter of urgency since its increasing size is making it more and more difficult to manage. The 1990’s crisis triggered a steep increase to 144 % of GDP in 20005 which was exacerbated by the subprime crisis and the Tohoku earthquake, resulting in a level of 237% of GDP in 2012.6 This huge level of public debt stems from a fall in budget revenues rather than an increase in fiscal expenditure. Between 1991 and 2001, Japanese central budget expenditures grew annually at an average of +1.9% while fiscal revenues tumbled by -2.2% a year due to economic sluggishness and cuts in direct tax rates since the 1980s. Despite an expansionary budget policy during the crisis period, Japan's public expenditure to GDP ratio was much lower in 2012 (43.2%) than in the euro zone (50%) and close to the level in the US (40.3%) (Dourille, 2014/2).
A major crash of Japanese debt is unlikely, but deflating its stock will not only take a long time but also the help of inflation. A study by Fujitsu (Schultz, 2015) underlines that Japanese public debt “reflects a shift of spending power from private sector to public sector” as “if taxes have been raised”. For decades, governments have avoided imposing painful adjustments on households and private firms by allowing debt to continue to grow. However, this trend must be halted; in 2015, debt servicing is accounting for more than 24% of general account expenditure despite very low interest rates. The first step to solving this problem is to bridge budget deficits. This could be achieved by raising tax revenues through growth and reform of the tax system, and cutting public expenses through social security reforms. Boosting tax revenues through growth (rather than cutting expenses) is the solution favoured by the Japan's Cabinet. However, in its most optimistic economic revitalization scenario of real economic growth and inflation both reaching 2% in the medium to long term, the ratio of debt to nominal GDP diminishes from 197% to approximately 187% between 2014 and 2020 and remains around that level up to 2023 (Cabinet office, 2015). It is clear that more efforts will be needed to reduce the debt to GDP ratio.
2.1.2. Rising social protection costs
Japan has the oldest population in the world (Figure 2). Japan's populating ageing has been particularly fast since in the early 1990s, when Japan had the youngest population among the developed countries. There are various factors that have contributed to this rapid ageing
5 The ratio of Gross public debt to GDP was 69% in 1990.
6 Source: IMF.

CEPII Working Paper Can the magic of Abenomics succeed?
7
process including the rapid reduction in fertility rates following the post-war baby boom (1947-1949- from 4.54 to 4.32 children per woman), the sharp decrease in mortality rates, and a very high life expectancy. This last has various implications for the economy and, especially, social security spending since the share of those aged 75 and over is increasing sharply (Figure 3).
Figure 2: Share of aged 65 and over in tota
Figure 3 Share of seniors in total population population of Japan
Source: OECD, population statistics. Source: UN, World population prospects, revised 2012.
Total social security spending has jumped from 17.5% to around 31.8% of central government expenditure between the 1990 and 2014 Fiscal Years (FYs).7 This is equivalent to an annual increase of about JY800 billion. In 2014, pensions and health care8 accounted for 81% of total social security expenditure.
According to Ministry of Health Labour and Welfare projections,9 factoring in a nominal annual 2% GDP growth for 2012 to 2025, the rate of increase in the pension benefits should slow to 1% per year, but spending on medical and the long-term care could register annual growth rates exceeding annual GDP growth, at respectively 3.4% and 7%. For example, in 2011, the proportion of Japanese seniors (75 years and older) in the total population was 12% of the total population, this population accounted for 34% of national medical care expenditure and 88% of spending on long-term care. Not only will the social security system have to be redesigned but also more funds will be needed.
7 Fiscal year starts April 1st of the calendar year and ends March 31st the next calendar year.
8 Including Long Term Care Insurance.
9 Ministry of Finance, Fiscal Fact Sheet, 2014.

CEPII Working Paper Can the magic of Abenomics succeed?
8
The doubling of the consumption tax rate, from 5% to 10% between 2013 and 2017, will provide some additional funds. The revenue from consumption tax will go to fund expenditure on state pensions, medical care, long-term care and child care. Most of this expenditure is crucial to securing a decent life for the oldest in the population who are the most affected by income inequality. In 2007, the poverty rate10 among those aged 75 and over was 25.4% in Japan versus 16.1% on average in the OECD countries and 14.9% for the whole Japanese population.
2.1.3. Drop in the GDP growth trend
Up to the early 1990s, when Japan was ranked second for economic power based on GDP size, it experienced astonishingly high economic growth rates compared to other developed countries. Following the post-war reconstruction period, the Japanese economy entered a catch up process. By the 1960s, it had become a strong industrial power; by the late 1970s, it had turned into a major commercial power and by the late 1980s, it had achieved world class financial power, artificially boosted by speculative bubbles. For more than forty years, economic growth was able to rely on dynamic investment and strong household consumption or strong exports depending on the time period. Since the 1990s up to 2012, the average GDP growth rate has decelerated, decade by decade, and become somewhat erratic. This raises two central questions: What are the missing engines of growth? Are GDP growth rates a relevant measure to evaluate the performance of the Japanese economy in the last few decades?
2.1.4. GDP growth rate dynamic broken since the 1990s
In the period 1990 to 2012, Japan suffered several huge shocks such as the collapse in asset prices at the beginning of the 1990s, the collapse in world trade linked to the subprime crisis in 2008-2009 and the Tohoku earthquake in 2011. Compared to the 1980s, growth in private demand fell, public demand have weakened from the end of the 1990’s and exports dynamic was rather flat except during the economic upturn of 2003 to 2007 (Figure 4).
All of these factors combined explain why the annual real GDP growth rate has fallen from 4.6% in the 1980s, to 1.1% in the 1990s and 0.7% from 2000 to 2012. Nevertheless, from 2002 to 2007, the annual growth rate of real GDP has reached 1.8%. It shows how negative have been the subprime and Tohoku earthquake crisis, but also that the Japanese economy can also deliver higher growth rates than those of the past decade average.
10
Share of people living on less than half of the median income.

CEPII Working Paper Can the magic of Abenomics succeed?
9
Figure 4: Real GDP growth rate, contribution to growth of domestic demand, public demand and exports from 1981 to 2014
Source: ESRI SNA: from 1981 to 1994, 93 SNA, benchmark year = 1995; from1995 to 2015: 93 SNA, benchmark year = 2005, 2013-2014: SNA December 2015.
Note: calendar year.
2.1.5. A stable 2% real GDP growth, difficult to achieve
Data for the calendar year 2013 show that government's target of real GDP growth of 1.6% was almost achieved, but it shows also that this indicator is still below the 1.7% registered in 2012. The FY data,11 on which all Japanese official projections are based, show that real GDP growth outstrips the government target and reaches more than twice the level in FY 2012. This underlines the real success of Abenomics. Strong household consumption and private non-residential investment, boosted by the prospect of an increase in the VAT rate, combined with stronger public demand, contributed to the good economic outcome in 2013 (Table 1).
Table 1: Japan's real and nominal GDP growth rate for calendar and fiscal years
2012 2013 2014 2015 2016 2016-20 2021-25
Real GDP growth rate
Calendar year
1.7 1.4 -0.0 0,6 1.0 ND ND
Fiscal year 0.9 2.0 -1.0 0.9 1.0 1.8 1.4
Nominal GDP growth rate
Calendar year
0.8 0.8 1.6 2.9 1.9 ND ND
Fiscal year 0.0 1.7 1.5 2.2 1.5 1.9 1.4
Sources: ESRI December 2015 (2012-14: calendar, 2012-14: FY); JRI November 2015 (in Japanese) (2015-2016: FY); JCER March 2015 (2016-20, 2021-25: calendar and fiscal, reform scenario,); OECD, EO 98 November 2015 (2015, 2016: calendar year, real and nominal).
Note: estimates starts in calendar year 2015 and FY 2015.
11
Fiscal year 2013: April 1st 2013 to end March 2014.
4,2 3,4 3,14,5
6,3
2,84,1
7,15,4 5,6
3,3
0,8 0,20,91,9 2,6
1,6
‐2,0‐0,2
2,30,4 0,3
1,7 2,41,3 1,7 2,2
‐1,0
‐5,5
4,7
‐0,5
1,7 1,4
0,0
‐10
‐5
0
5
10
1981
1982
1983
1984
1985
1986
1987
1988
1989
1990
1991
1992
1993
1994
1995
1996
1997
1998
1999
2000
2001
2002
2003
2004
2005
2006
2007
2008
2009
2010
2011
2012
2013
2014
Private demand Public demand Exports PIB réel
%

CEPII Working Paper Can the magic of Abenomics succeed?
10
However, the April 2014 VAT increase has had devastating effects on domestic demand because the rise in real wages was not strong enough to alleviate the VAT shock. Business investors remained cautious because external demand was also uncertain. Furthermore, the increase in public investment was weak, and the contribution of net exports to growth was negative. During the calendar year 2014, despite three quarters of growth contraction, real GDP stayed almost flat owing to the dynamic pre-VAT first quarter. FY 2014 data show a contraction in the real GDP growth since the positive effect of the pre-VAT period was included in the previous FY (Table 1). After, the 2014 “annus horribilis”, a weak economic recovery is expected in 2015 and 2016. This forecast upturn is based mostly on private demand since public investment could decelerate and the contribution to growth of net exports will be weak or slightly negative.
Compared to the 1980s, the economic growth rate has slowed sharply in succeeding decades. However, it is not relevant to measure Japan's economic performance based only on its GDP size since its demographic profile is very specific.
2.1.6. Performance depends on gauge
The evolution in the real GDP per capita indexes for Japan and the US between 1980 and 2013 shows that Japan outperformed the US from the late 1980s to the late 1990s. After that time, the trend in these indexes was mostly in line except in 2009, and was the same in both countries in 2013 (Figure 5).
Figure 5: Evolution of real and nominal GDP per capita index in Japan and in the United States from 1980 to 2013
Source: IMF, WEO, October 2014.
Note: Local currency. Estimates starts after 2012 for the United-States and after 2013 for Japan.
CEPII Working Paper Can the magic of Abenomics succeed?
11
One explanation for this is the very different demographic profiles of these countries. While in 2000 to 2013, the working age population shrank by 8.5% in Japan, it increased by 12.6% in the US. The deflationary trend in the Japanese economy since 1998 was also important as can be noticed in the right hand-side of Figure 5 based on the nominal GDP per capita index. From a starting index in 1980 twice as high as that in the US, Japan's index was well below its 2007 benchmark level in 2013.
Other economic indicators, such as income equality, life expectancy, unemployment, children’s education attainment and health investments show that Japan has fared much better than the US as Joseph Stiglitz (2013) and Paul Krugman (2014) have underlined. Nevertheless, in order to boost growth and growth potential for mitigating demographic issues and the debt problem, structural weaknesses need to be addressed. Since structural problems require a long term perspective, returning the Japanese economy to a stronger growth path as soon as possible, requires short term, effective monetary and fiscal policies.
3. Curbing deflation and boosting demand
Curbing deflation is Prime Minister Abe’s first priority based on his conviction that deflation is accountable for the loss of confidence among households and enterprises. Although the Japanese economy has registered only mild deflation of -0.3% per year on average from 1998 to 2012, this has impeded consumption and investment, and increased the private debt burden. This explains the ultra-loose monetary policy design to target 2% inflation in around 2 years, complemented by an expansive fiscal policy.
3.1. Origin and cause of deflation
Japanese deflation was triggered by a sharp monetary policy tightening, starting from spring 1989,12 which led to the bursting of the speculative bubbles. From 1991 to 1994, JY800 trillion of assets (1.7 times 1991 nominal GDP) were destroyed (Ozeki, 2008). This overwhelming assets shock impacted on the real economy on both demand and offer sides, and generated a banking crisis.
3.1.1. Weakening of private demand
With asset prices tumbling, the private sector - especially private firms – started to deleverage from the first half of the 1990s. The contraction in private demand led to disinflation up to 1994. This, in turn, has led to a vicious circle of deflation. From 1999 to 2012, deflation was firmly entrenched with core core Consumer Price Index (CPI) never positive, even during the 2003-2007 economic upturn (Figure 6).
12
The discount rate increased from 2.75% in May 1989 to 6% in August 1990. Also, credit was tightened.

CEPII Working Paper Can the magic of Abenomics succeed?
12
Figure 6: Private demand, output gap, core and core core CPI from 1989 to 2014
Sources : MIC, Statistics Bureau (CPI), SNA ESRI (private demand), IMF (Output gap)
Note: “Core core CPI” is the CPI index less food and energy
Sluggish domestic demand led to an increase in the output gap which depressed price levels. Although the output gap reduced and turned positive in 2007 thanks to the 2003-2007 economic upturn, it increased again as a result of the subprime crisis and the Tohoku earthquake crisis, and was still negative at the end of the period, which had a negative impact on prices.
3.1.2. Structural factors impeding supply
Structural factors also weakened the supply side. They curbed investment plans and wage increases. First, the sharp increase in the yen versus the dollar during September 1985 to August 1986 triggered a wave of relocation abroad of manufacturing plants in strong export sectors such as automobile and electronics. Second, the tough competition from the Asian and emerging countries since the 1990s, forced Japanese manufacturers to reduce their profit margins.
The1990s banking crisis penalized economic activity while weighting on deflationary trends. The doubling of bank credit volumes from 1985 to 1995, alongside poor assessment of risks, increased the banks' balance sheet bad debts after the bursting of the speculative bubbles, and resulted in a credit crunch in the late 1990s to the beginning of 2000s.13 The small and medium sized enterprises (SME) sector was strongly impacted. During this period, many enterprises tried to deleverage in order to avoid bankruptcy, and private business debt decreased from 148.3% to 104.5% of GDP between 1993 and 200314.
13
Economy was mostly impacted in 1997 and 1998.
14 Private business debt, except financial institutions. Source: BoJ, Flow of funds.
CEPII Working Paper Can the magic of Abenomics succeed?
13
3.1.3. Lessons from the past
During the 1990s and the 2008-2009 crises, fiscal policies, but not monetary policies, were implemented quickly. The Japanese CPI index was already negative when the zero interest rate policy was introduced in March 1999. The BoJ was a pioneer in the adoption of unconventional policies at the beginning of the 2000s,15 but their volume was low, and the inflation target was a mere 1% (Szcerbowicz, 2013) The BoJ measures were too late and too small and had no effect on inflation expectations, especially since business confidence and consumer’s sentiments had been eroded by the banking crisis and deflation.
Therefore, Shinzo Abe decided to implement strong measures as soon as possible. Convinced by his special economic adviser, Koichi Hamada, that monetary policies could be efficient under certain conditions, such as appropriate timing, large scale and additional back up from fiscal policies; Shinzo Abe put monetary policy at the top of his agenda.
3.2. The ultra expansive monetary policy and its outcomes
Shinzo Abe put strong pressure on the BoJ to increase its inflation target and introduce more monetary policy easing, which Governor Masaaki Shirakawa was resisting because he was not convinced that this would overcome deflation16. In January 2013, the BoJ Governor raised the price stability target from 1% to 2% and announced the start in 2014 of an open-ended asset buying policy. The uncollateralized overnight call rate was maintained at 0% to 0.1%. However, these measures did not satisfy the government and Masaaki Shirakawa resigned.
3.2.1. The new monetary policy
Unlike his predecessor, the new governor, Harukiko Kuroda, believed in the efficiency of a strong expansive monetary policy to fend off deflation17. In early April 2013, the BoJ policy board launched a massive quantitative and qualitative easing programme (QQE) to achieve a price stability target of 2% annually within about two years. This would allow a doubling of the monetary base and the amounts outstanding of JGBs and Exchange-Traded Funds (ETFs) within 2 years. That is, the monetary base should increase yearly by 60 to 70 trillion yen and the JGB purchases should reach the massive amount of about 50 trillion yen a year. The average remaining maturity of JGB purchases had also to climb from 3 years to about 7 years. The uncollateralized overnight call rate was maintained at 0 to 0.1 percent.
15
The unconventional policy measures (monetary base increase, buying of risky assets) were applied between 2001
and 2006 and between 2007 and 2013. 16
Shinzo Abe has even threatened to revise the BOJ law in order to suspend its independence temporarily. 17
The new Governor, Haruhiko Kuroda, was nominated by Prime Minister in late February 2013.

CEPII Working Paper Can the magic of Abenomics succeed?
14
As inflation trend had weakened since August 2014, a new QQE was decided by the BoJ on October 31st 2014. The BoJ would purchase JGBs at an annual rate of about JY80 trillion with remaining maturity extended to 10 years on average. The amount of the BOJ purchases of exchange-traded funds (ETFs) and Japan real estate investment trusts (J-REITs) would triple compared the previous QQE.
3.2.2. QQE policy outcomes
The three main expected effects from such an ultra expansionary monetary policy were a decrease in real long term interest rates, an upsurge in stock exchange values based on the rebalancing of domestic investors’ portfolios, and an increase in inflation expectations. The side effect of this policy was a yen exchange rate depreciation. Taken together, these effects should lead to an increase in the CPI. So far, the expectations about long term interest rates and yen depreciation have been fulfilled but the anchor of inflation expectations still needs to be improved (Kamada, Nakajima, Nishiguchi, 2015). Rebalancing of the domestic investors’ portfolio is still outstanding.
Figure 7: Real and nominal 10 Y interest rates Figure 8: Japan stock market (Nikkei 225)
Source: Thomson Datastream. Source: Nikkei Industry Research Institute.
Note: Nikkei 225 weekly index; April 6 2012 to November 20 2015

CEPII Working Paper Can the magic of Abenomics succeed?
15
Real long term interest rates (Figure 7) and the stock market index (Figure 8) reacted quickly to the new monetary policy. The stock market improvement came mostly from foreign investors.18 After a temporary retreat linked to the increased VAT, the stock market resumed its rising trend until summer 2015, when the weakness of Chinese economy and uncertain US interest rate made it retreat again until early October 2015. But foreign investors were still the most active in late 2015.
According to the Economists' Consensus Forecast for the six to ten years ahead, inflation expectations have improved since the launch of the first QQE, rising from about 0.8% in October 2012 to above 1.5% in July 2015. But, some indicators have shown relatively weaker developments since summer 201519 and the long term inflation expectations do not match the 2% inflation targeted by the Bank of Japan.
One of the expected positive fallouts from QQE was the easier access to credit for companies. The BoJ Tankan surveys show that the attitude of financial institutions towards lending has become progressively more favourable. This easier access to credit was expected to increase private investments sharply. The FY 2012 to 2014 surveys as well as the forecast surveys for FY 2015 underline a gradual increase in software and fixed investments (excluding land purchases), but the amount of investment is generally far below government's expectations because of uncertainties and sluggish demand.
The BoJ chose “core CPI” as the benchmark for measuring inflation until summer 2015. Since July 2015, BoJ is also using a new index: the CPI less fresh food and energy (Bruten, 2015). In FY 2013 (April 2013 to end March 2014), core CPI increased by 0.8%. This was better than the 0.7% forecast by the BOJ in May 2013. The less volatile core CPI less energy turned positive in October 2013 and continued to rise until February 2014 (Figure 9).
According to BoJ economists, one of the reasons why price trends showed such good and rapid results, was that the relationship between the economy and prices driven by a tighter labour market, changed between the period 1997-2012 (deflation period) and 201320 (Matsuo, 2014). During the first period, the slope of the Philips curve21 is moderate, which means that the decrease in the unemployment rate had a very weak effect on prices. In the second period, the slope of the curve is steeper; Abenomics raised people's expectations of future inflation and changed the relationship between prices and the unemployment rate. However, other factors – domestic or external - have changed things again.
18
Tokyo Stock Exchange, Trading by Type of Investors, http://www.jpx.co.jp/english/markets/statistics-equities/monthly/b5b4pj000000t1f1-att/09_t-kabu1510. 19
Bank of Japan, Monthly Report of Recent Economic and Financial Developments, November 24, 2015. 20
1997-2012 and 2013: fiscal years. 21
The Philips curve indicates the relationship between prices and the unemployment rate.

CEPII Working Paper Can the magic of Abenomics succeed?
16
Figure 9: Core CPI index, core CPI index less VAT effect ,CPI less fresh food & energy index less VAT effect (year on year)
Source: MIC, Statistics Bureau.
Note: “Core CPI”: CPI excluding fresh food.
The VAT increase has already provoked some turbulence in prices. Although both CPI indexes (core CPI and core CPI less energy) jumped to above the 2% inflation target following the introduction of an 8% VAT rate, core CPI began to lose momentum after August 2014. However, in April to July 2014, the core CPI less VAT effect was almost stable but started to decline thereafter. The core CPI less energy index less VAT effect remained quite flat after the VAT increase and has started to increase since March 2015. The decrease in oil prices since June 2014 explains most of the divergent evolutions of the two CPI indexes. The prospect of long lasting low oil prices motivated the BoJ to launch a second QQE policy in late October 2014. If its 2% inflation target is to be met in early 201722, additional easing cannot be ruled out, especially if weakness of overseas demand persists long enough to undermine business confidence.
The expansionary monetary policy has not only weakened the yen, decreased long-term interest rates, boosted the stock prices; it has also raised inflation expectations and lifted the core CPI less energy index. In the long run, domestic demand will be too weak to sustain prices without strong wage increases and dynamic private investments. External demand can also sustain the domestic one.
22
In October 30 2015, The Bank of Japan postponed its forecast for reaching its 2 percent inflation target from the six
months through September 2016 to the six months through March 2017.

CEPII Working Paper Can the magic of Abenomics succeed?
17
3.2.3. Weak exports
A strong upsurge in exports was expected after the sharp yen depreciation to the dollar, the euro and the won (-30% on average from December 2012 to December 2014), but this has been disappointing. The value of exports has increased +9.5% in 2013 and +4.8% in 2014,23 but their volume decreased by 1.9% in 2013 and increased by only 1.6% in 2014,24 lower than the level in 2010. In 2015, the year on year value of monthly exports has kept on increasing until September, although it has been losing momentum since July. In October, the value of monthly exports declined by more than 2% year on year because of falling exports to China and the United-States.
Nevertheless, the monthly real export index compiled by the Bank of Japan shows that exports may be starting to recover as this index has steadily increased from June to October 2015. But this recovery is still not strong enough to compensate for the decline registered between January and May.
Although there has been some sluggish global trading activity, Japanese trade has been hampered by the relocation abroad of its automotive and electronics sectors. Also, Japanese enterprises have lost competitiveness in information technology (IT) to Asian counterparts (too many domestic companies, not enough innovation). Global fixed investment has also been weak. Factors such as local currency pricing with sticky prices in that currency allowing for better profit margins and weak price elasticity of high-end products are additional explanations for the low pass-through from exchange rates into export prices. In addition, a Federal Reserve Bank of New-York study (Matsuo, 2014) shows that large exporters are also large importers, so they face offsetting effects of the exchange rate on their marginal cost.
The strong deterioration in the 2013 trade balance comes from the import side, and the combination of a weak yen and high energy raw materials prices (Figure 10). The sharp drop in oil prices since June 2014 has cut the import bill, but it has not prevented the trade deficit value to keep on growing in 2014. During the first half of FY 2015, the trade deficit has shrunk compared to the first half of 2014; the decrease of the value of imports (-5.5%) being slightly bigger than the increase of the value of exports (+5%).
According to the IMF25, the average crude oil spot price could stay below $66 up to 2018 compared to $104 in 2013; this should help reducing the trade deficit. But, on the export side, the positive effect of a weak yen has been largely offset by the lack of dynamism in global trade (Nakajima, 2014), which is likely to persist in 2016...
23
Exports in yen, calendar year. Source: Ministry of Finance, March 2015.
24 BoJ; real exports statistics, April 2015.
25 Source: IMF Commodity Price Forecasts, June 2015.

CEPII Working Paper Can the magic of Abenomics succeed?
18
Figure 10: Japanese trade balance FY 2010-2015 (first half = H1)
Source: Ministry of Finance, trade statistics, fiscal year, Japan.
3.3. Fiscal boost
Although during the 1990s and the 2008-2009 crisis, many economic packages were implemented to fuel growth, their boosting effect has not been as strong as expected because the additional new spending and tax cuts (or “real water”) have been small and irregular. Shinzo Abe's keenness to energize economic growth quickly was behind his decision to introduce a strong fiscal policy in 2013, followed by less stringent policies since fiscal rehabilitation was also part of his agenda.
3.3.1. Downsizing of fiscal policy in 2013 to autumn 2015
In order to invigorate economic growth, the Abe government designed a fiscal policy that would be in place for 15 months and would include a supplementary budget and the central government budget (January 2013 to 1 April 2014, January 2014 to 1 April 2015, January 2015 to 1 April 2016).
During the first two years of the Abe administration, large supplementary budgets and important new budgets were introduced. In 2013, the economic package assumed particular importance since, implementation of the reform policy relied on the LDP winning the summer upper house election and voting in many new laws. The economic package was the most massive since 2009, and its quick effect on the economy relied upon public works (Table 2).
The evolution of the supplementary budgets shows that their amount and share of GDP have been decreasing between 2013 and 2014. But, in 2015, the new extra budget announced in October 30 is reversing this trend. The decision to launch a second extra budget in 2015 results from the weakening of core CPI and the lack of dynamism of economic activity, the negative impact of China’s slowdown on production and exports, the eventuality of a negative impact on agriculture as the country prepares to join the trans-Pacific trade pact and

CEPII Working Paper Can the magic of Abenomics succeed?
19
the necessity to pave the way for future by increasing nursing facilities. The value of central government budget expenses has been rising year by year, although its increasing rate tumbled in 2015.
Table 2: Evolution of central government budget expenses and debt from 2013 to 2015
Trillion
yen
Supplementary
budget
A
Central government
budget
(%, FY, YoY increase)
B (1) (4)
Total central government
expenses
(initial budget + supplementary
budget)
A + B (2)
2013 10.3 (2% of GDP) (3) 92.6 (+ 2.5%) 102.9
2014 5.5 (1% of GDP) (4) 95.9 (+3.5%) 101.4 (-1.5)
2015 3.5 (0.7% of GDP) (5)
(over 3.0)(6)
(Total : over 6.5, > 1.3% GDP)(7)
96.3 (+0.5%) 99.8 (-1.5)
(over 102,8)(over +1,4)
Source: Ministry of Finance, budget statistics.
Note: (1) FYs, (2) 15 month period: January to end March (year after). (3) Imputed to FY 2012, (4) Imputed to FY 2013, (5) Imputed to FY 2014, (6) Extra budget announced by the government on October 30th 2015, (7) Total of the 2 supplementary budgets.
An analysis of the contribution of public investment and public consumption to economic growth hints at the effects of fiscal policy on growth. Of course, there are also many indirect spinoffs from expansionary fiscal policies such as job creation, innovation increment, and enhancement of private enterprise productivity through new public infrastructures. The national account quarterly statistics for the individual contributions to growth in 2013 to 2015, show differences in the rates of the contribution from public investment and government consumption, depending on the quarter (Figure 11)
As the public work component was an important part of the supplementary budget and the central government budget in 2013, public investment had the effect of boosting growth up to the third quarter when household consumption was weakening. In contrast, the positive effect of the supplementary budget and the large central budget completely disappeared from Q4 2013 to Q2 2014 while private investment expenses, anticipating the VAT increase, had a pulling effect on the economy from Q4 2013 to Q1 2014. In Q3 and Q4 2014, the pulling effect of fiscal policy was insufficient to compensate for the weak household consumption and the contraction or the freeze of private investment expenses. During the first and third quarter of 2015, public demand was also weak.

CEPII Working Paper Can the magic of Abenomics succeed?
20
Figure 11 Contribution of public and private demand to quarterly real GDP growth in Japan from Q1 2013 to Q3 2015
Source: ESRI, SNA, December 2015
Overall, the expansionary fiscal policy was quite effective during 2013 and worked to add 0.7 points to GDP growth, an impetus not seen since 2009. Its weaker effect in 2014 (adding 0.1 points to GDP growth), especially in the public investment sector, underlines the smaller size of the economic package and bottlenecks in the supply of manpower and materials which impeded public works projects. The government was expecting an upturn in private demand in 2015 that would compensate for a weaker fiscal policy. But, despite their high level of profits and cash reserves26, firms have been cautious about investing and raising base wage because of the unclear prospects of external demand (slowdown of the Chinese economy) and of domestic demand. As the weakness of the Japanese economy has been mirrored by a technical recession in 2015 (contraction of the GDP in Q2 and Q3), the Japanese government has decided in late October to compile a supplementary budget of more than 3 trillion yen (23 billion euro), reversing the downward trend of total central government outlays.
3.3.2. Fiscal rehabilitation policy
Shinzo Abe's fiscal policy is also aimed at rehabilitating public finance in the long run. The first task was to put an end to the situation that had existed since 2010, where the amount of government bond issuances was greater than the tax revenues. The first round of VAT increases in April 2014 was a step towards fiscal rehabilitation. It was implemented as scheduled, but the second increase from 8% to 10% was postponed to April 201727. The
26
Roughly 350 trillion yen were held by companies at the end of 2014, “Abe to call for supplementary budget topping 3 tn yen”, Nikkei Asian review, November 17, 2015 27
It was initially planned for October 2015.
10,8
0.5
‐0.2
1,2
‐1,9
‐0,7
0.31,1
‐0,10,3
‐4
‐3
‐2
‐1
0
1
2
3
2013 QI 2013 Q2 2013 Q3 2013 Q4 2014 Q1 2014 Q2 2014 Q3 2014 Q4 2015 Q1 2015 Q2 2015 Q3
Public investment Government consumption Household consumption
Non residentiel investment GDP
%, points of GDP

CEPII Working Paper Can the magic of Abenomics succeed?
21
heavy blow inflicted on the economy from the first VAT increase meant that a second shock following so soon, risked a contraction of the economy.
Table 3: Fiscal indicators in Japan from FY 2012 to FY 2015
Trillion
yen
Primary expenditure
(1)
Tax revenues
(1)
Government bond issues
(1)
Primary balance
(1)
Bond dependency ratio
(%) (1, 2)
National debt service
(% of major expenditures)
(1) 2012 68.4 42.3 44,2 -24,9 47,6% 21.9
2013 70.4 43.1 42,9 -23,2 46.3% 22.2
2014 72.6 50.0 41,3 -18 43% 23.3
2015 72.9 54.5 36,9 -13,4 38.3% 23.5
Source: Ministry of Finance, budget statistics.
Note: (1) FY 2012 to FY2014: initial budget figures, FY 2015: estimates; (2) % Government bond issues/ total general expenditures.
Although the amount of primary expenditure has increased since the Abe administration came into power, and has resulted in growth in the stock of public debt, tax revenues have also increased and have exceeded government bond issuances since FY 2013. Thus, the bond dependency ratio and primary balance deficit have diminished (Table 3). These figures are from initial budgets which do not include supplementary budgets or other administrations budget; however, they show that the Abe government has performed quite well in relation to the objectives of ending overreliance on government bond issuances to balance the central budget, and shrinking the primary deficit.
The fiscal consolidation plan Shinzo Abe inherited from the former government, involved two steps. The first step is aimed at halving the primary budget deficit28 to GDP from -6.6% to -3.3% between 2010 and 2015. The second is to turn this primary deficit into a surplus by 2020. The first objective is barely achievable in 2015, but Shinzo Abe has reaffirmed his commitment to achieving the second objective on time. However, some very efficient solutions will be needed to achieve this.
The efficiency of economic growth for boosting fiscal revenues is clear in the Cabinet Office projections published in February 2015. According to these forecasts, the primary budget deficit will reach JY9.4 trillion in 2020 with a 2% real economic growth rate, but would balloon
28
The primary budget deficit is the budget deficit less interest charges.

CEPII Working Paper Can the magic of Abenomics succeed?
22
to JY16.4 trillion were the GDP growth rate to fall to less than 1% in real terms.29 This is why growth is so important for reducing the budget deficit.
To achieve a primary budget surplus in 2020 will require either accelerated growth and/or additional measures such as budget spending cuts and tax increases, both of which could harm the economy. For example, the Japanese government increased VAT from 3% to 5% in April 1997 and cancelled some tax credits. These policies, along with the banking system crisis and the Asian financial crisis, resulted in a steep fall in the GDP real growth rate from +1.6% in 1997 to -2% in 199830. As the economy has been negatively impacted by the first sales tax hike in April 2014, the government will decide whether to introduce or postpone the second tax hike (from 7% to 10%) in April 2017, according to the economic situation. Thus a self sustained, strong private demand is needed, which should be helped by an efficient reform policy.
4. The importance of the third arrow
The third arrow, the “growth arrow”, should address the weaknesses in the industrial production system, at the company, country and international levels in order to create the conditions for enterprises to invest, innovate and raise wages, and to increase growth potential. Government's first task was to identify the economic weaknesses and the key strategic sectors, and elaborate and implement reforms
4.1. Targeting the weak points in the economy
Economic growth is based on labour input, capital investment, productivity and innovation. In Japan, these economic indicators began to deteriorate in the 1990s. First, Japan's labour force decreased by 2.16 million workers between 1998 and 2013. Second, private capital investment shrank 30% between 1991 and 2011. Third, private Research and Development (R&D) expenditure stagnated between 2000 and 2012, in contrast to the rapid progress in South Korea. In relation to productivity per capita, the gap with the US, which was 19% in 1991, rose to 30% in 2011.
The world share of Japanese merchandise exports slipped from 9.8% to 4.5% between 1993 and 2012 while China's increased from 2.8% to 11.3%. The decline in Japan's export share was due to two main factors. First, the share of Japanese manufacturing production abroad jumped from 6.4% to 20.3% between 1990 and 2013. At the end of the period, this share had reached very high levels in the transportation equipment (40.2%) and information and communication electronics equipment (28.3%) sectors, traditionally, Japan's major export sectors (METI, 1990-2013). Second, many Japanese enterprises lost competitiveness during the 1990s because of the high number of enterprises in the same sector, the lack of innovation, the strength of the yen, etc.
29
“Japan must maintain $21 B pace to hit surplus target: advisers”, Nikkei Asian Review, February 12th, 2015. 30
Calendar year
CEPII Working Paper Can the magic of Abenomics succeed?
23
Reversing this declining economic trend requires that public policies reforms address economic agents (enterprises, financial firms, public administrations and households), industrial structures (restructuration of ailing sectors, development of cutting edge technology sectors), and other areas (labour market, research, education and training, trade diplomacy). First and foremost, corporate profitability needs to be enhanced. Stimulating financial and capital markets is important to improve the environment for large enterprises. Second, human capital is one of the keys to future economic success. The labour supply must be increased, and must be highly educated and well trained. Third, the industry structure must be modernized by upgrading traditional sectors and boosting innovative sectors. This should increase per capita added value, and spur domestic as well as foreign demand. Fourth, increased foreign demand would be encouraged through implementation of the free trade agreements under negotiation, and introduction of the new economic diplomacy. This will involve the testing of deregulation within National Strategic Specific Zones. These measures constitute the core of the third arrow policy included in the first stage of Abenomics (Kantei, 2014/1).
Since its re-election as head of the ruling party in late September 2015, Shinzo Abe has promulgated the economic policies of the “new three arrows” that strengthen the former third arrow policy (Kantei, 2015/3).
4.2. Modernizing corporations
Although the profitability and return on equity of Japanese companies have been low for many years, Japanese shareholders are keen to see a stable long-term return from their investments. After the Japanese stock market crash in the 1990s, and the huge fall in most world stock markets due to the subprime crisis, Japanese investors have been wary of investing in high risk high return foreign equities, and foreign investors have been scarce on the Japanese stock market. The current profit to sales ratios of large manufacturing enterprises, after peaking at 5.75% in FY 1989 at the height of the speculative bubbles, fell to a low of 2.41% in 1993, then surged to 6.76% in 2006, and recorded a level below 5% in 2012 (Bank of Japan, 2015). According to the “Financial Statements Statistics of Corporations by Industry Quarterly” of the Ministry of Finance, the return on equity (ROE) on an all-industry basis, was about 8% in FY 1989, but had fallen to 2% by FY 2002 and it was below 6% in 2012. Although, the ROE of American listed companies was far higher than the ROE of Japanese firms in 2014 at respectively, 14.81% and 8.9% in the fourth quarter of 2014 (Ministry of Finance, 2015). This result shows that Japanese firms are progressing.
As long as Japan's savings stocks were high, there was no urgent need to attract foreign capital. However, things changed. Worldwide competition is stronger, the Japanese domestic market is more open and its financial system is deregulated. The low profitability of firms is affecting wages and impeding consumption. The rise in poorly-paid irregular workers31 and the rapidly ageing population, are also curbing the household savings rate. The trade
31
Irregular workers were accounting for 38% of the workforce in 2014.

CEPII Working Paper Can the magic of Abenomics succeed?
24
balance deficit has caused the current account balance surplus to diminish. So, Japan will be progressively more in need of foreign capital. This is one of the main reasons why the Abe government wants to reform taxation, governance, forms of business and the innovation system.
4.2.1. Lowering corporate tax
The Abe government plans gradually to reduce the effective corporate tax rate to increase companies’ profits. The corporate tax rate was reduced to 32.11% in 2015, after the abolition of the special corporation tax for reconstruction following the Great East Japan earthquake (-2.4% since April 2014) and the lowering of the corporate tax (-2.51% from April 2015). A further reduction of -3.29% from April 2016 is planned. In the next several years, the effective corporate tax rate will go down to 20% range, roughly the level of China (25%) and South Korea (24%) (Kantei, 2015). However, the most profitable firms in the US were subject to a corporate tax rate of approximately 40% in 2014. This suggests that a decrease in the corporate tax rate, on its own, will not solve Japanese firms’ profitability problems. The special tax system to promote investment dedicated to a productivity increase, launched in January 2014, might help, but, since the declining effective corporate tax rate will shorten budget resources, a tax reform including a broadening of the tax base is being discussed.
4.2.2. New governance
Reform to the governance of Japanese companies and institutions and management practices could contribute to increasing productivity and corporate value in the long run. A government initiative has introduced two new codes of governance: the Japanese Stewardship Code (JSC) and the Corporate Governance Code (CGC).
The JSC, published in February 2014, should enable institutional investors (asset managers, trust banks, insurers and pension funds) to deliver higher mid to long term returns for their investors and to engage more actively with company management. In addition, the Companies Act was revised in June 2014 to promote the appointment of external directors. According to the CGC, which came into effect in June 2015, listed companies are required to comply with the Code or to explain publicly why are not doing so (explanation of objective and rationale related to stock cross-holdings, information on nomination and remuneration of board members, nomination of no less than two independent outside directors). Adoption of the CGC might make Japanese listed companies more attractive to domestic and foreign investors. Concretely speaking, 197 institutional investors accepted the JSC from February 2014 to October 2015 and more than 2000 companies are applying the CGS (Kantei 2015/1, November).
Although good news for shareholders, it might be bad news for workers who may face payroll cuts and increased pressure to slow wage increases. It also does not guarantee more efficient long-term management since financial constraints are often short-term oriented.

CEPII Working Paper Can the magic of Abenomics succeed?
25
4.2.3. Energizing the financial and capital markets
Stimulating the financial and capital markets is also part of this third policy strand. The progressive unlocking of shareholder value in 2013 and 2014 has attracted foreign investors, making the stock exchange more active; at the same time, it has limited the scope of wage increases. In order to make the Japanese stock market more buoyant, a new kind of personal account - the NISA (Nippon Individual Savings Account) programme- has been launched. In December 2014, 8.3 million NISA accounts resulted in JY2.98 trillion in funds invested in the stock market.
The most prominent aspects of the reform to the management of public and quasi public funds are the revision of the assets mix policy and reinforcement of the governance structure of the Government Pension Investment Fund (GPIF) based on a reshuffle in the membership of the Investment Committee, the inclusion of more asset management experts, and the adoption of the Stewardship code (May 2014). The new GPIF portfolio will reduce the share of domestic bonds from 60% to 35%. The domestic and international stock share will jump from 12% to 25%. This boost to the stock market will improve companies’ valuations. The new investment policy on domestic equity involved the introduction of three new indices, including the JPX Nikkei 400 (January 2014). This should help to improve GPIF management since they take account not only of financial ratios but also governance progress.
4.2.4. Encouraging new forms of business
In Japan, new forms of business such as venture business are underdeveloped. As a result of the Competitiveness Enhancement Act, a tax system to promote venture funding in private enterprises was introduced in January 2014. Also, government is reviewing its procurement laws to promote recently launched small and medium sized start ups. The revision to the Financial Instrument and Exchange Act, in May 2014, has eased the development of crowd funding. The operational efficiency of the Angel investment tax system has also improved since the September 2013 reduction in the administrative burden.
Although during the first two years of Abe administration, RoE progressed more rapidly in Japan (+3.11%) than in Europe (+2.10%) or the US (+1.24%), Japanese enterprises' retained earnings continued to grow (64.4% of nominal GDP in FY 2012, 68.1% in FY 2013 and 72.2% in FY 2014). This result is explained by the reluctance to invest without a clear forecast of future demand, and a persistent deflation mindset. Higher expectations of inflation and more possibilities to create business should boost entrepreneurial investments (Kantei, 2015/2).
4.2.5. Boosting innovation
As worldwide competition intensifies and since the potential growth of the economy is very low and the population and workforce are declining, being an innovation leader is crucial for revitalizing economic growth and attracting foreign talent.
CEPII Working Paper Can the magic of Abenomics succeed?
26
At the organization level, in May 2014, government increased the Council for Science, Technology and Innovation's administrative power. The Council plays a central role in assessing Japan's key R&D sectors and allocating budget and human resources. In order to develop combinatory, cutting edge technologies, the cross ministerial “Strategic Innovation Program” (SIP) and the “Impulsing Paradigm Change through disruptive Technologies Program” (IMPACT) were established and financed by the 2013 supplementary budget and the 2014 budget.
Many other measures have been discussed such as strengthening the link between university and businesses for academics to win private companies' research projects, enabling researchers to hold concurrent posts in a university and an R&D institute, and reforming the employee invention system in order to incentivize employees and companies. There is a strong focus on the robotics sector. The “Robotic Revolution Initiative Council” is designing a five year plan aimed at doubling the size of the robotics market in the manufacturing sector, and multiplying by 20 the use of robots in the non-manufacturing sector. However, innovation and economic success relies on an upgrading to the size and quality of human capital.
4.3. Strengthening human capital
In the context of human capital, Japan's first challenge is to address the decline in the size of the workforce. In the mid 1990s, there were some 87 million workers, but this number could decrease to 55 million in 2050. As a short to middle term policy target, government is trying to encourage potential workers to join the labour market. It is targeting women, but also youth, elderly, long-term unemployed workers and foreign workers. In the long run, government will also promote measures to encourage women to join and to stay in the workforce while deciding to have children.
4.3.1. Womenomics
According to the OECD statistics for 201232, the female participation in Japan's labour force is 63.2%; which is 20% lower than males'. Although, higher than the OECD average (57.8%) and France (61.2%). It is vital for Japan to increase this rate to offset demographic decline. In 2012 to 2014, the number of working women increased by 750,000 and the participation rate of women aged 15 to 64 increased from 63.4% to 66%33. The labour force participation rate for the “25 to 34” and the “35 to 44” year old age groups increased respectively from 72.9% to 74.9% and 69.7% to 72.6%, flattening out the M shaped curve34. If the female labour
32
Labour Force Statistics 33
Source: Statistics Bureau, Labour Force Statistics, Japan. There is some discrepancies between OECD and Japan
LFS statistics. 34
The M shape of women labour force participation rate by age bracket describes the phenomenon of the plunging
participation of women when they have babies or small children, and return to work as their children get older.

CEPII Working Paper Can the magic of Abenomics succeed?
27
participation rate in Japan rises to match Swedish levels, this would mean 5.4 million more workers, equivalent to a yearly 1% increase over ten years.
In order for women to work, good childcare provision (enlarged capacities and operating hours) is needed. Second, women must be encouraged to continue their careers, and receive better public support to enable a good work life balance. At the end of 2014, 191 000 new childcare facilities had been opened, but the 2018 objective is 400 000 in order to satisfy waiting lists. This objective will be upgraded in the future as the new policies of Shinzo Abe include the support of child-rearing. They also include the elder care problem as it has negative impact on the labour force participation rate. In 2011, 13.4% of men aged 40-64 and 27.6% of women had quit their jobs to take care of parents.
Apart from the difficulties involved in combining motherhood and work, career advancement for women in Japanese companies is poor and acts a strong disincentive to women to keep on working. According to Japanese government statistics for 2012, less than 7% of women were in management positions compared to between 30% and 40% in Europe and the US. The Abe government has set the target of 30% of women in management positions by 2020. Companies are encouraged to publicize the promotion of women on the Cabinet Office website. Listed companies have been pledged to appoint at least one female director and are obliged to specify the percentage of women in executive posts in the Annual Securities Report (March 2015). A new legal framework for the participation and advancement of women has been submitted to the Diet (the Japanese parliament). In the public sector, female government officials (chief of bureau or higher) almost doubled before and after the 2014 summer personnel reshuffle.
In concrete terms, the percentage of women in management positions increased from 6.9% in June 2012 to 8.3% in June 2014. Japanese companies traditionally rewarded long working hours and ran a seniority system which did not favour the promotion of women. Government is pushing for more flexible and diverse ways of working, and valuing outcomes rather than time spent. The scope of the “discretionary working system” that has been introduced as a flexible working hours system needs to be extended. By supporting a new work life balance, securing enough childcare centres, expanding child care leave benefits (50% to 67% of salary prior to the start of leave for the initial 6 months from April 2015), encouraging parental leave for men, designing a new tax system which becomes neutral if the spouse works, and raising women's income through better promotion, government might encourage young couples to have more children and slow the population decline.
Among the three new policy goals of Shinzo Abe’s second term35, announced in late September 2015, the goal of achieving the “desirable birth rate of 1.8”, instead of the current low rate of 1.4, in order to keep the population above 100 million in the 50 years to come, has been set. It includes the support of child-rearing and lightening the burden of child for
35
Shinzo Abe has been re-elected in late September 2015 as head of Liberal Democratic Party

CEPII Working Paper Can the magic of Abenomics succeed?
28
struggling families (single parents …). The elder care problem is also addressed as it has negative impact on the labour force participation rate of women (Kantei, 2015/4).
4.3.2. Youth, elderly and foreign workers
The promotion of active social participation is not restricted to women; it also includes young and elderly people. For young people, comprehensive employment measures cover preparatory stages for finding employment, job-seeking activity and post hiring career development through better vocational education and training opportunities. Young people and other human resources should be trained in areas where there are labour shortages (medical care, welfare, construction, manufacturing and transport). In relation to the older segment of society, government must encourage companies to employ people aged over 65. It should create an environment where the elderly can work in their local area or in other areas in need of manpower. Tax credits and subsidies should be provided.
Therefore, a more flexible policy of selective immigration has been launched. Some rules are being relaxed or adjusted. To fill the labour shortages in sectors such as construction or nursing, admission quota and training period of are to be increased. The Technical Intern training Programme bill will strengthen the management and supervisory structures, expand the job categories covered by the system, extend the period of training for foreigners from three to five years, and expand admissions quotas. More foreign workers are being accepted in Japanese overseas manufacturing subsidiaries.
Efforts are being made to attract highly skilled foreign professionals by relaxing the work requirements (since December 2013) and introducing a new type of residency status with an unlimited period of stay (since April 2015).There is goal of doubling foreign workers in the IT sector, from 30,000 to 60,000 by 2020. Nevertheless, progress is still limited.
4.4. Deregulations for new growth drivers
Apart from upgrading capital efficiency, a very important part of the third arrow of Abenomics is the creation of new growth engines which consist of modernizing traditional sectors such as agriculture, electricity and healthcare, and developing new ones such as robotics, electronics and medicine. This could lead to a complete overhaul of the Japanese industrial structure similar to those implemented during the 1960s. It will require numerous new laws, and much deregulation some of which will be tested in the National Strategic Special Zones (NSSZ) before nationwide implementation.
4.4.1. Modernizing traditional sectors
The economic structure of Japan has long been characterized by a huge disparity in productivity between economic sectors. Although, export sectors have been highly competitive; agriculture, services and some domestic oriented industry sectors have
CEPII Working Paper Can the magic of Abenomics succeed?
29
registered low productivity rates on average. The productivity gap is the result mostly of the social choices made by the Japanese. Social cohesion through low unemployment and small regional disparities was a priority after the end of WWII, and involved a host of regulations to protect agriculture, small businesses and craft industries. This policy, which enabled the redistribution of wealth, has been very efficient electorally for the dominant LDP, as long as economic growth was dynamic, the domestic market was closed, the workforce was abundant, finance was strictly regulated and low productivity sectors could survive. However, globalization and a shrinking population have wrought changes. Now, modernizing traditional sectors is a priority, with agriculture, electricity and healthcare the three main targets.
4.4.1.1 The rebirth of agriculture
In depth reform of the agriculture sector was a taboo for around 60 years since rural conservative votes were crucial for the LDP to stay in power, and food self-sufficiency was on the agenda. Shinzo Abe has a historic opportunity to make reforms for three main reasons.
First, the long power of the Japan Agriculture (JA) cooperative, a farm lobby and a conservative vote-getting machine, has lost its influence because the 1994 electoral reforms rebalanced district representatives in favour of urban areas and the farmers votes have become more diverse. Second, the food self sufficiency ratio, which was above 70% until 1965, has decreased to around 40% since 1997. Although the goal of the agricultural ministry up to the beginning of 2015 was to achieve 50% by 2020, this is unrealistic - especially if the Transpacific Partnership (TPP) forces the Japanese government to lower tariff rates and open its market further. The new basic plan for food, agriculture and rural areas for the next ten years, approved by the Cabinet in March 2015 , has reduced the self sufficiency ratio goal to 45% in 2025, and redesigned the agricultural policy orientation (increase in rice feed production, support for large and professional farmers to improve farm efficiency) (USDA Foreign Agricultural service, 2015). Third, the average age of farmers was 66 in 2011. Much agricultural land is not cultivated and the overall value of production is declining.
The major aspects of the agricultural reform are as follows. In order to use farmland efficiently and to ensure that 80% of all farmland in Japan will be used by the next generation of farmers over the next ten years, each prefecture has established an intermediary institution, the “Farmland bank”, to manage farmland and consolidate fragmented farmland ownership (June 2014). To achieve more effective use of farmland, Agricultural Committee members will be selected by the mayor instead of being elected by regional farmers (August 2015).36 This is the first reform to these committees for 60 years. Government wants to reduce drastically the power of the Central Union of Agricultural Cooperatives (JA Zenshu) which relies upon its authority to supervise and audit agricultural cooperatives and ensure uniform standards throughout Japan. By March 2019, JA Zenshu will be a general
36
Act enacted in August 2015.

CEPII Working Paper Can the magic of Abenomics succeed?
30
incorporated association, and cooperatives will be able to choose independent accountants to be audited. However, JA Zenshu will keep responsibilities for representing regional agricultural cooperatives, and for coordination (Kantei, 2015/3).
More generally, reform of the cooperatives system is aimed at boosting entrepreneurship and attracting new market entrants.37 Government is also pushing for an easing of the requirements to establish agricultural production corporations. A rice production adjustment programme is planned. To develop international markets, category specific export organizations are being created. A first positive step was registered in 2014 and the beginning of 2015 with record exports by the agricultural sector.
4.4.1.2 Restructuring the energy market
The Abe government has initiated the first comprehensive electricity and gas market reform in 60 years. Prior to the November 2013 revision to the electricity law, the fundamental structure of the Japanese electricity sector implemented in 1951 remained unchanged with 1038 regional, privately owned and privately managed general electricity utilities producing and supplying electricity to each region. The grid frequencies differed between eastern and western Japan, respectively 50Hz and 60Hz.
The nuclear accident at Fukushima in 2011 led to the progressive shut down of all Japan's nuclear power plants, which caused power shortages in some regions that could have been eased had the regional transmission capacities been higher. The increased cost and unstable supply of electricity impeded the management of the electricity companies and reduced their opportunities to make a profit. Thus, overall reform was considered necessary to lower electricity prices and establish an electricity system that would guarantee stable power supply. Since most general electricity utilities were losing money due to idle nuclear power plants and huge energy raw material imports, they were not averse to a reform.
A three stage reform was announced in 2013. The first stage involved the establishment of a national electricity distribution network. A nationwide grid management body - the Organization for Cross-regional Coordination of Transmission Operators- was created in April 2015 to coordinate power supply and demand across the country in a stable manner. The second stage involves complete liberalization of the retail electricity sector (planned for April 2016). The third stage will be the legal separation of electricity generators and electricity distributors (April 2020)39 and the abolition of retail price regulation (to be undertaken after April 2020). The retail electricity business is already attracting new entrants. A similar reform of the gas market is going ahead involving deregulation and full liberalization of the retail
37
Act enacted in August 2015. 38
Hokkaido, Tohoku, Tokyo, Chubu, Hokuriku, Kansai, Chugoku, Shikoku and Kyushu Electric Power Companies. Okinawa Electric Power Company joined these 9 members after the return of Okinawa to Japan in 1972. 39
Act enacted in June 2015
CEPII Working Paper Can the magic of Abenomics succeed?
31
market expected by 2017, and legal unbundling of the gas infrastructure of 3 major gas companies by 202240 (Kantei, 2015/1)
4.4.1.3 Change to the healthcare sector
Japan's rapidly ageing population is giving primacy to a secure and sustainable social security system. Reform of the healthcare industry and its related services is aimed at making the sector more efficient and more innovative and upgrading service quality. Various initiatives, such as authorization of online sales of non-prescription drugs, the May 2014 Law for the creation of a control tower for medical R&D,41 measures to accelerate the commercialization of regenerative medecine (November 2014), have been put in place. Already, several Japanese and foreign firm are investing or considering investing in the regenerative medicine sector. Acts to create a new health system combining the presently separate insured and uninsured medical services42, and promote business alliances through a new healthcare care corporation system43 have been enacted.
4.4.2. National strategic special zones
The initiative to create National Strategic Special Zones (NSSZ) is aimed at enhancing Japan's international competitiveness through reform and bold deregulation in these zones. The NSSZ are supposed to test deregulation and to foster innovation, but also to support regional economic growth and act as models for other areas. Similar special zones were established by the Koizumi government in 2003, and the Democratic Party of Japan in 2011 (Sumitomo Mitsui Asset Management, 2014). However, the proposed NSSZ are different in that they are led by the Prime Minister and result from close discussions with the relevant local governments and the private sector rather than being limited forms of deregulation based on requests from the private sector. In December 2014, six special zones plans had been approved and three new ones were identified in March 2015 (Annex Table).
The reforms in NSSZs are focussed on strategic sectors such as agriculture, medicine, tourism and advanced technologies. They include support for new forms of business, attracting of foreign companies, and reforms to education and employment. Some are also dedicated to enhancing the human resources and the role of women. The three new NSSZ were created by government to boost the local economies and tackle population decline. Several new procedures and structures have been approved for these zones, but it is too early to try to evaluate any outcomes. Attracting foreign business is an important aspect of the NSSZs. In the long run, Shinzo Abe's goals include to attracting more FDI nationwide and improving Japan's integration into global trade.
40
The Act for the gas market reform was enacted in June 2015 41
Headquarters for Healthcare and Medical Strategy Promotion and Japanese National Institutes of Health. 42
Act enacted May 2015 43
Act enacted in September 2015

CEPII Working Paper Can the magic of Abenomics succeed?
32
4.5. Global economic integration
Despite its 8% share of world GDP in 2013, Japan’s weight in international export and import markets is low, respectively 3.9% and 4.5% in 2013. Japan has been at a disadvantage compared to many of its foreign competitors. It was a latecomer to the bilateral free trade agreements negotiations since, up to 2002, its trade policy was aligned to the World Trade Organization principle of multilateral trade agreements. Also, in 2013, Japanese outward FDI stock accounted for only 20.3% of its GDP compared to a world average of 35.7% and a level in France of 59.8%. Japan's inward FDI stock level was even smaller, accounting for 3.5% of its GDP versus a world average of 49.4% and a level 39.5% in France. Shinzo Abe considered this low global economic integration of Japan to be a negative factor for a growth dynamic. Thus, his government has decided to facilitate the internationalization of Japanese companies through the expansion of Economic Partnership Agreements (EPAs), and the signing of investment agreements and tax treaties. Promotion of inward foreign investment is also a high priority.
4.5.1. Economic Partnership Agreements as trade and domestic policy tools
Although 13 EPA had been signed by December 2012, and 7 more were under negotiation, Shinzo Abe has underlined their importance with his decision to join the Transpacific Partnership (TPP) negotiations, to promote the EU-Japan economic partnership and the Regional Comprehensive Economic Partnership (RCEP) with its Asian neighbours, continuing participation in the Japan, China, Korea partnership negotiations, proposing an EPA with Turkey and signing an EPAs with Australia (July 2014) and Mongolia (February 2015). If all EPA under negotiations are concluded satisfactorily, the proportion of Japan's trade covered by free trade agreements will exceed 80%.
There are three main objectives underlying this very activist Free Trade Agreement (FTA) policy: expanding Japanese exporting companies' market share or positioning them equally with foreign companies covered by FTAs in relation to customs duties and non tariff barriers, speeding up domestic deregulation, and attracting foreign investments in Japan. The objective is to expand the amount of trade covered by FTA agreements from 19% in 2013 to 70% in 2018. In relation to the TPP, crucial political and geopolitical aspects are at stake. This economic partnership, which gathers 12 Pacific Rim countries, excludes China and South Korea. Since China is becoming very assertive in Asia, and since China is in a position to fix the new economic rules for the Asian regions based on its economic size and leadership of the “Asian Infrastructure Investment Bank”44, successful TPPs would enable the US and Japan to design the rules and norms in Asia and constrain China’s dominance. The TPP trade pact was signed last October 2015 by 12 participating Pacific Rim nations but it has to be ratified by each countries congress or parliament. The future of the TPP remains uncertain.
44
A framework agreement was signed in Beijing on 29 June, 2015.
CEPII Working Paper Can the magic of Abenomics succeed?
33
5. Conclusion: Still a long way to go...
The magic of Abenomics worked relatively well during FY 2013. Renewed faith in a brighter future has stimulated markets and households. The first step of a progressive exit from deflation has been achieved and GDP growth has accelerated. However, the VAT increase in April 2014, derailed economic growth and core CPI began to decline from June 2014, due mostly to the fall in energy prices, partially to weak household consumption. Core CPI continued to decline and turned slightly negative in October 2015 because of oil price fall and China economic slowdown. Nevertheless, the uptrend of the core core CPI index from March to October 2015 could be a hint that a moderate inflationary pressure is building up in the Japanese economy. Achieving BoJ's 2% inflation target by second half FY 201645 will not be easy. However, provided that long-term inflation expectations remain quite steady, the target could be postponed, and the lower inflation rate would boost household consumption.
Over the short term, a fragile economic recovery is forecast for FY 2015 and 2016, but if the planned VAT increase to 10% is implemented in 2017, real GDP could register 0% growth rate according to December 2015 forecasts (The Japan Research Institute, 2015). The government 2% real GDP growth target is still too high to be maintained steadily in an unstable global environment (decline in world trade, economic slowdown of China, oil price drop...) and difficult domestic conditions (declining demography, ballooning debt, reluctance of enterprises to raise basic wage and hire regular workers and to invest...). A longer time span is needed for the structural reforms to have a sizeable positive impact on economy. Nevertheless, annual nominal GDP growth rates have fared better during Abenomics (between FY2012 and FY2015) than a decade earlier (2002-2012FYs) with, respectively, +1.9% and -0.5%. The same applies to annual real GDP with, respectively, +0.7% and +0.01%.
To date, the targets of 2% inflation and 2% real GDP growth have been missed. Nevertheless, this does not mean that Abenomics has failed despite various editorials and articles in Anglo-Saxon press (Sender, 2015).
Abenomics has already achieved some brilliant results. The number of employees has increased 1 million from December 2012 to September 2015, the 3.1% unemployment rate in October 2015 is the lowest since August 1995, the number of corporate bankruptcies in October 2015 is the lowest for the month in 25 years; the jobs to applicant ratio of 1.24 in October 2015 is the highest in 23 years; the 2.2% average wage increase for FY 2015 is the highest in 17 years, corporate profit has strongly increased as well as stock prices and corporate governance is improving... However, these results are fragile and need to be backed by strong demand in the future.
For Abenomics to work properly, Shinzo Abe needs time since the self sustained recovery he dreams of will require the implementation of the deep reforms of the third arrow. The
45 September 2016 to March 2017.

CEPII Working Paper Can the magic of Abenomics succeed?
34
important growth reforms in agriculture, energy and health need five to ten years for their effects to ripple down into the economy. All these changes require lengthy and time consuming legal procedures. Even more difficult will be the cultural revolution due to reforms to finance, innovation, inclusion in the labour market of women, foreign workers, youth and the elderly, and the introduction of more flexible working patterns. The goal of raising the fertility rate to 1.8 from the current 1.4 is also a difficult and long term challenge.
Some quite remarkable achievements have been recorded already in these structural reforms. For example, as a result of the 2013 amendment to the Agricultural Land Act, the process of regeneration of idle farmland has been eased. Japan’s powerful farm lobby has accepted government's plan to revise the nation’s Agricultural Cooperative Law, which will weaken its influence on the farming industry. The concrete outcomes of the 2013 and 2014 Amended Electricity Business Act are the establishment of the Organization for Cross-regional Coordination of Transmission Operators (April 2015) and the implementation of a framework for full retail competition to be enforced in April 2016. Full reform is expected to be completed by 2020 for electricity and 2022 for gas. In the health sector, the Japan Agency for Medical Research and Development, designed to fast-track medical R&D, has been established (April 2015). A Stewardship Code for institutional investors and a Governance Code for listed companies is already applied in many enterprises. The new asset mix policy for the giant Government Pension Investment Fund was adopted in October 2014. More women are working, and it is easier for foreign workers to work in Japan. On the fiscal front, budget consolidation is progressing.
The magic of Abenomics can work provided that Shinzo Abe stays in power long enough to see most his reforms reach the decision stage. As he has been re-elected as head of the Liberal Democratic Party on September 2015, he has – at best – less than three years to implement his programme of economic revival. Time is ticking away…
Self sustained growth is the central goal of Abenomics, but to achieve it requires enterprises to use their cash reserve, of roughly 350 trillion yen in 2014, for raising wages and investing. Restoring the confidence of the enterprises in future demand prospects is one of the task that Shinzo Abe has to complete. Strong exports would help the Prime Minister's cause by boosting growth, but since world trade is very unstable and Chinese economy is slowing down, there is no guarantee that Japanese exports will be strong in the future. Abenomics has a long way to go for its magic to work...and its successors could bear the fruit of this policy if they continue enacting Abe’s reforms.

CEPII Working Paper Can the magic of Abenomics succeed?
35
ANNEX
National Strategic Special Zones
Zones selected Example of reforms and policy draft
Yabu, Hyogo Pref.
Center for agricultural reform in hilly
and mountainous areas
- Transfer of farmland already managed by Yabu
City Mayor and not Agricultural committees
- Private companies will produce and process
crops and provide accommodation for tourists
Fukuoka city
Center for employment system reform
for business creation
- Creation of a Consultation Center for
employment to support start ups
- Promotion of events to attract tourists and
business
Kansai area
Center for innovation on medical care,
entrepreneurial support
- Shorter procedures for advanced medical
treatment already used in other countries
- Increased number of hospital beds
Tokyo area
International business and innovation
hub
- Creation of Employment and Labour Counselling
Center for start ups and foreign companies
Niigata city
Center for agricultural reform in large
scale farming
- Private company will be able to grow crops
including rice and open restaurants
- Part of transfer of farmland procedures managed
by Niigata City mayor.
Okinawa Pref.
Center for international sight seeing
New zones selected
Senboku city, Akita Pref.
Center for the reform for agriculture
and Forestry/medical tourism
- Private sector utilizes national forest (grazing,
demonstration of drones...)
- Foreign doctors at tourists sites
Sendai city, Miyagi Pref.
Center for the reform for women’s
active social participation and start-
ups
- Acceleration of start-ups procedures
- Additional qualification exam for nursery
teachers in designated areas to promote start-ups
(women, young people and seniors)
- Future technology development
Aichi Pref.
Center for the general reform of
education, employment, agriculture for
fostering industry leaders
- Foster human resources for industries, using
public schools run by private sector
- Promote transfer of farmland, utilization of
abandoned farmland (reforms on the agricultural
committee
Source: The Government of Japan, various issues, 2014 and 2015.
CEPII Working Paper Can the magic of Abenomics succeed?
36
References
AMITY M., ITSKHSKI O. AND KONNINGS J., 2014, Why Hasn’t the yen Depreciation Spurred Japanese Exports?, The Federal Reserve Bank of New York, Liberty Street Economics, July.
BANK OF JAPAN, 2015, Tankan survey, April 1st.
BANK OF JAPAN, 2014, Expansion of the Quantitative and Qualitative Monetary Easing, October 31, http://www.boj.or.jp/en/announcements/release_2014/k141031a.pdf
BANK OF JAPAN, 2015, Tankan survey, various issues.
BRUTEN G., 2015, BOJ’s new inflation measure reveals more than just numbers, Economic Perspectives, Japan, Alliance Bernstein, July 24, https://web.alliancebernstein.com/Instrumentation/Economic-Weeklies/EconPerspectives_20150724_JAPAN.pdf
CABINET OFFICE, 2015, Economic and Fiscal Projections for Medium to Long Term Analysis, February
CABINET OFFICE, 2014, Comprehensive Strategy on Science, Technology and Innovation 2014, Bureau of Science, Technology and Innovation Cabinet Office, 24 June, http://www8.cao.go.jp/cstp/english/doc/cssti2014-01.pdf
DOURILLE-FEER E., 2014/2, « Les paradoxes de la dette publiques Japonaise » in Dettes publiques en zone Euro: Enseignements de l’histoire et stratégie pour l’avenir, Rapport CDC, juillet, http://www.caissedesdepots.fr/fileadmin/PDF/Rapports_et_etudes/finance/rapport_final_dettes_publiques_2013_2014.pdf
DOURILLE-FEER E., 2014, « L’économie du Japon », Collection Repères, La Découverte
DOURILLE-FEER E., 2010, Can the Democratic Party Implement a New Economic Policy?, La Lettre du CEPII N°301, September.
DOURILLE-FEER E, 2007, Le vieillissement porteur de dynamique d’innovation au Japon ?, CAS, La Note de Veille n°77, 15 octobre http://archives.strategie.gouv.fr/cas/system/files/noteveille77.pdf
HAUSMAN J. K., WIELAND J. F, 2014, Abenomics: Preliminary Analysis and Outlook, Brookings Economic Studies, March 20-21.
KAMADA K; NAKAJIMA J., and NISHIGUCHI S., Are household inflation expectations anchored in Japan? , Bank of Japan Working Paper Series, No.15-E-8, July 2015.

CEPII Working Paper Can the magic of Abenomics succeed?
37
KANTEI, 2015/4, Japan revitalization strategy revised in 2015, Main achievement to date and further reforms, October.
KANTEI, 2015/3, Urgent Policies to Realize a Society in Which All Citizens are Dynamically Engaged
http://japan.kantei.go.jp/97_abe/Documents/2015/__icsFiles/afieldfile/2015/11/27/urgentpolicies_20151126.pdf
KANTEI, 2015/2, Japan Revitalization Strategy: Main achievement to date and further reforms, June.
KANTEI, 2013, 2014/3, 2015/1, Abenomics is progressing (various issues).
KANTEI, 2014/2, Japan revitalization strategy, revised in 2014 Japan’s challenge for the future, June 24, http://www.kantei.go.jp/jp/singi/keizaisaisei/pdf/honbunEN.pdf
KANTEI, 2014/1, Revision of Japan revitalization strategy, 10 Key Reforms, June 1, http://www.kantei.go.jp/jp/singi/keizaisaisei/pdf/10challenge02shousaiEN.pdf
KRUGMAN P., 2014, Apologizing to Japan, Economist view, October 31, http://economistsview.typepad.com/economistsview/2014/10/paul-krugman-apologizing-to-japan-.html
MC BRIDE J., XU B., 2015, Abenomics and the Japanese Economy, CFR Backgrounders, March 10.
METI, Basic Survey on Overseas Business Activities, 1990-2013.
MINISTRY OF FINANCE OF JAPAN, 2015, Update on the Japanese Economy and Reform Policy Measures, Mimeo, January.
NAKAJIMA ATSUSHI, 2014, Japan is outperforming many others in exports : its trade balance remains in deficit, but the weaker yen is having a significant impact, RIETI http://www.rieti.go.jp/en/papers/contribution/nakajima/28.html
NAKATA D., 2012, How Should Japan Address Socio-economic Inequality and Poverty? RIETI columns, September 11, http://www.rieti.go.jp/en/columns/a01_0353.html.
OECD, 2015, Economic outlook 97 database, June.
OECD, 2008, Growing Unequal? Income Distribution and Poverty, OECD Countries, Country Note: Japan.
OZEKI K., 2008, « Responding to Financial Crises: Lessons to Learn from Japan’s Experience », Japan, credit perspective, PIMCO.
CEPII Working Paper Can the magic of Abenomics succeed?
38
RUBINSTEIN M., 2008, « Quels enseignements tirer de la crise financière japonaise pour la crise actuelle ? », Université Paris 13, Miméo, http://www.univ-paris13.fr/cepn/IMG/pdf/texte_rubinstein_081208.pdf.
The Japan Research Institute, 2015, Monthly Report of Prospects for Japan's Economy, December 4 (in Japanese), http://www.jri.co.jp/MediaLibrary/file/report/japan/pdf/8564.pdf
YOHEI MATSUO, 2014, Changed economy helping BOJ attain price goal, Nikkei Asian Review, July 29.
SCHULZ M., 2015, Debt and Growth Crises in Ageing Societies Japan and Italy, Fujitsu Kenkyu Report n°423, April.
SENDER H., 2015, “Abenomics has failed due to lack of Japanese economic innovation”, Financial Times, April 8.
STIGLITZ J. E., 2013, Japan Is a Model, Not a Cautionary Tale, New York Times, June 9, http://opinionator.blogs.nytimes.com/2013/06/09/japan-is-a-model-not-a-cautionary-tale/?_r=0
SUMITOMO MITSUI ASSET MANAGEMENT, 2014, Japanese « National Strategic Special Zones », October 21.
SZCERBOWICZ U., 2013, La Banque du Japon : a-t-elle raison de changer de stratégie ?, Blog du CEPII, March 25.
TAKITA YOICHI, 2015, Picketty’s formula may lead to another answer for Abe government, Nikkei Asian Review, February 9.
Editorials, 2014, Focus less on food self-sufficiency, The Japan Times, August 20.
USDA Foreign Agricultural service, 2015, Japan's Basic Plan for Food Agriculture and Rural Areas http://gain.fas.usda.gov/Recent%20GAIN%20Publications/Japan's%20Basic%20Plan%20for%20Food%20Agriculture%20and%20Rural%20Areas_Tokyo_Japan_4-10-2015.pdf